Pay vs Performance Disclosure
Dec. 31, 2024
USD ($)
$ / shares
Dec. 31, 2023
USD ($)
$ / shares
Dec. 31, 2022
USD ($)
$ / shares
Dec. 31, 2021
USD ($)
$ / shares
Dec. 31, 2020
USD ($)
$ / shares
Year 1 | Summary Compensation Table Total for PEO 2 ($) | Compensation Actually Paid to PEO 3 ($) | Average Summary Compensation Table Total for Non-PEO NEOs 2 ($) | Average Compensation Actually Paid to Non-PEO NEOs 4 ($) | Value of Initial Fixed $100 Investment Based On: 5 | Net Income ($) | Adjusted Earnings per Share 7 ($) | |||||||||||||||||||||||||
| Total Shareholder Return ($) | Peer Group Total Shareholder Return 6 ($) | |||||||||||||||||||||||||||||||
| (a) | (b) | (c) | (d) | (e) | (f) | (g) | (h) | (i) | ||||||||||||||||||||||||
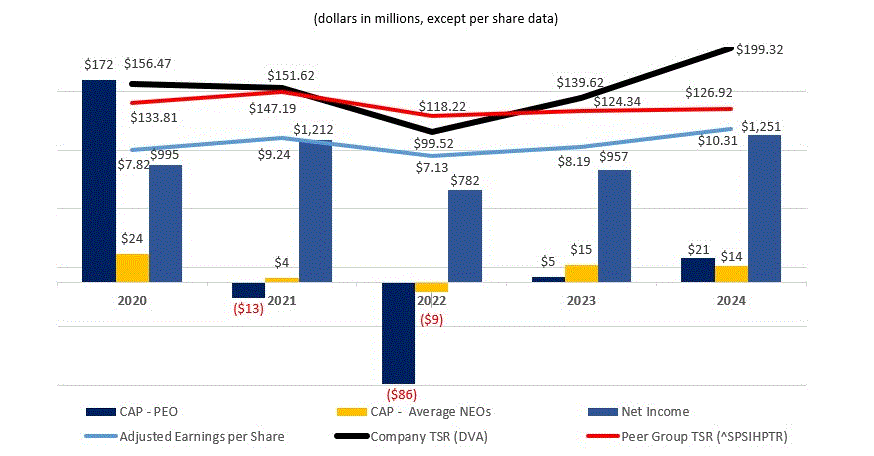
| 2024 | 21,807,489 | 20,569,084 | 5,314,871 | 13,647,050 | 199.32 | 126.92 | 1,250,737,000 | 10.69 | ||||||||||||||||||||||||
| 2023 | 6,712,328 | 4,811,039 | 6,408,000 | 14,576,297 | 139.62 | 124.34 | 956,978,000 | 8.19 | ||||||||||||||||||||||||
| 2022 | 2,984,581 | (86,403,681) | 4,203,738 | (8,601,804) | 99.52 | 118.22 | 781,643,000 | 7.13 | ||||||||||||||||||||||||
| 2021 | 3,298,439 | (13,076,235) | 4,262,738 | 3,784,342 | 151.62 | 147.19 | 1,211,762,000 | 9.24 | ||||||||||||||||||||||||
| 2020 | 73,432,365 | 171,946,681 | 6,453,315 | 8 | 23,928,014 | 8 | 156.47 | 133.81 | 994,677,000 | 7.82 | ||||||||||||||||||||||
1.Javier J. Rodriguez served as the Company’s principal PEO for the entirety of 2024, 2023, 2022, 2021 and 2020 and the Company’s other NEOs for the applicable years were as follows:
–2024: Joel Ackerman; David P. Maughan; Kathleen A. Waters; James O. Hearty; and Michael D. Staffieri.
–2023: Joel Ackerman; Michael D. Staffieri; Kathleen A. Waters; and James O. Hearty.
–2022: Joel Ackerman; Michael D. Staffieri; Kathleen A. Waters; and James O. Hearty.
–2021: Joel Ackerman; Michael D. Staffieri; Kathleen A. Waters; and James O. Hearty.
–2020: Kent J. Thiry; Joel Ackerman; Michael D. Staffieri; Kathleen A. Waters; and James O. Hearty.
2.Amounts reported in this column represent (i) the total compensation reported in the Summary Compensation Table for the applicable year in the case of Mr. Rodriguez and (ii) the average of the total compensation reported in the Summary Compensation Table for the applicable year for the Company’s NEOs for the applicable year other than the PEO for such years.
3.Amounts reported in this column are calculated per the SEC disclosure rules to represent the compensation actually paid to Mr. Rodriguez as the Company’s PEO in the indicated fiscal years, based on his total compensation reported in the Summary Compensation Table for the indicated fiscal years and adjusted as shown in the table below:
| PEO | |||||||||||||||||
| 2024 | 2023 | 2022 | 2021 | 2020 | |||||||||||||
| Summary Compensation Table - Total Compensation(a) | $ | 21,807,489 | $ | 6,712,328 | $ | 2,984,581 | $ | 3,298,439 | $ | 73,432,365 | |||||||
| - Grant Date Fair Value of Stock Awards and Option Awards Granted in Fiscal Year(b) | $ | (15,849,833) | $ | — | $ | — | $ | — | $ | (68,496,958) | |||||||
| + Fair Value at Fiscal Year-End of Outstanding and Unvested Stock Awards and Option Awards Granted in Fiscal Year(c) | $ | 14,611,428 | $ | — | $ | — | $ | — | $ | 146,273,000 | |||||||
| + Change in Fair Value of Outstanding and Unvested Stock Awards and Option Awards Granted in Prior Fiscal Years(d) | $ | — | $ | — | $ | (43,928,697) | $ | (17,202,972) | $ | 20,182,219 | |||||||
| + Fair Value at Vesting of Stock Awards and Option Awards Granted in Fiscal Year That Vested During Fiscal Year(e) | $ | — | $ | — | $ | — | $ | — | $ | — | |||||||
| + Change in Fair Value as of Vesting Date of Stock Awards and Option Awards Granted in Prior Fiscal Years For Which Applicable Vesting Conditions Were Satisfied During Fiscal Year(f) | $ | — | $ | (1,901,289) | $ | (45,459,565) | $ | 828,298 | $ | 556,055 | |||||||
| - Fair Value as of Prior Fiscal Year-End of Stock Awards and Option Awards Granted in Prior Fiscal Years That Failed to Meet Applicable Vesting Conditions During Fiscal Year(g) | $ | — | $ | — | $ | — | $ | — | $ | — | |||||||
| = Compensation Actually Paid | $ | 20,569,084 | $ | 4,811,039 | $ | (86,403,681) | $ | (13,076,235) | $ | 171,946,681 | |||||||
(a)Represents Total Compensation as reported in the Summary Compensation Table for the indicated fiscal year.
(b)Represents the aggregate grant date fair value of the stock awards and option awards granted to Mr. Rodriguez during the indicated fiscal year, computed in accordance with FASB ASC 718.
(c)Represents the aggregate fair value as of the indicated fiscal year-end of Mr. Rodriguez’s outstanding and unvested stock awards and option awards granted during such fiscal year, computed in accordance with FASB ASC 718 and, for awards subject to performance-
based vesting conditions, based on the probable outcome of such performance-based vesting conditions as of the last day of the fiscal year.
(d)Represents the aggregate change in fair value during the indicated fiscal year of the outstanding and unvested stock awards and option awards held by Mr. Rodriguez as of the last day of the indicated fiscal year, computed in accordance with FASB ASC 718 and, for awards subject to performance-based vesting conditions, based on the probable outcome of such performance-based vesting conditions as of the last day of the fiscal year.
(e)Represents the aggregate fair value at vesting of the stock awards and option awards that were granted to Mr. Rodriguez and vested during the indicated fiscal year, computed in accordance with FASB ASC 718.
(f)Represents the aggregate change in fair value, measured from the prior fiscal year-end to the vesting date, of each stock award and option award held by Mr. Rodriguez that was granted in a prior fiscal year, and which vested during the indicated fiscal year, computed in accordance with FASB ASC 718.
(g)Represents the aggregate fair value as of the last day of the prior fiscal year of Mr. Rodriguez’s stock awards and option awards that were granted in a prior fiscal year and which failed to meet the applicable vesting conditions in the indicated fiscal year, computed in accordance with FASB ASC 718.
4.Amounts reported in this column represent the compensation actually paid to the Company’s NEOs other than Mr. Rodriguez in the indicated fiscal year, as calculated per the SEC disclosure rules based on the average total compensation for such NEOs reported in the Summary Compensation Table for the indicated fiscal year and adjusted as shown in the table below:
| Other NEOs Average (a) | |||||||||||||||||
| 2024 | 2023 | 2022 | 2021 | 2020 | |||||||||||||
| Summary Compensation Table - Total Compensation(b) | $ | 5,314,871 | $ | 6,408,000 | $ | 4,203,738 | $ | 4,262,738 | $ | 6,453,315 | |||||||
| - Grant Date Fair Value of Stock Awards and Option Awards Granted in Fiscal Year(c) | $ | (3,122,225) | $ | (4,338,381) | $ | (3,030,532) | $ | (2,869,513) | $ | (2,304,672) | |||||||
| + Fair Value at Fiscal Year-End of Outstanding and Unvested Stock Awards and Option Awards Granted in Fiscal Year(d) | $ | 3,442,135 | $ | 8,695,914 | $ | 1,700,247 | $ | 3,485,674 | $ | 5,651,914 | |||||||
| + Change in Fair Value of Outstanding and Unvested Stock Awards and Option Awards Granted in Prior Fiscal Years(e) | $ | 6,440,252 | $ | 2,184,874 | $ | (9,833,754) | $ | (1,612,646) | $ | 11,383,596 | |||||||
| + Fair Value at Vesting of Stock Awards and Option Awards Granted in Fiscal Year That Vested During Fiscal Year(f) | $ | — | $ | — | $ | — | $ | — | $ | — | |||||||
| + Change in Fair Value as of Vesting Date of Stock Awards and Option Awards Granted in Prior Fiscal Years For Which Applicable Vesting Conditions Were Satisfied During Fiscal Year(g) | $ | 1,572,017 | $ | 1,625,890 | $ | (1,641,503) | $ | 518,089 | $ | 2,743,861 | |||||||
| - Fair Value as of Prior Fiscal Year-End of Stock Awards and Option Awards Granted in Prior Fiscal Years That Failed to Meet Applicable Vesting Conditions During Fiscal Year(h) | $ | — | $ | — | $ | — | $ | — | $ | — | |||||||
| = Compensation Actually Paid | $ | 13,647,050 | $ | 14,576,297 | $ | (8,601,804) | $ | 3,784,342 | $ | 23,928,014 | |||||||
(a)Please see footnote 1 of this section for the NEOs included in the average for each indicated fiscal year.
(b)Represents the average Total Compensation as reported in the Summary Compensation Table for the reported NEOs in the indicated fiscal year.
(c)Represents the average aggregate grant date fair value of the stock awards and option awards granted to the reported NEOs during the indicated fiscal year, computed in accordance with FASB ASC 718.
(d)Represents the average aggregate fair value as of the indicated fiscal year-end of the reported NEOs’ outstanding and unvested stock awards and option awards granted during such fiscal year, computed in accordance with FASB ASC 718 and, for awards subject to performance-based vesting conditions, based on the probable outcome of such performance-based vesting conditions as of the last day of the fiscal year.
(e)Represents the average aggregate change in fair value during the indicated fiscal year of the outstanding and unvested stock awards and option awards held by the reported NEOs as of the last day of the indicated fiscal year, computed in accordance with FASB ASC 718 and, for awards subject to performance-based vesting conditions, based on the probable outcome of such performance-based vesting conditions as of the last day of the fiscal year.
(f)Represents the average aggregate fair value at vesting of the stock awards and option awards that were granted to the reported NEOs and vested during the indicated fiscal year, computed in accordance with FASB ASC 718.
(g)Represents the average aggregate change in fair value, measured from the prior fiscal year-end to the vesting date, of each stock award and option award held by the reported NEOs that was granted in a prior fiscal year and which vested during the indicated fiscal year, computed in accordance with FASB ASC 718.
(h)Represents the average aggregate fair value as of the last day of the prior fiscal year of the reported NEOs’ stock awards and option awards that were granted in a prior fiscal year and which failed to meet the applicable vesting conditions in the indicated fiscal year, computed in accordance with FASB ASC 718.
5.Pursuant to rules of the SEC, the comparison assumes $100 was invested on December 31, 2019. Historic stock price performance is not necessarily indicative of future stock price performance.
6.The TSR Peer Group consists of the Standard & Poor’s Health Care Services Select Industry Index, an independently prepared index that includes companies in the healthcare industry.
7.As noted in the CD&A, for 2024, the Compensation Committee determined that Adjusted EPS continues to be viewed as a core driver of the Company’s performance and stockholder value creation and, accordingly, was utilized as a component in the 2024 LTI Program. “Adjusted Earnings per Share” is a non-GAAP financial measure that represents a per share measure of adjusted net income, to exclude certain items from net income that we do not believe are indicative of our ordinary results of operations, generally including as applicable in that year, among other things, impairment charges, gains and losses on ownership changes, restructuring charges, accruals for legal matters and debt prepayment and refinancing charges. Specifically, as reported in this table, Adjusted EPS represents our diluted net income per share
attributable to DaVita Inc., as adjusted under the pre-established terms of the applicable PSU awards for each reporting year, which may include, among other things, impacts of force majeure events, adjustments to remain consistent with accounting methodology in place at the time that the grant was designed and made, COVID-19 normalization adjustment, and ballot initiatives, in each case, net of any associated taxes. For additional information on how the Compensation Committee designed our compensation programs using certain adjustments, see "What We Pay and Why - Long-Term Incentive Program for 2024." The amount reported for each reporting year in this table represents the Adjusted EPS calculated in accordance with the PSU awards granted during the applicable reporting year and may not align with similar measures under other compensation plan agreements or be comparable to other years presented in this table. Please see Annex A for a presentation of the most directly comparable GAAP financial measure and a reconciliation of the non-GAAP financial measure to the most directly comparable GAAP financial measure.
8.Includes severance benefits received by our former Executive Chairman that were payable in 2020 in accordance with the terms of his employment agreement and which we do not view as representative of the Company's annual compensation program.
| PEO | |||||||||||||||||
| 2024 | 2023 | 2022 | 2021 | 2020 | |||||||||||||
| Summary Compensation Table - Total Compensation(a) | $ | 21,807,489 | $ | 6,712,328 | $ | 2,984,581 | $ | 3,298,439 | $ | 73,432,365 | |||||||
| - Grant Date Fair Value of Stock Awards and Option Awards Granted in Fiscal Year(b) | $ | (15,849,833) | $ | — | $ | — | $ | — | $ | (68,496,958) | |||||||
| + Fair Value at Fiscal Year-End of Outstanding and Unvested Stock Awards and Option Awards Granted in Fiscal Year(c) | $ | 14,611,428 | $ | — | $ | — | $ | — | $ | 146,273,000 | |||||||
| + Change in Fair Value of Outstanding and Unvested Stock Awards and Option Awards Granted in Prior Fiscal Years(d) | $ | — | $ | — | $ | (43,928,697) | $ | (17,202,972) | $ | 20,182,219 | |||||||
| + Fair Value at Vesting of Stock Awards and Option Awards Granted in Fiscal Year That Vested During Fiscal Year(e) | $ | — | $ | — | $ | — | $ | — | $ | — | |||||||
| + Change in Fair Value as of Vesting Date of Stock Awards and Option Awards Granted in Prior Fiscal Years For Which Applicable Vesting Conditions Were Satisfied During Fiscal Year(f) | $ | — | $ | (1,901,289) | $ | (45,459,565) | $ | 828,298 | $ | 556,055 | |||||||
| - Fair Value as of Prior Fiscal Year-End of Stock Awards and Option Awards Granted in Prior Fiscal Years That Failed to Meet Applicable Vesting Conditions During Fiscal Year(g) | $ | — | $ | — | $ | — | $ | — | $ | — | |||||||
| = Compensation Actually Paid | $ | 20,569,084 | $ | 4,811,039 | $ | (86,403,681) | $ | (13,076,235) | $ | 171,946,681 | |||||||
(a)Represents Total Compensation as reported in the Summary Compensation Table for the indicated fiscal year.
(b)Represents the aggregate grant date fair value of the stock awards and option awards granted to Mr. Rodriguez during the indicated fiscal year, computed in accordance with FASB ASC 718.
(c)Represents the aggregate fair value as of the indicated fiscal year-end of Mr. Rodriguez’s outstanding and unvested stock awards and option awards granted during such fiscal year, computed in accordance with FASB ASC 718 and, for awards subject to performance-
based vesting conditions, based on the probable outcome of such performance-based vesting conditions as of the last day of the fiscal year.
(d)Represents the aggregate change in fair value during the indicated fiscal year of the outstanding and unvested stock awards and option awards held by Mr. Rodriguez as of the last day of the indicated fiscal year, computed in accordance with FASB ASC 718 and, for awards subject to performance-based vesting conditions, based on the probable outcome of such performance-based vesting conditions as of the last day of the fiscal year.
(e)Represents the aggregate fair value at vesting of the stock awards and option awards that were granted to Mr. Rodriguez and vested during the indicated fiscal year, computed in accordance with FASB ASC 718.
(f)Represents the aggregate change in fair value, measured from the prior fiscal year-end to the vesting date, of each stock award and option award held by Mr. Rodriguez that was granted in a prior fiscal year, and which vested during the indicated fiscal year, computed in accordance with FASB ASC 718.
(g)Represents the aggregate fair value as of the last day of the prior fiscal year of Mr. Rodriguez’s stock awards and option awards that were granted in a prior fiscal year and which failed to meet the applicable vesting conditions in the indicated fiscal year, computed in accordance with FASB ASC 718.
| Other NEOs Average (a) | |||||||||||||||||
| 2024 | 2023 | 2022 | 2021 | 2020 | |||||||||||||
| Summary Compensation Table - Total Compensation(b) | $ | 5,314,871 | $ | 6,408,000 | $ | 4,203,738 | $ | 4,262,738 | $ | 6,453,315 | |||||||
| - Grant Date Fair Value of Stock Awards and Option Awards Granted in Fiscal Year(c) | $ | (3,122,225) | $ | (4,338,381) | $ | (3,030,532) | $ | (2,869,513) | $ | (2,304,672) | |||||||
| + Fair Value at Fiscal Year-End of Outstanding and Unvested Stock Awards and Option Awards Granted in Fiscal Year(d) | $ | 3,442,135 | $ | 8,695,914 | $ | 1,700,247 | $ | 3,485,674 | $ | 5,651,914 | |||||||
| + Change in Fair Value of Outstanding and Unvested Stock Awards and Option Awards Granted in Prior Fiscal Years(e) | $ | 6,440,252 | $ | 2,184,874 | $ | (9,833,754) | $ | (1,612,646) | $ | 11,383,596 | |||||||
| + Fair Value at Vesting of Stock Awards and Option Awards Granted in Fiscal Year That Vested During Fiscal Year(f) | $ | — | $ | — | $ | — | $ | — | $ | — | |||||||
| + Change in Fair Value as of Vesting Date of Stock Awards and Option Awards Granted in Prior Fiscal Years For Which Applicable Vesting Conditions Were Satisfied During Fiscal Year(g) | $ | 1,572,017 | $ | 1,625,890 | $ | (1,641,503) | $ | 518,089 | $ | 2,743,861 | |||||||
| - Fair Value as of Prior Fiscal Year-End of Stock Awards and Option Awards Granted in Prior Fiscal Years That Failed to Meet Applicable Vesting Conditions During Fiscal Year(h) | $ | — | $ | — | $ | — | $ | — | $ | — | |||||||
| = Compensation Actually Paid | $ | 13,647,050 | $ | 14,576,297 | $ | (8,601,804) | $ | 3,784,342 | $ | 23,928,014 | |||||||
(a)Please see footnote 1 of this section for the NEOs included in the average for each indicated fiscal year.
(b)Represents the average Total Compensation as reported in the Summary Compensation Table for the reported NEOs in the indicated fiscal year.
(c)Represents the average aggregate grant date fair value of the stock awards and option awards granted to the reported NEOs during the indicated fiscal year, computed in accordance with FASB ASC 718.
(d)Represents the average aggregate fair value as of the indicated fiscal year-end of the reported NEOs’ outstanding and unvested stock awards and option awards granted during such fiscal year, computed in accordance with FASB ASC 718 and, for awards subject to performance-based vesting conditions, based on the probable outcome of such performance-based vesting conditions as of the last day of the fiscal year.
(e)Represents the average aggregate change in fair value during the indicated fiscal year of the outstanding and unvested stock awards and option awards held by the reported NEOs as of the last day of the indicated fiscal year, computed in accordance with FASB ASC 718 and, for awards subject to performance-based vesting conditions, based on the probable outcome of such performance-based vesting conditions as of the last day of the fiscal year.
(f)Represents the average aggregate fair value at vesting of the stock awards and option awards that were granted to the reported NEOs and vested during the indicated fiscal year, computed in accordance with FASB ASC 718.
(g)Represents the average aggregate change in fair value, measured from the prior fiscal year-end to the vesting date, of each stock award and option award held by the reported NEOs that was granted in a prior fiscal year and which vested during the indicated fiscal year, computed in accordance with FASB ASC 718.
(h)Represents the average aggregate fair value as of the last day of the prior fiscal year of the reported NEOs’ stock awards and option awards that were granted in a prior fiscal year and which failed to meet the applicable vesting conditions in the indicated fiscal year, computed in accordance with FASB ASC 718.
Relationship Between Pay and Performance
We believe the compensation actually paid, as calculated in accordance with SEC disclosure rules, in each of the years reported above and over the five-year cumulative period reflect the Compensation Committee’s emphasis on “pay-for-performance” as the compensation actually paid fluctuated year-over-year, primarily due to our stock performance and our varying levels of achievement against pre-established performance goals under our STI Program and LTI program, including our Adjusted EPS performance. The CD&A describes in greater detail the Compensation Committee's emphasis on "pay-for-performance" and how our executive compensation program is designed to link executive compensation with the achievement of our financial and strategic objectives as well as stockholder value creation.
Because of the weighting of our executive compensation program towards long-term incentives through grants of some combination of PSUs, SSARs and RSUs, the compensation actually paid is most significantly impacted by changes in our stock price over the vesting period of those awards. In addition, this Pay Versus Performance disclosure is significantly impacted by the unique, up-front CEO Premium-Priced SSAR Award granted to Mr. Rodriguez in connection with his 2019 transition to the CEO role, which is more fully described in the subsection titled "Compensation Discussion and Analysis — What We Pay and Why — Long-Term Incentive Program for 2024." Because of the up-front nature of the grant as well as its strong linkage to our stock price, the compensation actually paid to our CEO, as calculated per the SEC disclosure rules, has fluctuated significantly since the year of grant. The values shown as compensation actually paid for Mr. Rodriguez include the fair value of the award at the end of 2020 and 2021. The 2022 value shown includes the fair value at vesting of the first tranche and the fair value at the end of 2022 for the unvested tranche. The value shown for 2023 includes the fair value at vesting of the second tranche of the award. Due to the five-year mandatory holding period required under the terms of the CEO Premium-Priced SSAR Award, Mr. Rodriguez could not realize any value from any exercised portion of the CEO Premium-Priced SSAR Award until November 4, 2024, and the ultimate value realized by Mr. Rodriguez was dependent upon the long-term sustainable value created for the Company's stockholders. Our Pay Versus Performance disclosure is also impacted by the severance benefits received by our former Executive Chairman in 2020 that were payable in accordance with the terms of his employment agreement and which we do not view as representative of the Company's annual compensation program.
The following graph illustrates the relationship between pay and performance, as calculated per the SEC disclosure rules.
Tabular List of Financial Performance Measures
The following is a list of financial performance measures, which in the Company’s assessment represent the most important financial performance measures used by the Company to link compensation actually paid to the NEOs for 2024. In addition to these financial metrics, the Company's executive compensation program is impacted by our performance with respect to operational and sustainability-related goals and the achievement by the executive officers of customized objectives under the STI Program. Please see the CD&A for further information regarding the following financial performance measures as well as the operational and sustainability and customized objectives used in the STI Program.
| Four Most Important Financial Performance Measures for Determining NEO Compensation | ||
Adjusted Earnings per Share | ||
Free cash flow from continuing operations | ||
Consolidated adjusted operating income | ||
Total shareholder return | ||