v3.25.1
Pay vs Performance Disclosure
5 Months Ended 7 Months Ended 12 Months Ended
Jun. 02, 2021
Dec. 31, 2021
Dec. 31, 2024
USD ($)
$ / $
Dec. 31, 2023
USD ($)
$ / $
Dec. 31, 2022
USD ($)
$ / $
Dec. 31, 2021
USD ($)
$ / $
Dec. 31, 2020
USD ($)
$ / $
Pay vs Performance Disclosure              
Pay vs Performance Disclosure, Table    

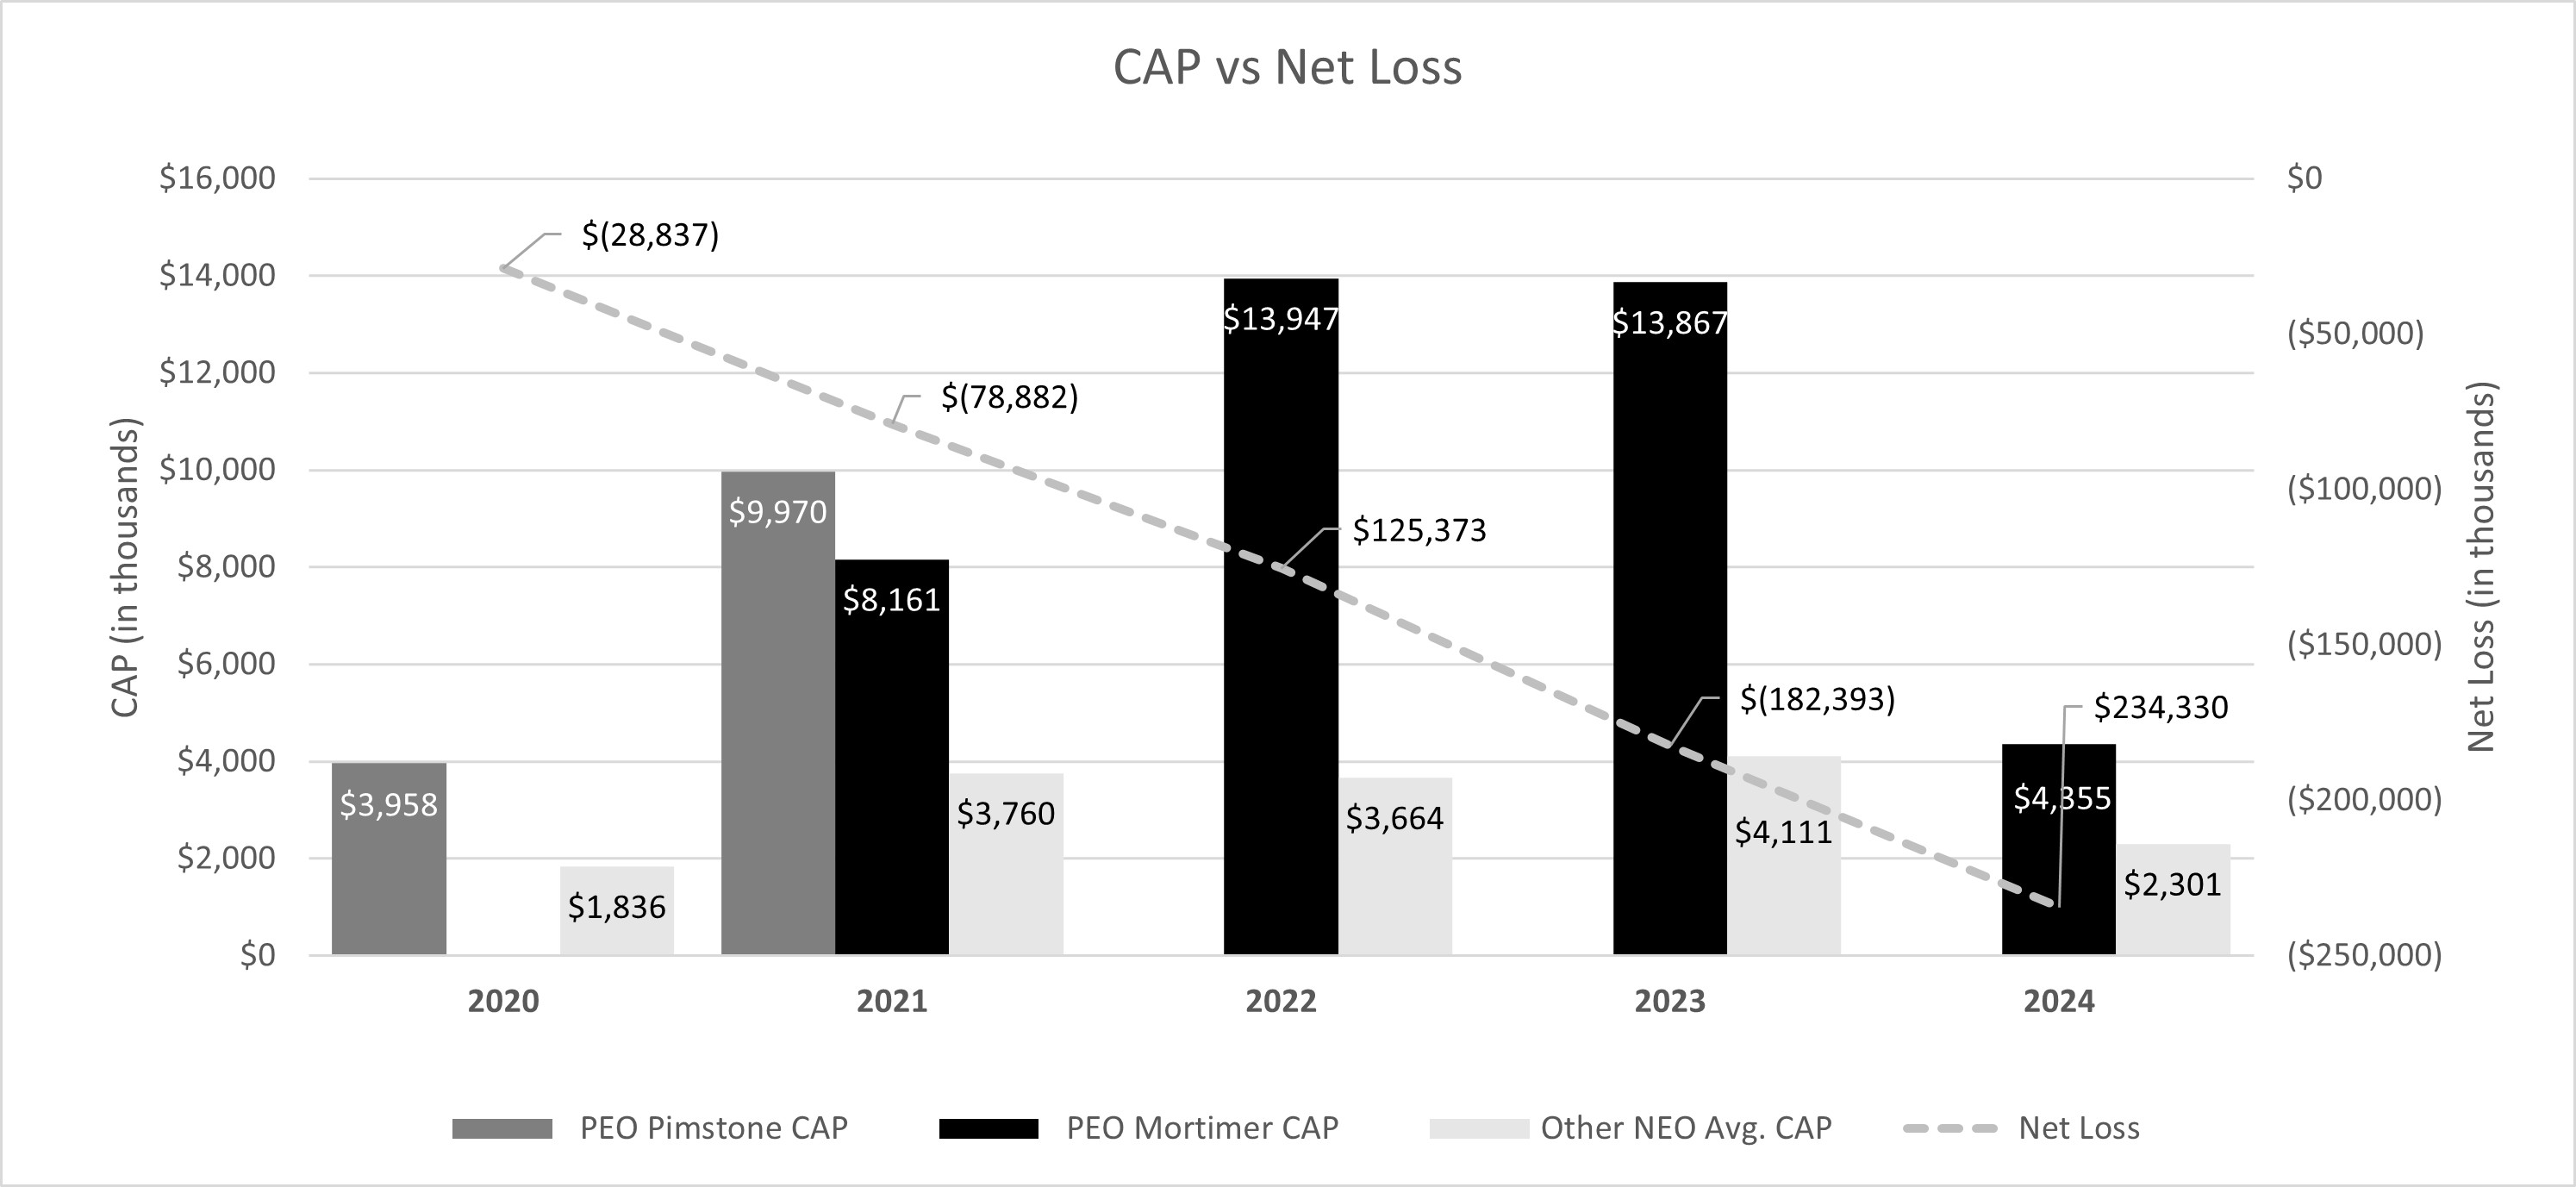
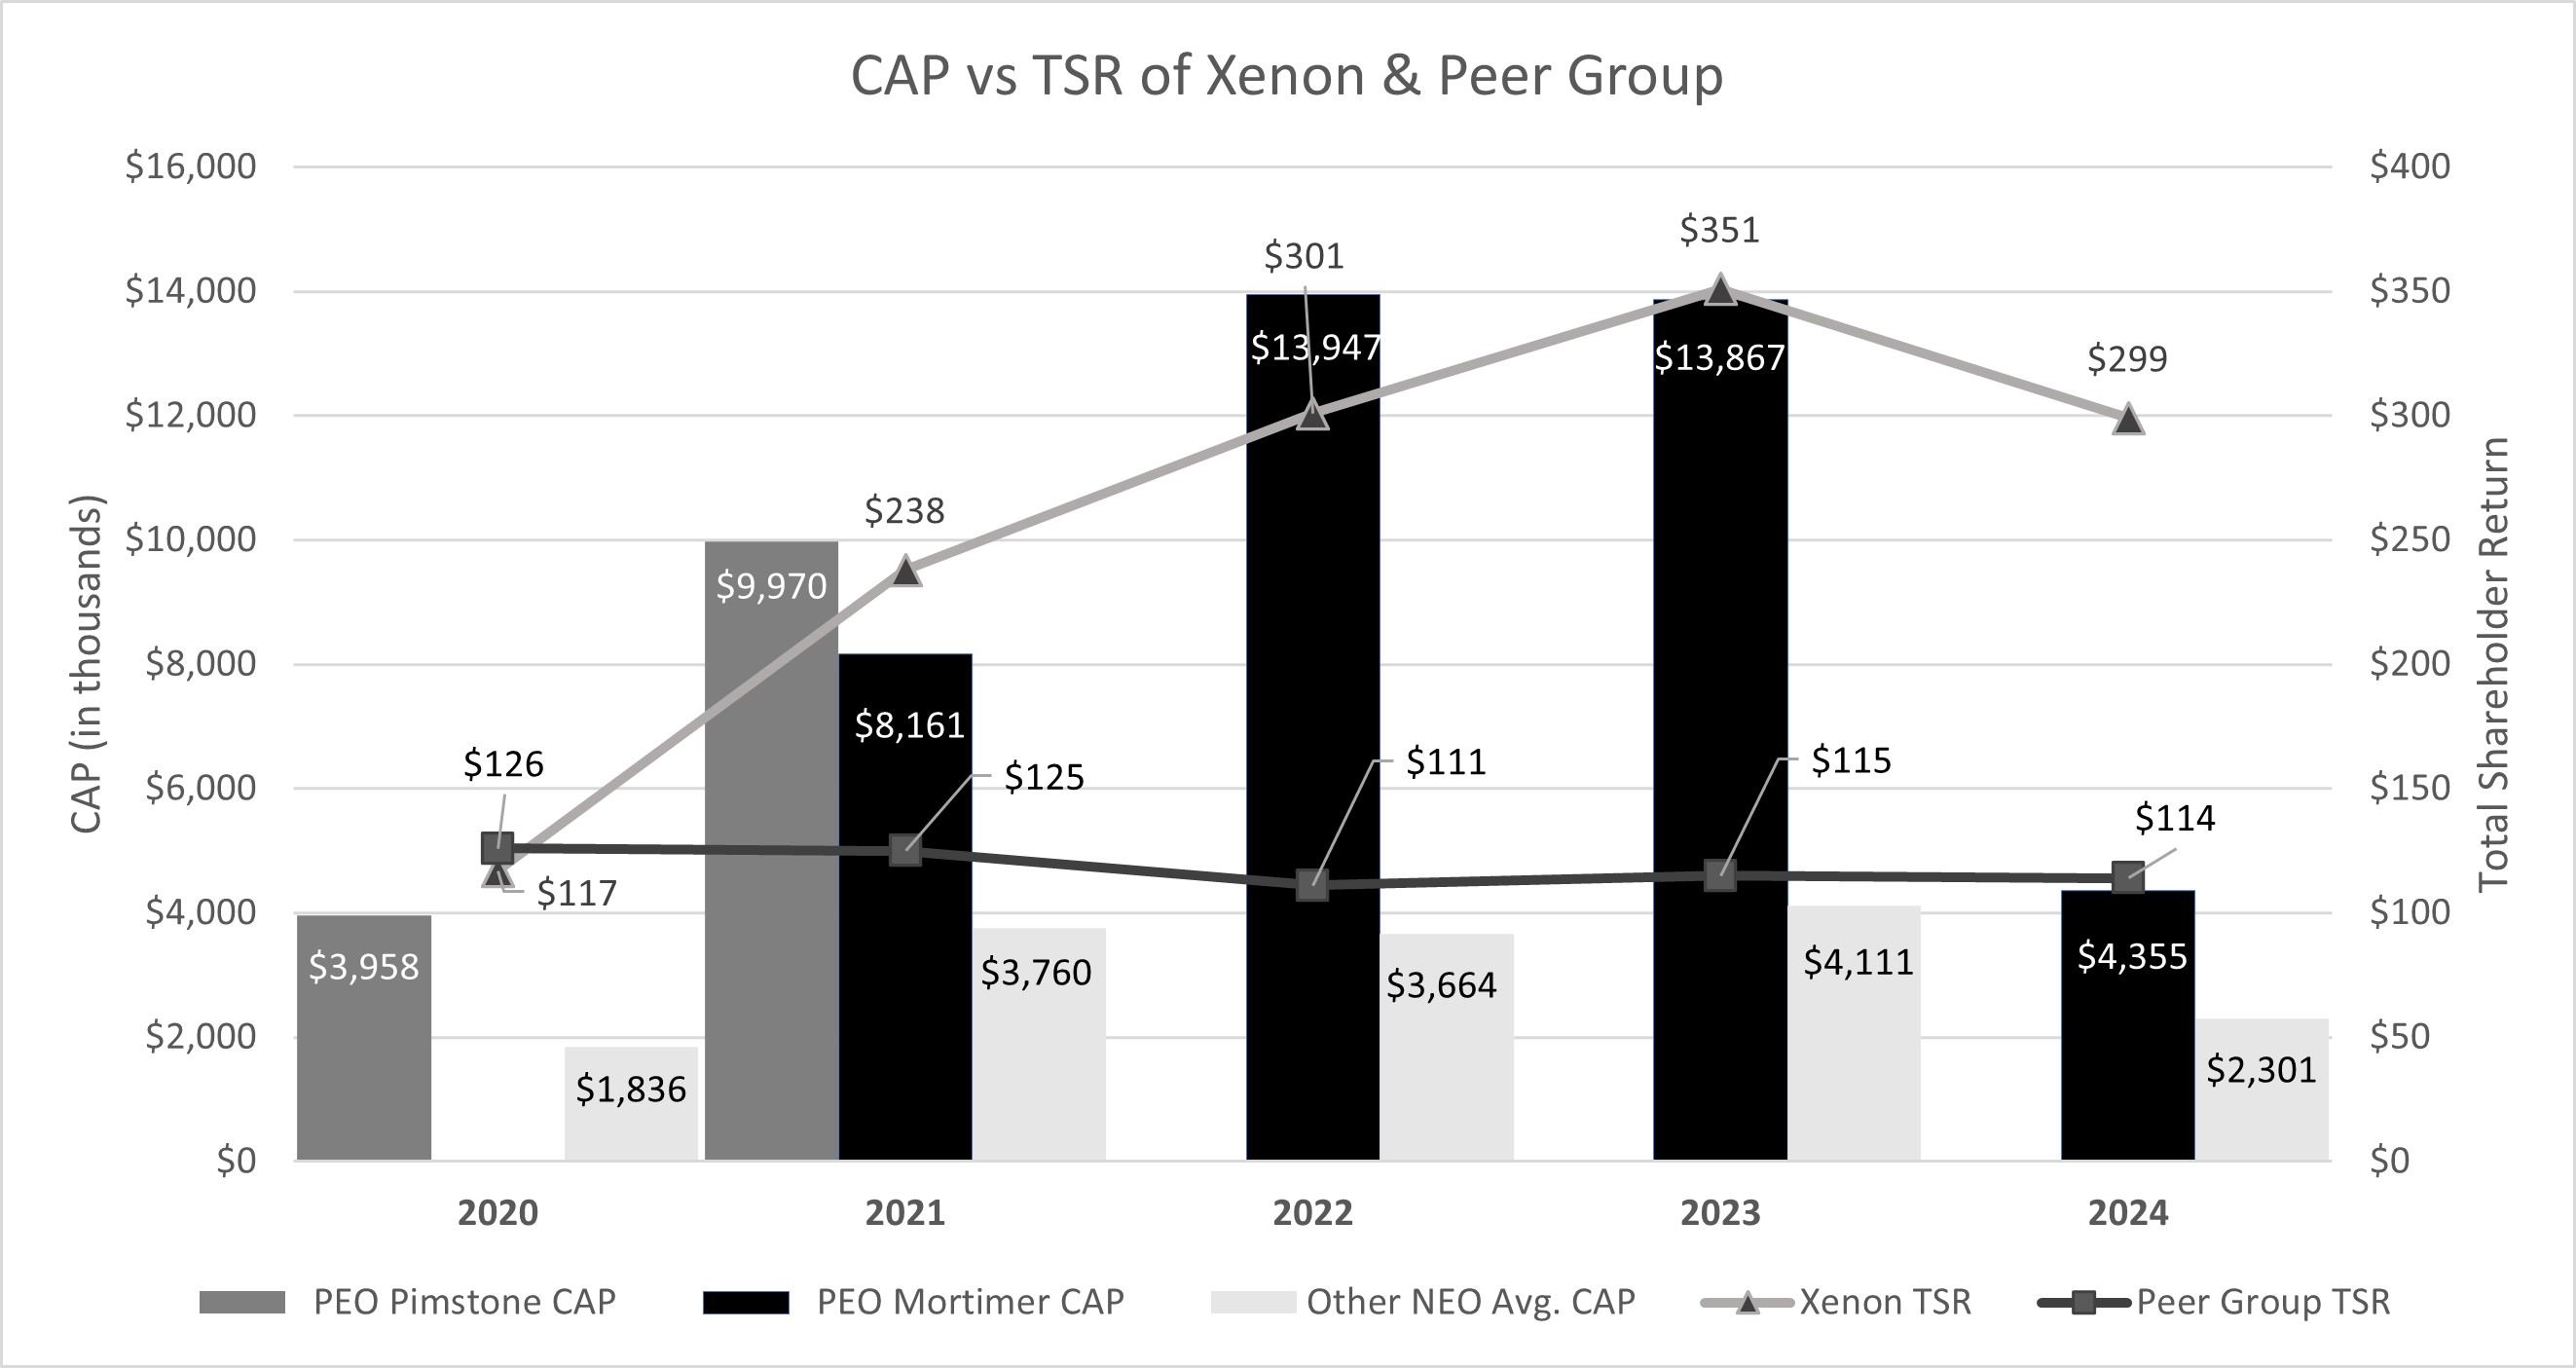
Pay versus Performance

The following table reports the compensation of our Chief Executive Officer (our Principal Executive Officer, or “PEO”) and the average compensation of the other Named Executive Officers (“Other NEOs”) as reported in the Summary Compensation Table in our proxy statements for the past five years, as well as their “compensation actually paid” (“CAP”), as calculated pursuant to the requirements of Item 402(v) of Regulation S-K. The amounts do not reflect the actual amount of compensation earned by or paid to our PEOs or Other NEOs during the applicable year and were not considered by our Compensation Committee at the time it made decisions with respect to our PEOs’ or Other NEOs’ compensation.

As described in more detail in the section of this Circular titled “Compensation Discussion and Analysis,” our performance-based incentive compensation is generally tied to the Corporation’s strategic and operational objectives, and we did not use financial measures to link executive compensation to our financial performance in the applicable years reported below. Accordingly, we have not included any “Company Selected Measure” or provided a tabular list of financial performance measures.


Value of Initial Fixed $100 Investment Based on:


Summary Compensation Table Total for PEO - Ian Mortimer(1)


Compensation Actually Paid to PEO - Ian Mortimer(2)(3)


Summary Compensation Table Total for PEO - Simon Pimstone(1)


Compensation Actually Paid to PEO - Simon Pimstone(2)(3)


Average Summary Compensation Table Total for Other NEOs(4)


Average Compensation Actually Paid to Other NEOs(2)(3)


Xenon TSR(5)


Peer Group TSR(6)


Net Loss
(in thousands)
(7)


2024


$

9,795,347


$

4,354,520


N/A


N/A


$

4,139,227


$

2,300,677


$

299


$

114


$

234,330


2023


10,117,829


13,866,708


N/A


N/A


3,059,837


4,111,123


351


115


182,393


2022


9,228,604


13,947,116


N/A


N/A


3,177,945


3,664,432


301


111


125,373


2021


3,894,997


8,160,743


$

4,116,416


$

9,969,831


1,971,967


3,759,699


238


125


78,882


2020


N/A


N/A


2,941,911


3,958,576


1,444,912


1,835,688


117


126


28,837


(1)
Mr. Mortimer served as our President and Chief Financial Officer for the year 2020 and through June 2, 2021, and has served as our President and Chief Executive Officer since June 3, 2021. Dr. Pimstone served as our Chief Executive Officer for the year 2020 and through June 2, 2021. The amounts reported in these columns represent the amounts of total compensation reported in the “Total” column of the Summary Compensation Table in each applicable year for the applicable PEO. Compensation amounts paid to our PEOs were paid in Canadian dollars and have been converted to U.S. dollars for purposes of the table. The U.S. dollar per Canadian dollar exchange rate used for such conversion was 0.7302, 0.7410, 0.7692, 0.7980 and 0.7461, which were the average Bank of Canada foreign exchange rates for the 2024, 2023, 2022, 2021 and 2020 fiscal years, respectively.
(2)
The Summary Compensation Table totals reported for the PEOs and the average of the Other NEOs for each year were subject to the following adjustments in accordance with Item 402(v)(2) (iii) of Regulation S-K to calculate “compensation actually paid”:


2024


2023


2022


2021


2020


PEO - Ian Mortimer


Average for Other NEOs


PEO - Ian Mortimer


Average for Other NEOs


PEO - Ian Mortimer


Average for Other NEOs


PEO - Ian Mortimer


PEO - Simon Pimstone


Average for Other NEOs


PEO - Simon Pimstone


Average for Other NEOs


Summary Compensation Table Total


$

9,795,347


$

4,139,227


$

10,117,829


$

3,059,837


$

9,228,604


$

3,177,945


$

3,894,997


$

4,116,416


$

1,971,967


$

2,941,911


$

1,444,912


Adjustments


Deduction for amounts reported under "Option Awards" and "Stock Awards" in the Summary Compensation Table


(8,611,059

)


(3,422,238

)


(9,051,114

)


(2,411,645

)


(8,254,844

)


(2,643,857

)


(2,937,835

)


(3,104,921

)


(1,608,715

)


(2,154,135

)


(807,801

)

Year-end fair value of option and stock awards granted during year that remained unvested as of last day of year


6,702,262


2,661,305


12,261,591


3,267,069


11,554,862


2,527,625


5,223,454


5,133,746


3,249,254


2,989,052


1,120,894


Change in fair value from last day of prior year to last day of year of unvested option and stock awards


(2,315,305

)


(704,409

)


982,419


343,908


1,263,011


478,051


1,479,078


2,919,034


111,424


305,345


125,819


Change in fair value (as of vesting date from prior year end) of prior years' option and stock awards that vested during the year


(1,216,725

)


(373,208

)


(444,017

)


(148,046

)


155,483


124,668


501,049


905,556


35,769


(123,597

)


(48,136

)

Compensation Actually Paid


$

4,354,520


$

2,300,677


$

13,866,708


$

4,111,123


$

13,947,116


$

3,664,432


$

8,160,743


$

9,969,831


$

3,759,699


$

3,958,576


$

1,835,688


(3)
For purposes of calculating the CAP to each PEO and the average CAP to our Other NEOs, compensation related to option awards was remeasured using a Black-Scholes option pricing model as of the applicable year-end date or, in the case of vested options, the vesting date. The Black-Scholes option pricing model requires us to make assumptions and judgments regarding the variables used in the calculation, including the expected remaining term, expected volatility, and the expected risk-free rate, and the assumptions we used for these variables are as follows:


Year Ended December 31,


2024


2023


2022


2021


2020

Expected term (in years)

4.58 6.63


4.69 – 6.72


5.36 – 6.94


4.67 – 7.21


4.77 – 7.32

Volatility

59.38 % – 64.90 %


63.73 % – 73.51 %


68.08 % – 76.18 %


65.59 % - 77.46%


66.61 % - 70.15 %

Risk-free interest rate

3.55 % – 4.68 %


3.47 % – 4.80 %


1.42 % – 4.20 %


0.48 % - 1.44 %


0.22 % - 1.42 %

Dividend yield


The assumptions used in calculating the fair value of stock awards include the stock price as of the applicable measuring date and, in the case of performance-based awards, the probable outcome of the performance conditions as of the applicable measuring date. The valuation assumptions used to calculate fair values did not differ in any material respect from the assumptions used to calculate the grant date fair value of the stock awards as reported in the Summary Compensation Table.


(4)
The amounts reported in this column represent the average amounts of total compensation reported in the “Total” column of the Summary Compensation Table in each applicable year for the Other NEOs. Compensation amounts paid to Mr. Mortimer, Ms. Aulin and Dr. Sherrington were paid in Canadian dollars and have been converted to U.S. dollars for purposes of the table. The U.S. dollar per Canadian dollar exchange rate used for such conversion was 0.7302, 0.7410, 0.7692, 0.7980 and 0.7461, which were the average Bank of Canada foreign exchange rates for the 2024, 2023, 2022, 2021 and 2020 fiscal years, respectively. The Other NEOs for each year are as follows:


2024 – Sherry Aulin, Andrea DiFabio, Christopher Kenney and Christopher Von Seggern

2023 – Sherry Aulin, Christopher Kenney, Christopher Von Seggern and Robin Sherrington

2022 – Sherry Aulin, Christopher Kenney, Christopher Von Seggern and Andrea DiFabio

2021 – Sherry Aulin and Christopher Kenney

2020 – Ian Mortimer and Ernesto Aycardi

(5)
Total shareholder return (“TSR”) represents the cumulative total return on $100 invested in our Common Shares on December 31, 2019 through the last trading day of the applicable fiscal year reported in the table. Cumulative TSR is calculated by dividing the sum of the cumulative amount of dividends for the measurement period, assuming dividend reinvestment, and the difference between the Corporation’s share price at the end and the beginning of the measurement period by the Corporation’s share price at the beginning of the measurement period. The Corporation has not paid any dividends to date.
(6)
Peer Group TSR represents the cumulative total return on $100 invested on December 31, 2019 through the last trading day of the applicable fiscal year reported in the table. The peer group used for this purpose is the Nasdaq Biotechnology Index for all five fiscal years disclosed, which aligns with the peer group used for the stock performance graph required by Item 201(e) of Regulation S-K included in our Annual Reports on Form 10-K for the years ended December 31, 2024, December 31, 2023 and December 31, 2022. We were not required to prepare a stock performance graph under Item 201(e) of Regulation S-K for the fiscal years ended December 31, 2021 and December 31, 2020, so we did not have a peer group for this purpose for those years.
(7)
The amounts reported in this column represent the amount of net loss as reflected in the Corporation’s audited financial statements for the applicable years as included in our Annual Reports on Form 10-K.
       
Named Executive Officers, Footnote     Mr. Mortimer served as our President and Chief Financial Officer for the year 2020 and through June 2, 2021, and has served as our President and Chief Executive Officer since June 3, 2021. Dr. Pimstone served as our Chief Executive Officer for the year 2020 and through June 2, 2021. The amounts reported in these columns represent the amounts of total compensation reported in the “Total” column of the Summary Compensation Table in each applicable year for the applicable PEO. Compensation amounts paid to our PEOs were paid in Canadian dollars and have been converted to U.S. dollars for purposes of the table. The U.S. dollar per Canadian dollar exchange rate used for such conversion was 0.7302, 0.7410, 0.7692, 0.7980 and 0.7461, which were the average Bank of Canada foreign exchange rates for the 2024, 2023, 2022, 2021 and 2020 fiscal years, respectively.The Other NEOs for each year are as follows:


2024 – Sherry Aulin, Andrea DiFabio, Christopher Kenney and Christopher Von Seggern

2023 – Sherry Aulin, Christopher Kenney, Christopher Von Seggern and Robin Sherrington

2022 – Sherry Aulin, Christopher Kenney, Christopher Von Seggern and Andrea DiFabio

2021 – Sherry Aulin and Christopher Kenney

2020 – Ian Mortimer and Ernesto Aycardi

       
Peer Group Issuers, Footnote    
(6)
Peer Group TSR represents the cumulative total return on $100 invested on December 31, 2019 through the last trading day of the applicable fiscal year reported in the table. The peer group used for this purpose is the Nasdaq Biotechnology Index for all five fiscal years disclosed, which aligns with the peer group used for the stock performance graph required by Item 201(e) of Regulation S-K included in our Annual Reports on Form 10-K for the years ended December 31, 2024, December 31, 2023 and December 31, 2022. We were not required to prepare a stock performance graph under Item 201(e) of Regulation S-K for the fiscal years ended December 31, 2021 and December 31, 2020, so we did not have a peer group for this purpose for those years.
       
Non-PEO NEO Average Total Compensation Amount     $ 4,139,227 $ 3,059,837 $ 3,177,945 $ 1,971,967 $ 1,444,912
Non-PEO NEO Average Compensation Actually Paid Amount     $ 2,300,677 4,111,123 3,664,432 3,759,699 1,835,688
Adjustment to Non-PEO NEO Compensation Footnote    
(2)
The Summary Compensation Table totals reported for the PEOs and the average of the Other NEOs for each year were subject to the following adjustments in accordance with Item 402(v)(2) (iii) of Regulation S-K to calculate “compensation actually paid”:


2024


2023


2022


2021


2020


PEO - Ian Mortimer


Average for Other NEOs


PEO - Ian Mortimer


Average for Other NEOs


PEO - Ian Mortimer


Average for Other NEOs


PEO - Ian Mortimer


PEO - Simon Pimstone


Average for Other NEOs


PEO - Simon Pimstone


Average for Other NEOs


Summary Compensation Table Total


$

9,795,347


$

4,139,227


$

10,117,829


$

3,059,837


$

9,228,604


$

3,177,945


$

3,894,997


$

4,116,416


$

1,971,967


$

2,941,911


$

1,444,912


Adjustments


Deduction for amounts reported under "Option Awards" and "Stock Awards" in the Summary Compensation Table


(8,611,059

)


(3,422,238

)


(9,051,114

)


(2,411,645

)


(8,254,844

)


(2,643,857

)


(2,937,835

)


(3,104,921

)


(1,608,715

)


(2,154,135

)


(807,801

)

Year-end fair value of option and stock awards granted during year that remained unvested as of last day of year


6,702,262


2,661,305


12,261,591


3,267,069


11,554,862


2,527,625


5,223,454


5,133,746


3,249,254


2,989,052


1,120,894


Change in fair value from last day of prior year to last day of year of unvested option and stock awards


(2,315,305

)


(704,409

)


982,419


343,908


1,263,011


478,051


1,479,078


2,919,034


111,424


305,345


125,819


Change in fair value (as of vesting date from prior year end) of prior years' option and stock awards that vested during the year


(1,216,725

)


(373,208

)


(444,017

)


(148,046

)


155,483


124,668


501,049


905,556


35,769


(123,597

)


(48,136

)

Compensation Actually Paid


$

4,354,520


$

2,300,677


$

13,866,708


$

4,111,123


$

13,947,116


$

3,664,432


$

8,160,743


$

9,969,831


$

3,759,699


$

3,958,576


$

1,835,688


Equity Valuation Assumption Difference, Footnote    
(3)
For purposes of calculating the CAP to each PEO and the average CAP to our Other NEOs, compensation related to option awards was remeasured using a Black-Scholes option pricing model as of the applicable year-end date or, in the case of vested options, the vesting date. The Black-Scholes option pricing model requires us to make assumptions and judgments regarding the variables used in the calculation, including the expected remaining term, expected volatility, and the expected risk-free rate, and the assumptions we used for these variables are as follows:


Year Ended December 31,


2024


2023


2022


2021


2020

Expected term (in years)

4.58 6.63


4.69 – 6.72


5.36 – 6.94


4.67 – 7.21


4.77 – 7.32

Volatility

59.38 % – 64.90 %


63.73 % – 73.51 %


68.08 % – 76.18 %


65.59 % - 77.46%


66.61 % - 70.15 %

Risk-free interest rate

3.55 % – 4.68 %


3.47 % – 4.80 %


1.42 % – 4.20 %


0.48 % - 1.44 %


0.22 % - 1.42 %

Dividend yield


Compensation Actually Paid vs. Total Shareholder Return    

img255911440_2.jpg

       
Compensation Actually Paid vs. Net Income    

vsNet Lossimg255911440_3.jpg

       
Compensation Actually Paid vs. Company Selected Measure    
(7)
The amounts reported in this column represent the amount of net loss as reflected in the Corporation’s audited financial statements for the applicable years as included in our Annual Reports on Form 10-K.
       
Total Shareholder Return Vs Peer Group    
(5)
Total shareholder return (“TSR”) represents the cumulative total return on $100 invested in our Common Shares on December 31, 2019 through the last trading day of the applicable fiscal year reported in the table. Cumulative TSR is calculated by dividing the sum of the cumulative amount of dividends for the measurement period, assuming dividend reinvestment, and the difference between the Corporation’s share price at the end and the beginning of the measurement period by the Corporation’s share price at the beginning of the measurement period. The Corporation has not paid any dividends to date.
       
Total Shareholder Return Amount     $ 299 351 301 238 117
Peer Group Total Shareholder Return Amount     114 115 111 125 126
Net Income (Loss)     $ 234,330,000 $ 182,393,000 $ 125,373,000 $ 78,882,000 $ 28,837,000
PEO Name Dr. Pimstone Mr. Mortimer Mr. Mortimer Mr. Mortimer Mr. Mortimer   Dr. Pimstone
Comp Expected Term Maximum     6 years 7 months 17 days 6 years 8 months 19 days 6 years 11 months 8 days 7 years 2 months 15 days 7 years 3 months 25 days
Comp Expected Term Minimum     4 years 6 months 29 days 4 years 8 months 8 days 5 years 4 months 9 days 4 years 8 months 1 day 4 years 9 months 7 days
Comp Risk-free Interest Rate Maximum     4.68% 4.80% 4.20% 1.44% 1.42%
Comp risk-free interest rate Minimum     3.55% 3.47% 1.42% 0.48% 0.22%
Comp Dividend Yield1     0.00% 0.00% 0.00% 0.00% 0.00%
Comp Amt Convertion Foreign Exchange Rate | $ / $     0.7302 0.741 0.7692 0.798 0.7461
Comp Volatility Rate Maximum     64.90% 73.51% 76.18% 77.46% 70.15%
Comp Volatility Rate Minimum     59.38% 63.73% 68.08% 65.59% 66.61%
Ian Mortimer [Member]              
Pay vs Performance Disclosure              
PEO Total Compensation Amount     $ 9,795,347 $ 10,117,829 $ 9,228,604 $ 3,894,997  
PEO Actually Paid Compensation Amount     4,354,520 13,866,708 13,947,116 8,160,743  
Simon Pimstone [Member]              
Pay vs Performance Disclosure              
PEO Total Compensation Amount           4,116,416 $ 2,941,911
PEO Actually Paid Compensation Amount           9,969,831 3,958,576
PEO | Ian Mortimer [Member] | Deduction for Amounts Reported under Option Awards in the Summary Compensation Table [Member]              
Pay vs Performance Disclosure              
Adjustment to Compensation, Amount     (8,611,059) (9,051,114) (8,254,844) (2,937,835)  
PEO | Ian Mortimer [Member] | Year-End Fair Value of Option Awards Granted during Year that Remained Unvested as of Last Day of Year [Member]              
Pay vs Performance Disclosure              
Adjustment to Compensation, Amount     6,702,262 12,261,591 11,554,862 5,223,454  
PEO | Ian Mortimer [Member] | Change in Fair Value from Last Day of Prior Year to Last Day of Year of Unvested Option Awards [Member]              
Pay vs Performance Disclosure              
Adjustment to Compensation, Amount     (2,315,305) 982,419 1,263,011 1,479,078  
PEO | Ian Mortimer [Member] | Change in Fair Value from Prior Years' Option Awards that Vested During the Year [Member]              
Pay vs Performance Disclosure              
Adjustment to Compensation, Amount     (1,216,725) (444,017) 155,483 501,049  
PEO | Simon Pimstone [Member] | Deduction for Amounts Reported under Option Awards in the Summary Compensation Table [Member]              
Pay vs Performance Disclosure              
Adjustment to Compensation, Amount           (3,104,921) (2,154,135)
PEO | Simon Pimstone [Member] | Year-End Fair Value of Option Awards Granted during Year that Remained Unvested as of Last Day of Year [Member]              
Pay vs Performance Disclosure              
Adjustment to Compensation, Amount           5,133,746 2,989,052
PEO | Simon Pimstone [Member] | Change in Fair Value from Last Day of Prior Year to Last Day of Year of Unvested Option Awards [Member]              
Pay vs Performance Disclosure              
Adjustment to Compensation, Amount           2,919,034 305,345
PEO | Simon Pimstone [Member] | Change in Fair Value from Prior Years' Option Awards that Vested During the Year [Member]              
Pay vs Performance Disclosure              
Adjustment to Compensation, Amount           905,556 (123,597)
Non-PEO NEO | Deduction for Amounts Reported under Option Awards in the Summary Compensation Table [Member]              
Pay vs Performance Disclosure              
Adjustment to Compensation, Amount     (3,422,238) (2,411,645) (2,643,857) (1,608,715) (807,801)
Non-PEO NEO | Year-End Fair Value of Option Awards Granted during Year that Remained Unvested as of Last Day of Year [Member]              
Pay vs Performance Disclosure              
Adjustment to Compensation, Amount     2,661,305 3,267,069 2,527,625 3,249,254 1,120,894
Non-PEO NEO | Change in Fair Value from Last Day of Prior Year to Last Day of Year of Unvested Option Awards [Member]              
Pay vs Performance Disclosure              
Adjustment to Compensation, Amount     (704,409) 343,908 478,051 111,424 125,819
Non-PEO NEO | Change in Fair Value from Prior Years' Option Awards that Vested During the Year [Member]              
Pay vs Performance Disclosure              
Adjustment to Compensation, Amount     $ (373,208) $ (148,046) $ 124,668 $ 35,769 $ (48,136)