Shareholder Report
|
12 Months Ended |
|
Feb. 28, 2025
USD ($)
Holding
|
|---|
| Shareholder Report [Line Items] |
|
| Document Type |
N-CSR
|
| Amendment Flag |
false
|
| Registrant Name |
Federated Hermes High Yield Trust
|
| Entity Central Index Key |
0000745967
|
| Entity Investment Company Type |
N-1A
|
| Document Period End Date |
Feb. 28, 2025
|
| C000143970 |
|
| Shareholder Report [Line Items] |
|
| Fund Name |
Federated Hermes Opportunistic High Yield Bond Fund
|
| Class Name |
Class A Shares
|
| Trading Symbol |
FHYAX
|
| Annual or Semi-Annual Statement [Text Block] |
This annual shareholder report contains important information about the Federated Hermes Opportunistic High Yield Bond Fund (the "Fund") for the period of March 1, 2024 to February 28, 2025.
|
| Shareholder Report Annual or Semi-Annual |
Annual Shareholder Report
|
| Additional Information [Text Block] |
You can find additional information at FederatedHermes.com/us/FundInformation. You can also request this information by contacting us at 1-800-341-7400, Option 4, or your financial advisor.
|
| Material Fund Change Notice [Text Block] |
This report describes planned changes made to the Fund since the beginning of the reporting period.
|
| Additional Information Phone Number |
1-800-341-7400
|
| Additional Information Website |
FederatedHermes.com/us/FundInformation
|
| Expenses [Text Block] |
What were the Fund costs for the last year? (based on a hypothetical $10,000 investment) Class Name | Costs of a $10,000 investment | Costs paid as a percentage of a $10,000 investment |
|---|
Class A Shares | $101 | 0.97% |
|---|
|
| Expenses Paid, Amount |
$ 101
|
| Expense Ratio, Percent |
0.97%
|
| Factors Affecting Performance [Text Block] |
Management's Discussion of Fund PerformanceThe following discussion compares the performance of the Fund to the Bloomberg US Corporate High Yield 2% Issuer Capped Index (the “Index”) to show how the Fund’s performance compares to the returns of similar investments for the reporting period. See the Average Annual Total Returns table below for the returns of the Fund and related indexes including the Bloomberg US Aggregate Bond Index, which represents the overall U.S. fixed-income market. The Fund seeks high current income by investing primarily in a professionally managed, diversified portfolio of fixed-income securities rated below investment grade. Top Contributors to Performance The Fund was positively impacted by security selection in the Insurance-P&C, Consumer Cyclical Services, Healthcare, Diversified Manufacturing and Building Materials industry sectors. The Fund was positively impacted by its underweight allocation to the underperforming Wireless and Metals & Mining sectors as well as its overweight allocation to the outperforming Technology sector. Specific Fund holdings that positively impacted performance relative to the Index included: SRS Distribution, McAfee Corp., Allied Universal Holdco, Clydesdale Acquisition, AthenaHealth Group and Rocket Software.
Top Detractors from Performance The Fund was negatively impacted by security selection in the Media & Entertainment, Packaging, Electric, Technology and Auto industry sectors. The Fund was negatively impacted by its industry allocation, especially its underweight position in the strong performing Wireline Telecommunication sector. It was also negatively impacted by its overweight allocation to the underperforming Packaging and Auto sectors. The Fund’s opportunistic equity allocation also detracted from performance, as did the Fund’s cash position given the strong absolute performance of high yield bonds during the period. Specific Fund holdings that negatively impacted performance relative to the Index included: iHeartCommunications, Ardagh Packaging, Enviva Inc., CSC Holdings LLC and Dornoch Debt Merger Sub.
|
| Performance Past Does Not Indicate Future [Text] |
Keep in mind that the Fund’s past performance is not a good predictor of how the Fund will perform in the future.
|
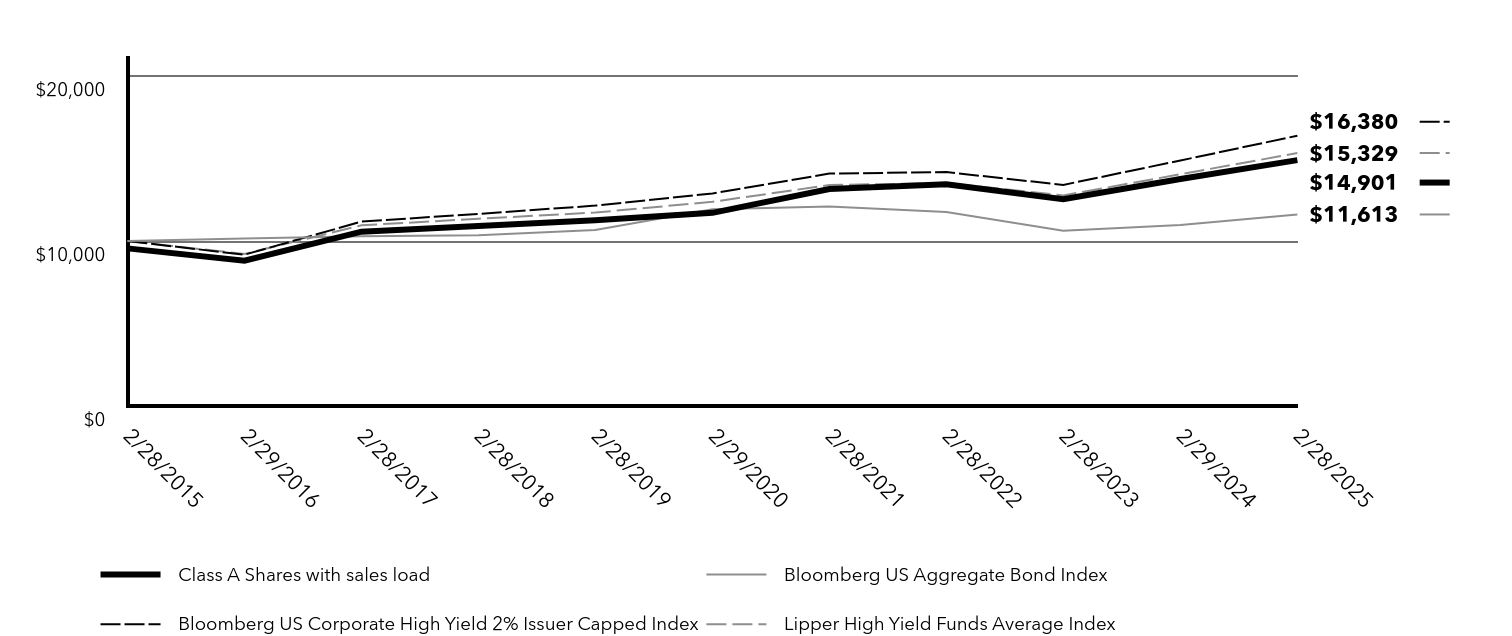
| Line Graph [Table Text Block] |
| Class A Shares with sales load | Bloomberg US Aggregate Bond Index | Bloomberg US Corporate High Yield 2% Issuer Capped Index | Lipper High Yield Funds Average Index |
|---|
2/28/2015 | $9,556 | $10,000 | $10,000 | $10,000 |
|---|
2/29/2016 | $8,811 | $10,150 | $9,174 | $9,220 |
|---|
2/28/2017 | $10,570 | $10,294 | $11,177 | $10,952 |
|---|
2/28/2018 | $10,909 | $10,346 | $11,644 | $11,352 |
|---|
2/28/2019 | $11,261 | $10,674 | $12,146 | $11,726 |
|---|
2/29/2020 | $11,709 | $11,921 | $12,886 | $12,377 |
|---|
2/28/2021 | $13,153 | $12,086 | $14,086 | $13,393 |
|---|
2/28/2022 | $13,439 | $11,766 | $14,175 | $13,512 |
|---|
2/28/2023 | $12,530 | $10,622 | $13,402 | $12,765 |
|---|
2/29/2024 | $13,762 | $10,976 | $14,878 | $14,046 |
|---|
2/28/2025 | $14,901 | $11,613 | $16,380 | $15,329 |
|---|
|
| Average Annual Return [Table Text Block] |
Fund/Index | 1 Year | 5 Years | 10 Years |
|---|
Class A Shares with sales load | 3.47% | 3.97% | 4.07% |
|---|
Class A Shares without sales load | 8.28% | 4.94% | 4.54% |
|---|
Bloomberg US Aggregate Bond IndexFootnote Reference* | 5.81% | (0.52%) | 1.51% |
|---|
Bloomberg US Corporate High Yield 2% Issuer Capped Index | 10.09% | 4.92% | 5.06% |
|---|
Lipper High Yield Funds Average Index | 9.13% | 4.35% | 4.24% |
|---|
|
| No Deduction of Taxes [Text Block] |
The graph and table do not reflect the deduction of taxes that a shareholder would pay on fund distributions or redemption of fund shares.
|
| Performance Table Market Index Changed [Text Block] |
The Fund has designated the Bloomberg US Aggregate Bond Index as the new broad-based securities market index in accordance with the SEC’s revised requirements for such an index.
|
| Updated Performance Information Location [Text Block] |
FederatedHermes.com/us/FundInformation
|
| AssetsNet |
$ 449,469,313
|
| Holdings Count | Holding |
478
|
| Advisory Fees Paid, Amount |
$ 2,461,119
|
| InvestmentCompanyPortfolioTurnover |
20.00%
|
| Additional Fund Statistics [Text Block] |
- Net Assets$449,469,313
- Number of Investments478
- Portfolio Turnover20%
- Total Advisory Fees Paid$2,461,119
|
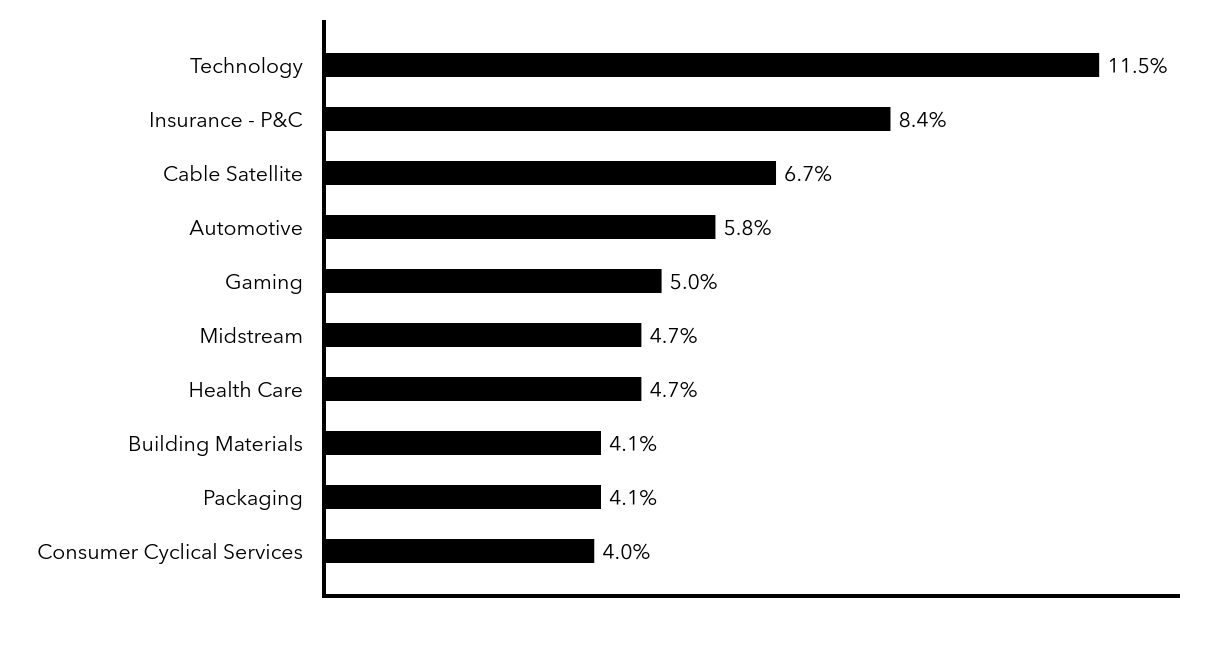
| Holdings [Text Block] |
Top Index Classifications (% of Net Assets)Value | Value |
|---|
Consumer Cyclical Services | 4.0% | Packaging | 4.1% | Building Materials | 4.1% | Health Care | 4.7% | Midstream | 4.7% | Gaming | 5.0% | Automotive | 5.8% | Cable Satellite | 6.7% | Insurance - P&C | 8.4% | Technology | 11.5% |
|
| Material Fund Change [Text Block] |
Following is a summary of material changes planned for the Fund since the beginning of the reporting period. For more complete and current information, you may review the Fund’s disclosure documents on its webpage at FederatedHermes.com/us/FundInformation or upon request at 1-800-341-7400, Option 4, or by contacting your financial advisor. Effective April 28, 2025, Kathryn P. Glass has been added to the Fund’s portfolio management team. |
| Summary of Change Legend [Text Block] |
Following is a summary of material changes planned for the Fund since the beginning of the reporting period. For more complete and current information, you may review the Fund’s disclosure documents on its webpage at FederatedHermes.com/us/FundInformation or upon request at 1-800-341-7400, Option 4, or by contacting your financial advisor. Effective April 28, 2025, Kathryn P. Glass has been added to the Fund’s portfolio management team.
|
| Updated Prospectus Phone Number |
1-800-341-7400
|
| Updated Prospectus Web Address |
<span style="box-sizing: border-box; color: rgb(0, 0, 0); display: inline; flex-wrap: nowrap; font-size: 12px; font-weight: 400; grid-area: auto; line-height: 18px; margin: 0px; overflow: visible; text-align: left; white-space-collapse: preserve-breaks;"><span style="text-decoration: underline solid rgb(0, 0, 0); box-sizing: border-box; color: rgb(0, 0, 0); display: inline; flex-wrap: nowrap; font-size: 12px; font-weight: 400; grid-area: auto; line-height: 18px; margin: 0px; overflow: visible; text-align: left; white-space-collapse: preserve-breaks;">FederatedHermes.com/us/FundInformation</span></span>
|
| C000143971 |
|
| Shareholder Report [Line Items] |
|
| Fund Name |
Federated Hermes Opportunistic High Yield Bond Fund
|
| Class Name |
Class C Shares
|
| Trading Symbol |
FHYCX
|
| Annual or Semi-Annual Statement [Text Block] |
This annual shareholder report contains important information about the Federated Hermes Opportunistic High Yield Bond Fund (the "Fund") for the period of March 1, 2024 to February 28, 2025.
|
| Shareholder Report Annual or Semi-Annual |
Annual Shareholder Report
|
| Additional Information [Text Block] |
You can find additional information at FederatedHermes.com/us/FundInformation. You can also request this information by contacting us at 1-800-341-7400, Option 4, or your financial advisor.
|
| Material Fund Change Notice [Text Block] |
This report describes planned changes made to the Fund since the beginning of the reporting period.
|
| Additional Information Phone Number |
1-800-341-7400
|
| Additional Information Website |
FederatedHermes.com/us/FundInformation
|
| Expenses [Text Block] |
What were the Fund costs for the last year? (based on a hypothetical $10,000 investment) Class Name | Costs of a $10,000 investment | Costs paid as a percentage of a $10,000 investment |
|---|
Class C Shares | $187 | 1.80% |
|---|
|
| Expenses Paid, Amount |
$ 187
|
| Expense Ratio, Percent |
1.80%
|
| Factors Affecting Performance [Text Block] |
Management's Discussion of Fund PerformanceThe following discussion compares the performance of the Fund to the Bloomberg US Corporate High Yield 2% Issuer Capped Index (the “Index”) to show how the Fund’s performance compares to the returns of similar investments for the reporting period. See the Average Annual Total Returns table below for the returns of the Fund and related indexes including the Bloomberg US Aggregate Bond Index, which represents the overall U.S. fixed-income market. The Fund seeks high current income by investing primarily in a professionally managed, diversified portfolio of fixed-income securities rated below investment grade. Top Contributors to Performance The Fund was positively impacted by security selection in the Insurance-P&C, Consumer Cyclical Services, Healthcare, Diversified Manufacturing and Building Materials industry sectors. The Fund was positively impacted by its underweight allocation to the underperforming Wireless and Metals & Mining sectors as well as its overweight allocation to the outperforming Technology sector. Specific Fund holdings that positively impacted performance relative to the Index included: SRS Distribution, McAfee Corp., Allied Universal Holdco, Clydesdale Acquisition, AthenaHealth Group and Rocket Software.
Top Detractors from Performance The Fund was negatively impacted by security selection in the Media & Entertainment, Packaging, Electric, Technology and Auto industry sectors. The Fund was negatively impacted by its industry allocation, especially its underweight position in the strong performing Wireline Telecommunication sector. It was also negatively impacted by its overweight allocation to the underperforming Packaging and Auto sectors. The Fund’s opportunistic equity allocation also detracted from performance, as did the Fund’s cash position given the strong absolute performance of high yield bonds during the period. Specific Fund holdings that negatively impacted performance relative to the Index included: iHeartCommunications, Ardagh Packaging, Enviva Inc., CSC Holdings LLC and Dornoch Debt Merger Sub.
|
| Performance Past Does Not Indicate Future [Text] |
Keep in mind that the Fund’s past performance is not a good predictor of how the Fund will perform in the future.
|
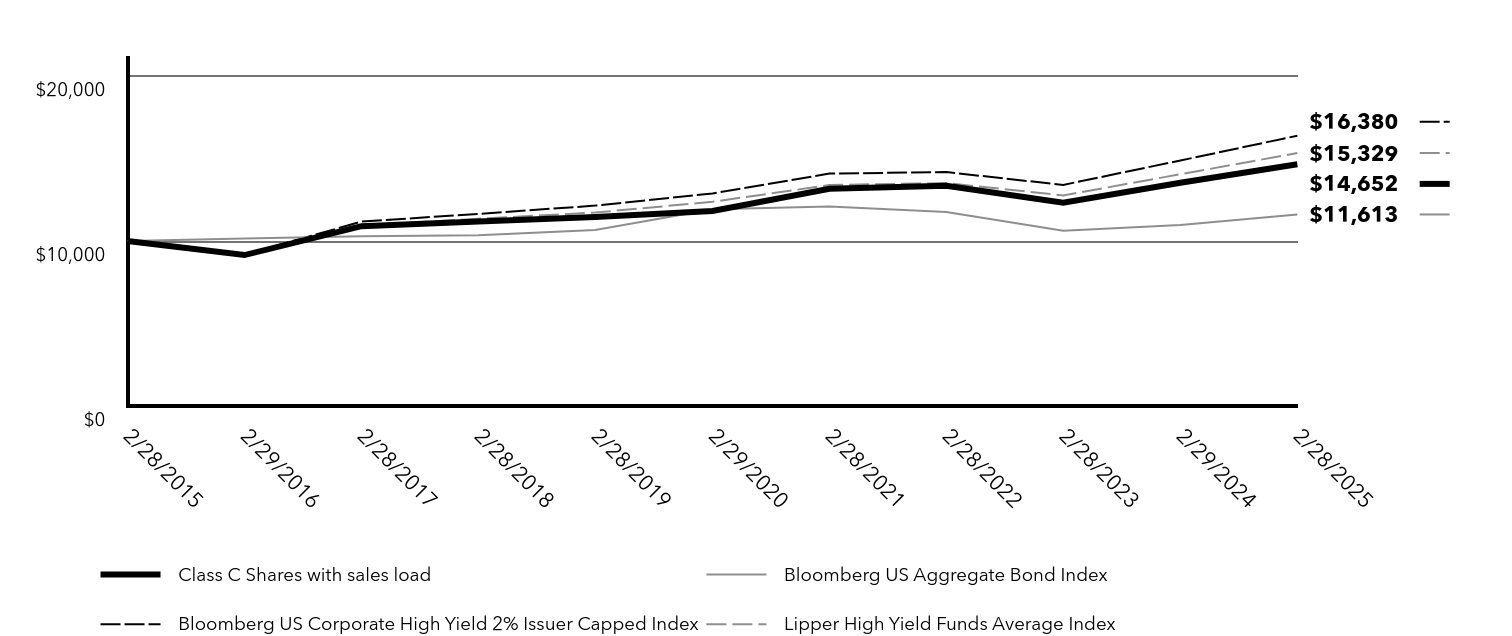
| Line Graph [Table Text Block] |
| Class C Shares with sales load | Bloomberg US Aggregate Bond Index | Bloomberg US Corporate High Yield 2% Issuer Capped Index | Lipper High Yield Funds Average Index |
|---|
2/28/2015 | $10,000 | $10,000 | $10,000 | $10,000 |
|---|
2/29/2016 | $9,152 | $10,150 | $9,174 | $9,220 |
|---|
2/28/2017 | $10,901 | $10,294 | $11,177 | $10,952 |
|---|
2/28/2018 | $11,182 | $10,346 | $11,644 | $11,352 |
|---|
2/28/2019 | $11,457 | $10,674 | $12,146 | $11,726 |
|---|
2/29/2020 | $11,817 | $11,921 | $12,886 | $12,377 |
|---|
2/28/2021 | $13,166 | $12,086 | $14,086 | $13,393 |
|---|
2/28/2022 | $13,345 | $11,766 | $14,175 | $13,512 |
|---|
2/28/2023 | $12,320 | $10,622 | $13,402 | $12,765 |
|---|
2/29/2024 | $13,532 | $10,976 | $14,878 | $14,046 |
|---|
2/28/2025 | $14,652 | $11,613 | $16,380 | $15,329 |
|---|
|
| Average Annual Return [Table Text Block] |
Fund/Index | 1 Year | 5 Years | 10 Years |
|---|
Class C Shares with sales load | 6.39% | 4.09% | 3.89% |
|---|
Class C Shares without sales load | 7.39% | 4.09% | 3.89% |
|---|
Bloomberg US Aggregate Bond IndexFootnote Reference* | 5.81% | (0.52%) | 1.51% |
|---|
Bloomberg US Corporate High Yield 2% Issuer Capped Index | 10.09% | 4.92% | 5.06% |
|---|
Lipper High Yield Funds Average Index | 9.13% | 4.35% | 4.24% |
|---|
|
| No Deduction of Taxes [Text Block] |
The graph and table do not reflect the deduction of taxes that a shareholder would pay on fund distributions or redemption of fund shares.
|
| Performance Table Market Index Changed [Text Block] |
The Fund has designated the Bloomberg US Aggregate Bond Index as the new broad-based securities market index in accordance with the SEC’s revised requirements for such an index.
|
| Updated Performance Information Location [Text Block] |
FederatedHermes.com/us/FundInformation
|
| AssetsNet |
$ 449,469,313
|
| Holdings Count | Holding |
478
|
| Advisory Fees Paid, Amount |
$ 2,461,119
|
| InvestmentCompanyPortfolioTurnover |
20.00%
|
| Additional Fund Statistics [Text Block] |
- Net Assets$449,469,313
- Number of Investments478
- Portfolio Turnover20%
- Total Advisory Fees Paid$2,461,119
|
| Holdings [Text Block] |
Top Index Classifications (% of Net Assets)Value | Value |
|---|
Consumer Cyclical Services | 4.0% | Packaging | 4.1% | Building Materials | 4.1% | Health Care | 4.7% | Midstream | 4.7% | Gaming | 5.0% | Automotive | 5.8% | Cable Satellite | 6.7% | Insurance - P&C | 8.4% | Technology | 11.5% |
|
| Material Fund Change [Text Block] |
Following is a summary of material changes planned for the Fund since the beginning of the reporting period. For more complete and current information, you may review the Fund’s disclosure documents on its webpage at FederatedHermes.com/us/FundInformation or upon request at 1-800-341-7400, Option 4, or by contacting your financial advisor. Effective April 28, 2025, Kathryn P. Glass has been added to the Fund’s portfolio management team. |
| Summary of Change Legend [Text Block] |
Following is a summary of material changes planned for the Fund since the beginning of the reporting period. For more complete and current information, you may review the Fund’s disclosure documents on its webpage at FederatedHermes.com/us/FundInformation or upon request at 1-800-341-7400, Option 4, or by contacting your financial advisor. Effective April 28, 2025, Kathryn P. Glass has been added to the Fund’s portfolio management team.
|
| Updated Prospectus Phone Number |
1-800-341-7400
|
| Updated Prospectus Web Address |
<span style="box-sizing: border-box; color: rgb(0, 0, 0); display: inline; flex-wrap: nowrap; font-size: 12px; font-weight: 400; grid-area: auto; line-height: 18px; margin: 0px; overflow: visible; text-align: left; white-space-collapse: preserve-breaks;"><span style="text-decoration: underline solid rgb(0, 0, 0); box-sizing: border-box; color: rgb(0, 0, 0); display: inline; flex-wrap: nowrap; font-size: 12px; font-weight: 400; grid-area: auto; line-height: 18px; margin: 0px; overflow: visible; text-align: left; white-space-collapse: preserve-breaks;">FederatedHermes.com/us/FundInformation</span></span>
|
| C000130168 |
|
| Shareholder Report [Line Items] |
|
| Fund Name |
Federated Hermes Opportunistic High Yield Bond Fund
|
| Class Name |
Institutional Shares
|
| Trading Symbol |
FHTIX
|
| Annual or Semi-Annual Statement [Text Block] |
This annual shareholder report contains important information about the Federated Hermes Opportunistic High Yield Bond Fund (the "Fund") for the period of March 1, 2024 to February 28, 2025.
|
| Shareholder Report Annual or Semi-Annual |
Annual Shareholder Report
|
| Additional Information [Text Block] |
You can find additional information at FederatedHermes.com/us/FundInformation. You can also request this information by contacting us at 1-800-341-7400, Option 4, or your financial advisor.
|
| Material Fund Change Notice [Text Block] |
This report describes planned changes made to the Fund since the beginning of the reporting period.
|
| Additional Information Phone Number |
1-800-341-7400
|
| Additional Information Website |
FederatedHermes.com/us/FundInformation
|
| Expenses [Text Block] |
What were the Fund costs for the last year? (based on a hypothetical $10,000 investment) Class Name | Costs of a $10,000 investment | Costs paid as a percentage of a $10,000 investment |
|---|
Institutional Shares | $75 | 0.72% |
|---|
|
| Expenses Paid, Amount |
$ 75
|
| Expense Ratio, Percent |
0.72%
|
| Factors Affecting Performance [Text Block] |
Management's Discussion of Fund PerformanceThe following discussion compares the performance of the Fund to the Bloomberg US Corporate High Yield 2% Issuer Capped Index (the “Index”) to show how the Fund’s performance compares to the returns of similar investments for the reporting period. See the Average Annual Total Returns table below for the returns of the Fund and related indexes including the Bloomberg US Aggregate Bond Index, which represents the overall U.S. fixed-income market. The Fund seeks high current income by investing primarily in a professionally managed, diversified portfolio of fixed-income securities rated below investment grade. Top Contributors to Performance The Fund was positively impacted by security selection in the Insurance-P&C, Consumer Cyclical Services, Healthcare, Diversified Manufacturing and Building Materials industry sectors. The Fund was positively impacted by its underweight allocation to the underperforming Wireless and Metals & Mining sectors as well as its overweight allocation to the outperforming Technology sector. Specific Fund holdings that positively impacted performance relative to the Index included: SRS Distribution, McAfee Corp., Allied Universal Holdco, Clydesdale Acquisition, AthenaHealth Group and Rocket Software.
Top Detractors from Performance The Fund was negatively impacted by security selection in the Media & Entertainment, Packaging, Electric, Technology and Auto industry sectors. The Fund was negatively impacted by its industry allocation, especially its underweight position in the strong performing Wireline Telecommunication sector. It was also negatively impacted by its overweight allocation to the underperforming Packaging and Auto sectors. The Fund’s opportunistic equity allocation also detracted from performance, as did the Fund’s cash position given the strong absolute performance of high yield bonds during the period. Specific Fund holdings that negatively impacted performance relative to the Index included: iHeartCommunications, Ardagh Packaging, Enviva Inc., CSC Holdings LLC and Dornoch Debt Merger Sub.
|
| Performance Past Does Not Indicate Future [Text] |
Keep in mind that the Fund’s past performance is not a good predictor of how the Fund will perform in the future.
|
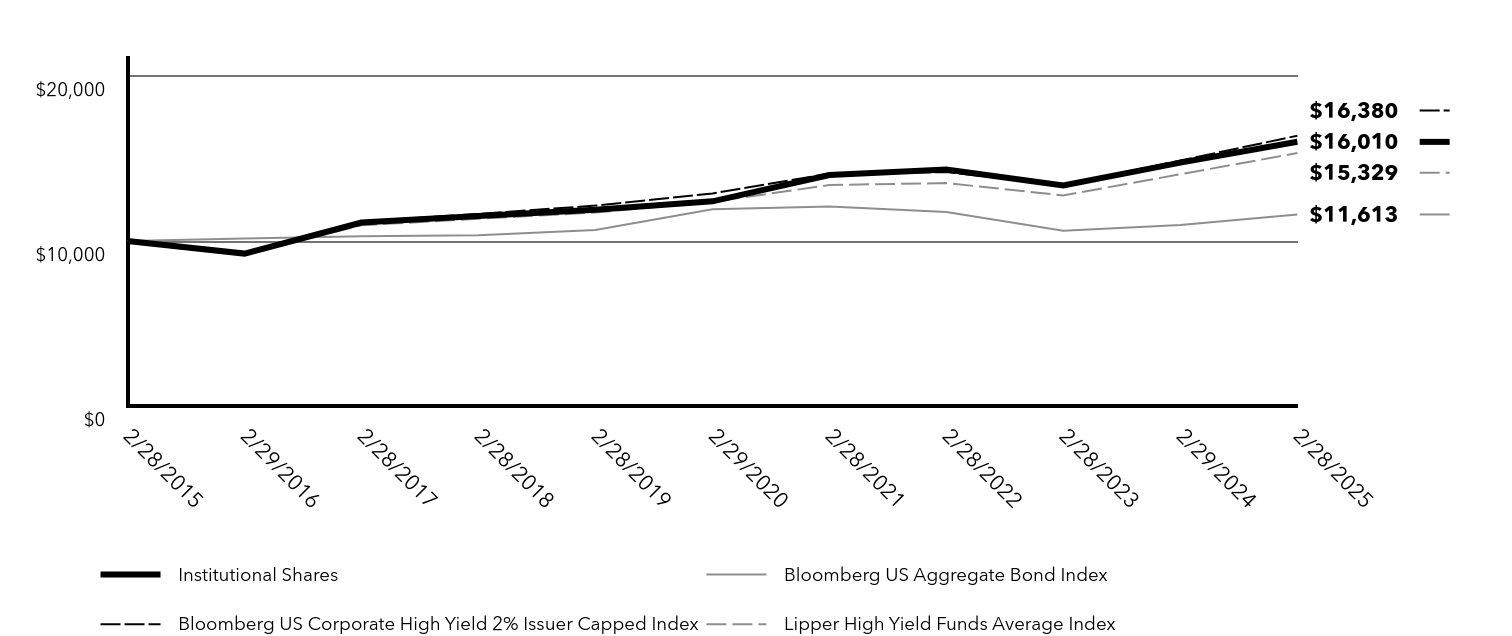
| Line Graph [Table Text Block] |
| Institutional Shares | Bloomberg US Aggregate Bond Index | Bloomberg US Corporate High Yield 2% Issuer Capped Index | Lipper High Yield Funds Average Index |
|---|
2/28/2015 | $10,000 | $10,000 | $10,000 | $10,000 |
|---|
2/29/2016 | $9,240 | $10,150 | $9,174 | $9,220 |
|---|
2/28/2017 | $11,119 | $10,294 | $11,177 | $10,952 |
|---|
2/28/2018 | $11,519 | $10,346 | $11,644 | $11,352 |
|---|
2/28/2019 | $11,902 | $10,674 | $12,146 | $11,726 |
|---|
2/29/2020 | $12,405 | $11,921 | $12,886 | $12,377 |
|---|
2/28/2021 | $13,994 | $12,086 | $14,086 | $13,393 |
|---|
2/28/2022 | $14,333 | $11,766 | $14,175 | $13,512 |
|---|
2/28/2023 | $13,370 | $10,622 | $13,402 | $12,765 |
|---|
2/29/2024 | $14,748 | $10,976 | $14,878 | $14,046 |
|---|
2/28/2025 | $16,010 | $11,613 | $16,380 | $15,329 |
|---|
|
| Average Annual Return [Table Text Block] |
Fund/Index | 1 Year | 5 Years | 10 Years |
|---|
Institutional Shares | 8.56% | 5.23% | 4.82% |
|---|
Bloomberg US Aggregate Bond IndexFootnote Reference* | 5.81% | (0.52%) | 1.51% |
|---|
Bloomberg US Corporate High Yield 2% Issuer Capped Index | 10.09% | 4.92% | 5.06% |
|---|
Lipper High Yield Funds Average Index | 9.13% | 4.35% | 4.24% |
|---|
|
| No Deduction of Taxes [Text Block] |
The graph and table do not reflect the deduction of taxes that a shareholder would pay on fund distributions or redemption of fund shares.
|
| Performance Table Market Index Changed [Text Block] |
The Fund has designated the Bloomberg US Aggregate Bond Index as the new broad-based securities market index in accordance with the SEC’s revised requirements for such an index.
|
| Updated Performance Information Location [Text Block] |
FederatedHermes.com/us/FundInformation
|
| AssetsNet |
$ 449,469,313
|
| Holdings Count | Holding |
478
|
| Advisory Fees Paid, Amount |
$ 2,461,119
|
| InvestmentCompanyPortfolioTurnover |
20.00%
|
| Additional Fund Statistics [Text Block] |
- Net Assets$449,469,313
- Number of Investments478
- Portfolio Turnover20%
- Total Advisory Fees Paid$2,461,119
|
| Holdings [Text Block] |
Top Index Classifications (% of Net Assets)Value | Value |
|---|
Consumer Cyclical Services | 4.0% | Packaging | 4.1% | Building Materials | 4.1% | Health Care | 4.7% | Midstream | 4.7% | Gaming | 5.0% | Automotive | 5.8% | Cable Satellite | 6.7% | Insurance - P&C | 8.4% | Technology | 11.5% |
|
| Material Fund Change [Text Block] |
Following is a summary of material changes planned for the Fund since the beginning of the reporting period. For more complete and current information, you may review the Fund’s disclosure documents on its webpage at FederatedHermes.com/us/FundInformation or upon request at 1-800-341-7400, Option 4, or by contacting your financial advisor. Effective April 28, 2025, Kathryn P. Glass has been added to the Fund’s portfolio management team. |
| Summary of Change Legend [Text Block] |
Following is a summary of material changes planned for the Fund since the beginning of the reporting period. For more complete and current information, you may review the Fund’s disclosure documents on its webpage at FederatedHermes.com/us/FundInformation or upon request at 1-800-341-7400, Option 4, or by contacting your financial advisor. Effective April 28, 2025, Kathryn P. Glass has been added to the Fund’s portfolio management team.
|
| Updated Prospectus Phone Number |
1-800-341-7400
|
| Updated Prospectus Web Address |
<span style="box-sizing: border-box; color: rgb(0, 0, 0); display: inline; flex-wrap: nowrap; font-size: 12px; font-weight: 400; grid-area: auto; line-height: 18px; margin: 0px; overflow: visible; text-align: left; white-space-collapse: preserve-breaks;"><span style="text-decoration: underline solid rgb(0, 0, 0); box-sizing: border-box; color: rgb(0, 0, 0); display: inline; flex-wrap: nowrap; font-size: 12px; font-weight: 400; grid-area: auto; line-height: 18px; margin: 0px; overflow: visible; text-align: left; white-space-collapse: preserve-breaks;">FederatedHermes.com/us/FundInformation</span></span>
|
| C000190443 |
|
| Shareholder Report [Line Items] |
|
| Fund Name |
Federated Hermes Opportunistic High Yield Bond Fund
|
| Class Name |
Class R6 Shares
|
| Trading Symbol |
FHYLX
|
| Annual or Semi-Annual Statement [Text Block] |
This annual shareholder report contains important information about the Federated Hermes Opportunistic High Yield Bond Fund (the "Fund") for the period of March 1, 2024 to February 28, 2025.
|
| Shareholder Report Annual or Semi-Annual |
Annual Shareholder Report
|
| Additional Information [Text Block] |
You can find additional information at FederatedHermes.com/us/FundInformation. You can also request this information by contacting us at 1-800-341-7400, Option 4, or your financial advisor.
|
| Material Fund Change Notice [Text Block] |
This report describes planned changes made to the Fund since the beginning of the reporting period.
|
| Additional Information Phone Number |
1-800-341-7400
|
| Additional Information Website |
FederatedHermes.com/us/FundInformation
|
| Expenses [Text Block] |
What were the Fund costs for the last year? (based on a hypothetical $10,000 investment) Class Name | Costs of a $10,000 investment | Costs paid as a percentage of a $10,000 investment |
|---|
Class R6 Shares | $74 | 0.71% |
|---|
|
| Expenses Paid, Amount |
$ 74
|
| Expense Ratio, Percent |
0.71%
|
| Factors Affecting Performance [Text Block] |
Management's Discussion of Fund PerformanceThe following discussion compares the performance of the Fund to the Bloomberg US Corporate High Yield 2% Issuer Capped Index (the “Index”) to show how the Fund’s performance compares to the returns of similar investments for the reporting period. See the Average Annual Total Returns table below for the returns of the Fund and related indexes including the Bloomberg US Aggregate Bond Index, which represents the overall U.S. fixed-income market. The Fund seeks high current income by investing primarily in a professionally managed, diversified portfolio of fixed-income securities rated below investment grade. Top Contributors to Performance The Fund was positively impacted by security selection in the Insurance-P&C, Consumer Cyclical Services, Healthcare, Diversified Manufacturing and Building Materials industry sectors. The Fund was positively impacted by its underweight allocation to the underperforming Wireless and Metals & Mining sectors as well as its overweight allocation to the outperforming Technology sector. Specific Fund holdings that positively impacted performance relative to the Index included: SRS Distribution, McAfee Corp., Allied Universal Holdco, Clydesdale Acquisition, AthenaHealth Group and Rocket Software.
Top Detractors from Performance The Fund was negatively impacted by security selection in the Media & Entertainment, Packaging, Electric, Technology and Auto industry sectors. The Fund was negatively impacted by its industry allocation, especially its underweight position in the strong performing Wireline Telecommunication sector. It was also negatively impacted by its overweight allocation to the underperforming Packaging and Auto sectors. The Fund’s opportunistic equity allocation also detracted from performance, as did the Fund’s cash position given the strong absolute performance of high yield bonds during the period. Specific Fund holdings that negatively impacted performance relative to the Index included: iHeartCommunications, Ardagh Packaging, Enviva Inc., CSC Holdings LLC and Dornoch Debt Merger Sub.
|
| Performance Past Does Not Indicate Future [Text] |
Keep in mind that the Fund’s past performance is not a good predictor of how the Fund will perform in the future.
|
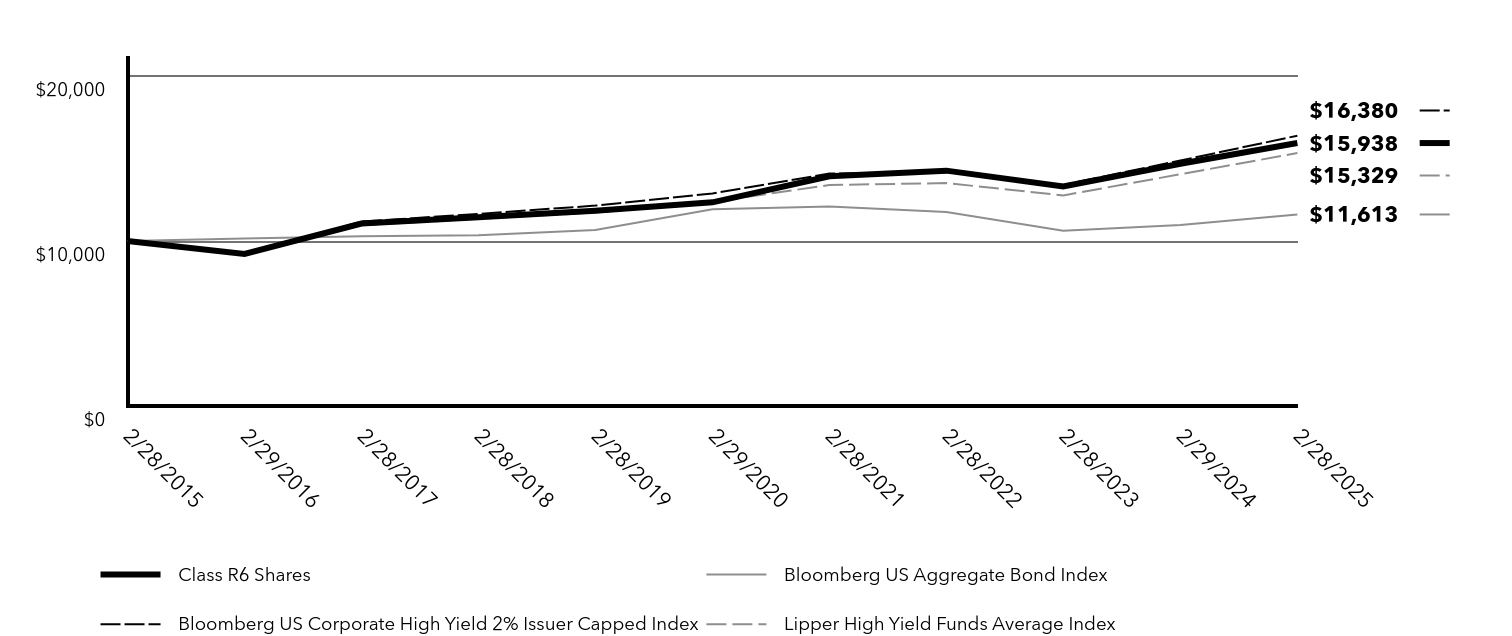
| Line Graph [Table Text Block] |
| Class R6 Shares | Bloomberg US Aggregate Bond Index | Bloomberg US Corporate High Yield 2% Issuer Capped Index | Lipper High Yield Funds Average Index |
|---|
2/28/2015 | $10,000 | $10,000 | $10,000 | $10,000 |
|---|
2/29/2016 | $9,218 | $10,150 | $9,174 | $9,220 |
|---|
2/28/2017 | $11,064 | $10,294 | $11,177 | $10,952 |
|---|
2/28/2018 | $11,442 | $10,346 | $11,644 | $11,352 |
|---|
2/28/2019 | $11,841 | $10,674 | $12,146 | $11,726 |
|---|
2/29/2020 | $12,344 | $11,921 | $12,886 | $12,377 |
|---|
2/28/2021 | $13,924 | $12,086 | $14,086 | $13,393 |
|---|
2/28/2022 | $14,264 | $11,766 | $14,175 | $13,512 |
|---|
2/28/2023 | $13,309 | $10,622 | $13,402 | $12,765 |
|---|
2/29/2024 | $14,681 | $10,976 | $14,878 | $14,046 |
|---|
2/28/2025 | $15,938 | $11,613 | $16,380 | $15,329 |
|---|
|
| Average Annual Return [Table Text Block] |
Fund/Index | 1 Year | 5 Years | 10 Years |
|---|
Class R6 Shares | 8.56% | 5.24% | 4.77% |
|---|
Bloomberg US Aggregate Bond IndexFootnote Reference* | 5.81% | (0.52%) | 1.51% |
|---|
Bloomberg US Corporate High Yield 2% Issuer Capped Index | 10.09% | 4.92% | 5.06% |
|---|
Lipper High Yield Funds Average Index | 9.13% | 4.35% | 4.24% |
|---|
|
| No Deduction of Taxes [Text Block] |
The graph and table do not reflect the deduction of taxes that a shareholder would pay on fund distributions or redemption of fund shares.
|
| Performance Table Market Index Changed [Text Block] |
The Fund has designated the Bloomberg US Aggregate Bond Index as the new broad-based securities market index in accordance with the SEC’s revised requirements for such an index.
|
| Updated Performance Information Location [Text Block] |
FederatedHermes.com/us/FundInformation
|
| AssetsNet |
$ 449,469,313
|
| Holdings Count | Holding |
478
|
| Advisory Fees Paid, Amount |
$ 2,461,119
|
| InvestmentCompanyPortfolioTurnover |
20.00%
|
| Additional Fund Statistics [Text Block] |
- Net Assets$449,469,313
- Number of Investments478
- Portfolio Turnover20%
- Total Advisory Fees Paid$2,461,119
|
| Holdings [Text Block] |
Top Index Classifications (% of Net Assets)Value | Value |
|---|
Consumer Cyclical Services | 4.0% | Packaging | 4.1% | Building Materials | 4.1% | Health Care | 4.7% | Midstream | 4.7% | Gaming | 5.0% | Automotive | 5.8% | Cable Satellite | 6.7% | Insurance - P&C | 8.4% | Technology | 11.5% |
|
| Material Fund Change [Text Block] |
Following is a summary of material changes planned for the Fund since the beginning of the reporting period. For more complete and current information, you may review the Fund’s disclosure documents on its webpage at FederatedHermes.com/us/FundInformation or upon request at 1-800-341-7400, Option 4, or by contacting your financial advisor. Effective April 28, 2025, Kathryn P. Glass has been added to the Fund’s portfolio management team. |
| Summary of Change Legend [Text Block] |
Following is a summary of material changes planned for the Fund since the beginning of the reporting period. For more complete and current information, you may review the Fund’s disclosure documents on its webpage at FederatedHermes.com/us/FundInformation or upon request at 1-800-341-7400, Option 4, or by contacting your financial advisor. Effective April 28, 2025, Kathryn P. Glass has been added to the Fund’s portfolio management team.
|
| Updated Prospectus Phone Number |
1-800-341-7400
|
| Updated Prospectus Web Address |
<span style="box-sizing: border-box; color: rgb(0, 0, 0); display: inline; flex-wrap: nowrap; font-size: 12px; font-weight: 400; grid-area: auto; line-height: 18px; margin: 0px; overflow: visible; text-align: left; white-space-collapse: preserve-breaks;"><span style="text-decoration: underline solid rgb(0, 0, 0); box-sizing: border-box; color: rgb(0, 0, 0); display: inline; flex-wrap: nowrap; font-size: 12px; font-weight: 400; grid-area: auto; line-height: 18px; margin: 0px; overflow: visible; text-align: left; white-space-collapse: preserve-breaks;">FederatedHermes.com/us/FundInformation</span></span>
|
| C000024613 |
|
| Shareholder Report [Line Items] |
|
| Fund Name |
Federated Hermes Opportunistic High Yield Bond Fund
|
| Class Name |
Service Shares
|
| Trading Symbol |
FHYTX
|
| Annual or Semi-Annual Statement [Text Block] |
This annual shareholder report contains important information about the Federated Hermes Opportunistic High Yield Bond Fund (the "Fund") for the period of March 1, 2024 to February 28, 2025.
|
| Shareholder Report Annual or Semi-Annual |
Annual Shareholder Report
|
| Additional Information [Text Block] |
You can find additional information at FederatedHermes.com/us/FundInformation. You can also request this information by contacting us at 1-800-341-7400, Option 4, or your financial advisor.
|
| Material Fund Change Notice [Text Block] |
This report describes planned changes made to the Fund since the beginning of the reporting period.
|
| Additional Information Phone Number |
1-800-341-7400
|
| Additional Information Website |
FederatedHermes.com/us/FundInformation
|
| Expenses [Text Block] |
What were the Fund costs for the last year? (based on a hypothetical $10,000 investment) Class Name | Costs of a $10,000 investment | Costs paid as a percentage of a $10,000 investment |
|---|
Service Shares | $101 | 0.97% |
|---|
|
| Expenses Paid, Amount |
$ 101
|
| Expense Ratio, Percent |
0.97%
|
| Factors Affecting Performance [Text Block] |
Management's Discussion of Fund PerformanceThe following discussion compares the performance of the Fund to the Bloomberg US Corporate High Yield 2% Issuer Capped Index (the “Index”) to show how the Fund’s performance compares to the returns of similar investments for the reporting period. See the Average Annual Total Returns table below for the returns of the Fund and related indexes including the Bloomberg US Aggregate Bond Index, which represents the overall U.S. fixed-income market. The Fund seeks high current income by investing primarily in a professionally managed, diversified portfolio of fixed-income securities rated below investment grade. Top Contributors to Performance The Fund was positively impacted by security selection in the Insurance-P&C, Consumer Cyclical Services, Healthcare, Diversified Manufacturing and Building Materials industry sectors. The Fund was positively impacted by its underweight allocation to the underperforming Wireless and Metals & Mining sectors as well as its overweight allocation to the outperforming Technology sector. Specific Fund holdings that positively impacted performance relative to the Index included: SRS Distribution, McAfee Corp., Allied Universal Holdco, Clydesdale Acquisition, AthenaHealth Group and Rocket Software.
Top Detractors from Performance The Fund was negatively impacted by security selection in the Media & Entertainment, Packaging, Electric, Technology and Auto industry sectors. The Fund was negatively impacted by its industry allocation, especially its underweight position in the strong performing Wireline Telecommunication sector. It was also negatively impacted by its overweight allocation to the underperforming Packaging and Auto sectors. The Fund’s opportunistic equity allocation also detracted from performance, as did the Fund’s cash position given the strong absolute performance of high yield bonds during the period. Specific Fund holdings that negatively impacted performance relative to the Index included: iHeartCommunications, Ardagh Packaging, Enviva Inc., CSC Holdings LLC and Dornoch Debt Merger Sub.
|
| Performance Past Does Not Indicate Future [Text] |
Keep in mind that the Fund’s past performance is not a good predictor of how the Fund will perform in the future.
|
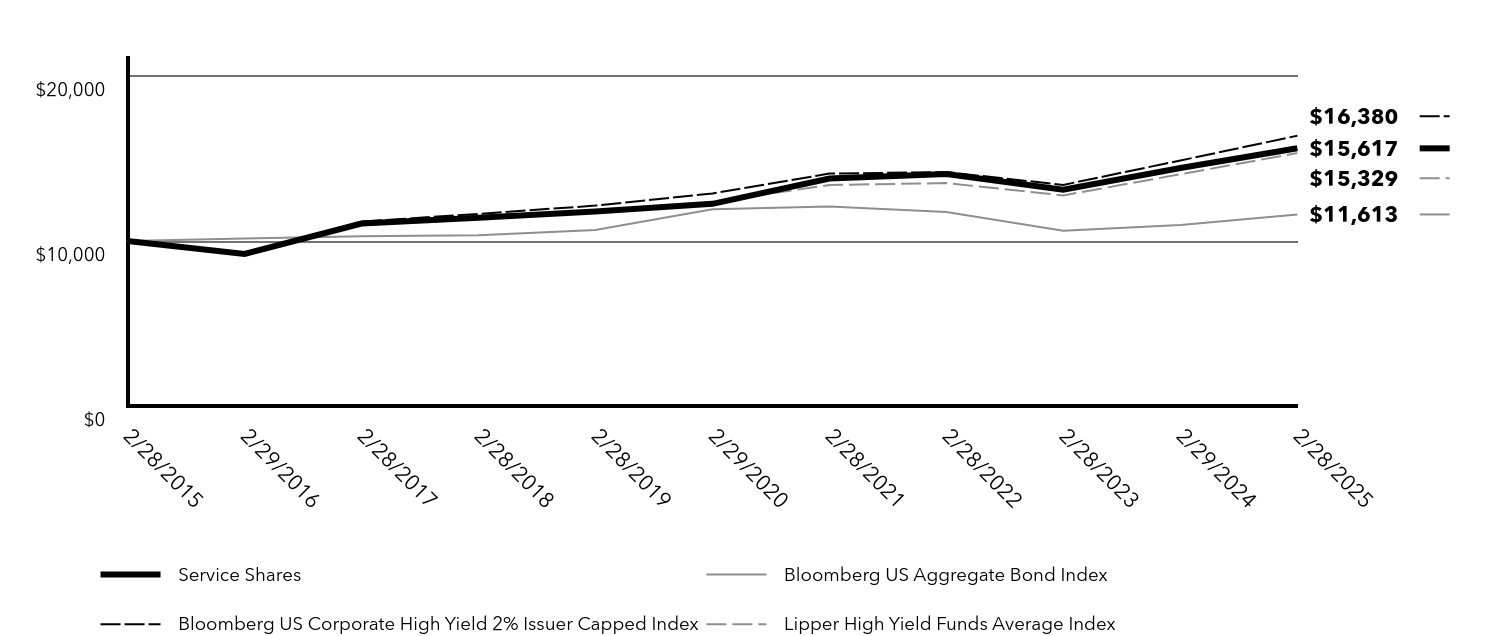
| Line Graph [Table Text Block] |
| Service Shares | Bloomberg US Aggregate Bond Index | Bloomberg US Corporate High Yield 2% Issuer Capped Index | Lipper High Yield Funds Average Index |
|---|
2/28/2015 | $10,000 | $10,000 | $10,000 | $10,000 |
|---|
2/29/2016 | $9,218 | $10,150 | $9,174 | $9,220 |
|---|
2/28/2017 | $11,064 | $10,294 | $11,177 | $10,952 |
|---|
2/28/2018 | $11,417 | $10,346 | $11,644 | $11,352 |
|---|
2/28/2019 | $11,785 | $10,674 | $12,146 | $11,726 |
|---|
2/29/2020 | $12,253 | $11,921 | $12,886 | $12,377 |
|---|
2/28/2021 | $13,786 | $12,086 | $14,086 | $13,393 |
|---|
2/28/2022 | $14,065 | $11,766 | $14,175 | $13,512 |
|---|
2/28/2023 | $13,109 | $10,622 | $13,402 | $12,765 |
|---|
2/29/2024 | $14,423 | $10,976 | $14,878 | $14,046 |
|---|
2/28/2025 | $15,617 | $11,613 | $16,380 | $15,329 |
|---|
|
| Average Annual Return [Table Text Block] |
Fund/Index | 1 Year | 5 Years | 10 Years |
|---|
Service Shares | 8.28% | 4.97% | 4.56% |
|---|
Bloomberg US Aggregate Bond IndexFootnote Reference* | 5.81% | (0.52%) | 1.51% |
|---|
Bloomberg US Corporate High Yield 2% Issuer Capped Index | 10.09% | 4.92% | 5.06% |
|---|
Lipper High Yield Funds Average Index | 9.13% | 4.35% | 4.24% |
|---|
|
| No Deduction of Taxes [Text Block] |
The graph and table do not reflect the deduction of taxes that a shareholder would pay on fund distributions or redemption of fund shares.
|
| Performance Table Market Index Changed [Text Block] |
The Fund has designated the Bloomberg US Aggregate Bond Index as the new broad-based securities market index in accordance with the SEC’s revised requirements for such an index.
|
| Updated Performance Information Location [Text Block] |
FederatedHermes.com/us/FundInformation
|
| AssetsNet |
$ 449,469,313
|
| Holdings Count | Holding |
478
|
| Advisory Fees Paid, Amount |
$ 2,461,119
|
| InvestmentCompanyPortfolioTurnover |
20.00%
|
| Additional Fund Statistics [Text Block] |
- Net Assets$449,469,313
- Number of Investments478
- Portfolio Turnover20%
- Total Advisory Fees Paid$2,461,119
|
| Holdings [Text Block] |
Top Index Classifications (% of Net Assets)Value | Value |
|---|
Consumer Cyclical Services | 4.0% | Packaging | 4.1% | Building Materials | 4.1% | Health Care | 4.7% | Midstream | 4.7% | Gaming | 5.0% | Automotive | 5.8% | Cable Satellite | 6.7% | Insurance - P&C | 8.4% | Technology | 11.5% |
|
| Material Fund Change [Text Block] |
Following is a summary of material changes planned for the Fund since the beginning of the reporting period. For more complete and current information, you may review the Fund’s disclosure documents on its webpage at FederatedHermes.com/us/FundInformation or upon request at 1-800-341-7400, Option 4, or by contacting your financial advisor. Effective April 28, 2025, Kathryn P. Glass has been added to the Fund’s portfolio management team. |
| Summary of Change Legend [Text Block] |
Following is a summary of material changes planned for the Fund since the beginning of the reporting period. For more complete and current information, you may review the Fund’s disclosure documents on its webpage at FederatedHermes.com/us/FundInformation or upon request at 1-800-341-7400, Option 4, or by contacting your financial advisor. Effective April 28, 2025, Kathryn P. Glass has been added to the Fund’s portfolio management team.
|
| Updated Prospectus Phone Number |
1-800-341-7400
|
| Updated Prospectus Web Address |
<span style="box-sizing: border-box; color: rgb(0, 0, 0); display: inline; flex-wrap: nowrap; font-size: 12px; font-weight: 400; grid-area: auto; line-height: 18px; margin: 0px; overflow: visible; text-align: left; white-space-collapse: preserve-breaks;"><span style="text-decoration: underline solid rgb(0, 0, 0); box-sizing: border-box; color: rgb(0, 0, 0); display: inline; flex-wrap: nowrap; font-size: 12px; font-weight: 400; grid-area: auto; line-height: 18px; margin: 0px; overflow: visible; text-align: left; white-space-collapse: preserve-breaks;">FederatedHermes.com/us/FundInformation</span></span>
|