Pay versus Performance | ||||||||||
| As required by SEC rules, we are providing the following information about the relationship between executive compensation actually paid and certain financial performance of the Company. For further information concerning the Company’s variable pay-for-performance philosophy and how the Company’s aligns executive compensation with the Company’s performance, refer to “Executive Compensation – Compensation Discussion and Analysis.” | ||||||||||
Year |
Summary
Compensation |
Compensation
|
Average |
Average
|
Value
of Initial Fixed $100 Investment Based On: |
Net
Income |
ROE8 | |||
Total |
Peer
Group Total Stockholder Return6 | |||||||||
| (a) | (b) | (c) | (d) | (e) | (f) | (g) | (h) | (i) | ||
| 2024 | $6,790,329 |
$6,882,085 |
$1,430,280 | $1,376,965 | 73.80 | 59.73 | $176,065 | 23.6% | ||
| 2023 | $6,146,878 | $6,076,344 | $3,537,948 | $3,628,018 | 28.78 | 62.71 | $126,104 | 13.2% | ||
|
20229 |
Marria | Kardis | Marria | Kardis | $4,041,414 | $2,587,076 | 30.56 | 58.46 | $(513,066) | 15.0% |
| $7,481,461 | $5,944,178 | $4,858,627 | $3,687,845 | |||||||
|
202110 |
$11,976,596 | $16,003,134 | $6,517,304 | $8,035,188 | 76.04 | 82.47 | $674,519 | 17.7% | ||
|
202011 |
$9,403,448 | $5,693,046 | $5,370,904 | $3,524,918 | 51.25 | 74.01 | $89,012 | 30.7% | ||
| 2 | The dollar amounts reported in column (c) represent the amount of “compensation actually paid” to the relevant PEO during the applicable year as computed in accordance with SEC rules. The dollar amounts do not reflect the actual amount of compensation earned by or paid to the relevant PEO during the applicable year. In accordance with SEC rules, the following adjustments were made to the relevant PEO’s total compensation for each year to determine the compensation actually paid: |
| Year | Reported Summary Compensation Table Total for PEO |
Minus
Reported Value of Equity Awards(a) |
Plus Equity Award Adjustments(b) |
Compensation Actually Paid to PEO | ||||
| 2024 | $6,790,329 | $2,617,466 | $2,709,222 | $6,882,085 | ||||
| 2023 | $6,146,878 | $2,670,453 | $2,599,919 | $6,076,344 | ||||
| 2022 |
Marria $7,481,461 |
Kardis $5,944,178 |
Marria $1,478,127 |
Kardis $1,463,378 |
Marria $(1,144,708) |
Kardis $(792,955) |
Marria $4,858,627 |
Kardis $3,687,845 |
| 2021 | $11,976,596 | $6,583,196 | $10,609,734 | $16,003,134 | ||||
| 2020 | $9,403,448 | $2,614,848 | $(1,095,554) | $5,693,046 | ||||
| 4 | The dollar amounts reported in column (e) represent the average amount of “compensation actually paid” to the NEOs as a group (excluding the relevant PEO for the applicable year), as computed in accordance with SEC rules. The dollar amounts do not reflect the actual average amount of compensation earned by or paid to the NEOs as a group (excluding the relevant PEO for the applicable year) during the applicable year. In accordance with SEC rules, the following adjustments were made to average total compensation for the NEOs as a group (excluding the relevant PEO for the applicable year) for each year to determine the compensation actually paid, using the same methodology described above in Note 2: |
|
Year |
Average |
Minus
|
Plus |
Average
|
| 2024 | $1,430,280 | $504,801 | $451,486 | $1,376,965 |
| 2023 | $3,537,948 | $1,538,956 | $1,629,026 | $3,628,018 |
| 2022 | $4,041,414 | $(954,881) | $(499,458) | $2,587,076 |
| 2021 | $6,517,304 | $(2,510,013) | $4,027,897 | $8,035,188 |
| 2020 | $5,370,904 | $(1,425,554) | $(420,432) | $3,524,918 |
| (a) | The grant date fair value of equity awards represents the total of the amounts reported in the “Stock Awards” column in the Summary Compensation Table for the applicable year. | |
| (b) | The equity award adjustments for each applicable year include the addition (or subtraction, as applicable) of the following: (i) the year-end fair value of any equity awards granted in the applicable year that are outstanding and unvested as of the end of the year; (ii) the amount of change as of the end of the applicable year (from the end of the prior fiscal year) in fair value of any awards granted in prior years that are outstanding and unvested as of the end of the applicable year; (iii) for awards that are granted and vest in same applicable year, the fair value as of the vesting date; (iv) for awards granted in prior years that vest in the applicable year, the amount equal to the change as of the vesting date (from the end of the prior fiscal year) in fair value; (v) for awards granted in prior years that are determined to fail to meet the applicable vesting conditions during the applicable year, a deduction for the amount equal to the fair value at the end of the prior fiscal year; and (vi) the dollar value of any dividends or other earnings paid on stock or option awards in the applicable year prior to the vesting date that are not otherwise reflected in the fair value of such award or included in any other component of total compensation for the applicable year. The valuation assumptions used to calculate fair values did not materially differ from those disclosed at the time of grant. The amounts deducted or added in calculating the equity award adjustments are as follows: |
| Value of | ||||||||||||||
| Dividends or | ||||||||||||||
| Year End | Year over | other Earnings | ||||||||||||
| Fair Value of | Year over | Year Change | Fair Value at the | Paid on Stock | ||||||||||
| Equity | Year Change | Fair Value as | in Fair Value | End of the Prior | or Option | |||||||||
| Awards | in Fair Value | of Vesting | of Equity | Year of Equity | Awards not | |||||||||
| Granted in | of | Date of Equity | Awards | Awards that | Otherwise | |||||||||
| the Year and | Outstanding | Awards | Granted in | Failed to Meet | Reflected in | Total | ||||||||
| Unvested at | and Unvested | Granted and | Prior Years | Vesting | Fair Value or | Equity | ||||||||
| End of the | Equity | Vested in the | that Vested in | Conditions in | Total | Award | ||||||||
| Year | Year | Awards | Year | the Year | the Year | Compensation | Adjustments | |||||||
| 2024 | $2,290,712 | $93,168 | $450,284 | $(124,942) | $2,709,222 | |||||||||
| 2023 | $2,087,683 | $65,259 | $417,537 | $29,440 | $2,599,919 | |||||||||
| 2022 |
Marria $239,811 |
Kardis $237,418 |
Marria $(1,369,241) |
Kardis $(1,006,065) |
Marria |
Kardis |
Marria $(15,278) |
Kardis $(24,309) |
Marria |
Kardis |
Marria |
Kardis |
Marria $(1,144,708) |
Kardis $(792,955) |
| 2021 | $9,677,612 | $824,805 | $107,317 | $10,609,734 | ||||||||||
| 2020 | $864,779 | $(1,481,993) | $(478,340) | $(1,095,554) | ||||||||||
(a) The amounts deducted or added in calculating the total average equity award adjustments are as follows:
| Average | |||||||
| Value of | |||||||
| Year over | Average Fair | Dividends or | |||||
| Average | Year | Value at the | other | ||||
| Year End | Average | End of the | Earnings Paid | ||||
| Fair Value | Year over | Average Fair | Change in | Prior Year | on Stock or | ||
| of Equity | Year Average | Value as of | Fair Value | of Equity | Option | ||
| Awards | Change in | Vesting Date | of Equity | Awards that | Awards not | ||
| Granted in | Fair Value of | of Equity | Awards | Failed to | Otherwise | Total | |
| the Year and | Outstanding | Awards | Granted in | Meet | Reflected in | Average | |
| Unvested at | and Unvested | Granted and | Prior Years | Vesting | Fair Value or | Equity | |
| End of the | Equity | Vested in the | that Vested | Conditions | Total | Award | |
| Year | Year | Awards | Year | in the Year | in the Year | Compensation | Adjustments |
| 2024 | $441,228 | $5,942 | $86,840 | $(82,524) | $451,486 | ||
| 2023 | $1,212,843 | $141,584 | $233,621 | $40,978 | $1,629,026 | ||
| 2022 | $154,920 | $(645,784) | $(8,594) | $(499,458) | |||
| 2021 | $3,361,188 | $590,377 | $76,332 | $4,027,897 | |||
| 2020 | $471,454 | $(726,946) | $(164,940) | $(420,432) |
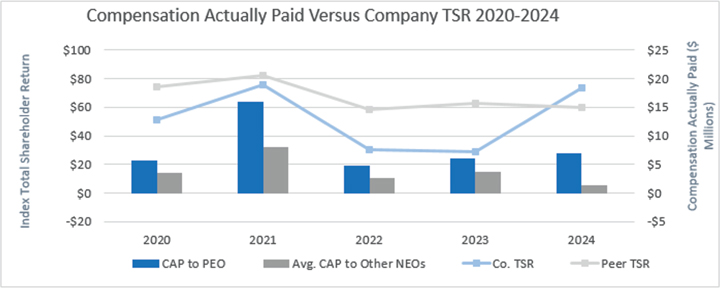
As demonstrated by the following graph, the amount of compensation actually paid to the relevant PEO for the applicable year and the average amount of compensation actually paid to the Company’s NEOs as a group (excluding the relevant PEO for the applicable year) is aligned with the Company’s TSR over the four years presented in the table.
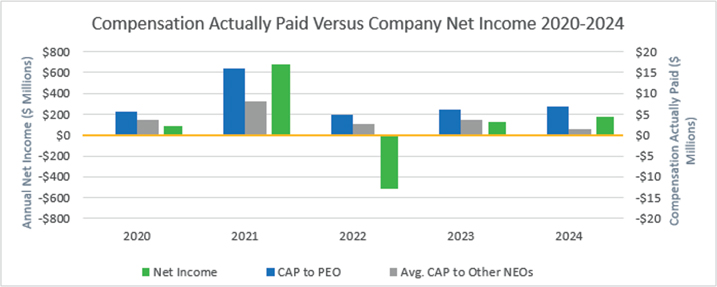
Compensation Actually Paid and Net Income
As demonstrated by the following table, the amount of compensation actually paid to the relevant PEO for the applicable year and the average amount of compensation actually paid to the Company’s NEOs as a group (excluding the relevant PEO for the applicable year) is generally aligned with the Company’s net income over the four years presented in the table.
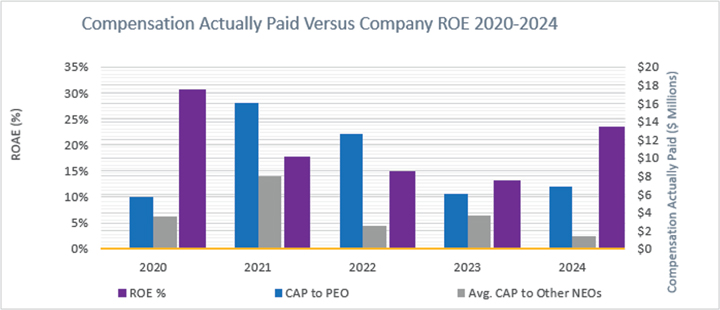
Compensation Actually Paid and ROE
As demonstrated by the following graph, the amount of compensation actually paid to the relevant PEO for the applicable year and the average amount of compensation actually paid to the Company’s NEOs as a group (excluding the relevant PEO for the applicable year) is aligned with the Company’s ROE over the four years presented in the table.
Financial Performance Measures
As described in greater detail in “Executive Compensation – Compensation Discussion and Analysis,” the Company’s executive compensation program reflects a variable pay-for-performance philosophy. The metrics that the Company uses for both our long- term and short-term incentive awards are selected based on an objective of incentivizing our NEOs to increase the value of our enter- prise for our stockholders. For the most recently completed fiscal year, the most important financial performance measures used by the Company to link executive compensation actually paid to the Company’s NEOs, to the Company’s performance are as follows:
| · | Relative ROE | |
| · | Relative TSR | |
| · | Relative Economic Return |
Analysis of the Information Presented in the Pay versus Performance Table
As described in more detail in the section “Executive Compensation – Compensation Discussion and Analysis,” the Company’s executive compensation program reflects a variable pay-for-performance philosophy. While the Company utilizes several performance measures to align executive compensation with Company performance, not all of those Company measures are presented in the Pay versus Performance table. Moreover, the Company generally seeks to incentivize long-term performance, and therefore does not specifically align the Company’s performance measures with compensation that is actually paid (as computed in accordance with Item 402(v) of Regulation S-K) for a particular year. In accordance with Item 402(v) of Regulation S-K, the Company is providing the following descriptions of the relationships between information presented in the Pay versus Performance table.