PAY VERSUS PERFORMANCE
The following tables and related disclosures provide information about (i) the total compensation of our principal executive officers, or our PEOs, and our other named executive officers, or our Other NEOs, as presented in the Summary Compensation Tables for the applicable years, or the SCT Amounts; (ii) the compensation actually paid to our PEOs and our Other NEOs, as calculated pursuant to the SEC’s pay-versus-performance rules, or the CAP Amounts; (iii) certain financial performance measures; and (iv) the relationship of the CAP Amounts to those financial performance measures.
This disclosure has been prepared in accordance with Item 402(v) of Regulation S-K under the Exchange Act and Section 953(a) of the Dodd-Frank Wall Street Reform and Consumer Protection Act and does not necessarily reflect value actually realized by our executive officers or how our Compensation Committee evaluates compensation decisions in light of company or individual performance. SEC rules require certain adjustments be made to the SCT Amounts to determine compensation actually paid as reported in the Pay Versus Performance Table below. In general, compensation actually paid is calculated by adjusting the SCT Amounts to include the fair market value of equity awards as of December 31 of the applicable year or, if earlier, the vesting date (rather than the grant date). The Company does not have a defined benefit plan so no adjustment for pension benefits is included in the table. Similarly, no adjustment is made for dividends as the Company does not pay dividends. For discussion of how our Compensation Committee seeks to align pay with performance when making compensation decisions, please review Compensation Discussion and Analysis beginning on page 48.
|
|
|
|
|
|
|
|
|
|
|
|
|
|
|
|
|
|
|
|
Value of Initial Fixed $100 |
|
|
|
|
|
|
||||||||||||
Fiscal Year |
|
Summary |
|
|
Summary |
|
|
Compensation |
|
|
Compensation |
|
|
Average |
|
|
Average |
|
|
Total |
|
|
Peer |
|
|
Net |
|
|
Company |
|||||||||
2024(1) |
|
|
7,112,589 |
|
|
|
— |
|
|
|
864,959 |
|
|
|
— |
|
|
|
2,325,419 |
|
|
|
762,383 |
|
|
$ |
8 |
|
|
$ |
114 |
|
|
|
(400.7 |
) |
|
N/A |
2023(2) |
|
|
6,237,491 |
|
|
|
— |
|
|
|
3,080,628 |
|
|
|
— |
|
|
|
2,312,755 |
|
|
|
200,268 |
|
|
$ |
30 |
|
|
$ |
115 |
|
|
|
(541.5 |
) |
|
N/A |
2022(3) |
|
|
5,705,164 |
|
|
|
— |
|
|
|
3,563,623 |
|
|
|
— |
|
|
|
2,282,416 |
|
|
|
2,071,551 |
|
|
$ |
53 |
|
|
$ |
111 |
|
|
|
(532.8 |
) |
|
N/A |
2021(4) |
|
|
58,864,150 |
|
|
|
— |
|
|
|
8,431,100 |
|
|
|
— |
|
|
|
3,024,803 |
|
|
|
534,653 |
|
|
$ |
59 |
|
|
$ |
125 |
|
|
|
(457.9 |
) |
|
N/A |
2020(5) |
|
|
826,052 |
|
|
|
4,670,003 |
|
|
|
1,265,945 |
|
|
|
4,698,361 |
|
|
|
2,718,961 |
|
|
|
3,077,346 |
|
|
$ |
120 |
|
|
$ |
126 |
|
|
|
606.1 |
|
|
N/A |
First PEO – Barry E. Greene
Year |
|
2020 |
|
|
2021 |
|
|
2022 |
|
|
2023 |
|
|
2024 |
|
|||||
SCT Amount |
|
$ |
826,052 |
|
|
$ |
58,864,150 |
|
|
$ |
5,705,164 |
|
|
$ |
6,237,491 |
|
|
$ |
7,112,589 |
|
- Grant Date Fair Value of Option Awards and Stock Awards Granted in Fiscal Year |
|
|
(771,858 |
) |
|
|
(57,615,277 |
) |
|
|
(4,413,009 |
) |
|
|
(4,994,865 |
) |
|
|
(5,833,627 |
) |
+ Fair Value at Fiscal Year-End of Outstanding and Unvested Option Awards and Stock Awards Granted in Fiscal Year |
|
|
1,157,954 |
|
|
|
6,065,298 |
|
|
|
3,806,807 |
|
|
|
1,060,858 |
|
|
|
569,251 |
|
+ Change in Fair Value of Outstanding and Unvested Option Awards and Stock Awards Granted in Prior Fiscal Years |
|
|
— |
|
|
|
(473,055 |
) |
|
|
(1,068,567 |
) |
|
|
(3,187,101 |
) |
|
|
(695,484 |
) |
+ Fair Value at Vesting of Option Awards and Stock Awards Granted in Fiscal Year That Vested During Fiscal Year |
|
|
53,797 |
|
|
|
1,728,189 |
|
|
|
— |
|
|
|
— |
|
|
|
451,584 |
|
+ Change in Fair Value as of Vesting Date of Option Awards and Stock Awards Granted in Prior Fiscal Years For Which Applicable Vesting Conditions Were Satisfied During Fiscal Year |
|
|
— |
|
|
|
(138,205 |
) |
|
|
(466,772 |
) |
|
|
3,964,245 |
|
|
|
(739,354 |
) |
- Fair Value as of Prior Fiscal Year-End of Option Awards and Stock Awards Granted in Prior Fiscal Years That Failed to Meet Applicable Vesting Conditions During Fiscal Year |
|
|
— |
|
|
|
— |
|
|
|
— |
|
|
|
— |
|
|
|
— |
|
CAP Amount |
|
$ |
1,265,945 |
|
|
$ |
8,431,100 |
|
|
$ |
3,563,623 |
|
|
$ |
3,080,628 |
|
|
$ |
864,959 |
|
Second PEO – Jeffrey M. Jonas, M.D.
Year |
|
2020 |
|
|
2021 |
|
|
2022 |
|
|
2023 |
|
|
2024 |
|
|||||
SCT Amount |
|
$ |
4,670,003 |
|
|
$ |
— |
|
|
$ |
— |
|
|
$ |
— |
|
|
$ |
— |
|
- Grant Date Fair Value of Option Awards and Stock Awards Granted in Fiscal Year |
|
|
(3,473,072 |
) |
|
|
— |
|
|
|
— |
|
|
|
— |
|
|
|
— |
|
+ Fair Value at Fiscal Year-End of Outstanding and Unvested Option Awards and Stock Awards Granted in Fiscal Year |
|
|
3,922,803 |
|
|
|
— |
|
|
|
— |
|
|
|
— |
|
|
|
— |
|
+ Change in Fair Value of Outstanding and Unvested Option Awards and Stock Awards Granted in Prior Fiscal Years |
|
|
218,141 |
|
|
|
— |
|
|
|
— |
|
|
|
— |
|
|
|
— |
|
+ Fair Value at Vesting of Option Awards and Stock Awards Granted in Fiscal Year That Vested During Fiscal Year |
|
|
— |
|
|
|
— |
|
|
|
— |
|
|
|
— |
|
|
|
— |
|
+ Change in Fair Value as of Vesting Date of Option Awards and Stock Awards Granted in Prior Fiscal Years For Which Applicable Vesting Conditions Were Satisfied During Fiscal Year |
|
|
(639,514 |
) |
|
|
— |
|
|
|
— |
|
|
|
— |
|
|
|
— |
|
- Fair Value as of Prior Fiscal Year-End of Option Awards and Stock Awards Granted in Prior Fiscal Years That Failed to Meet Applicable Vesting Conditions During Fiscal Year |
|
|
— |
|
|
|
— |
|
|
|
— |
|
|
|
— |
|
|
|
— |
|
CAP Amount |
|
$ |
4,698,361 |
|
|
$ |
— |
|
|
$ |
— |
|
|
$ |
— |
|
|
$ |
— |
|
Average – Non-PEO NEOs
Year |
|
2020 |
|
|
2021 |
|
|
2022 |
|
|
2023 |
|
|
2024 |
|
|||||
SCT Amount |
|
$ |
2,718,961 |
|
|
$ |
3,024,803 |
|
|
$ |
2,282,416 |
|
|
$ |
2,312,755 |
|
|
$ |
2,325,419 |
|
- Grant Date Fair Value of Option Awards and Stock Awards Granted in Fiscal Year |
|
|
(2,021,218 |
) |
|
|
(2,376,000 |
) |
|
|
(1,678,713 |
) |
|
|
(1,475,326 |
) |
|
|
(1,446,691 |
) |
+ Fair Value at Fiscal Year-End of Outstanding and Unvested Option Awards and Stock Awards Granted in Fiscal Year |
|
|
2,625,972 |
|
|
|
700,815 |
|
|
|
1,620,274 |
|
|
|
266,964 |
|
|
|
133,580 |
|
+ Change in Fair Value of Outstanding and Unvested Option Awards and Stock Awards Granted in Prior Fiscal Years |
|
|
114,460 |
|
|
|
(936,801 |
) |
|
|
(81,245 |
) |
|
|
(1,067,772 |
) |
|
|
(206,237 |
) |
+ Fair Value at Vesting of Option Awards and Stock Awards Granted in Fiscal Year That Vested During Fiscal Year |
|
|
— |
|
|
|
— |
|
|
|
— |
|
|
|
— |
|
|
|
113,438 |
|
+ Change in Fair Value as of Vesting Date of Option Awards and Stock Awards Granted in Prior Fiscal Years For Which Applicable Vesting Conditions Were Satisfied During Fiscal Year |
|
|
(360,829 |
) |
|
|
121,836 |
|
|
|
(71,181 |
) |
|
|
163,647 |
|
|
|
(73,968 |
) |
- Fair Value as of Prior Fiscal Year-End of Option Awards and Stock Awards Granted in Prior Fiscal Years That Failed to Meet Applicable Vesting Conditions During Fiscal Year |
|
|
— |
|
|
|
— |
|
|
|
— |
|
|
|
— |
|
|
|
(83,158 |
) |
CAP Amount |
|
$ |
3,077,346 |
|
|
$ |
534,653 |
|
|
$ |
2,071,551 |
|
|
$ |
200,268 |
|
|
$ |
762,383 |
|
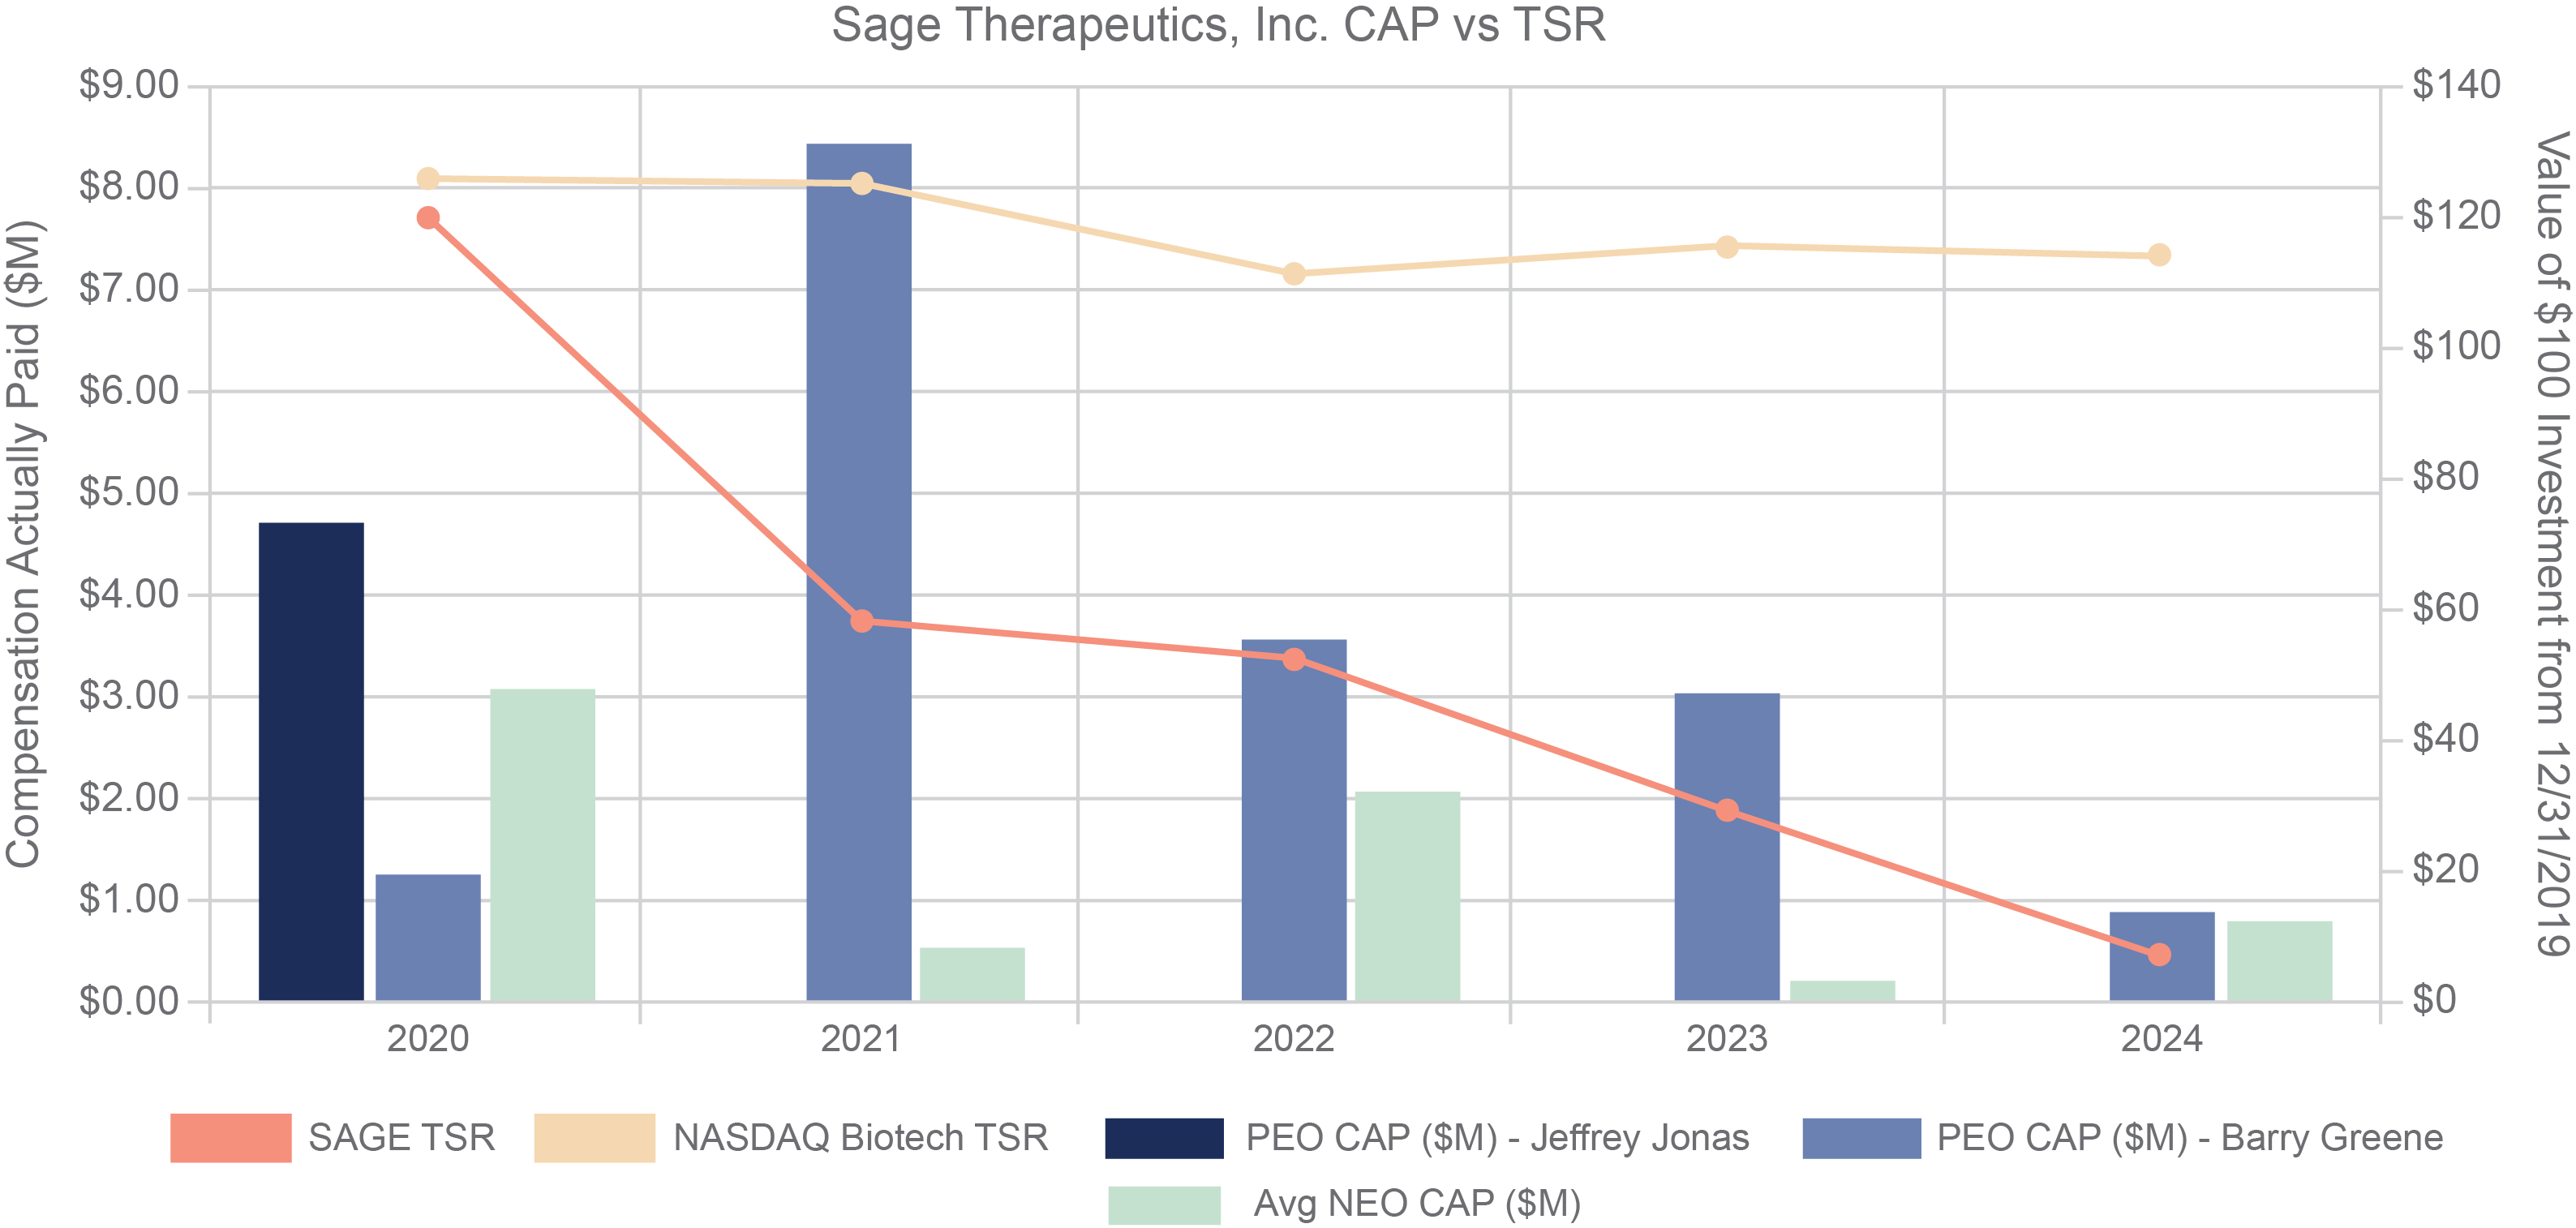
The following chart depicts the relationship of CAP Amounts for our PEOs and Other NEOs as compared to the cumulative TSR of our common stock and the Peer Group TSR, as well as the relationship between our TSR and the Peer Group TSR, over the past five years.
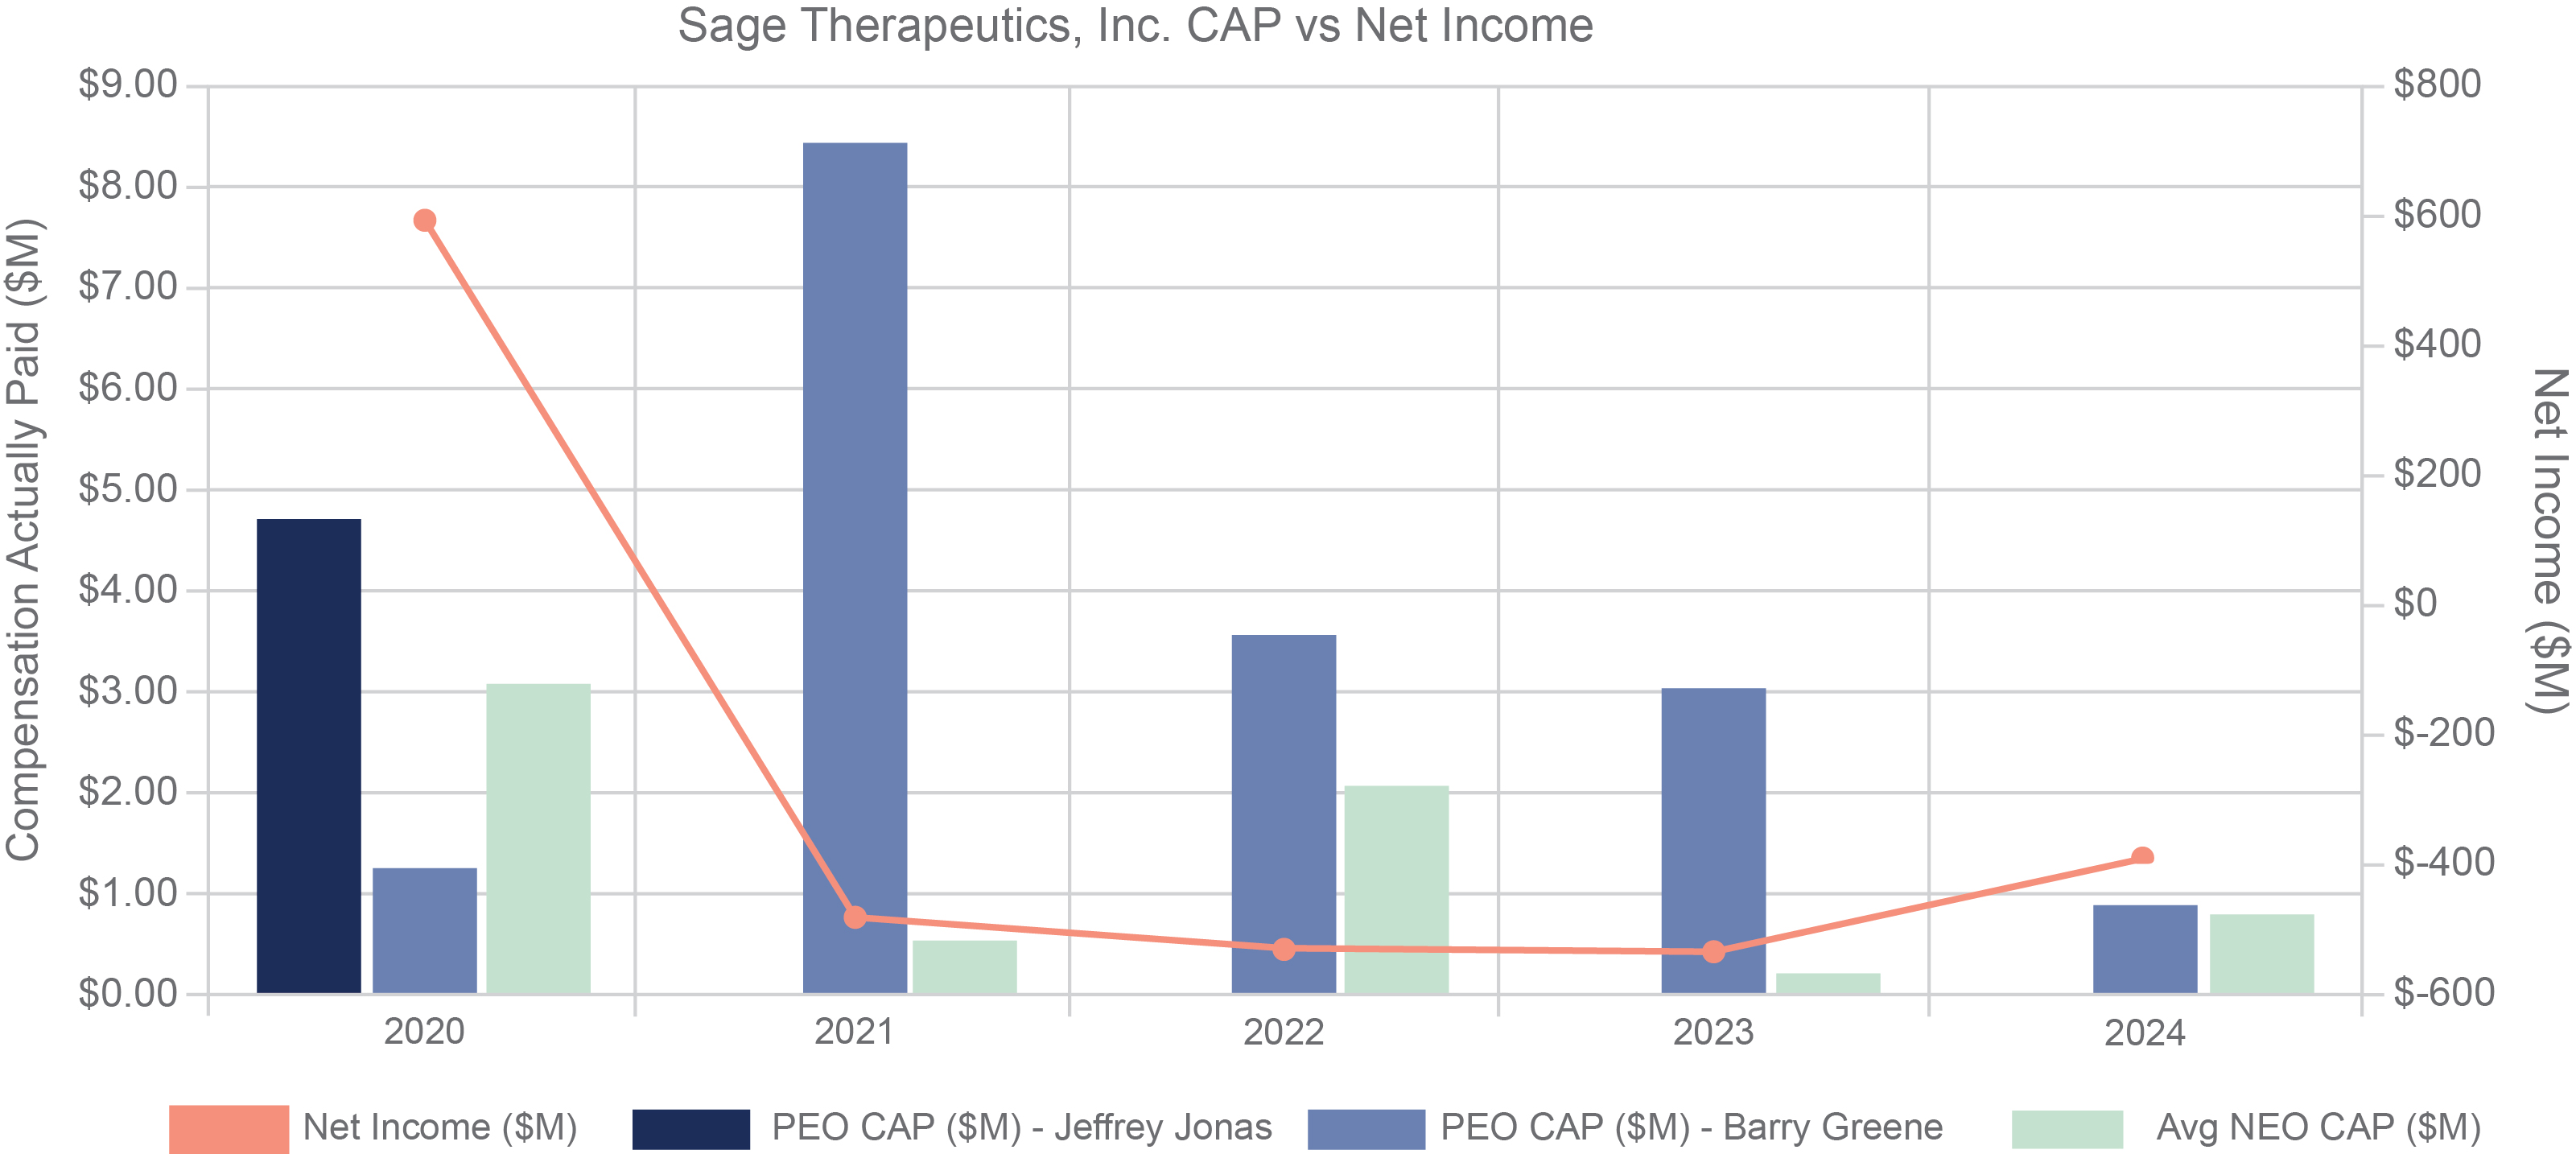
The following chart depicts the relationship of CAP Amounts for our PEOs and Other NEOs as compared to net income over the past five years. The net income shown for the fiscal year 2020 includes an up-front amount and payment for shares of our common stock received from Biogen in connection with the effectiveness of the Biogen Collaboration and License Agreement (as defined in the section entitled “Certain Relationships and Related Party Transactions” below).
The following chart depicts the relationship of CAP Amounts for our PEOs and Other NEOs as compared to the cumulative TSR of our common stock and the Peer Group TSR, as well as the relationship between our TSR and the Peer Group TSR, over the past five years.
Strategic Regulatory Milestones |
Pre-Launch and Launch Readiness Goals |
Research and Development Pipeline Goals |
Hiring and Workforce Development Goals |