Pay Versus Performance Table
In accordance with the requirements of Item 402(v) of Regulation S-K, the following table sets forth required information concerning the compensation of our named executive officers for each of the fiscal years ended December 31, 2020, 2021, 2022, 2023, and 2024, and our financial performance for each such fiscal year:
|
|
|
|
|
Value of Initial Fixed $100 Investment Based on: |
|
|
|
|
Year |
Summary Compensation Table Total for PEO(1) |
Compensation Actually Paid to PEO(2)(3) |
Average Summary Compensation Table Total for Non-PEO Named Executive Officers(1) |
Average Compensation Actually Paid to Non-PEO Named Executive Officers(3)(4) |
Total Shareholder Return ($) (5) |
Peer Group Total Shareholder Return ($) (5) |
Net Income (Loss) ($M)(6) |
Company Selected Measure: Revenue ($M)(7) |
Supplemental Measure: Adjusted EBITDA ($M)(8) |
2024 |
11,189,636 |
21,772,553 |
4,063,575 |
7,270,312 |
561.72 |
287.31 |
40.8 |
366.1 |
65.9 |
2023 |
6,796,272 |
1,255,074 |
3,624,547 |
1,282,427 |
348.14 |
238.72 |
(43.4) |
307.5 |
21.8 |
2022 |
5,461,705 |
11,246,769 |
2,494,059 |
4,810,568 |
422.20 |
142.94 |
(24.3) |
257.8 |
28.9 |
2021 |
5,909,698 |
19,315,371 |
2,622,014 |
9,474,437 |
343.00 |
219.51 |
(51.3) |
190.3 |
9.1 |
2020 |
3,223,537 |
8,584,821 |
3,112,216 |
5,064,383 |
161.91 |
153.66 |
(51.9) |
138.9 |
(11.5) |
Adjustments to Determine PEO Compensation Actually Paid |
2024 |
2023 |
2022 |
2021 |
2020 |
Summary Compensation Table Total for PEO ($) |
11,189,636 |
6,796,272 |
5,461,705 |
5,909,698 |
3,223,537 |
Minus Grant Date Fair Value of Equity Awards in Summary Compensation Table ($) |
9,785,191 |
6,364,870 |
4,617,789 |
5,460,661 |
2,821,209 |
Adjustments to Determine PEO Compensation Actually Paid |
2024 |
2023 |
2022 |
2021 |
2020 |
Plus Year-End Fair Value of Equity Awards Granted During Year That Remained Unvested as of Last Day of Year |
11,502,652 |
3,568,455 |
9,045,148 |
10,187,649 |
5,327,696 |
Plus Change in Fair Value from Last Day of Prior Year to Last Day of Year of Unvested Equity Awards |
5,424,739 |
(2,682,482) |
3,847,161 |
6,657,732 |
2,206,686 |
Plus Change in Fair Value from Last Day of Prior Year to Vesting Date of Unvested Equity Awards that Vested During Year |
3,440,717 |
(62,301) |
2,489,456) |
2,020,953 |
648,111 |
Minus Fair Value at the End of the Prior Year of Equity Awards that Failed to Meet Vesting Conditions in the Year |
- |
- |
- |
- |
- |
Plus Value of Dividends or Other Earnings Paid on Equity Awards Prior to the Vesting Date That Are Not Otherwise Reflected in Total Compensation |
- |
- |
- |
- |
- |
Compensation Actually Paid to PEO ($) |
21,772,553
|
1,255,074 |
11,246,769 |
19,315,371 |
8,584,821 |
(3) The fair value of stock options reported for CAP purposes is estimated using a Black-Scholes option pricing model for the purposes of this PVP calculation in accordance with the SEC rules. We estimate the fair value of options using the Black-Scholes option-pricing model with the following assumptions for the periods presented:
Grant Year |
2024 |
2023 |
2022 |
2021 |
2020 |
Volatility |
69.19-71.94% |
68.3 - 78.41% |
66.64 - 77.33% |
67.05 - 80.73% |
67.70 - 82.33% |
Expected life in years |
3.04-3.27 years |
3.04 - 3.78 years |
2.98 - 4.29 years |
3.10 - 4.94 years |
3.04 - 5.66 years |
Expected dividend yield |
0.00% |
0.00% |
0.00% |
0.00% |
0.00% |
Risk-free rate |
4.01-4.77% |
3.54 - 5.44% |
1.00 - 4.57% |
0.06 - 1.44% |
0.16 - 1.64% |
(4) This figure is the average of compensation actually paid for the Non-PEO NEOs in each covered year. CAP does not mean that these Non-PEO NEOs were actually paid those amounts in the listed year, but this is a dollar amount derived from the starting point of SCT total compensation under the methodology prescribed under the SEC’s rules, as shown in the adjustment table below:
Adjustments to Determine Average Non-PEO NEO |
2024 |
2023 |
2022 |
2021 |
2020 |
Average Summary Compensation Table Total for Non-PEO NEOs ($) |
4,063,575 |
3,624,547 |
2,494,059 |
2,622,014 |
3,112,216 |
Minus Non-PEO NEO Average Grant Date Fair Value of Equity Awards in Summary Compensation Table ($) |
3,134,122 |
3,250,029 |
1,977,919 |
2,260,819 |
2,720,499 |
Plus Non-PEO NEO Average Year-End Fair Value of Equity Awards Granted During Year That Remained Unvested as of Last Day of Year |
3,684,211 |
1,916,487 |
3,605,709 |
4,384,115 |
4,003,190 |
Plus Non-PEO NEO Average Change in Fair Value from Last Day of Prior Year to Last Day of Year of Unvested Equity Awards |
1,508,304 |
(809,715) |
1,795,035 |
3,474,821 |
647,170 |
Adjustments to Determine Average Non-PEO NEO |
2024 |
2023 |
2022 |
2021 |
2020 |
Plus Non-PEO NEO Average Change in Fair Value from Last Day of Prior Year to Vesting Date of Unvested Equity Awards that Vested During Year |
1,148,345 |
(198,863) |
(1,106,316) |
1,254,306 |
22,306 |
Minus Non-PEO NEO Average Fair Value at the End of the Prior Year of Equity Awards that Failed to Meet Vesting Conditions in the Year |
- |
- |
- |
- |
- |
Plus Non-PEO NEO Average Value of Dividends or Other Earnings Paid on Equity Awards Prior to the Vesting Date That Are Not Otherwise Reflected in Total Compensation |
- |
- |
- |
- |
- |
Average Compensation Actually Paid to Non-PEO NEOs ($) |
7,270,312 |
1,282,427 |
4,810,568 |
9,474,437 |
5,064,383 |
(5) TSR is determined based on the value of an initial fixed investment of $100 in our common stock on December 31, 2019, assuming the reinvestment of any dividends. The peer group is made up of the PHLX Semiconductor Sector Index, which is the peer group we used for the stock performance graph required by Item 201(e) of Regulation S-K included in our Annual Report on Form 10-K for the year ended December 31, 2024.
(6) The dollar amounts reported represent our net loss as reflected in our audited financial statements.
(7) The dollar amounts reported represent our revenue as reflected in our audited financial statements.
(8) Adjusted EBITDA is a non-GAAP financial measure. For a reconciliation of non-GAAP financial measures, see Appendix A.
Adjustments to Determine PEO Compensation Actually Paid |
2024 |
2023 |
2022 |
2021 |
2020 |
Summary Compensation Table Total for PEO ($) |
11,189,636 |
6,796,272 |
5,461,705 |
5,909,698 |
3,223,537 |
Minus Grant Date Fair Value of Equity Awards in Summary Compensation Table ($) |
9,785,191 |
6,364,870 |
4,617,789 |
5,460,661 |
2,821,209 |
Adjustments to Determine PEO Compensation Actually Paid |
2024 |
2023 |
2022 |
2021 |
2020 |
Plus Year-End Fair Value of Equity Awards Granted During Year That Remained Unvested as of Last Day of Year |
11,502,652 |
3,568,455 |
9,045,148 |
10,187,649 |
5,327,696 |
Plus Change in Fair Value from Last Day of Prior Year to Last Day of Year of Unvested Equity Awards |
5,424,739 |
(2,682,482) |
3,847,161 |
6,657,732 |
2,206,686 |
Plus Change in Fair Value from Last Day of Prior Year to Vesting Date of Unvested Equity Awards that Vested During Year |
3,440,717 |
(62,301) |
2,489,456) |
2,020,953 |
648,111 |
Minus Fair Value at the End of the Prior Year of Equity Awards that Failed to Meet Vesting Conditions in the Year |
- |
- |
- |
- |
- |
Plus Value of Dividends or Other Earnings Paid on Equity Awards Prior to the Vesting Date That Are Not Otherwise Reflected in Total Compensation |
- |
- |
- |
- |
- |
Compensation Actually Paid to PEO ($) |
21,772,553
|
1,255,074 |
11,246,769 |
19,315,371 |
8,584,821 |
(4) This figure is the average of compensation actually paid for the Non-PEO NEOs in each covered year. CAP does not mean that these Non-PEO NEOs were actually paid those amounts in the listed year, but this is a dollar amount derived from the starting point of SCT total compensation under the methodology prescribed under the SEC’s rules, as shown in the adjustment table below:
Adjustments to Determine Average Non-PEO NEO |
2024 |
2023 |
2022 |
2021 |
2020 |
Average Summary Compensation Table Total for Non-PEO NEOs ($) |
4,063,575 |
3,624,547 |
2,494,059 |
2,622,014 |
3,112,216 |
Minus Non-PEO NEO Average Grant Date Fair Value of Equity Awards in Summary Compensation Table ($) |
3,134,122 |
3,250,029 |
1,977,919 |
2,260,819 |
2,720,499 |
Plus Non-PEO NEO Average Year-End Fair Value of Equity Awards Granted During Year That Remained Unvested as of Last Day of Year |
3,684,211 |
1,916,487 |
3,605,709 |
4,384,115 |
4,003,190 |
Plus Non-PEO NEO Average Change in Fair Value from Last Day of Prior Year to Last Day of Year of Unvested Equity Awards |
1,508,304 |
(809,715) |
1,795,035 |
3,474,821 |
647,170 |
Adjustments to Determine Average Non-PEO NEO |
2024 |
2023 |
2022 |
2021 |
2020 |
Plus Non-PEO NEO Average Change in Fair Value from Last Day of Prior Year to Vesting Date of Unvested Equity Awards that Vested During Year |
1,148,345 |
(198,863) |
(1,106,316) |
1,254,306 |
22,306 |
Minus Non-PEO NEO Average Fair Value at the End of the Prior Year of Equity Awards that Failed to Meet Vesting Conditions in the Year |
- |
- |
- |
- |
- |
Plus Non-PEO NEO Average Value of Dividends or Other Earnings Paid on Equity Awards Prior to the Vesting Date That Are Not Otherwise Reflected in Total Compensation |
- |
- |
- |
- |
- |
Average Compensation Actually Paid to Non-PEO NEOs ($) |
7,270,312 |
1,282,427 |
4,810,568 |
9,474,437 |
5,064,383 |
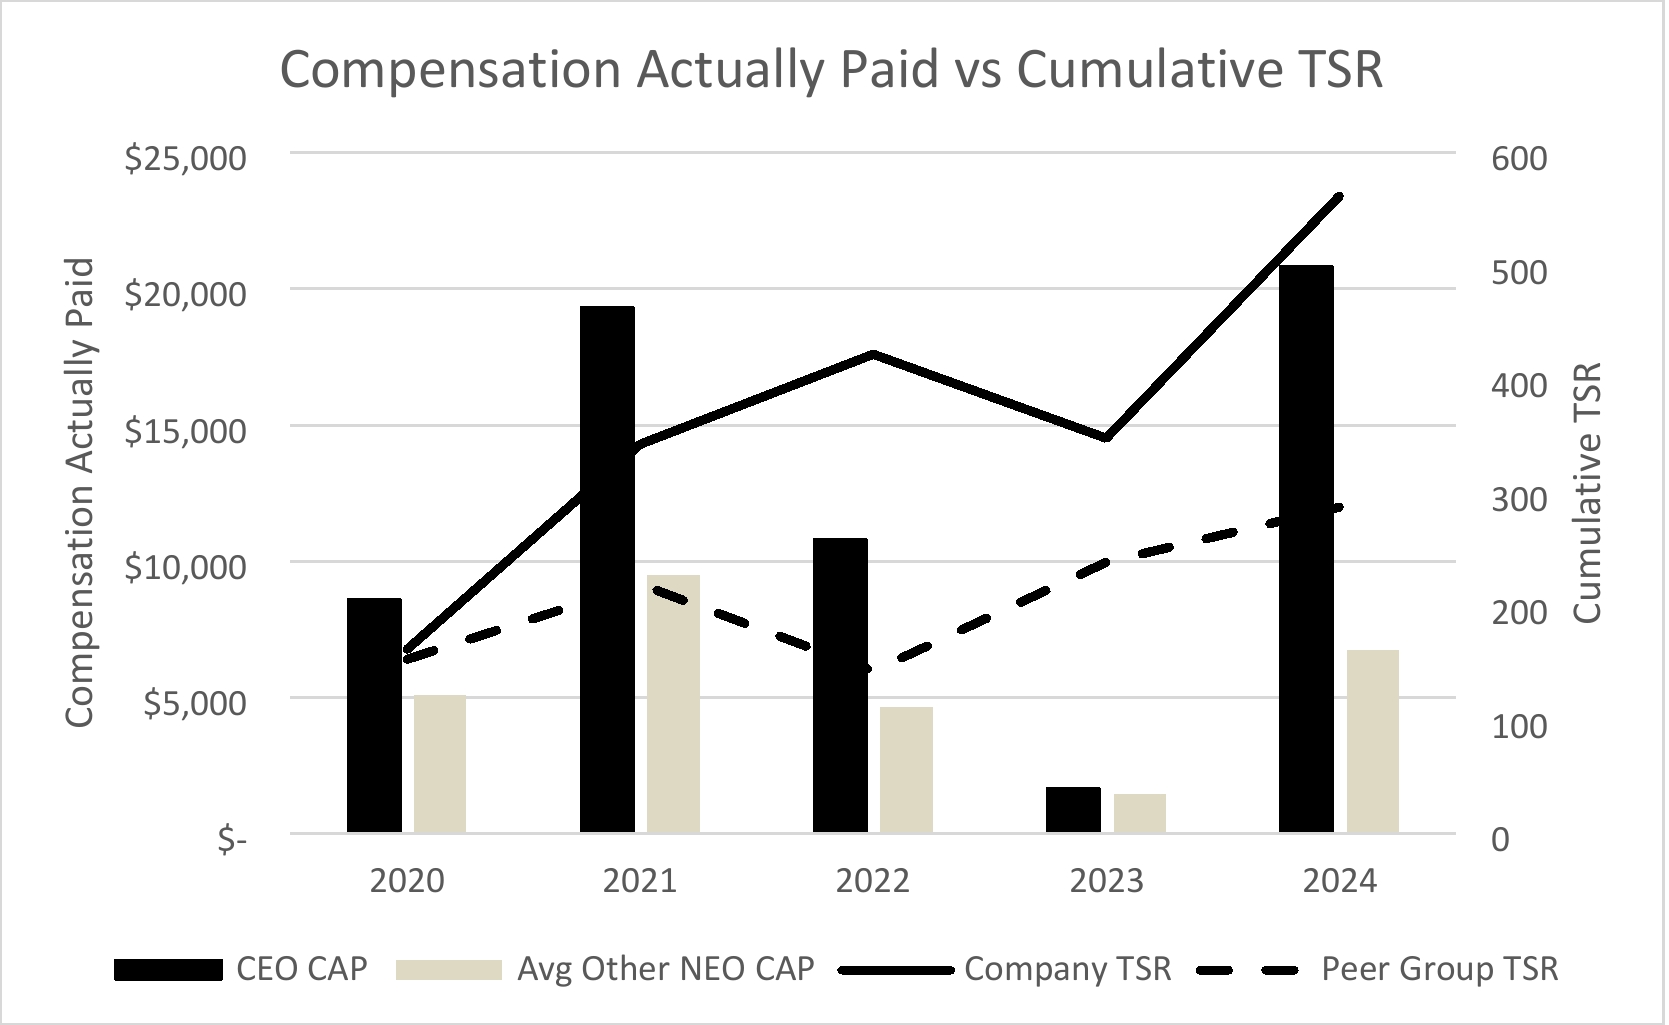
The graph below reflects the relationship between (i) the PEO CAP and Average Non-PEO NEO CAP and (ii) our cumulated indexed TSR, assuming an initial $100 fixed investment on December 31, 2019, and (iii) our Company Selected Measures for the fiscal years ended December 31, 2020, 2021, 2022, 2023, and 2024:
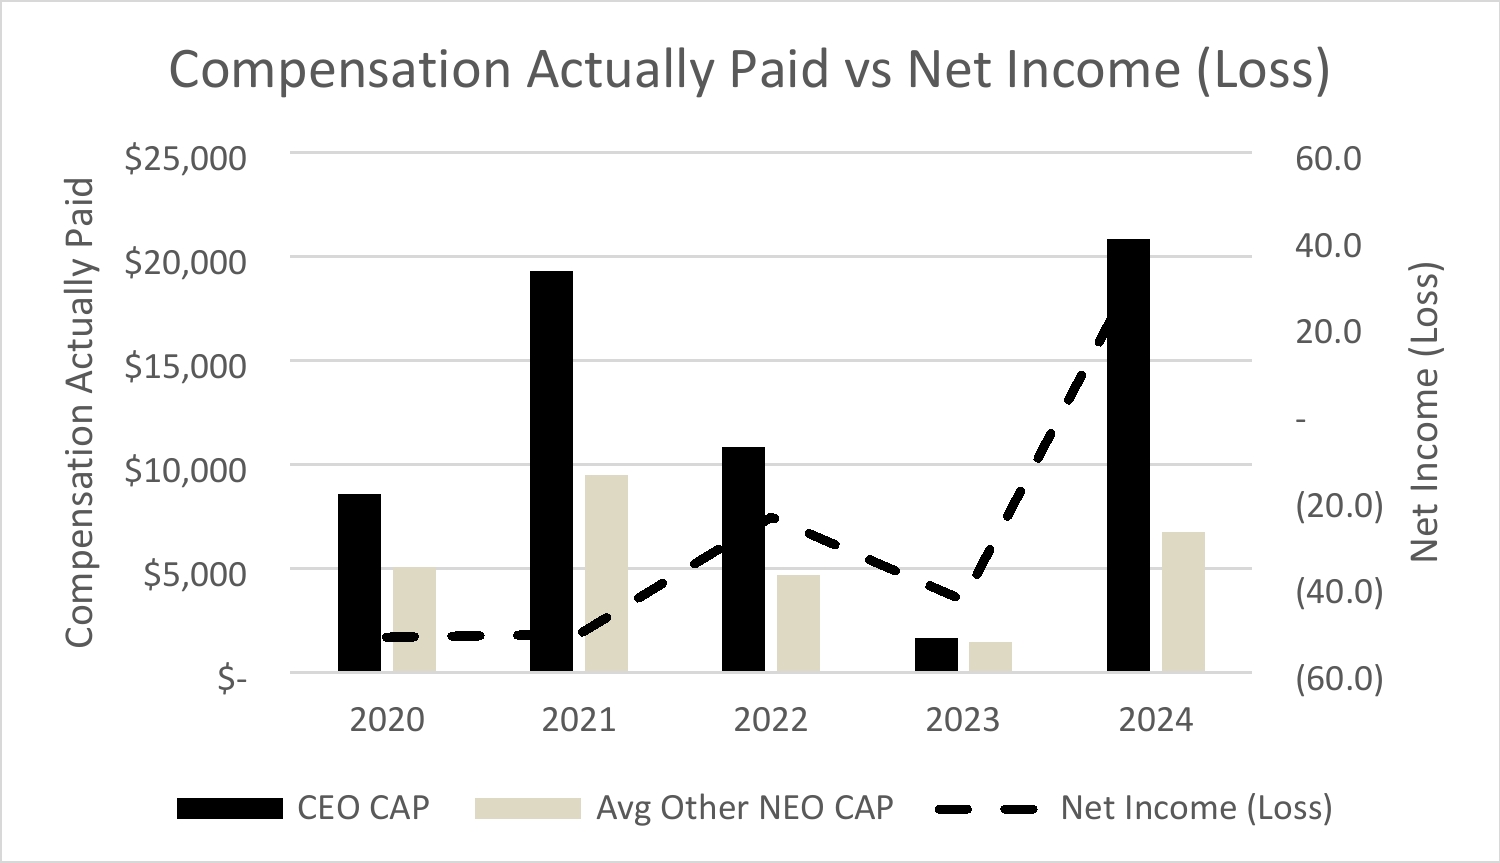
The graph below reflects the relationship between (i) the PEO CAP and the Average Non-PEO NEO CAP and (ii) our net income (loss) for the applicable reporting year:
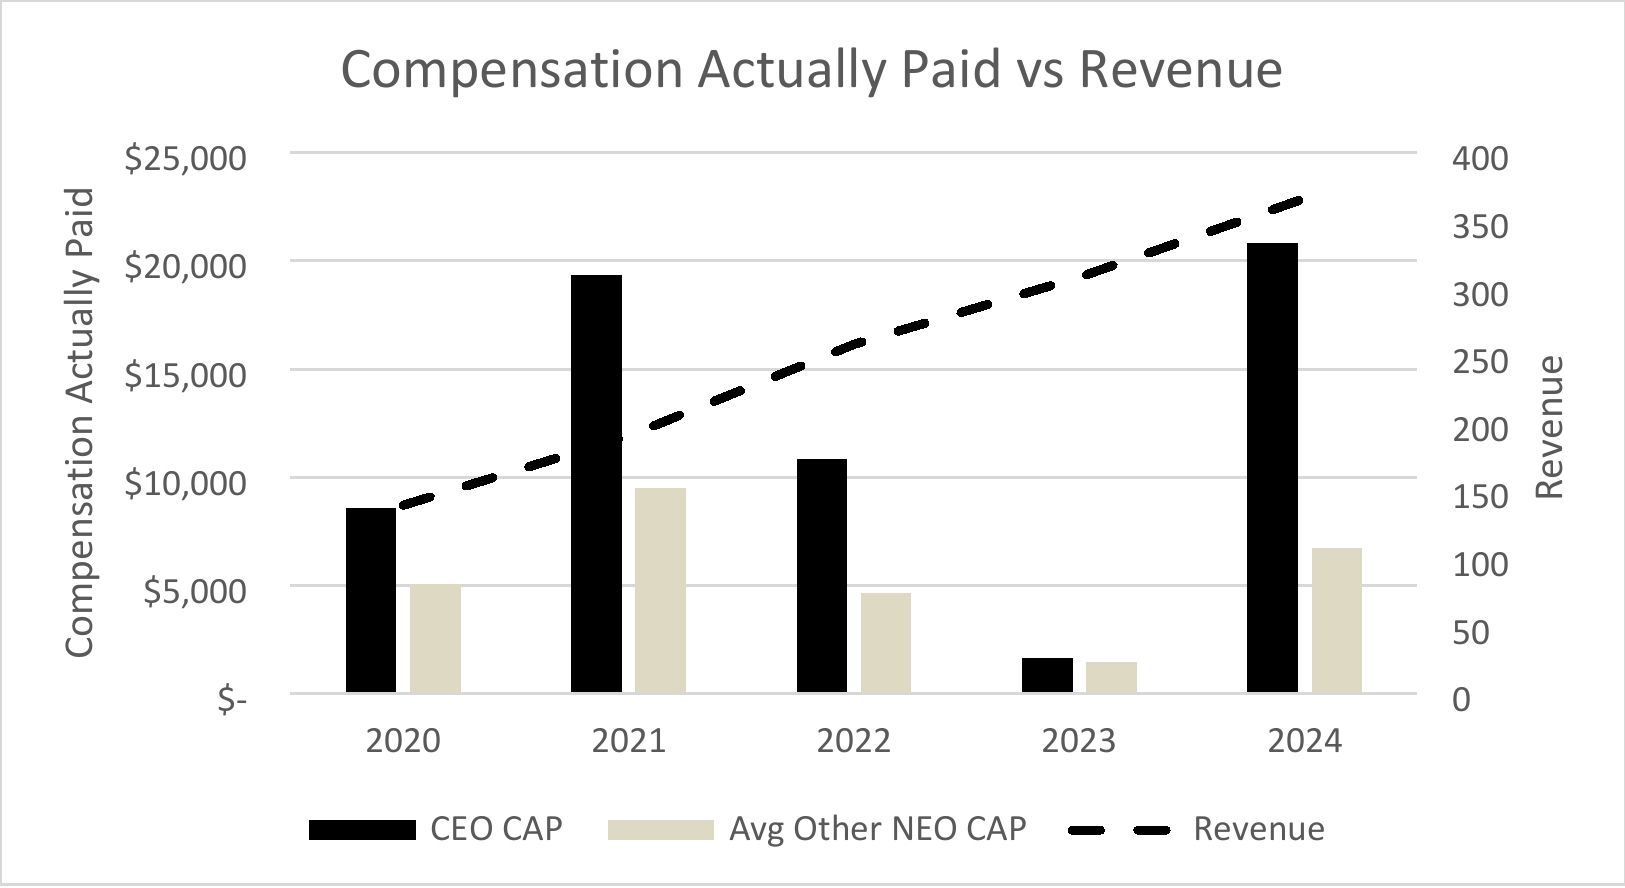
The graph below reflects the relationship between (i) the PEO CAP and the Average Non-PEO NEO CAP and (ii) our revenue for the applicable reporting year:
The graph below reflects the relationship between (i) the PEO CAP and Average Non-PEO NEO CAP and (ii) our cumulated indexed TSR, assuming an initial $100 fixed investment on December 31, 2019, and (iii) our Company Selected Measures for the fiscal years ended December 31, 2020, 2021, 2022, 2023, and 2024:
List of Most Important Company Performance Measures for Determining NEO Compensation
The following is a list of performance measures (including the company-selected measure identified above), which in our assessment represent the most important financial performance measures used by us to link compensation actually paid to our named executive officers for 2024:
Most Important Company Performance Measures for Determining NEO Compensation |
TSR |
Revenue |
Adjusted EBITDA* |
* Non-GAAP financial measure. For a reconciliation of non-GAAP financial measures, see Appendix A.
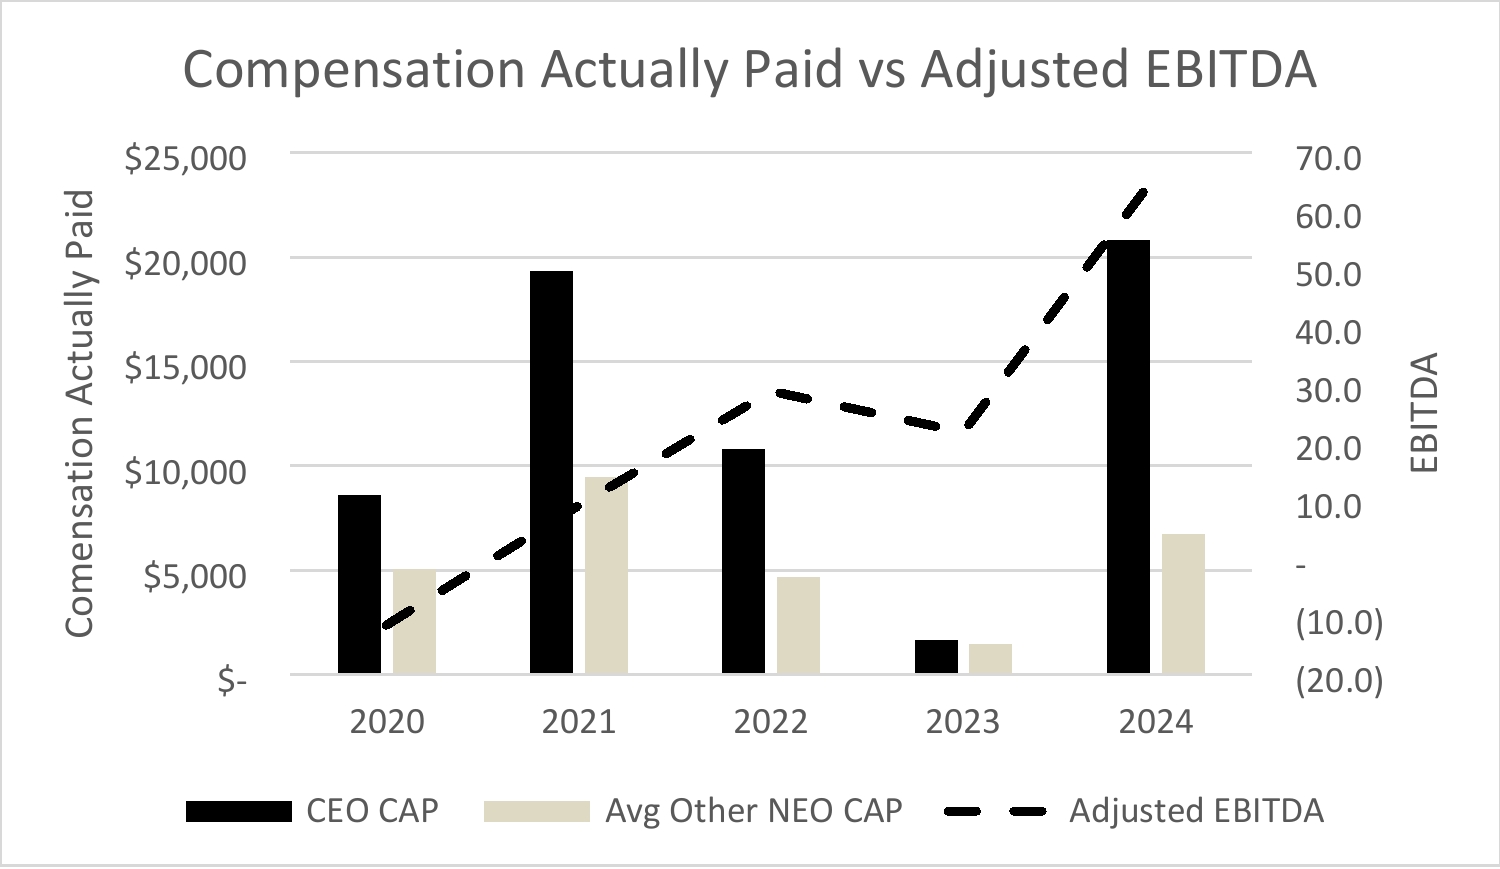
The graph below reflects the relationship between (i) the PEO and the Average Non-PEO NEO CAP and (ii) our adjusted EBITDA for the applicable reporting year: