Average | ||||||||||||||
Summary | Summary | Average | ||||||||||||
Compensation | Compensation | Compensation | Compensation | Value of Fixed $100 Investment Based on(4) | ||||||||||
Table Total | Actually Paid | Table Total | Actually Paid | Total | Peer Group Total | Net | ||||||||
for CEO | to CEO | for Non-CEO NEOs | to Non-CEO NEOs | Shareholder Return | Shareholder Return | Loss | ||||||||
Year | ($)(1) | ($)(1)(2)(3) | ($)(1) | ($)(1)(2)(3) | ($) | ($) | $000s(5) | |||||||
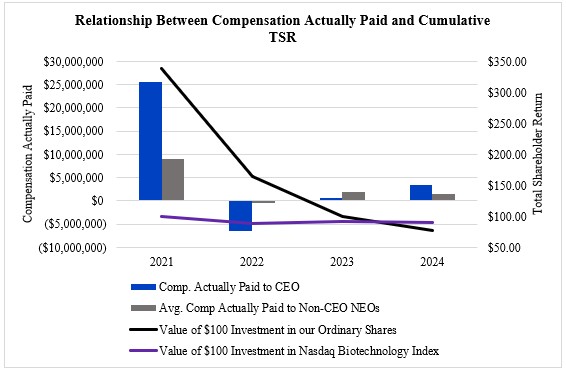
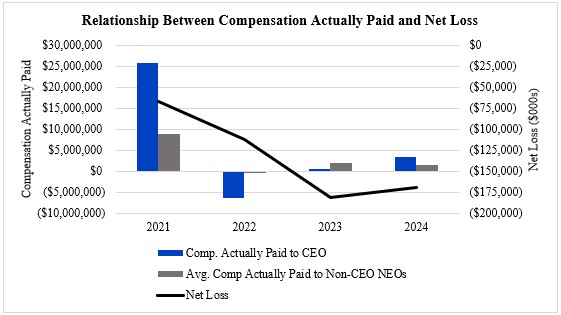
2024 | 4,857,218 | 3,333,586 | 2,258,821 | 1,574,319 | 77.99 | 90.58 | (169,031) | |||||||
2023 | 5,540,400 | 625,065 | 2,777,279 | 2,039,543 | 100.72 | 91.84 | (180,664) | |||||||
2022 | 8,627,590 | (6,363,603) | 4,041,865 | (464,022) | 164.90 | 88.53 | (112,717) | |||||||
2021 | 4,465,319 | 25,665,642 | 1,742,286 | 8,967,510 | 339.11 | 99.37 | (66,819) | |||||||
| (1) | The CEO for 2024, 2023, 2022 and 2021 is Kevin Lee, Ph.D., MBA. The Non-CEO NEOs for whom the average compensation is presented in this table for 2024 are Alethia Young, Alistair Milnes, Santiago Arroyo, M.D., Ph.D. and Michael Hannay, D.Sc. The Non-CEO NEOs for whom the average compensation is presented in this table for 2023 are Ms. Young and Dr. Arroyo. The Non-CEO NEOs for whom the average compensation is presented in this table for 2022 are Lee Kalowski, MBA, our former Chief Financial Officer who resigned in June 2023, Mr. Milnes and Michael Skynner, Ph.D. The Non-CEO NEOs for whom the average compensation is presented in this table for 2021 are Mr. Kalowski and Dr. Skynner. |
| (2) | The amounts shown as Compensation Actually Paid or Average Compensation Actually Paid, as applicable, have been calculated in accordance with Item 402(v) of Regulation S-K and do not reflect compensation actually realized or received by our CEO and Non-CEO NEOs. These amounts reflect total compensation or average total compensation, as applicable, as set forth in the SCT for each year, adjusted as described in footnote 3 below. |
| (3) | Compensation Actually Paid or Average Compensation Actually Paid, as applicable, reflects the exclusions and inclusions for the CEO and Non-CEO NEOs set forth below. Amounts excluded, which are set forth in the “Minus Option and Stock Awards from SCT” column below, represent the Option and Stock Awards columns of the SCT for each applicable year. Amounts added back to determine Compensation Actually Paid are set forth in the table below, as applicable: (i) the fair value as of the end of the year of outstanding and unvested equity awards granted in that year; (ii) the change in fair value during the year of equity awards granted in prior years that remained outstanding and unvested at the end the year; and (iii) the change in fair value during the year of equity awards granted in prior years that vested during the year. No equity awards granted during any of the years presented were both granted and vested during the year. No awards granted in prior years failed to meet the applicable vesting conditions during any of the years presented. Equity award fair values used in the computations below are calculated in accordance with ASC Topic 718. |
Plus Year-End | Plus Change in | Plus Change in | ||||||||||
Summary | Minus Option | Fair Value of | Fair Value of | Fair Value of | ||||||||
Compensation | and Stock | Unvested Equity | Unvested Equity | Prior Years’ | Compensation | |||||||
Table Total | Awards from | Awards Granted | Awards Granted | Awards Vested | Actually Paid | |||||||
for CEO | SCT | During Year | in Prior Years | During Year | to CEO | |||||||
Year | ($) | ($) | ($) | ($) | ($) | ($) | ||||||
2024 | 4,857,218 | (3,359,659) | 2,312,707 | (646,209) | 169,529 | 3,333,586 |
Plus Avg. Year-End | Plus Avg. Change | Plus Avg. Change | ||||||||||
Avg. Summary | Minus Avg. | Fair Value of | in Fair Value of | in Fair Value of | Average | |||||||
Compensation | Options and | Unvested Equity | Unvested Equity | Prior Years’ | Compensation | |||||||
Table Total | Stock Awards | Awards Granted | Awards Granted | Awards Vested | Actually Paid | |||||||
for Non-CEO NEOs | from SCT | During Year | in Prior Years | During Year | to Non-CEO NEOs | |||||||
Year | ($) | ($) | ($) | ($) | ($) | ($) | ||||||
2024 | 2,258,821 | (1,374,446) | 896,283 | (282,232) | 75,893 | 1,574,319 |
The assumptions used in determining fair value of the share options that vested during 2024, or that were outstanding and unvested as of December 31, 2024, as applicable, are as follows:
2024 | ||
Risk-free interest rate | 3.5% - 4.8% | |
Expected volatility | 62.8% - 74.9% | |
Expected dividend yield | 0% | |
Expected term (in years) | 3.0 - 6.2 |
| (4) | Cumulative Total Shareholder Return (“TSR”) illustrates the value, as of the last day of the indicated fiscal year, of an investment of $100 in our ordinary shares on December 31, 2020, calculated by dividing the sum of the cumulative amount of dividends for the measurement period, assuming dividend reinvestment, and the difference between the Company’s share price at the end and the beginning of the measurement period by the Company’s share price at the beginning of the measurement period. The Peer Group TSR set forth in this table utilizes the Nasdaq Biotechnology Index, which we also utilize in the stock performance graph required by Item 201(e) of Regulation S-K in our Annual Report on Form 10-K. |
| (5) | The dollar amounts reported represent the amount of net loss reflected in the Company’s audited financial statements for the applicable year. |
| (1) | The CEO for 2024, 2023, 2022 and 2021 is Kevin Lee, Ph.D., MBA. The Non-CEO NEOs for whom the average compensation is presented in this table for 2024 are Alethia Young, Alistair Milnes, Santiago Arroyo, M.D., Ph.D. and Michael Hannay, D.Sc. The Non-CEO NEOs for whom the average compensation is presented in this table for 2023 are Ms. Young and Dr. Arroyo. The Non-CEO NEOs for whom the average compensation is presented in this table for 2022 are Lee Kalowski, MBA, our former Chief Financial Officer who resigned in June 2023, Mr. Milnes and Michael Skynner, Ph.D. The Non-CEO NEOs for whom the average compensation is presented in this table for 2021 are Mr. Kalowski and Dr. Skynner. |
| (4) | Cumulative Total Shareholder Return (“TSR”) illustrates the value, as of the last day of the indicated fiscal year, of an investment of $100 in our ordinary shares on December 31, 2020, calculated by dividing the sum of the cumulative amount of dividends for the measurement period, assuming dividend reinvestment, and the difference between the Company’s share price at the end and the beginning of the measurement period by the Company’s share price at the beginning of the measurement period. The Peer Group TSR set forth in this table utilizes the Nasdaq Biotechnology Index, which we also utilize in the stock performance graph required by Item 201(e) of Regulation S-K in our Annual Report on Form 10-K. |
| (3) | Compensation Actually Paid or Average Compensation Actually Paid, as applicable, reflects the exclusions and inclusions for the CEO and Non-CEO NEOs set forth below. Amounts excluded, which are set forth in the “Minus Option and Stock Awards from SCT” column below, represent the Option and Stock Awards columns of the SCT for each applicable year. Amounts added back to determine Compensation Actually Paid are set forth in the table below, as applicable: (i) the fair value as of the end of the year of outstanding and unvested equity awards granted in that year; (ii) the change in fair value during the year of equity awards granted in prior years that remained outstanding and unvested at the end the year; and (iii) the change in fair value during the year of equity awards granted in prior years that vested during the year. No equity awards granted during any of the years presented were both granted and vested during the year. No awards granted in prior years failed to meet the applicable vesting conditions during any of the years presented. Equity award fair values used in the computations below are calculated in accordance with ASC Topic 718. |
Plus Year-End | Plus Change in | Plus Change in | ||||||||||
Summary | Minus Option | Fair Value of | Fair Value of | Fair Value of | ||||||||
Compensation | and Stock | Unvested Equity | Unvested Equity | Prior Years’ | Compensation | |||||||
Table Total | Awards from | Awards Granted | Awards Granted | Awards Vested | Actually Paid | |||||||
for CEO | SCT | During Year | in Prior Years | During Year | to CEO | |||||||
Year | ($) | ($) | ($) | ($) | ($) | ($) | ||||||
2024 | 4,857,218 | (3,359,659) | 2,312,707 | (646,209) | 169,529 | 3,333,586 |
| (3) | Compensation Actually Paid or Average Compensation Actually Paid, as applicable, reflects the exclusions and inclusions for the CEO and Non-CEO NEOs set forth below. Amounts excluded, which are set forth in the “Minus Option and Stock Awards from SCT” column below, represent the Option and Stock Awards columns of the SCT for each applicable year. Amounts added back to determine Compensation Actually Paid are set forth in the table below, as applicable: (i) the fair value as of the end of the year of outstanding and unvested equity awards granted in that year; (ii) the change in fair value during the year of equity awards granted in prior years that remained outstanding and unvested at the end the year; and (iii) the change in fair value during the year of equity awards granted in prior years that vested during the year. No equity awards granted during any of the years presented were both granted and vested during the year. No awards granted in prior years failed to meet the applicable vesting conditions during any of the years presented. Equity award fair values used in the computations below are calculated in accordance with ASC Topic 718. |
Plus Avg. Year-End | Plus Avg. Change | Plus Avg. Change | ||||||||||
Avg. Summary | Minus Avg. | Fair Value of | in Fair Value of | in Fair Value of | Average | |||||||
Compensation | Options and | Unvested Equity | Unvested Equity | Prior Years’ | Compensation | |||||||
Table Total | Stock Awards | Awards Granted | Awards Granted | Awards Vested | Actually Paid | |||||||
for Non-CEO NEOs | from SCT | During Year | in Prior Years | During Year | to Non-CEO NEOs | |||||||
Year | ($) | ($) | ($) | ($) | ($) | ($) | ||||||
2024 | 2,258,821 | (1,374,446) | 896,283 | (282,232) | 75,893 | 1,574,319 |