Pay vs Performance Disclosure - USD ($)
Dec. 31, 2022
Nov. 20, 2022
Dec. 31, 2024
Dec. 31, 2023
Dec. 31, 2022
PAY VERSUS PERFORMANCE
As required by Item 402(v) of Regulation S-K, the Company is providing the following information regarding the relationship between executive compensation and the Company’s financial performance for each of the three years in the period ended December 31, 2024.
In accordance with the applicable SEC rules, the adjustments described and quantified below were made to the values reported in the Fiscal Year 2024 Summary Compensation Table for each applicable year to determine the “actual” compensation paid to our principal executive officers (“PEOs”) and the average “actual” compensation paid to our non-PEO NEOs.
The following table summarizes compensation values reported in the Fiscal Year 2024 Summary Compensation Table for our PEOs and the average for our non-PEO NEOs, as compared to Compensation Actually Paid (“CAP”) and the Company’s financial performance for the years ended December 31, 2024, 2023 and 2022:
Year | Summary Compensation Table Total for Current PEO(1) | Summary Compensation Table Total for Former PEO(2) | Compensation Actually Paid to Current PEO(3) | Compensation Actually Paid to Former PEO(3) | Average Summary Compensation Table Total for Non-PEO Named Executive Officers(4) | Average Compensation Actually Paid to Non-PEO Named Executive Officers(3) | Value of initial fixed $100 investment based on: | ||||||||||||||||||||||
Total Shareholder Return(5) | Peer Group Total Shareholder Return(6) | Net Income (Loss)(7)(8) | |||||||||||||||||||||||||||
2024 | $1,995,245 | $— | $71,043 | $— | $1,494,211 | ($60,371) | $86.78 | $112.12 | ($140,181,000) | ||||||||||||||||||||
2023 | $971,879 | $— | ($1,090,621) | $— | $7,030,149 | $5,371,399 | $115.86 | $118.61 | ($216,075,000) | ||||||||||||||||||||
2022 | $10,083,718 | $3,103,477 | $12,566,218 | $9,302,368 | $2,181,633 | $2,862,386 | $139.66 | $117.43 | ($160,221,000) | ||||||||||||||||||||
(1) | The dollar amounts reported for the current PEO are the amounts reported for our CEO, Mr. Melvin (the Company’s President and Chief Executive Officer since November 21, 2022), for each corresponding year in the “Total” column of the Fiscal Year 2024 Summary Compensation Table. |
(2) | The dollar amounts reported for the former PEO are the amounts reported for our former CEO, Mr. Friedland (the Company’s Executive Chairman) for each corresponding year in the “Total” column of the Summary Compensation Table of the Proxy Statement dated April 28, 2023. |
(3) | Deductions from, and additions to, total compensation in the Fiscal Year 2024 Summary Compensation Table (SCT) by year to calculate Compensation Actually Paid (“CAP”) include: |
PEO | Former PEO | Average Non- PEO NEOs | ||||||||||||||||||||||||
2024 | 2023 | 2022 | 2022 | 2024 | 2023 | 2022 | ||||||||||||||||||||
Summary Compensation Total | $1,995,245 | $971,879 | $10,083,718 | $3,103,477 | $1,494,211 | $7,030,149 | $2,181,633 | |||||||||||||||||||
Adjustments for Equity Awards | ||||||||||||||||||||||||||
Deduct: | Grant date values in SCT | ($999,904) | — | ($10,026,668) | ($3,103,477) | ($989,854) | ($6,362,084) | ($2,036,581) | ||||||||||||||||||
Add: | Year-end fair value of unvested awards granted in the current year | $551,538 | — | $12,509,168 | $3,962,783 | $480,587 | $4,703,334 | $2,717,334 | ||||||||||||||||||
Add: | Year-over-year difference of year-end fair values for unvested awards granted in prior years | ($1,110,837) | ($1,961,668) | — | $3,989,797 | ($853,182) | — | — | ||||||||||||||||||
Add: | Difference in fair values between prior year-end fair values and vest date fair values for awards granted in prior years and vested at prior year end or during current year | ($364,999) | ($100,832) | — | $1,349,788 | ($192,135) | — | — | ||||||||||||||||||
Total Adjustments for Equity Awards | ($1,924,202) | ($2,062,500) | $2,482,500 | $6,198,891 | ($1,554,584) | ($1,658,749) | $680,753 | |||||||||||||||||||
Compensation Actually Paid | $71,043 | ($1,090,621) | $12,566,218 | $9,302,368 | ($60,371) | $5,371,399 | $2,862,386 | |||||||||||||||||||
(4) | The dollar amounts reported for the non- PEO Named Executive Officers for 2024 are the average of the amounts reported for the other NEOs, Jordan Neeser, Robert Friedland, Quentin Markin and Cassandra Joseph, for the corresponding year in the “Total” column of the Fiscal Year 2024 Summary Compensation Table for 2024, the amounts reported for the non- PEO Named Executive Officers for 2023 are the average of the amounts reported for the other NEOs, Quentin Markin and Cassandra Joseph, for the corresponding year in the “Total” column of the Summary Compensation Table of the Proxy Statement dated April 24, 2023, and the amounts reported for 2022 are the amounts reported for the other NEOs, Jordan Neeser and Glen Kuntz, in the “Total” column of the Summary Compensation Table of the Proxy Statement dated April 28, 2023. |
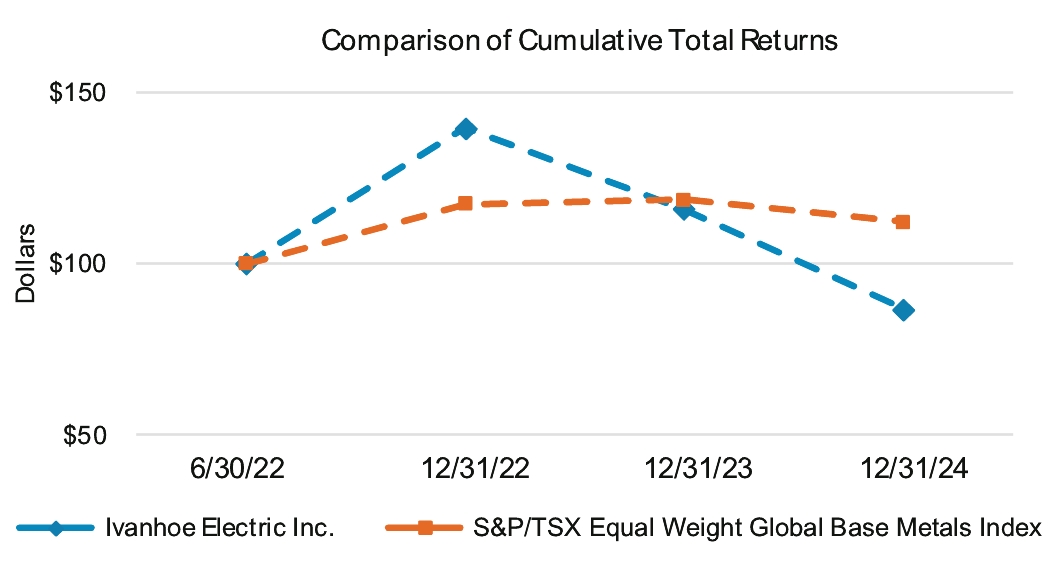
(5) | Total Shareholder Return assumes the investment of $100 in our common stock beginning on June 30, 2022, which is when our common stock began trading |
(6) | Peer group return is based on the S&P/TSX Equal Weight Global Base Metals Index. |
(7) | The Company’s net loss is reflected in the Company’s audited financial statements. |
(8) | For 2024, the Company did not use any financial reporting measures to link compensation actually paid to the Company’s NEOs for fiscal year 2024 to company performance. As discussed under “Compensation Discussion & Analysis-Short Term Incentive Awards,” the Company focused on health, safety and the environment; operational performance; and corporate development in linking compensation to company performance for 2024. |
(1) | The dollar amounts reported for the current PEO are the amounts reported for our CEO, Mr. Melvin (the Company’s President and Chief Executive Officer since November 21, 2022), for each corresponding year in the “Total” column of the Fiscal Year 2024 Summary Compensation Table. |
(2) | The dollar amounts reported for the former PEO are the amounts reported for our former CEO, Mr. Friedland (the Company’s Executive Chairman) for each corresponding year in the “Total” column of the Summary Compensation Table of the Proxy Statement dated April 28, 2023. |
(4) | The dollar amounts reported for the non- PEO Named Executive Officers for 2024 are the average of the amounts reported for the other NEOs, Jordan Neeser, Robert Friedland, Quentin Markin and Cassandra Joseph, for the corresponding year in the “Total” column of the Fiscal Year 2024 Summary Compensation Table for 2024, the amounts reported for the non- PEO Named Executive Officers for 2023 are the average of the amounts reported for the other NEOs, Quentin Markin and Cassandra Joseph, for the corresponding year in the “Total” column of the Summary Compensation Table of the Proxy Statement dated April 24, 2023, and the amounts reported for 2022 are the amounts reported for the other NEOs, Jordan Neeser and Glen Kuntz, in the “Total” column of the Summary Compensation Table of the Proxy Statement dated April 28, 2023. |
(6) | Peer group return is based on the S&P/TSX Equal Weight Global Base Metals Index. |
(3) | Deductions from, and additions to, total compensation in the Fiscal Year 2024 Summary Compensation Table (SCT) by year to calculate Compensation Actually Paid (“CAP”) include: |
PEO | Former PEO | Average Non- PEO NEOs | ||||||||||||||||||||||||
2024 | 2023 | 2022 | 2022 | 2024 | 2023 | 2022 | ||||||||||||||||||||
Summary Compensation Total | $1,995,245 | $971,879 | $10,083,718 | $3,103,477 | $1,494,211 | $7,030,149 | $2,181,633 | |||||||||||||||||||
Adjustments for Equity Awards | ||||||||||||||||||||||||||
Deduct: | Grant date values in SCT | ($999,904) | — | ($10,026,668) | ($3,103,477) | ($989,854) | ($6,362,084) | ($2,036,581) | ||||||||||||||||||
Add: | Year-end fair value of unvested awards granted in the current year | $551,538 | — | $12,509,168 | $3,962,783 | $480,587 | $4,703,334 | $2,717,334 | ||||||||||||||||||
Add: | Year-over-year difference of year-end fair values for unvested awards granted in prior years | ($1,110,837) | ($1,961,668) | — | $3,989,797 | ($853,182) | — | — | ||||||||||||||||||
Add: | Difference in fair values between prior year-end fair values and vest date fair values for awards granted in prior years and vested at prior year end or during current year | ($364,999) | ($100,832) | — | $1,349,788 | ($192,135) | — | — | ||||||||||||||||||
Total Adjustments for Equity Awards | ($1,924,202) | ($2,062,500) | $2,482,500 | $6,198,891 | ($1,554,584) | ($1,658,749) | $680,753 | |||||||||||||||||||
Compensation Actually Paid | $71,043 | ($1,090,621) | $12,566,218 | $9,302,368 | ($60,371) | $5,371,399 | $2,862,386 | |||||||||||||||||||
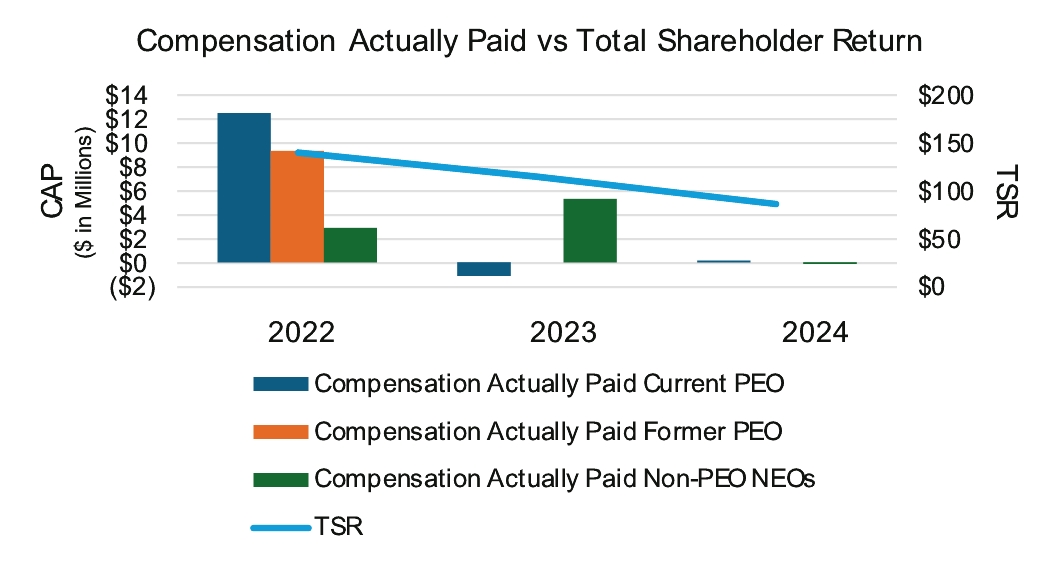
RELATIONSHIP BETWEEN COMPENSATION ACTUALLY PAID AND TOTAL SHAREHOLDER RETURN
The following chart illustrates the relationship between CAP to our Current PEO, Former PEO and non-PEO NEOs (averaged), and our Company’s TSR over the reporting period.
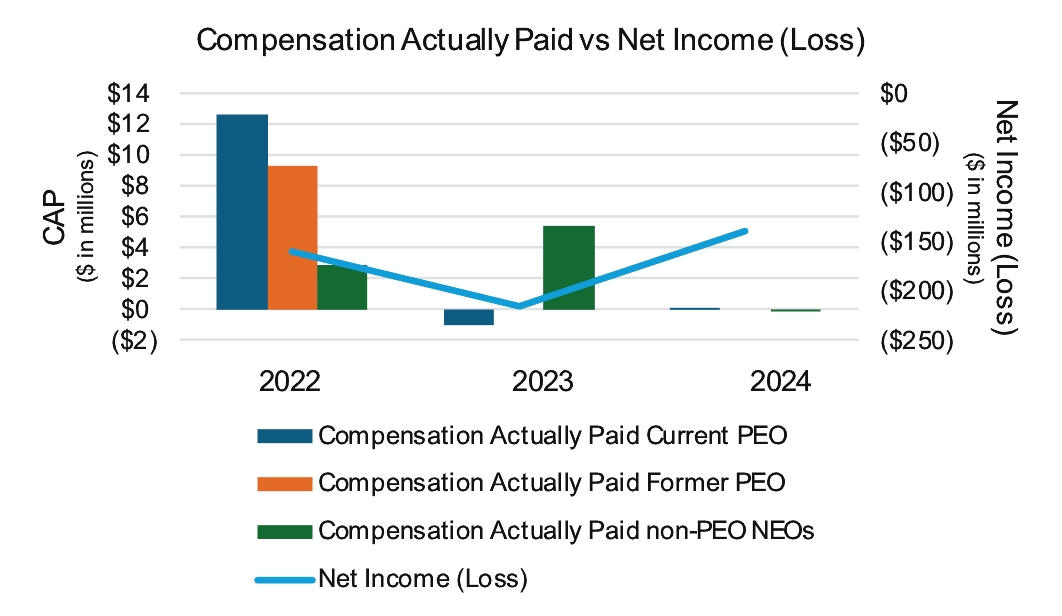
RELATIONSHIP BETWEEN COMPENSATION ACTUALLY PAID AND NET INCOME
The following chart illustrates the relationship between CAP to our Current PEO, Former PEO and non-PEO NEOs (averaged), and our Net Income (Loss) over the reporting period.
RELATIONSHIP BETWEEN TOTAL SHAREHOLDER RETURN AND PEER GROUP TOTAL SHAREHOLDER RETURN
The following chart illustrates the relationship between our total shareholder return and our peer group total shareholder return over the reporting period.