Pay vs Performance Disclosure - USD ($)
Dec. 31, 2024
Jul. 09, 2024
Dec. 31, 2024
Dec. 31, 2023
Dec. 31, 2022
Pay-Versus-Performance
The following table sets forth information concerning the compensation of our PEO(s) and the other named executive officers for each of the fiscal years ended December 31, 2024, 2023 and 2022 and our financial performance for each such fiscal year:
Year |
Summary Compensation Table Total for PEO – Wernikoff ($) (1) |
Summary Compensation Table Total for PEO – Stibel ($) (1) |
Compensation Actually Paid to PEO – Wernikoff ($) (2) |
Compensation Actually Paid to PEO – Stibel ($) (2) |
Average Summary Compensation Table Total For Non-PEO Named Executive Officers ($) (1) |
Average Compensation Actually Paid to Non-PEO Named Executive Officers ($) (2) |
Value of Initial Fixed $100 Investment Based On: |
Net Income (Loss) ($) (4) |
Adjusted EBITDA ($) (5) | |||||||||||
Total Shareholder Return ($) (3) |
Peer Group Total Shareholder Return ($) (3) | |||||||||||||||||||
2024 |
12,441,053 | 61,184,704 | (12,431,614) | 43,778,341 | 11,781,128 | 2,715,864 | 19.84 | 92.64 | 29,962,519 | 148,113,727 | ||||||||||
2023 |
15,952,976 | — | 20,239,579 | — | 6,480,194 | 8,875,106 | 29.85 | 71.27 | 13,953,160 | 118,691,151 | ||||||||||
2022 |
10,398,594 | — | (10,419,083) | — | 5,676,307 | (2,068,778) | 20.45 | 44.15 | (48,733,016) | 63,704,963 | ||||||||||
| (1) | For the fiscal years ended December 31, 2024, 2023 and 2022, our PEO and remaining non-PEO named executive officers were as set forth below. For 2024, Mr. Wernikoff served as PEO from January 1, 2024 to July 9, 2024 and Mr. Stibel served as PEO from July 9, 2024 to December 31, 2024. |
Year |
PEOs |
Non-PEO Named Executive Officers |
||||||
2024 |
Mr. Stibel and Mr. Wernikoff | Messrs. Watson, Preece and Radhakrishna and Ms. Miller | ||||||
2023 |
Mr. Wernikoff | Messrs. Watson, Preece and Radhakrishna and Ms. Miller | ||||||
2022 |
Mr. Wernikoff | Messrs. Watson, Preece and Radhakrishna and Ms. Miller | ||||||
| (2) | The following table reflects the adjustments used to calculate compensation actually paid from the summary compensation table amounts for 2024. The summary compensation table amounts and the compensation actually paid amounts do not reflect the actual amount of compensation earned by or paid to our executive officers during the applicable year, but rather are amounts determined in accordance with Item 402 of Regulation S-K under the Exchange Act. For information regarding the decisions made by our Compensation Committee in regards to our executive officers’ compensation for 2024, see the “Compensation Discussion and Analysis |
2024 | ||||||
PEO - Wernikoff |
PEO - Stibel |
Average for Non- PEO Named Executive Officers | ||||
Total Reported in Summary Compensation Table |
12,441,053 |
61,184,704 |
11,781,128 | |||
(Minus): Reported SCT Value of Equity Awards (a) |
(11,237,638) | (60,700,819) | (11,126,042) | |||
Plus/(Minus): Equity Award Adjustments (b) |
(13,635,029) | 43,294,455 | 2,060,778 | |||
Compensation Actually Paid |
(12,431,614) | 43,778,341 | 2,715,864 | |||
| (a) | The amounts included in this column are the amounts reported in the “Stock Awards” and “Option Awards” columns of the Summary Compensation Table for each applicable year. |
| (b) | The equity award adjustments for each applicable year were calculated in accordance with the methodology required by Item 402(v) of Regulation S-K. The amounts deducted or added in calculating the equity award adjustments are provided in the table below: |
Year End Fair Value of Outstanding and Unvested Awards Granted in the Year |
Year-Over-Year Change in Fair Value of Outstanding and Unvested Equity Awards Granted in Prior Years |
Fair Value at Vesting of Equity Awards Granted and Vested in the Fiscal Year |
Year-Over-Year Change in Fair Value of Equity Awards Granted in Prior Years That Vested During the Year |
Fair Value as of Prior Fiscal Year End of Equity Awards Granted in Prior Fiscal Years that Failed to Meet Vesting Conditions in the Fiscal Year |
Total Equity Award Adjustments | |||||||
PEO - Wernikoff |
— | — | 216,989 | (178,808) | (13,673,210) | (13,635,029) | ||||||
PEO - Stibel |
43,035,972 | — | 258,483 | — | — | 43,294,455 | ||||||
Non-PEO |
6,595,039 | (701,759) | 214,926 | (594,252) | (3,453,176) | 2,060,778 | ||||||
| (3) | Peer group total shareholder return reflects the Company’s peer group (Nasdaq CTA Internet Index) as reflected in our Annual Report on Form 10-K for the year ended December 31, 2024 and filed with the SEC on February 26, 2025. Each year reflects what the cumulative value of $100 would be, including the reinvestment of dividends, if such amount were invested on June 29, 2021, the date of our IPO. |
| (4) | Represents net income (loss) reported in our audited financial statements for the applicable year. |
| (5) | The Company’s most important financial performance measure is Adjusted EBITDA, a non-GAAP measure. Adjusted EBITDA is defined as set forth in the Company’s Annual Report on Form 10-K for the year ended December 31, 2024, which was filed with the SEC on February 26, 2025. |
10-K
for the year ended December 31, 2024 and filed with the SEC on February 26, 2025. Each year reflects what the cumulative value of $100 would be, including the reinvestment of dividends, if such amount were invested on June 29, 2021, the date of our IPO.
| (2) | The following table reflects the adjustments used to calculate compensation actually paid from the summary compensation table amounts for 2024. The summary compensation table amounts and the compensation actually paid amounts do not reflect the actual amount of compensation earned by or paid to our executive officers during the applicable year, but rather are amounts determined in accordance with Item 402 of Regulation S-K under the Exchange Act. For information regarding the decisions made by our Compensation Committee in regards to our executive officers’ compensation for 2024, see the “Compensation Discussion and Analysis |
2024 | ||||||
PEO - Wernikoff |
PEO - Stibel |
Average for Non- PEO Named Executive Officers | ||||
Total Reported in Summary Compensation Table |
12,441,053 |
61,184,704 |
11,781,128 | |||
(Minus): Reported SCT Value of Equity Awards (a) |
(11,237,638) | (60,700,819) | (11,126,042) | |||
Plus/(Minus): Equity Award Adjustments (b) |
(13,635,029) | 43,294,455 | 2,060,778 | |||
Compensation Actually Paid |
(12,431,614) | 43,778,341 | 2,715,864 | |||
| (a) | The amounts included in this column are the amounts reported in the “Stock Awards” and “Option Awards” columns of the Summary Compensation Table for each applicable year. |
| (b) | The equity award adjustments for each applicable year were calculated in accordance with the methodology required by Item 402(v) of Regulation S-K. The amounts deducted or added in calculating the equity award adjustments are provided in the table below: |
Year End Fair Value of Outstanding and Unvested Awards Granted in the Year |
Year-Over-Year Change in Fair Value of Outstanding and Unvested Equity Awards Granted in Prior Years |
Fair Value at Vesting of Equity Awards Granted and Vested in the Fiscal Year |
Year-Over-Year Change in Fair Value of Equity Awards Granted in Prior Years That Vested During the Year |
Fair Value as of Prior Fiscal Year End of Equity Awards Granted in Prior Fiscal Years that Failed to Meet Vesting Conditions in the Fiscal Year |
Total Equity Award Adjustments | |||||||
PEO - Wernikoff |
— | — | 216,989 | (178,808) | (13,673,210) | (13,635,029) | ||||||
PEO - Stibel |
43,035,972 | — | 258,483 | — | — | 43,294,455 | ||||||
Non-PEO |
6,595,039 | (701,759) | 214,926 | (594,252) | (3,453,176) | 2,060,778 | ||||||
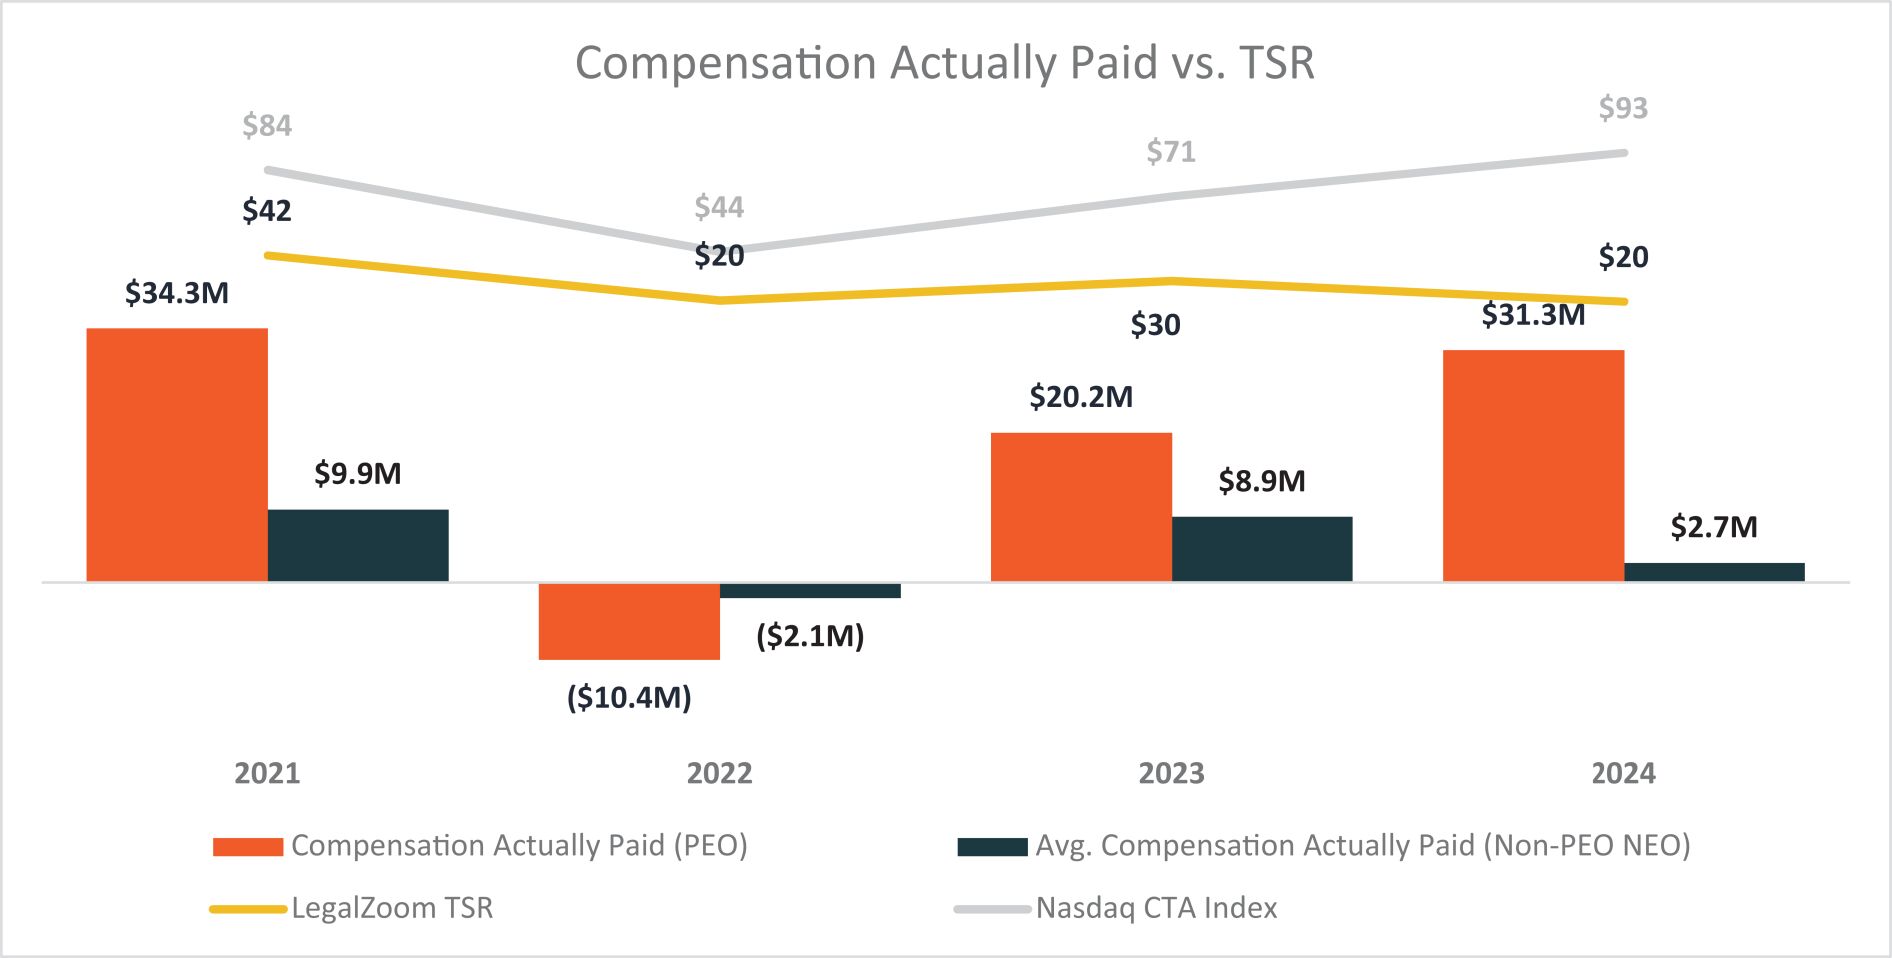
The following graph reflects the relationship between the compensation actually paid or earned by our named executive officers and (i) the Company’s cumulative total stockholder return and (ii) the cumulative total stockholder return of the Nasdaq CTA Internet index (as disclosed above), in each case, assuming an initial fixed investment of $100 on June 30, 2021, the date of our IPO.
The following graph compares the compensation actually paid to our PEOs, the average compensation actually paid to our
non-PEO
named executive officers and net income (loss): 
The following graph compares the compensation actually paid to our PEOs, the average compensation actually paid to our
non-PEO
named executive officers and Adjusted EBITDA: 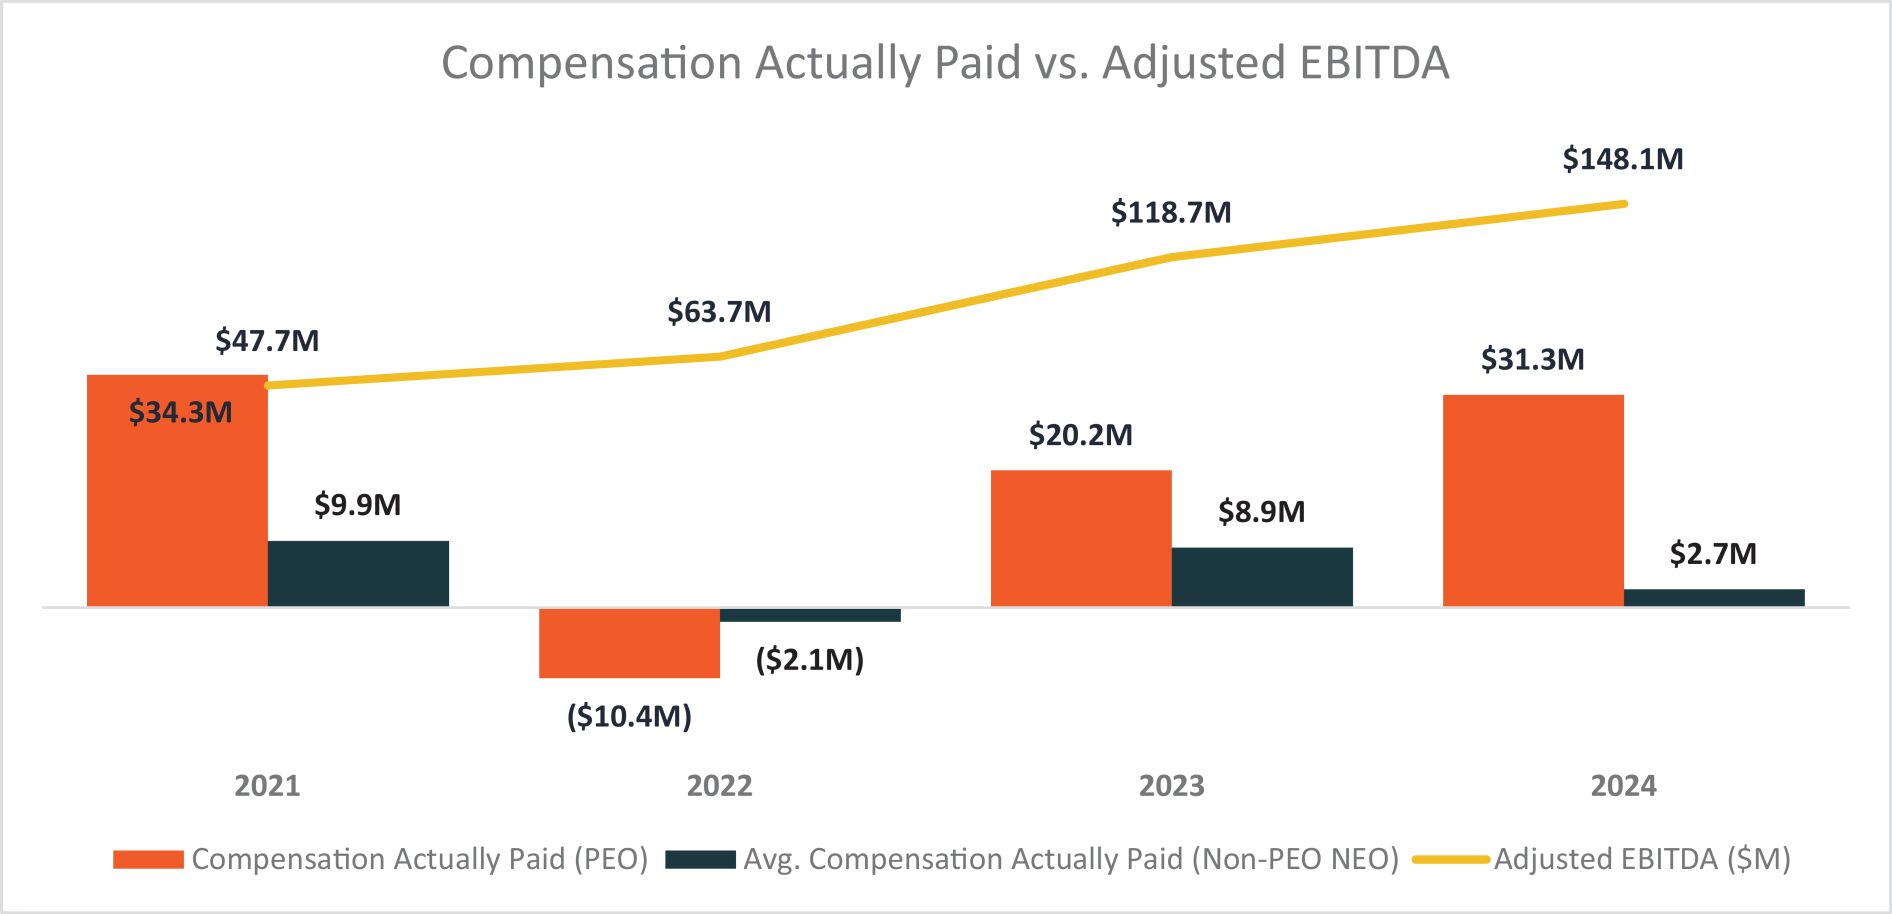
The following graph reflects the relationship between the compensation actually paid or earned by our named executive officers and (i) the Company’s cumulative total stockholder return and (ii) the cumulative total stockholder return of the Nasdaq CTA Internet index (as disclosed above), in each case, assuming an initial fixed investment of $100 on June 30, 2021, the date of our IPO.
Tabular List of Financial Performance Measures
The following table presents the financial and .” Over time we have considered different performance measures to be the most important, and we would expect them to change in the future as well.
non-financial
measures that, in our assessment, represent the most important financial measures used by the Company to link compensation actually paid to our named executive officers to Company performance in 2024. Adjusted EBITDA and revenue, each a financial performance measure, are each used for purposes of determining cash payouts under the Company’s annual bonus plan, as well as achievement of the 2024 PSUs. Adjusted EBITDA and revenue are the only financial performance measures we used to link compensation actually paid to our named executive officers to Company performance in 2024. See above under “Compensation Discussion and Analysis—Material Elements of Compensation
Most Important Performance Measures |
Adjusted EBITDA Revenue |
All information provided above under the
“Pay-Versus-Performance”
heading will not be deemed to be incorporated by reference into any filing of the Company under the Securities Act or the Exchange Act, whether made before or after the date hereof and irrespective of any general incorporation language in any such filing, except to the extent the Company specifically incorporates such information by reference. non-GAAP
measure. Adjusted EBITDA is defined as set forth in the Company’s Annual Report on Form 10-K
for the year ended December 31, 2024, which was filed with the SEC on February 26, 2025.