| |
|
|
|
|
|
|
|
|
|
|
Value of Initial Fixed $100 Based on: |
| ||||||||||||
Summary Compensation Table Total for PEO |
Compensation Actually Paid to PEO |
Summary Compensation Table Total for Travis Mickle, Ph.D. |
Compensation Actually Paid to Travis Mickle, Ph.D. |
Summary Compensation Table Total for Richard W. Pascoe |
Compensation Actually Paid to Richard W. Pascoe |
Summary Compensation Table Total for Christal M.M. Mickle |
Compensation Actually Paid to Christal M.M. Mickle |
Average Summary Compensation Table Total for Non-PEO NEOs |
Average Compensation Actually Paid to Non-PEO NEOs |
Total Shareholder Return |
Net Income | |||||||||||||
Year |
($)(1) |
($)(1) |
($)(2) |
($)(2) |
($)(3) |
($)(3) |
($)(4) |
($)(4) |
($)(5) |
($)(5) |
($) |
($) | ||||||||||||
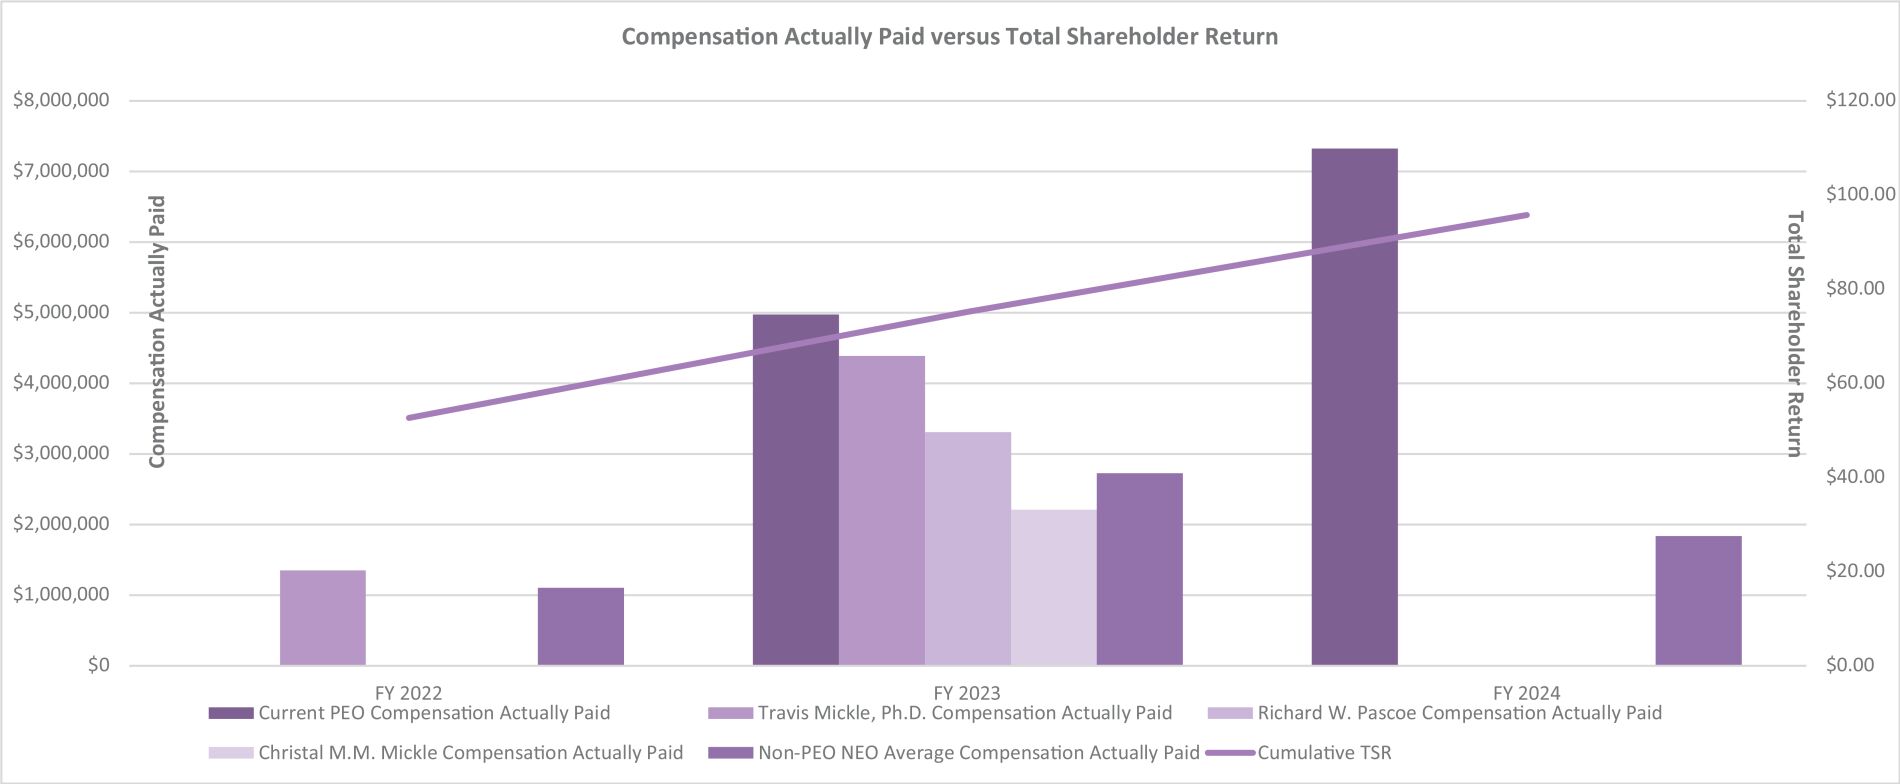
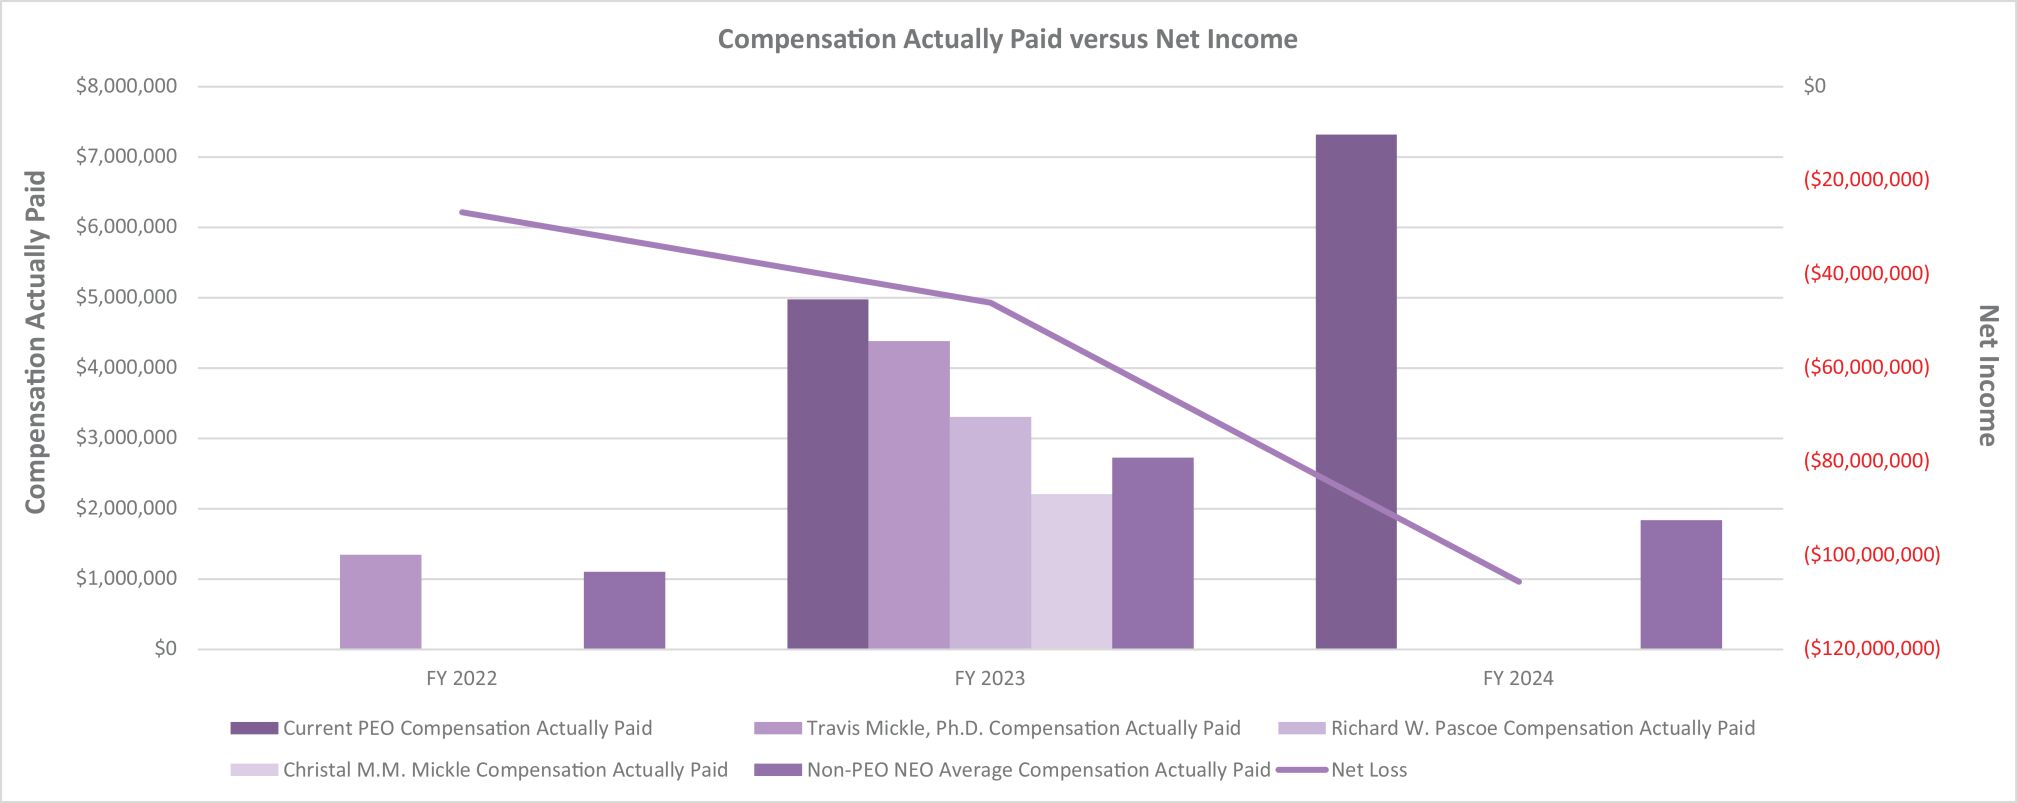
| 2024 | 5,355,059 | 7,323,149 | — | — | — | — | — | — | 1,982,865 | 1,837,951 | 95.75 | (105,511,000) | ||||||||||||
| 2023 | 3,445,231 | 4,975,770 | 3,593,438 | 4,385,998 | 4,122,558 | 3,308,589 | 1,669,956 | 2,211,127 | 2,039,861 | 2,724,999 | 75.20 | (46,049,000) | ||||||||||||
| 2022 | — | — | 2,400,356 | 1,349,703 | — | — | — | — | 1,199,492 | 1,106,040 | 52.70 | (26,772,000) | ||||||||||||
| (1) | Mr. McFarlane became our Chief Executive Officer on October 10, 2023. |
| (2) | Dr. Travis Mickle served as the Company’s Chief Executive Officer in 2022 and from January 1, 2023 until January 6, 2023. |
| (3) | Mr. Pascoe served as the Company’s Chief Executive Officer from January 6, 2023 until June 1, 2023. As noted below, Mr. Pascoe also served as a non-PEO NEO in 2022, and his compensation for that year is reflected in the columns entitled “Average Summary Compensation Table Total for Non-PEO NEOs” and “Average Compensation Actually Paid to Non-PEO NEOs.” |
| (4) | Ms. Christal Mickle served as the Company’s Interim Chief Executive Officer from June 1, 2023 until October 10, 2023. |
| (5) | Amounts represent the average compensation actually paid to our remaining named executive officers for the relevant fiscal year, as determined under SEC rules (and described below), which includes the individuals indicated below for each fiscal year. |
• |
2024: Adrian Quartel, M.D., PPFM, and R. LaDuane Clifton, MBA, CPA |
• |
2023: R. LaDuane Clifton, MBA, CPA, and Joshua Schafer, M.S., MBA |
• |
2022: Richard W. Pascoe, and R. LaDuane Clifton, MBA, CPA |
2024 | ||||
Adjustments |
Current PEO |
Average Non-PEO | ||
Deduction for Amounts Reported under the “Stock Awards” and “Option Awards” Columns in the Summary Compensation Table for Applicable FY |
($4,018,000) | ($1,280,180) | ||
Increase based on ASC 718 Fair Value of Awards Granted during Applicable FY that Remain Unvested as of Applicable FY End, determined as of Applicable FY End |
$5,838,000 | $1,308,135 | ||
Increase based on ASC 718 Fair Value of Awards Granted during Applicable FY that Vested during Applicable FY, determined as of Vesting Date |
- | - | ||
Increase/deduction for Awards Granted during Prior FY that were Outstanding and Unvested as of Applicable FY End, determined based on change in ASC 718 Fair Value from Prior FY End to Applicable FY End |
$156,585 | ($101,918) | ||
Increase/deduction for Awards Granted during Prior FY that Vested During Applicable FY, determined based on change in ASC 718 Fair Value from Prior FY End to Vesting Date |
($8,495) | ($70,951) | ||
Deduction of ASC 718 Fair Value of Awards Granted during Prior FY that were Forfeited during Applicable FY, determined as of Prior FY End |
- |
- | ||
Increase based on Dividends or Other Earnings Paid during Applicable FY prior to Vesting Date |
- |
- | ||
Increase based on Dividends or Other Earnings Paid during Applicable FY prior to Vesting Date |
- |
- | ||
Total Adjustments |
$1,968,090 |
($144,914) | ||
• |
2024: Adrian Quartel, M.D., PPFM, and R. LaDuane Clifton, MBA, CPA |
• |
2023: R. LaDuane Clifton, MBA, CPA, and Joshua Schafer, M.S., MBA |
• |
2022: Richard W. Pascoe, and R. LaDuane Clifton, MBA, CPA |
2024 | ||||
Adjustments |
Current PEO |
Average Non-PEO | ||
Deduction for Amounts Reported under the “Stock Awards” and “Option Awards” Columns in the Summary Compensation Table for Applicable FY |
($4,018,000) | ($1,280,180) | ||
Increase based on ASC 718 Fair Value of Awards Granted during Applicable FY that Remain Unvested as of Applicable FY End, determined as of Applicable FY End |
$5,838,000 | $1,308,135 | ||
Increase based on ASC 718 Fair Value of Awards Granted during Applicable FY that Vested during Applicable FY, determined as of Vesting Date |
- | - | ||
Increase/deduction for Awards Granted during Prior FY that were Outstanding and Unvested as of Applicable FY End, determined based on change in ASC 718 Fair Value from Prior FY End to Applicable FY End |
$156,585 | ($101,918) | ||
Increase/deduction for Awards Granted during Prior FY that Vested During Applicable FY, determined based on change in ASC 718 Fair Value from Prior FY End to Vesting Date |
($8,495) | ($70,951) | ||
Deduction of ASC 718 Fair Value of Awards Granted during Prior FY that were Forfeited during Applicable FY, determined as of Prior FY End |
- |
- | ||
Increase based on Dividends or Other Earnings Paid during Applicable FY prior to Vesting Date |
- |
- | ||
Increase based on Dividends or Other Earnings Paid during Applicable FY prior to Vesting Date |
- |
- | ||
Total Adjustments |
$1,968,090 |
($144,914) | ||

