Pure in Thousands
The following Pay Versus Performance information presents the compensation of our NEOs disclosed in the Summary Compensation Table (“SCT”), as well as compensation actually paid (“CAP”) to our NEOs and certain performance measure results prepared in accordance with Item 402(v) of SEC Regulation S-K.
As discussed further below, the CAP amounts do not necessarily represent actual compensation earned or realized by our NEOs in a given year. The Compensation Committee did not consider the Pay Versus Performance information in making its compensation decisions for our NEOs. For additional information about our performance-based pay philosophy and how the Compensation Committee aligns executive compensation with our performance, refer to “Named Executive Officer Compensation — Compensation Discussion and Analysis” in this Proxy Statement and in the proxy statements for 2020, 2021, 2022 and 2023.
|
Value of Initial Fixed $100 Investment Based on: |
||||||||||||||||||||||||||||||||
|
Year |
Summary Compensation Table Total for PEO ($)(1) |
Compensation Actually Paid to PEO ($)(1)(2) |
Average Summary Compensation Table Total for Non-PEO NEOs ($)(1) |
Average Compensation Actually Paid to Non-PEO NEOs ($)(1)(2) |
TSR ($)(3) |
Peer Group TSR ($)(3) |
Net Income (in thousands)($)(4) |
Company-Selected Measure: Non-GAAP Operating Income (in thousands)($)(5) |
||||||||||||||||||||||||
|
2024 |
18,979,292 | 21,914,905 | 8,070,410 | 8,549,589 | 344.73 | 269.24 | 1,786,700 | 768,132 | ||||||||||||||||||||||||
|
2023 |
14,643,469 | 138,253,668 | 5,936,147 | 48,844,169 | 365.00 | 225.75 | 427,374 | 648,031 | ||||||||||||||||||||||||
|
2022 |
20,664,936 | (66,596,378 | ) | 8,578,977 | (18,412,649 | ) | 203.03 | 136.90 | 437,672 | 688,899 | ||||||||||||||||||||||
|
2021 |
20,254,831 | 114,053,034 | 7,227,671 | 35,989,415 | 281.12 | 213.35 | 242,023 | 400,289 | ||||||||||||||||||||||||
|
2020 |
14,670,153 | 166,896,795 | 4,194,878 | 50,263,845 | 207.49 | 151.14 | 164,375 | 257,887 | ||||||||||||||||||||||||
|
(1) |
For each of 2024, 2023, 2022, 2021 and 2020 (each, a “Covered Year”), our CEO, Mr. Hsing, served as our principal executive officer (“PEO”). For each Covered Year, our non-PEO NEOs were Mr. Blegen, Mr. Xiao, Mr. Sciammas and Ms. Tseng. |
|
(2) |
The amounts represent the CAP amounts calculated in accordance with SEC rules. The following table provides a reconciliation of the SCT amounts to the CAP amounts for 2024: |
|
FY 2024 |
|||||||||
|
Reconciliation of SCT amounts to CAP amounts (a) |
PEO ($) |
Average Non-PEO NEOs ($) |
|||||||
|
Total SCT amounts |
18,979,292 | 8,070,410 | |||||||
| - |
“Stock Awards” amounts under the SCT |
(12,268,389 | ) | (4,646,725 | ) | ||||
|
+ |
Covered Year-end fair value of awards granted in the Covered Year that are outstanding and unvested as of the end of the Covered Year |
11,468,302 | 4,343,687 | ||||||
|
- |
Change in fair value (from prior year-end to Covered Year-end) of awards granted prior to Covered Year that are outstanding and unvested as of the end of the Covered Year |
(3,237,668 | ) | (1,268,185 | ) | ||||
|
+ |
Change in fair value (from prior year-end to vesting date) of awards granted prior to Covered Year that vested in the Covered Year |
6,973,368 | 2,050,402 | ||||||
|
Total CAP amounts |
21,914,905 | 8,549,589 | |||||||
_____________
|
(a) |
The grant date fair value of the equity awards was determined using a Monte Carlo simulation model. Assumptions used in the grant date valuation are disclosed in our 2024 Annual Report. For equity awards vested during the applicable Covered Year, the fair value was based on the closing stock price plus accumulated dividend equivalents at the vesting date. For outstanding equity awards for which the performance conditions have not been achieved, the year-end fair value was determined using a Monte Carlo simulation model. For outstanding equity awards for which all the performance conditions have been achieved but additional time-based service conditions are required, the year-end fair value was based on the closing stock price plus accumulated dividend equivalents. The increases or decreases in the year-end fair value were primarily driven by changes in our stock price. |
|
(3) |
For purposes of this tabular disclosure, our peer group represents the PHLX Index, which we also disclose in the stock performance graph required by Item 201(e) of Regulation S-K included in our 2024 Annual Report. For each Covered Year, our TSR and our peer group’s TSR were calculated as the cumulative TSR from December 31, 2019 through the last day of the applicable Covered Year, assuming that $100 was invested on December 31, 2019. Because fiscal years are presented in the table in reverse chronological order (from top to bottom), the table should be read from bottom to top for purposes of understanding cumulative returns over time. |
|
(4) |
The amounts represent GAAP net income. In 2024, one of our foreign subsidiaries was granted a ten-year tax incentive. A deferred tax benefit of approximately $1.3 billion, net of $0.1 billion of valuation allowance, was recorded in 2024 to reflect the estimated future reductions in cash tax paid in that jurisdiction associated with the incentive. This deferred tax benefit favorably impacted our 2024 GAAP net income. |
|
(5) |
In our assessment, the Company-Selected Measure is non-GAAP operating income, which represents the most important financial performance measure used by us to link CAP to our NEOs, for 2024, to our performance. Refer to “Named Executive Officer Compensation - Compensation Discussion and Analysis” for further discussion. Non-GAAP operating income represents GAAP operating income, excluding stock-based compensation and related expense, deferred compensation expense/income, amortization of acquisition-related intangible assets and litigation expense. See Annexure A for a reconciliation of GAAP operating income to non-GAAP operating income used in our short-term cash incentive plan. |
Relationship Between CAP and Performance Measures
Because our executive compensation program is significantly comprised of performance-based equity awards, the primary determinants of the CAP amounts, as calculated under SEC rules, are our stock price, actual payouts from awards vested during the applicable Covered Year, and the number of outstanding awards based on projected and actual performance achievement. As shown in the table above, the CAP amounts include year-end revaluations of equity awards granted in the applicable Covered Year, plus the year-over-year changes in the fair value of vested and outstanding equity awards granted in multiple historical years, all of which are heavily impacted by the performance of our stock price.
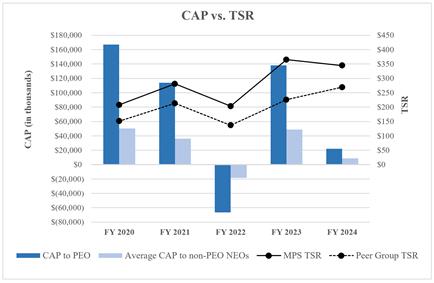
Relationship Between CAP and TSR:
The following chart compares the CAP amounts to our TSR and our peer group's TSR since December 31, 2019, measured as of the last day of each Covered Year.
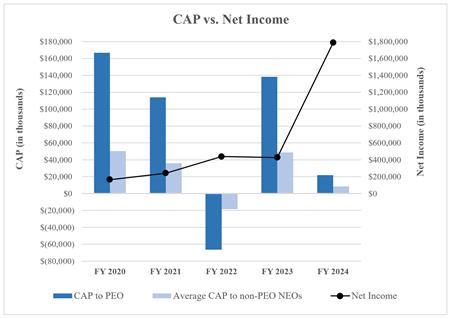
Relationship Between CAP and Net Income:
The following chart compares the CAP amounts to our net income for each Covered Year.
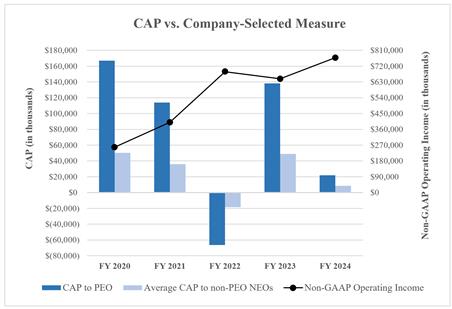
Relationship Between CAP and Company-Selected Measure:
The following chart compares the CAP amounts to the Company-Selected Measure for each Covered Year.
2024 Tabular List of Performance Measures
The following list includes the performance measures that, in our assessment, represent the most important financial and non-financial performance measures used by us to link CAP to our NEOs, for 2024, to our performance. These measures are not ranked.
|
1. |
Revenue growth rate |
|
2. |
Non-GAAP operating income |
|
3. |
GHG emissions reduction |
|
4. |
Revenue generated from EV manufacturers |
|
5. |
Revenue generated from products enabling EV powertrains and 48-volt electrical systems |
| [1] | For each of 2024, 2023, 2022, 2021 and 2020 (each, a “Covered Year”), our CEO, Mr. Hsing, served as our principal executive officer (“PEO”). For each Covered Year, our non-PEO NEOs were Mr. Blegen, Mr. Xiao, Mr. Sciammas and Ms. Tseng. | |||||||||||||||||||||||||||||||||||||||||||||||||||||||||||||||||||||||||||||||||||
| [2] | The grant date fair value of the equity awards was determined using a Monte Carlo simulation model. Assumptions used in the grant date valuation are disclosed in our 2024 Annual Report. For equity awards vested during the applicable Covered Year, the fair value was based on the closing stock price plus accumulated dividend equivalents at the vesting date. For outstanding equity awards for which the performance conditions have not been achieved, the year-end fair value was determined using a Monte Carlo simulation model. For outstanding equity awards for which all the performance conditions have been achieved but additional time-based service conditions are required, the year-end fair value was based on the closing stock price plus accumulated dividend equivalents. The increases or decreases in the year-end fair value were primarily driven by changes in our stock price. | |||||||||||||||||||||||||||||||||||||||||||||||||||||||||||||||||||||||||||||||||||
| [3] | The amounts represent the CAP amounts calculated in accordance with SEC rules. The following table provides a reconciliation of the SCT amounts to the CAP amounts for 2024:
_____________
|
|||||||||||||||||||||||||||||||||||||||||||||||||||||||||||||||||||||||||||||||||||
| [4] | For purposes of this tabular disclosure, our peer group represents the PHLX Index, which we also disclose in the stock performance graph required by Item 201(e) of Regulation S-K included in our 2024 Annual Report. For each Covered Year, our TSR and our peer group’s TSR were calculated as the cumulative TSR from December 31, 2019 through the last day of the applicable Covered Year, assuming that $100 was invested on December 31, 2019. Because fiscal years are presented in the table in reverse chronological order (from top to bottom), the table should be read from bottom to top for purposes of understanding cumulative returns over time. | |||||||||||||||||||||||||||||||||||||||||||||||||||||||||||||||||||||||||||||||||||
| [5] | The amounts represent GAAP net income. In 2024, one of our foreign subsidiaries was granted a ten-year tax incentive. A deferred tax benefit of approximately $1.3 billion, net of $0.1 billion of valuation allowance, was recorded in 2024 to reflect the estimated future reductions in cash tax paid in that jurisdiction associated with the incentive. This deferred tax benefit favorably impacted our 2024 GAAP net income. | |||||||||||||||||||||||||||||||||||||||||||||||||||||||||||||||||||||||||||||||||||
| [6] | In our assessment, the Company-Selected Measure is non-GAAP operating income, which represents the most important financial performance measure used by us to link CAP to our NEOs, for 2024, to our performance. Refer to “Named Executive Officer Compensation - Compensation Discussion and Analysis” for further discussion. Non-GAAP operating income represents GAAP operating income, excluding stock-based compensation and related expense, deferred compensation expense/income, amortization of acquisition-related intangible assets and litigation expense. See Annexure A for a reconciliation of GAAP operating income to non-GAAP operating income used in our short-term cash incentive plan. | |||||||||||||||||||||||||||||||||||||||||||||||||||||||||||||||||||||||||||||||||||