Pay vs Performance Disclosure - USD ($)
|
12 Months Ended |
Dec. 31, 2024 |
Dec. 31, 2023 |
Dec. 31, 2022 |
Dec. 31, 2021 |
| Pay vs Performance Disclosure |
|
|
|
|
| Pay vs Performance Disclosure, Table |
| | | | | | | | | | | | | | | | | | | | | | | | | | | | | | | Year | Summary compensation table total for PEO(1) ($) | Compensation actually paid to PEO (1)(2) ($) | Average summary compensation table total for non-PEO named executive officers(1) ($) | Average compensation actually paid to non-PEO named executive officers (1)(3) ($) | Value of initial fixed $100 investment based on: | Net loss
($) | Gross Profit ($)(5) | | Total shareholder return (4) ($) | Peer group total shareholder return(4) ($) | | | | | | | | | | | 2024 | 14,892,215 | | (99,007,921) | | 4,596,498 | | (5,930,505) | | 13.20 | | 89.50 | | (4,746,000,000) | | (1,200,000,000) | | | | 2023 | 14,354,080 | | 36,328,396 | | 8,387,695 | | 11,530,019 | | 23.29 | | 83.00 | | (5,432,000,000) | | (2,030,000,000) | | | | 2022 | 1,014,785 | | (1,991,817,641) | | 3,796,416 | | (51,055,180) | | 18.30 | | 65.34 | | (6,752,000,000) | | (3,123,000,000) | | | | 2021 | 422,140,679 | | 2,339,784,810 | | 18,107,278 | | 44,605,170 | | 102.94 | | 94.48 | | (4,688,000,000) | | (465,000,000) | | |
|
|
|
|
| Named Executive Officers, Footnote |
The NEOs included in the table above were: | | | | | | | | | | | Year | Principal Executive Officer (PEO) | | Non-PEO NEOs | 2024 | Robert J. Scaringe | | Claire McDonough and Kjell Gruner | 2023 | Robert J. Scaringe | | Claire McDonough and Kjell Gruner | | 2022 | Robert J. Scaringe | | Claire McDonough and Jiten Behl | | 2021 | Robert J. Scaringe | | Claire McDonough, Jiten Behl and Ryan Green |
|
|
|
|
| Peer Group Issuers, Footnote |
Total shareholder return is cumulative for the measurement periods beginning at market close on November 10, 2021, which is the first day our Class A Common Stock began trading. The peer group for purposes of this table is the NASDAQ OMX Global Automotive index as presented in Item 5 in our Annual Report on Form 10-K for the fiscal year ended December 31, 2024.
|
|
|
|
| PEO Total Compensation Amount |
$ 14,892,215
|
$ 14,354,080
|
$ 1,014,785
|
$ 422,140,679
|
| PEO Actually Paid Compensation Amount |
$ (99,007,921)
|
36,328,396
|
(1,991,817,641)
|
2,339,784,810
|
| Adjustment To PEO Compensation, Footnote |
The amounts are computed in accordance with ASC Topic 718. The assumptions used in calculating the fair value are set forth in Note 10 to the audited consolidated financial statements included in our Annual Report on Form 10-K for the fiscal year ended December 31, 2024. To calculate Compensation Actually Paid for the PEO, the following adjustments were made to Summary Compensation Table total compensation, calculated in accordance with the SEC methodology for determining Compensation Actually Paid for each year shown: | | | | | | | | | | | | | | | | | | | | | | | | | | | PEO | 2024 ($) | 2023 ($) | 2022 ($) | | 2021 ($) | | | | | | | | | | Summary Compensation Table Total for PEO | 14,892,215 | | 14,354,080 | | 1,014,785 | | | 422,140,679 | | | Less, value of equity awards reported in the Summary Compensation Table | (13,255,966) | | (13,239,067) | | (2,267) | | | (421,364,482) | | | Plus, year-end fair value of equity awards granted during applicable year that are unvested | 9,750,375 | | 15,463,156 | | — | | | 1,883,836,185 | | | Change, in fair value of equity awards granted in prior years that are unvested | (98,606,066) | | 20,940,755 | | (1,723,047,376) | | | 407,989,700 | | | Plus, fair value as of vesting date of equity awards granted and vested in the year | 917,224 | | 184,267 | | — | | | — | | | Change, in fair value of equity awards granted in prior years that vested in the year | (12,705,703) | | (1,374,795) | | (269,782,783) | | | 47,182,728 | | | | Compensation Actually Paid for PEO | (99,007,921) | | 36,328,396 | | (1,991,817,641) | | | 2,339,784,810 | | |
|
|
|
|
| Non-PEO NEO Average Total Compensation Amount |
$ 4,596,498
|
8,387,695
|
3,796,416
|
18,107,278
|
| Non-PEO NEO Average Compensation Actually Paid Amount |
$ (5,930,505)
|
11,530,019
|
(51,055,180)
|
44,605,170
|
| Adjustment to Non-PEO NEO Compensation Footnote |
The amounts are computed in accordance with ASC Topic 718. The assumptions used in calculating the fair value are set forth in Note 10 to the audited consolidated financial statements included in our Annual Report on Form 10-K for the fiscal year ended December 31, 2024. To calculate average Compensation Actually Paid for the non-PEO NEOs, the following adjustments were made to Summary Compensation Table total compensation, calculated in accordance with the SEC methodology for determining Compensation Actually Paid for each year shown: | | | | | | | | | | | | | | | | | | | | | | | | | | | Non-PEO NEOs | 2024 ($) | 2023 ($) | 2022 ($) | | 2021 ($) | | | | | | | | | | Summary Compensation Table Average for Non-PEO NEOs | 4,596,498 | | 8,387,695 | | 3,796,416 | | | 18,107,278 | | | Less, value of equity awards reported in the Summary Compensation Table | (3,823,115) | | (7,184,516) | | (3,215,217) | | | (17,710,842) | | | Plus, year-end fair value of equity awards granted during applicable year that are unvested | 2,812,612 | | 9,634,741 | | 1,302,361 | | | 27,672,382 | | | Change, in fair value of equity awards granted in prior years that are unvested | (2,558,175) | | 644,233 | | (34,773,808) | | | 14,855,104 | | | Plus, fair value as of vesting date of equity awards granted and vested in the year | 291,069 | | 62,148 | | 87,734 | | | — | | | Change, in fair value of equity awards granted in prior years that vested in the year | (1,956,245) | | (14,282) | | (18,252,666) | | | 1,903,203 | | | Less, fair value of equity awards that failed to meet vesting conditions in the year | (5,293,149) | | — | | — | | | (221,955) | | | | Compensation Actually Paid for Non-PEO NEOs | (5,930,505) | | 11,530,019 | | (51,055,180) | | | 44,605,170 | | |
|
|
|
|
| Compensation Actually Paid vs. Total Shareholder Return |
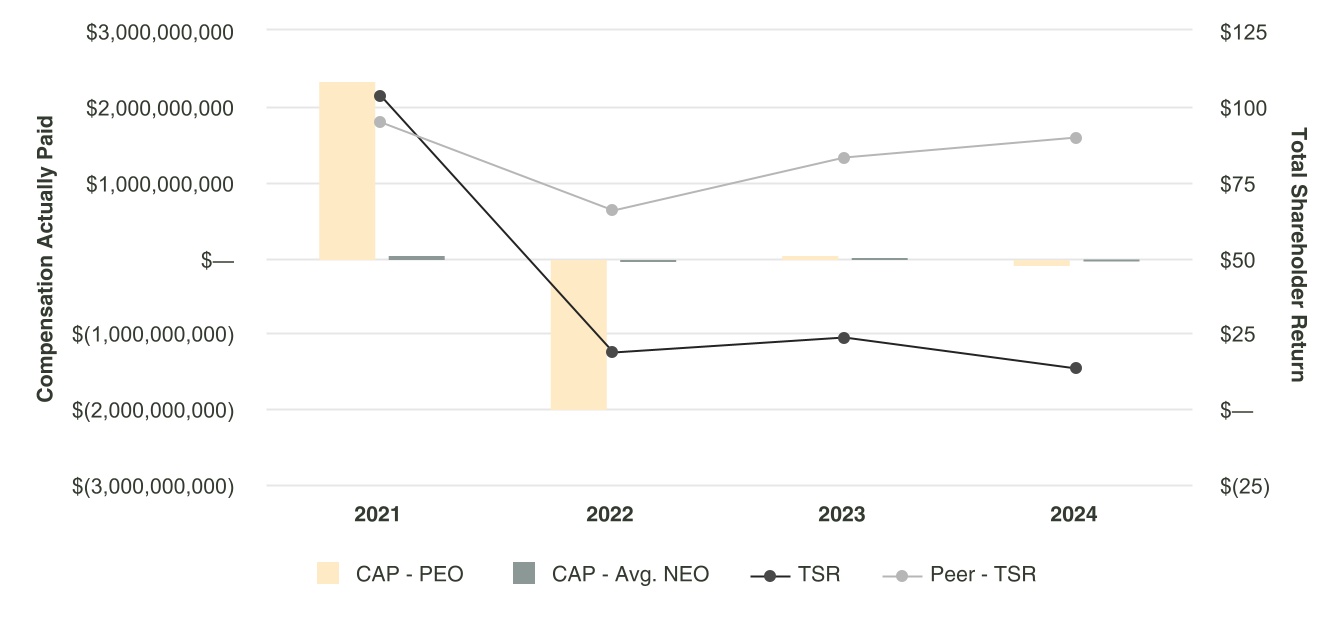
Compensation Actually Paid Versus Company and Peer Group Total Shareholder Return
|
|
|
|
| Compensation Actually Paid vs. Net Income |
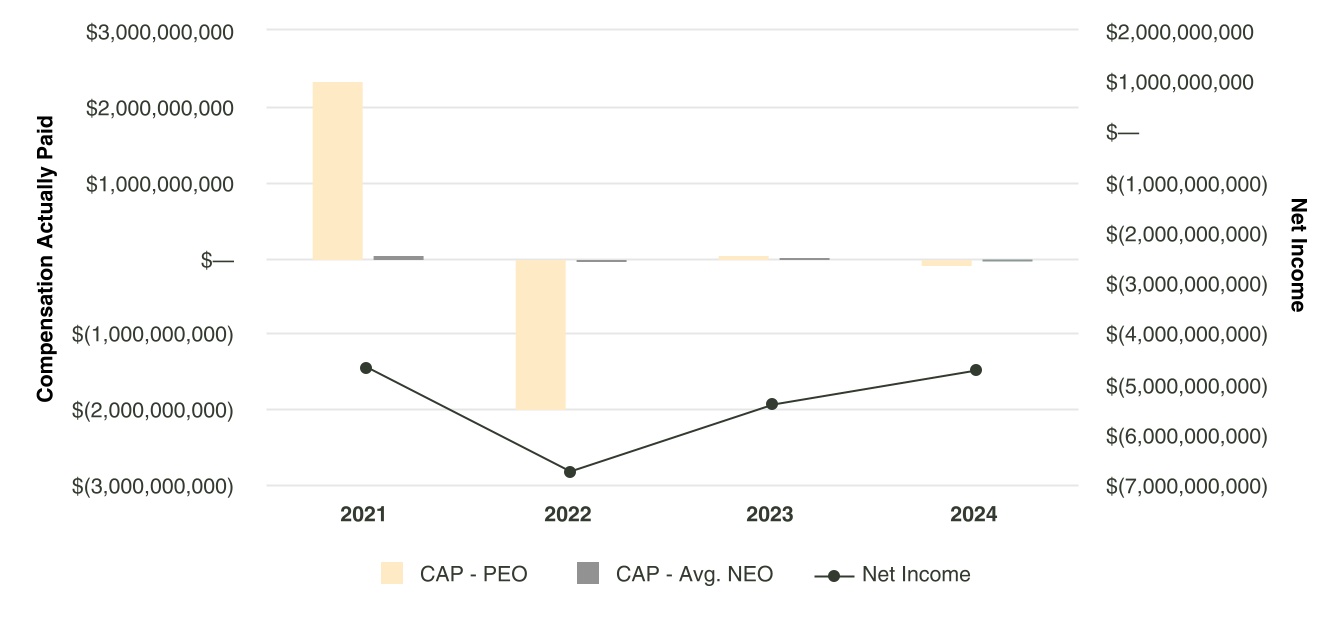
Compensation Actually Paid Versus Net Loss
|
|
|
|
| Compensation Actually Paid vs. Company Selected Measure |
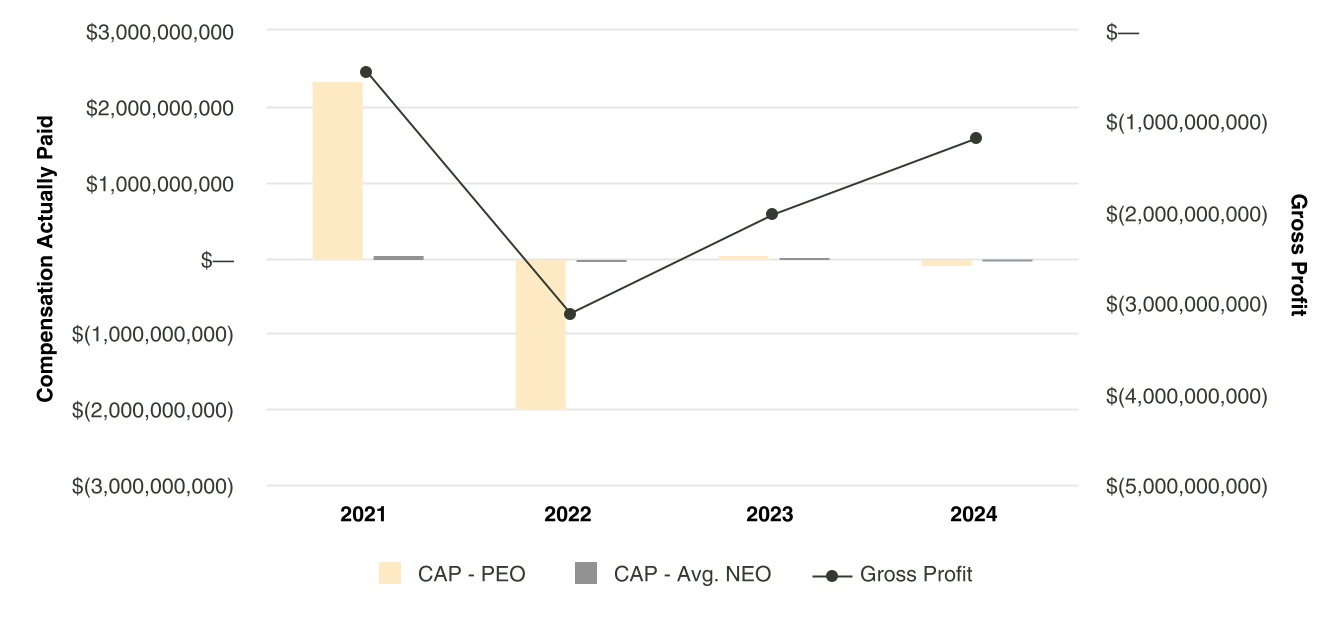
Compensation Actually Paid Versus Gross Profit
|
|
|
|
| Total Shareholder Return Vs Peer Group |
Compensation Actually Paid Versus Company and Peer Group Total Shareholder Return
|
|
|
|
| Tabular List, Table |
| | | Performance Measures | Vehicle Delivery Volumes | Vehicle Quality | Product Development | FY Cash Operating Expense | | Gross Profit |
|
|
|
|
| Total Shareholder Return Amount |
$ 13.20
|
23.29
|
18.30
|
102.94
|
| Peer Group Total Shareholder Return Amount |
89.50
|
83.00
|
65.34
|
94.48
|
| Net Income (Loss) |
$ (4,746,000,000)
|
$ (5,432,000,000)
|
$ (6,752,000,000)
|
$ (4,688,000,000)
|
| PEO Name |
Robert J. Scaringe
|
Robert J. Scaringe
|
Robert J. Scaringe
|
Robert J. Scaringe
|
| Additional 402(v) Disclosure |
The following table sets forth an unranked list of the most important measures used by the Company to link Compensation Actually Paid to our NEOs for 2024 to Company performance. FY Cash Operating Expense is a non-GAAP financial measure and is defined as total operating expenses less research and development and selling, general and administrative depreciation and amortization expenses, and research and development and selling, general and administrative stock-based compensation expenses. We further adjusted FY Cash Operating Expense to exclude one-time costs of $83 million related to our first fiscal quarter restructuring, asset write-offs related to our manufacturing facility near the city of Social Circle, Georgia and Rivian VW Group Technologies start up costs. For further information regarding these measures, please see “Compensation Discussion and Analysis” beginning on page 30.
|
|
|
|
| Measure:: 1 |
|
|
|
|
| Pay vs Performance Disclosure |
|
|
|
|
| Name |
Vehicle Delivery Volumes
|
|
|
|
| Measure:: 2 |
|
|
|
|
| Pay vs Performance Disclosure |
|
|
|
|
| Name |
Vehicle Quality
|
|
|
|
| Measure:: 3 |
|
|
|
|
| Pay vs Performance Disclosure |
|
|
|
|
| Name |
Product Development
|
|
|
|
| Measure:: 4 |
|
|
|
|
| Pay vs Performance Disclosure |
|
|
|
|
| Name |
FY Cash Operating Expense
|
|
|
|
| Measure:: 5 |
|
|
|
|
| Pay vs Performance Disclosure |
|
|
|
|
| Name |
Gross Profit
|
|
|
|
| PEO | Aggregate Grant Date Fair Value of Equity Award Amounts Reported in Summary Compensation Table |
|
|
|
|
| Pay vs Performance Disclosure |
|
|
|
|
| Adjustment to Compensation, Amount |
$ (13,255,966)
|
$ (13,239,067)
|
$ (2,267)
|
$ (421,364,482)
|
| PEO | Year-end Fair Value of Equity Awards Granted in Covered Year that are Outstanding and Unvested |
|
|
|
|
| Pay vs Performance Disclosure |
|
|
|
|
| Adjustment to Compensation, Amount |
9,750,375
|
15,463,156
|
0
|
1,883,836,185
|
| PEO | Year-over-Year Change in Fair Value of Equity Awards Granted in Prior Years That are Outstanding and Unvested |
|
|
|
|
| Pay vs Performance Disclosure |
|
|
|
|
| Adjustment to Compensation, Amount |
(98,606,066)
|
20,940,755
|
(1,723,047,376)
|
407,989,700
|
| PEO | Vesting Date Fair Value of Equity Awards Granted and Vested in Covered Year |
|
|
|
|
| Pay vs Performance Disclosure |
|
|
|
|
| Adjustment to Compensation, Amount |
917,224
|
184,267
|
0
|
0
|
| PEO | Change in Fair Value as of Vesting Date of Prior Year Equity Awards Vested in Covered Year |
|
|
|
|
| Pay vs Performance Disclosure |
|
|
|
|
| Adjustment to Compensation, Amount |
(12,705,703)
|
(1,374,795)
|
(269,782,783)
|
47,182,728
|
| Non-PEO NEO | Aggregate Grant Date Fair Value of Equity Award Amounts Reported in Summary Compensation Table |
|
|
|
|
| Pay vs Performance Disclosure |
|
|
|
|
| Adjustment to Compensation, Amount |
(3,823,115)
|
(7,184,516)
|
(3,215,217)
|
(17,710,842)
|
| Non-PEO NEO | Year-end Fair Value of Equity Awards Granted in Covered Year that are Outstanding and Unvested |
|
|
|
|
| Pay vs Performance Disclosure |
|
|
|
|
| Adjustment to Compensation, Amount |
2,812,612
|
9,634,741
|
1,302,361
|
27,672,382
|
| Non-PEO NEO | Year-over-Year Change in Fair Value of Equity Awards Granted in Prior Years That are Outstanding and Unvested |
|
|
|
|
| Pay vs Performance Disclosure |
|
|
|
|
| Adjustment to Compensation, Amount |
(2,558,175)
|
644,233
|
(34,773,808)
|
14,855,104
|
| Non-PEO NEO | Vesting Date Fair Value of Equity Awards Granted and Vested in Covered Year |
|
|
|
|
| Pay vs Performance Disclosure |
|
|
|
|
| Adjustment to Compensation, Amount |
291,069
|
62,148
|
87,734
|
0
|
| Non-PEO NEO | Change in Fair Value as of Vesting Date of Prior Year Equity Awards Vested in Covered Year |
|
|
|
|
| Pay vs Performance Disclosure |
|
|
|
|
| Adjustment to Compensation, Amount |
(1,956,245)
|
(14,282)
|
(18,252,666)
|
1,903,203
|
| Non-PEO NEO | Prior Year End Fair Value of Equity Awards Granted in Any Prior Year that Fail to Meet Applicable Vesting Conditions During Covered Year |
|
|
|
|
| Pay vs Performance Disclosure |
|
|
|
|
| Adjustment to Compensation, Amount |
$ (5,293,149)
|
$ 0
|
$ 0
|
$ (221,955)
|