v3.25.1
Performance Management - First Eagle Overseas Variable Fund
Dec. 31, 2024
Prospectus [Line Items]  
Bar Chart and Performance Table [Heading] Investment Results
Performance Narrative [Text Block]

The following information provides an indication of the risks of investing in the Fund by showing changes in the Fund’s performance from year to year, and by showing how the Fund’s average annual returns for the periods shown compare with those of one or more broad measures of market performance, which have characteristics relevant to the Fund’s investment strategy. The index is described in the Fund Index section. As with all mutual funds, past performance is not an indication of future performance (before or after taxes).

The following information discloses returns on a before-tax basis. After-tax returns depend on an individual investor’s tax situation and are generally not relevant for investors who hold shares in tax-deferred arrangements, including most Variable Contracts.

Updated performance information is available by calling 800.747.2008.

The following bar chart and table assume reinvestment of dividends and distributions and do not reflect any sales charges. If sales charges were included, the returns would be lower.

Performance Past Does Not Indicate Future [Text] As with all mutual funds, past performance is not an indication of future performance (before or after taxes).
Performance Information Illustrates Variability of Returns [Text] The following information provides an indication of the risks of investing in the Fund by showing changes in the Fund’s performance from year to year, and by showing how the Fund’s average annual returns for the periods shown compare with those of one or more broad measures of market performance, which have characteristics relevant to the Fund’s investment strategy.
Bar Chart Does Not Reflect Sales Loads [Text] The following bar chart and table assume reinvestment of dividends and distributions and do not reflect any sales charges. If sales charges were included, the returns would be lower.
Bar Chart [Heading] Calendar Year Total Returns
Bar Chart [Table]

Bar Chart Footnotes [Text Block]
 

*


For the period presented in the bar chart above.
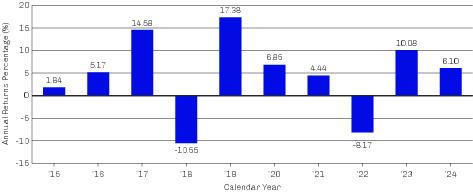
Bar Chart Closing [Text Block]


Best Quarter*


Worst Quarter*

Second Quarter 2020


12.54%


First Quarter 2020


-17.90%


Highest Quarterly Return, Label [Optional Text] Best Quarter
Highest Quarterly Return 12.54%
Highest Quarterly Return, Date Jun. 30, 2020
Lowest Quarterly Return, Label [Optional Text] Worst Quarter
Lowest Quarterly Return (17.90%)
Lowest Quarterly Return, Date Mar. 31, 2020
Performance Table Not Relevant to Tax Deferred After-tax returns depend on an individual investor’s tax situation and are generally not relevant for investors who hold shares in tax-deferred arrangements, including most Variable Contracts.
Performance [Table]


1 Year


5 Years


10 Years


First Eagle Overseas Variable Fund*


6.10

%


3.66

%


4.43

%


MSCI EAFE Index
(reflects no deduction for fees or expenses, but reflects net of withholding taxes)


3.82

%


4.73

%


5.20

%


*

  Performance data quoted herein does not reflect charges imposed by Variable Contracts issued by the life insurance companies through which the Fund is offered. If those account-level fees and expenses were reflected, performance would be lower.

Average Annual Return, Caption [Optional Text] Average Annual Total Returns as of December 31, 2024
Index No Deduction for Fees, Expenses, or Taxes [Text] (reflects no deduction for fees or expenses, but reflects net of withholding taxes)
Performance Availability Phone [Text] 800.747.2008