Pay vs Performance Disclosure
Dec. 31, 2024
USD ($)
Dec. 31, 2023
USD ($)
Dec. 31, 2022
USD ($)
Dec. 31, 2021
USD ($)
Dec. 31, 2020
USD ($)
Pay Versus Performance
As required by Section 953(a) of the Dodd-Frank Wall Street Reform and Consumer Protection Act and Item 402(v) of Regulation S-K, we have prepared this pay versus performance disclosure, which serves to further demonstrate the alignment of our executive compensation program with stockholder interests.
Value of Initial Fixed $100 Investment Based on: | ||||||||||||||||||||||||||
Year | Summary Compensation Table Total for PEO ($) | Compensation Actually Paid to PEO(1) ($) | Average Summary Compensation Table Total for Non-PEO NEOs ($) | Average Compensation Actually Paid to Non-PEO NEOs(2) ($) | Tota l Stockholder Return(3) ($) | Peer Group Total Stockholder Return(3)(4) ($) | Net Income/ (Loss)(5) ($ in thousands) | Adjusted Distributable Earnings ROAE(6)(%) | ||||||||||||||||||
2024 | 8,081,167 | 7,556,905 | 2,939,758 | 2,305,445 | 56.74 | 75.94 | 119,251 | 11.76% | ||||||||||||||||||
2023 | 6,640,540 | 8,535,274 | 2,117,517 | 2,389,541 | 55.42 | 76.61 | 80,164 | 11.98% | ||||||||||||||||||
2022 | 6,262,232 | 1,308,212 | 1,915,344 | 875,766 | 42.43 | 66.88 | (231,581) | 11.03% | ||||||||||||||||||
2021 | 7,411,604 | 8,255,983 | 2,142,227 | 2,307,231 | 67.39 | 92.17 | 328,870 | 10.46% | ||||||||||||||||||
2020 | 4,579,952 | 870,934 | 1,421,460 | 522,051 | 52.80 | 79.34 | (679,390) | (0.72%) | ||||||||||||||||||
1. | For each of 2024, 2023, 2022, 2021 and 2020, our principal executive officer (PEO) was Craig L. Knutson. For more detail regarding how the amounts in this column are calculated, refer to the Summary Compensation Table found on page 56 of this Proxy Statement and “Adjustments to Summary Compensation Tables to Determine Compensation Actually Paid” tables below. |
2. | For 2024, our remaining NEOs consisted of Bryan Wulfsohn, Michael C. Roper, Lori R. Samuels, Harold E. Schwartz and Gudmundur Kristjansson, our former Senior Vice President and Co-Chief Investment Officer, whose employment with the Company was terminated effective November 22, 2024. For 2023, our remaining NEOs consisted of Mr. Wulfsohn, Mr. Roper, Mr. Schwartz, Mr. Kristjansson and Stephen D. Yarad, our former Chief Financial Officer, who resigned his employment with the Company on September 15, 2023. For each of 2022, 2021 and 2020, our remaining NEOs consisted of Mr. Wulfsohn, Mr. Schwartz, Mr. Kristjansson and Mr. Yarad. For more detail regarding how the amounts in this column are calculated, refer to the Summary Compensation Table found on page 56 of this Proxy Statement and “Adjustments to Summary Compensation Tables to Determine Compensation Actually Paid” tables below. |
3. | Total Stockholder Return and Peer Group Total Stockholder Return assume an initial investment of $100 invested on December 31, 2019. |
4. | As permitted by SEC rules, the Peer Group referenced for purpose of the Total Stockholder Return comparison consists of the iShares Mortgage Real Estate ETF (Symbol: REM), which is an exchange traded fund the components of which are U.S. residential and commercial mortgage REITs and reflects an industry peer group used for purposes of Item 201(e) of Regulation S-K. Note that the Bloomberg Real Estate Investment Trust Mortgage Index (Symbol: BBREMTG), which was the Peer Group formerly used by Company for purposes of this table, was discontinued in 2024. The separate peer group used by the Compensation Committee for purposes of evaluating the compensation paid to our executive officers is described on page 37 of this Proxy Statement. |
5. | Reflects after-tax net income/(loss) in accordance with GAAP for each of the years shown. |
6. | The Company has designated “Adjusted Distributable Earnings ROAE” as its Company Selected Measure, as this measure (as well as, “Adjusted GAAP ROAE”) is the most important measure identified below under “2024 Most Important Financial Measures,” which, in the Company’s assessment, represents for 2024 the most important performance measure used to link compensation actually paid to our PEO and other NEOs to the Company’s performance. Adjusted Distributable Earnings ROAE is defined on page 40 of this Proxy Statement and is a non-GAAP financial measure. Per SEC rules, the percentage shown is for the applicable calendar year. See Appendix D for a reconciliation of such measure to its comparable GAAP measure for the 2024 calendar year. |
Compensation Actually Paid represents the Summary Compensation Table Totals adjusted for the following items:
Year 2024 | ||||||||
Adjustments to Summary Compensation Table Totals to Determine Compensation Actually Paid | PEO | Average for Non-PEO- NEOs | ||||||
Deduction for amounts reported under the Stock Awards Column in the Summary Compensation Table | ($4,000,017) | ($1,025,016) | ||||||
Increase for fair value at 12/31/2024 of awards granted during 2024 that remain unvested as of year-end | $3,741,480 | $702,490 | ||||||
Increase/(Deduction) for change in fair value from 12/31/2023 to 12/31/2024 of awards granted in 2023 that were outstanding and unvested as of 12/31/2024 | ($61,568) | ($15,161) | ||||||
Increase/(Deduction) for change in fair value from 12/31/2023 to vesting date of awards granted in 2022 that vested during 2024 | ($86,669) | ($15,303) | ||||||
Increase/(Deduction) for fair value at 12/31/2023 of forfeited performance-based awards granted in 2022 due to failure to meet required performance levels for vesting | ($117,488) | ($281,323) | ||||||
Total adjustments added to/(subtracted from) Summary Compensation Table Total to determine Compensation Actually Paid | ($524,262) | ($634,313) | ||||||
Year 2023 | ||||||||
Adjustments to Summary Compensation Table Totals to Determine Compensation Actually Paid | PEO | Average for Non-PEO- NEOs | ||||||
Deduction for amounts reported under the Stock Awards Column in the Summary Compensation Table | ($4,000,015) | ($990,014) | ||||||
Increase for fair value at 12/31/2023 of awards granted during 2023 that remain unvested as of year-end | $5,551,780 | $1,256,102 | ||||||
Increase/(Deduction) for change in fair value from 12/31/2022 to 12/31/2023 of awards granted in 2022 that were outstanding and unvested as of 12/31/2023 | $249,366 | $50,653 | ||||||
Increase/(Deduction) for change in fair value from 12/31/2022 to vesting date of awards granted in 2021 that vested during 2023 | $384,236 | $72,102 | ||||||
Increase/(Deduction) for fair value at 12/31/2022 of forfeited performance-based awards granted in 2021 due to failure to meet required performance levels for vesting | ($290,633) | ($116,819) | ||||||
Total adjustments added to/(subtracted from) Summary Compensation Table Total to determine Compensation Actually Paid | $1,894,734 | $272,024 | ||||||
Year 2022 | ||||||||
Adjustments to Summary Compensation Table Totals to Determine Compensation Actually Paid | PEO | Average for Non-PEO- NEOs | ||||||
Deduction for amounts reported under the Stock Awards Column in the Summary Compensation Table | ($3,200,032) | ($687,519) | ||||||
Increase for fair value at 12/31/2022 of awards granted during 2022 that remain unvested as of year-end | $1,244,743 | $267,430 | ||||||
Increase/(Deduction) for change in fair value from 12/31/2021 to 12/31/2022 of awards granted in 2021 that were outstanding and unvested as of 12/31/2022 | ($2,318,936) | ($469,731) | ||||||
Increase/(Deduction) for change in fair value from 12/31/2021 to vesting date of awards granted in 2020 that vested during 2022 | ($304,753) | ($73,879) | ||||||
(Deduction) for fair value at 12/31/2021 of forfeited performance-based awards granted in 2020 due to failure to meet required performance levels for vesting | ($375,042) | ($75,879) | ||||||
Total adjustments added to/(subtracted from) Summary Compensation Table Total to determine Compensation Actually Paid | ($4,954,020) | ($1,039,578) | ||||||
Year 2021 | ||||||||
Adjustments to Summary Compensation Table Totals to Determine Compensation Actually Paid | PEO | Average for Non-PEO- NEOs | ||||||
Deduction for amounts reported under the Stock Awards Column in the Summary Compensation Table | ($2,850,004) | ($587,502) | ||||||
Increase for fair value at 12/31/2021 of awards granted during 2021 that remain unvested as of year-end | $4,049,339 | $827,995 | ||||||
Increase/(Deduction) for change in fair value from 12/31/2020 to 12/31/2021 of awards granted in 2020 that were outstanding and unvested as of 12/31/2021 | ($219,388) | ($40,488) | ||||||
Increase/(Deduction) for change in fair value from 12/31/2020 to vesting date of awards granted in 2019 that vested during 2021 | $87,209 | $22,282 | ||||||
(Deduction) for fair value at 12/31/2020 of forfeited performance-based awards granted in 2019 due to failure to meet required performance levels for vesting | ($222,777) | ($57,283) | ||||||
Total adjustments added to/(subtracted from) Summary Compensation Table Total to determine Compensation Actually Paid | $844,379 | $165,004 | ||||||
Year 2020 | ||||||||
Adjustments to Summary Compensation Table Totals to Determine Compensation Actually Paid | PEO | Average for Non-PEO- NEOs | ||||||
Deduction for amounts reported under the Stock Awards Column in the Summary Compensation Table | ($2,668,552) | ($585,060) | ||||||
Increase for fair value at 12/31/2020 of awards granted during 2020 that remain unvested as of year-end | $1,296,984 | $285,082 | ||||||
Increase/(Deduction) for change in fair value from 12/31/2019 to 12/31/2020 of awards granted in 2019 that were outstanding and unvested as of 12/31/2020 | ($1,093,613) | ($280,402) | ||||||
Increase/(Deduction) for change in fair value from 12/31/2019 to vesting date of awards granted in 2018 that vested during 2020 | ($617,410) | ($157,956) | ||||||
(Deduction) for fair value at 12/31/2019 of forfeited performance-based awards granted in 2018 due to failure to meet required performance levels for vesting | ($626,427) | ($161,073) | ||||||
Total adjustments added to/(subtracted from) Summary Compensation Table Total to determine Compensation Actually Paid | ($3,709,018) | ($899,409) | ||||||
1. | For each of 2024, 2023, 2022, 2021 and 2020, our principal executive officer (PEO) was Craig L. Knutson. For more detail regarding how the amounts in this column are calculated, refer to the Summary Compensation Table found on page 56 of this Proxy Statement and “Adjustments to Summary Compensation Tables to Determine Compensation Actually Paid” tables below. |
2. | For 2024, our remaining NEOs consisted of Bryan Wulfsohn, Michael C. Roper, Lori R. Samuels, Harold E. Schwartz and Gudmundur Kristjansson, our former Senior Vice President and Co-Chief Investment Officer, whose employment with the Company was terminated effective November 22, 2024. For 2023, our remaining NEOs consisted of Mr. Wulfsohn, Mr. Roper, Mr. Schwartz, Mr. Kristjansson and Stephen D. Yarad, our former Chief Financial Officer, who resigned his employment with the Company on September 15, 2023. For each of 2022, 2021 and 2020, our remaining NEOs consisted of Mr. Wulfsohn, Mr. Schwartz, Mr. Kristjansson and Mr. Yarad. For more detail regarding how the amounts in this column are calculated, refer to the Summary Compensation Table found on page 56 of this Proxy Statement and “Adjustments to Summary Compensation Tables to Determine Compensation Actually Paid” tables below. |
4. | As permitted by SEC rules, the Peer Group referenced for purpose of the Total Stockholder Return comparison consists of the iShares Mortgage Real Estate ETF (Symbol: REM), which is an exchange traded fund the components of which are U.S. residential and commercial mortgage REITs and reflects an industry peer group used for purposes of Item 201(e) of Regulation S-K. Note that the Bloomberg Real Estate Investment Trust Mortgage Index (Symbol: BBREMTG), which was the Peer Group formerly used by Company for purposes of this table, was discontinued in 2024. The separate peer group used by the Compensation Committee for purposes of evaluating the compensation paid to our executive officers is described on page 37 of this Proxy Statement. |
Compensation Actually Paid represents the Summary Compensation Table Totals adjusted for the following items:
Year 2024 | ||||||||
Adjustments to Summary Compensation Table Totals to Determine Compensation Actually Paid | PEO | Average for Non-PEO- NEOs | ||||||
Deduction for amounts reported under the Stock Awards Column in the Summary Compensation Table | ($4,000,017) | ($1,025,016) | ||||||
Increase for fair value at 12/31/2024 of awards granted during 2024 that remain unvested as of year-end | $3,741,480 | $702,490 | ||||||
Increase/(Deduction) for change in fair value from 12/31/2023 to 12/31/2024 of awards granted in 2023 that were outstanding and unvested as of 12/31/2024 | ($61,568) | ($15,161) | ||||||
Increase/(Deduction) for change in fair value from 12/31/2023 to vesting date of awards granted in 2022 that vested during 2024 | ($86,669) | ($15,303) | ||||||
Increase/(Deduction) for fair value at 12/31/2023 of forfeited performance-based awards granted in 2022 due to failure to meet required performance levels for vesting | ($117,488) | ($281,323) | ||||||
Total adjustments added to/(subtracted from) Summary Compensation Table Total to determine Compensation Actually Paid | ($524,262) | ($634,313) | ||||||
Year 2023 | ||||||||
Adjustments to Summary Compensation Table Totals to Determine Compensation Actually Paid | PEO | Average for Non-PEO- NEOs | ||||||
Deduction for amounts reported under the Stock Awards Column in the Summary Compensation Table | ($4,000,015) | ($990,014) | ||||||
Increase for fair value at 12/31/2023 of awards granted during 2023 that remain unvested as of year-end | $5,551,780 | $1,256,102 | ||||||
Increase/(Deduction) for change in fair value from 12/31/2022 to 12/31/2023 of awards granted in 2022 that were outstanding and unvested as of 12/31/2023 | $249,366 | $50,653 | ||||||
Increase/(Deduction) for change in fair value from 12/31/2022 to vesting date of awards granted in 2021 that vested during 2023 | $384,236 | $72,102 | ||||||
Increase/(Deduction) for fair value at 12/31/2022 of forfeited performance-based awards granted in 2021 due to failure to meet required performance levels for vesting | ($290,633) | ($116,819) | ||||||
Total adjustments added to/(subtracted from) Summary Compensation Table Total to determine Compensation Actually Paid | $1,894,734 | $272,024 | ||||||
Year 2022 | ||||||||
Adjustments to Summary Compensation Table Totals to Determine Compensation Actually Paid | PEO | Average for Non-PEO- NEOs | ||||||
Deduction for amounts reported under the Stock Awards Column in the Summary Compensation Table | ($3,200,032) | ($687,519) | ||||||
Increase for fair value at 12/31/2022 of awards granted during 2022 that remain unvested as of year-end | $1,244,743 | $267,430 | ||||||
Increase/(Deduction) for change in fair value from 12/31/2021 to 12/31/2022 of awards granted in 2021 that were outstanding and unvested as of 12/31/2022 | ($2,318,936) | ($469,731) | ||||||
Increase/(Deduction) for change in fair value from 12/31/2021 to vesting date of awards granted in 2020 that vested during 2022 | ($304,753) | ($73,879) | ||||||
(Deduction) for fair value at 12/31/2021 of forfeited performance-based awards granted in 2020 due to failure to meet required performance levels for vesting | ($375,042) | ($75,879) | ||||||
Total adjustments added to/(subtracted from) Summary Compensation Table Total to determine Compensation Actually Paid | ($4,954,020) | ($1,039,578) | ||||||
Year 2021 | ||||||||
Adjustments to Summary Compensation Table Totals to Determine Compensation Actually Paid | PEO | Average for Non-PEO- NEOs | ||||||
Deduction for amounts reported under the Stock Awards Column in the Summary Compensation Table | ($2,850,004) | ($587,502) | ||||||
Increase for fair value at 12/31/2021 of awards granted during 2021 that remain unvested as of year-end | $4,049,339 | $827,995 | ||||||
Increase/(Deduction) for change in fair value from 12/31/2020 to 12/31/2021 of awards granted in 2020 that were outstanding and unvested as of 12/31/2021 | ($219,388) | ($40,488) | ||||||
Increase/(Deduction) for change in fair value from 12/31/2020 to vesting date of awards granted in 2019 that vested during 2021 | $87,209 | $22,282 | ||||||
(Deduction) for fair value at 12/31/2020 of forfeited performance-based awards granted in 2019 due to failure to meet required performance levels for vesting | ($222,777) | ($57,283) | ||||||
Total adjustments added to/(subtracted from) Summary Compensation Table Total to determine Compensation Actually Paid | $844,379 | $165,004 | ||||||
Year 2020 | ||||||||
Adjustments to Summary Compensation Table Totals to Determine Compensation Actually Paid | PEO | Average for Non-PEO- NEOs | ||||||
Deduction for amounts reported under the Stock Awards Column in the Summary Compensation Table | ($2,668,552) | ($585,060) | ||||||
Increase for fair value at 12/31/2020 of awards granted during 2020 that remain unvested as of year-end | $1,296,984 | $285,082 | ||||||
Increase/(Deduction) for change in fair value from 12/31/2019 to 12/31/2020 of awards granted in 2019 that were outstanding and unvested as of 12/31/2020 | ($1,093,613) | ($280,402) | ||||||
Increase/(Deduction) for change in fair value from 12/31/2019 to vesting date of awards granted in 2018 that vested during 2020 | ($617,410) | ($157,956) | ||||||
(Deduction) for fair value at 12/31/2019 of forfeited performance-based awards granted in 2018 due to failure to meet required performance levels for vesting | ($626,427) | ($161,073) | ||||||
Total adjustments added to/(subtracted from) Summary Compensation Table Total to determine Compensation Actually Paid | ($3,709,018) | ($899,409) | ||||||
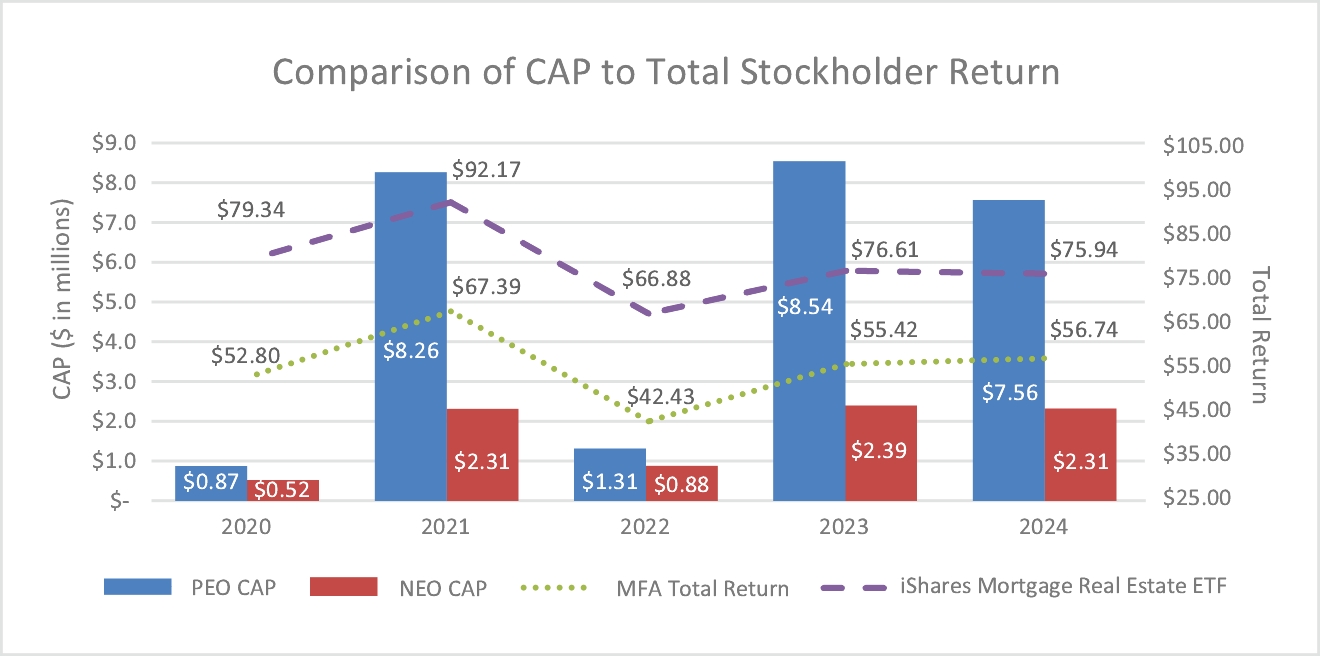
The following graph illustrates the relationship between compensation actually paid (“CAP”) to our NEOs and each of MFA’s total stockholder return (TSR) and (ii) the TSR of the iShares Mortgage Real Estate ETF (Symbol: REM), in each case on a cumulative basis assuming an initial investment of $100 made on December 31, 2020:
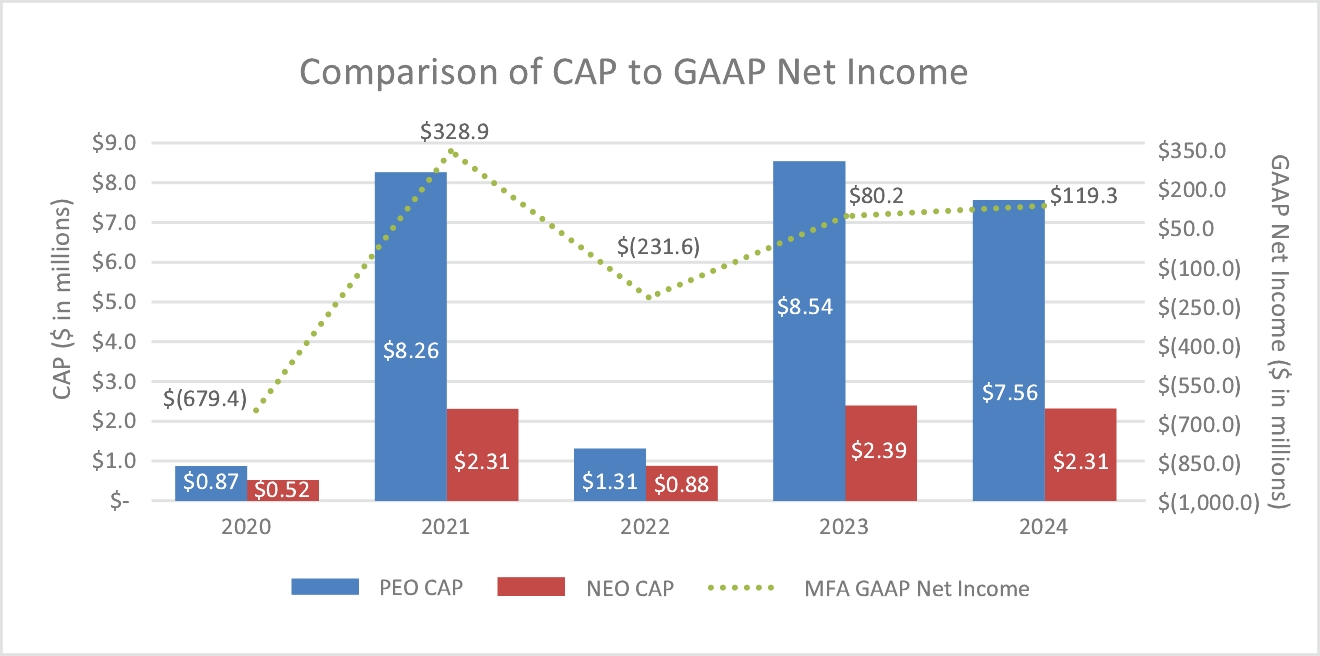
The following graph illustrates the relationship between compensation actually paid (CAP) to our NEOs and MFA’s GAAP net income/(loss) on an annual basis for the years ended December 31, 2020, 2021, 2022, 2023 and 2024:
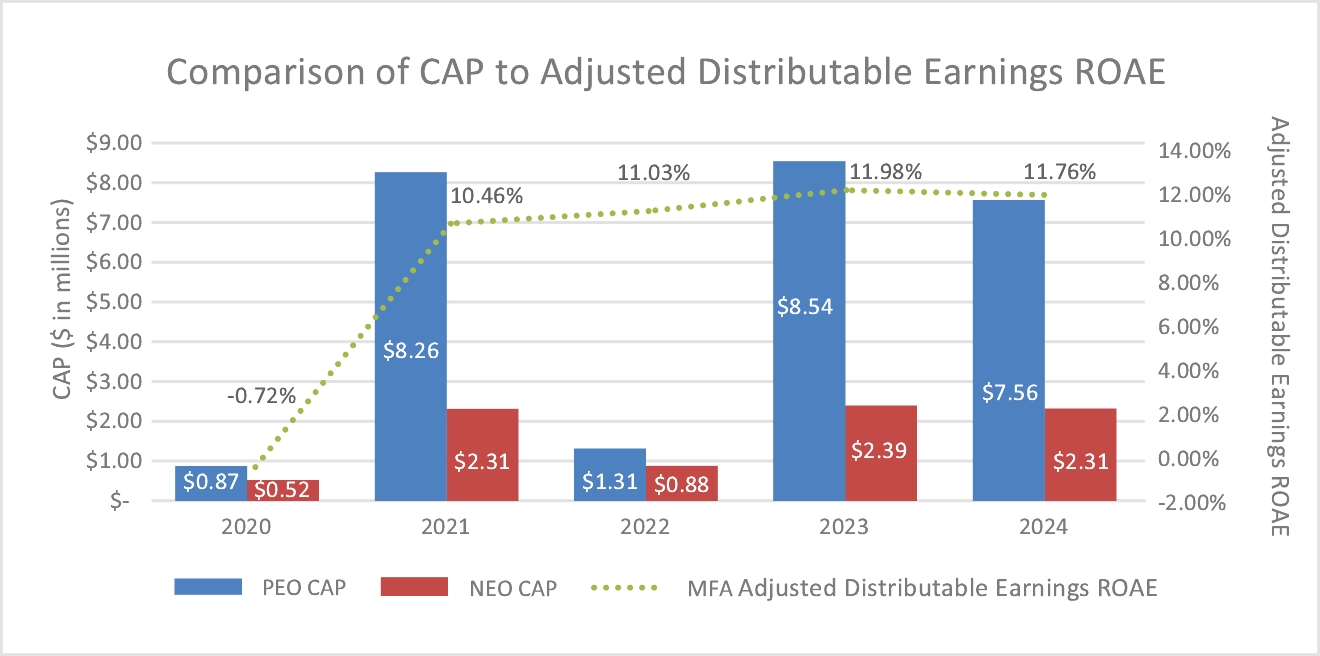
The following graph illustrates the relationship between compensation actually paid (CAP) to our NEOs and Adjusted Distributable Earnings ROAE for the years ended December 31, 2020, 2021, 2022, 2023 and 2024:
The following graph illustrates the relationship between compensation actually paid (“CAP”) to our NEOs and each of MFA’s total stockholder return (TSR) and (ii) the TSR of the iShares Mortgage Real Estate ETF (Symbol: REM), in each case on a cumulative basis assuming an initial investment of $100 made on December 31, 2020:
2024 Most Important Financial Measures
MFA’s current compensation program is structured with the objective of linking the compensation of our NEOs to achievement of short- and long-term financial and market-based goals. In 2024, incentive compensation served as a material element of each NEO’s compensation package and serves to further align compensation to Company performance. In addition, a significant percentage of our NEOs’ compensation is in the form of equity awards that “cliff” vest after three years, and with respect to grants of awards made to our NEOs in 2024, the vesting of 60% of these awards (as determined by grant date value) is subject to our total stockholder return (both on an absolute basis and as compared to a group of peer companies) for the three-year period ending December 31, 2026. The most important financial performance measures utilized by the Compensation Committee to link compensation paid to our NEOs to MFA’s performance for 2024 were:
• | Adjusted Distributable Earnings ROAE |
• | Adjusted GAAP ROAE |
• | Absolute TSR |
• | Relative TSR |
6. | The Company has designated “Adjusted Distributable Earnings ROAE” as its Company Selected Measure, as this measure (as well as, “Adjusted GAAP ROAE”) is the most important measure identified below under “2024 Most Important Financial Measures,” which, in the Company’s assessment, represents for 2024 the most important performance measure used to link compensation actually paid to our PEO and other NEOs to the Company’s performance. Adjusted Distributable Earnings ROAE is defined on page 40 of this Proxy Statement and is a non-GAAP financial measure. Per SEC rules, the percentage shown is for the applicable calendar year. See Appendix D for a reconciliation of such measure to its comparable GAAP measure for the 2024 calendar year. |