Pay vs Performance Disclosure - USD ($)
Dec. 31, 2024
Dec. 31, 2023
Dec. 31, 2022
Dec. 31, 2021
Dec. 31, 2020
Pay Versus Performance
The following tables and related disclosures provide information about (i) the “total compensation” of our principal executive officer (the “PEO”) and our other named executive officers (the “Other NEOs”) as presented in the Summary Compensation Table on page 52 (the “SCT Amounts”), (ii) the “compensation actually paid” to our PEO and our Other NEOs, as calculated pursuant to the SEC’s
pay-versus-performance
rules (the “CAP Amounts”), (iii) certain financial performance measures, and (iv) the relationship of the CAP Amounts to those financial performance measures. This disclosure has been prepared in accordance with Item 402(v) of Regulation
S-K
under the Exchange Act and does not necessarily reflect value actually realized by the executives or how our Compensation and Human Capital Committee evaluates compensation decisions in light of company or individual performance. For discussion of how our Compensation and Human Capital Committee seeks to align pay with performance when making compensation decisions, please review Compensation Discussion and Analysis beginning on page 36. Pay Versus Performance
| Year |
Summary Compensation Table Total for PEO ($) (1) |
Compensation Actually Paid to PEO ($) (2) |
Average Summary Compensation Table Total for Non-PEO Named Executive Officers ($) (1) |
Average Compensation Actually Paid to Non-PEO Named Executive Officers ($) (2) |
Value of Initial Fixed $ 100 Investment Based on: |
Net Income ($) |
Adjusted Free Cash Flow ($) (4) |
|||||||||||||||||||||||||
Total Shareholder Return ($) |
Peer Group Total Shareholder Return ($) (3) |
|||||||||||||||||||||||||||||||
| 2024 |
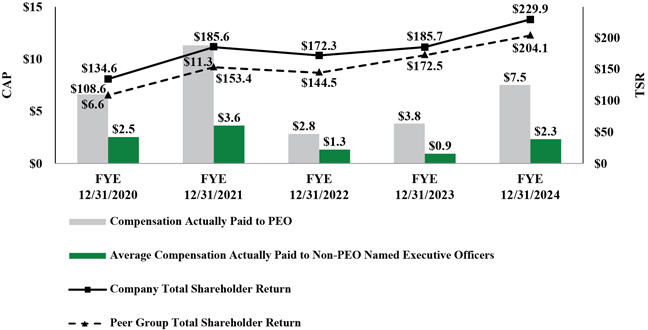
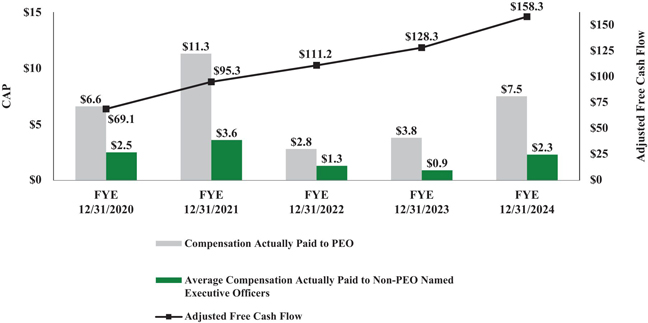
4,166,661 | 7,468,566 | 1,523,120 | 2,260,187 | 229.87 | 204.08 | 13,536,000 | 158,309,000 | ||||||||||||||||||||||||
| 2023 |
3,461,597 | 3,778,584 | 938,698 | 903,205 | 185.66 | 172.53 | 25,399,000 | 128,299,000 | ||||||||||||||||||||||||
| 2022 |
4,120,071 | 2,821,002 | 1,635,240 | 1,323,839 | 172.30 | 144.53 | 53,079,000 | 111,213,000 | ||||||||||||||||||||||||
| 2021 |
4,233,954 | 11,347,919 | 1,486,919 | 3,594,795 | 185.57 | 153.39 | 41,100,000 | 95,332,000 | ||||||||||||||||||||||||
| 2020 |
3,794,238 | 6,590,420 | 1,538,515 | 2,506,954 | 134.59 | 108.62 | 91,106,000 | 69,147,000 | ||||||||||||||||||||||||
| (1) | For 2024, our PEO was John W. Casella and our Other NEOs were Bradford J. Helgeson, Edmond R. Coletta, Shelley E. Sayward and Sean M. Steves. For 2023, our PEO was John W. Casella and our Other |
| NEOs were Bradford J. Helgeson, Edmond R. Coletta, Shelley E. Sayward, Paul J. Ligon and Sean M. Steves. For 2022, our PEO was John W. Casella and our Other NEOs were Edmond R. Coletta, Shelley E. Sayward, Paul J. Ligon, Sean M. Steves and Edward D. Johnson. For 2021, our PEO was John W. Casella and our Other NEOs were Edmond R. Coletta, Edwin D. Johnson, Shelley E. Sayward and Christopher B. Heald. For 2020, our PEO was John W. Casella and our Other NEOs were Edmond R. Coletta, Edwin D. Johnson, David L. Schmitt and Christopher B. Heald. |
| (2) | The following table describes the adjustments, each of which is prescribed by SEC rules, to calculate the CAP Amounts from the SCT Amounts for 2024. The SCT Amounts and the CAP Amounts do not reflect the actual amount of compensation earned by or paid to our executives during 2024, but rather are amounts determined in accordance with Item 402 of Regulation S-K under the Exchange Act. |
| Adjustments |
2024 ($) |
|||||||
PEO |
Other NEOs* |
|||||||
| SCT Amounts |
4,166,661 | 1,523,120 | ||||||
| Adjustments for stock and option awards: |
||||||||
| (Subtract): Aggregate grant date fair value for stock awards and option awards included in SCT Amounts for the covered fiscal year | (2,074,300 | ) | (676,857 | ) | ||||
| Add: Fair value at year end of awards granted during the covered fiscal year that were outstanding and unvested at the covered fiscal year end | 2,334,954 | 761,910 | ||||||
| Add (Subtract): Change as of the end of the covered fiscal year (from the end of the prior fiscal year) in fair value of awards granted in any prior fiscal year that were outstanding and unvested at the covered fiscal year end | 580,262 | 215,672 | ||||||
| Add (Subtract): Change as of the vesting date (from the end of the prior fiscal year) in fair value of awards granted in any prior fiscal year for which vesting conditions were satisfied during the covered fiscal year | 2,460,989 | 436,342 | ||||||
| |
|
|
|
|||||
| CAP Amounts (as calculated) |
7,468,566 | 2,260,187 | ||||||
| |
|
|
|
|||||
| * | Amounts presented are averages for the entire group of Other NEOs in 2024. |
| (3) | The companies in our peer group are: GFL Environmental, Inc., Waste Connections Inc., Waste Management, Inc., and Republic Services, Inc. |
| (4) | Adjusted Free Cash Flow is a non-GAAP financial measure. See Appendix A for additional information regarding Adjusted Free Cash Flow and reconciliation of Adjusted Free Cash Flow to its most directly comparable GAAP financial measure. |
| (1) | For 2024, our PEO was John W. Casella and our Other NEOs were Bradford J. Helgeson, Edmond R. Coletta, Shelley E. Sayward and Sean M. Steves. For 2023, our PEO was John W. Casella and our Other |
| NEOs were Bradford J. Helgeson, Edmond R. Coletta, Shelley E. Sayward, Paul J. Ligon and Sean M. Steves. For 2022, our PEO was John W. Casella and our Other NEOs were Edmond R. Coletta, Shelley E. Sayward, Paul J. Ligon, Sean M. Steves and Edward D. Johnson. For 2021, our PEO was John W. Casella and our Other NEOs were Edmond R. Coletta, Edwin D. Johnson, Shelley E. Sayward and Christopher B. Heald. For 2020, our PEO was John W. Casella and our Other NEOs were Edmond R. Coletta, Edwin D. Johnson, David L. Schmitt and Christopher B. Heald. |
| (2) | The following table describes the adjustments, each of which is prescribed by SEC rules, to calculate the CAP Amounts from the SCT Amounts for 2024. The SCT Amounts and the CAP Amounts do not reflect the actual amount of compensation earned by or paid to our executives during 2024, but rather are amounts determined in accordance with Item 402 of Regulation S-K under the Exchange Act. |
| Adjustments |
2024 ($) |
|||||||
PEO |
Other NEOs* |
|||||||
| SCT Amounts |
4,166,661 | 1,523,120 | ||||||
| Adjustments for stock and option awards: |
||||||||
| (Subtract): Aggregate grant date fair value for stock awards and option awards included in SCT Amounts for the covered fiscal year | (2,074,300 | ) | (676,857 | ) | ||||
| Add: Fair value at year end of awards granted during the covered fiscal year that were outstanding and unvested at the covered fiscal year end | 2,334,954 | 761,910 | ||||||
| Add (Subtract): Change as of the end of the covered fiscal year (from the end of the prior fiscal year) in fair value of awards granted in any prior fiscal year that were outstanding and unvested at the covered fiscal year end | 580,262 | 215,672 | ||||||
| Add (Subtract): Change as of the vesting date (from the end of the prior fiscal year) in fair value of awards granted in any prior fiscal year for which vesting conditions were satisfied during the covered fiscal year | 2,460,989 | 436,342 | ||||||
| |
|
|
|
|||||
| CAP Amounts (as calculated) |
7,468,566 | 2,260,187 | ||||||
| |
|
|
|
|||||
| * | Amounts presented are averages for the entire group of Other NEOs in 2024. |
CAP VERSUS COMPANY TSR AND PEER GROUP TSR
CAP
VERSUS
NET INCOME 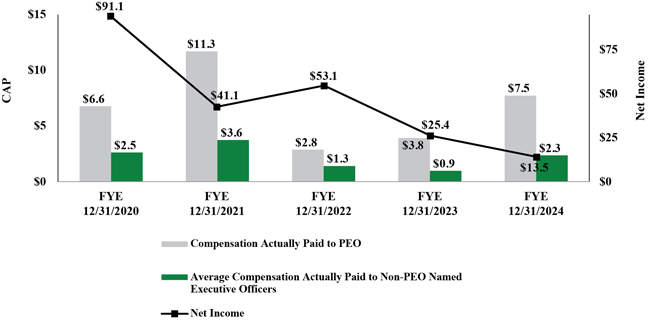
CAP VERSUS ADJUSTED FREE CASH FLOW
CAP VERSUS COMPANY TSR AND PEER GROUP TSR
The following table lists the three financial performance measures that, in our assessment, represent the most important performance measures we use to link the CAP Amounts for our named executive officers for 2024 (our most recently completed fiscal year), to company performance. Of these measures, we have identified Adjusted Free Cash Flow as the most important of our financial performance measures (that is not already required to be disclosed in the pay versus performance table above) used to link CAP Amounts for our executives for 2024 to company performance.
| Adjusted Free Cash Flow* |
||
| Adjusted Operating Income* |
||
| Adjusted EBITDA* |
| * | Adjusted Free Cash Flow, Adjusted Operating Income and Adjusted EBITDA are non-GAAP financial measures. See Appendix A for additional information regarding non-GAAP financial measures and reconciliations of non-GAAP financial measures to their most directly comparable GAAP financial measures. |
non-GAAP
financial measure. See Appendix A for additional information regarding Adjusted Free Cash Flow and reconciliation of Adjusted Free Cash Flow to its most directly comparable GAAP financial measure.