v3.25.1
Pay vs Performance Disclosure - USD ($)
12 Months Ended
Dec. 31, 2024
Dec. 31, 2023
Dec. 31, 2022
Dec. 31, 2021
Dec. 31, 2020
Pay vs Performance Disclosure          
Pay vs Performance Disclosure, Table

We are required by SEC rules to disclose the following information regarding compensation paid to our NEOs. The amounts set forth below under the headings "Compensation Actually Paid to CEO" and "Average Compensation Actually Paid for NEOs" have been calculated in a manner consistent with Item 402(v) of Regulation S-K. Footnote (10) below sets forth the adjustments from the Total Compensation for each NEO reported in the Summary Compensation Table above.

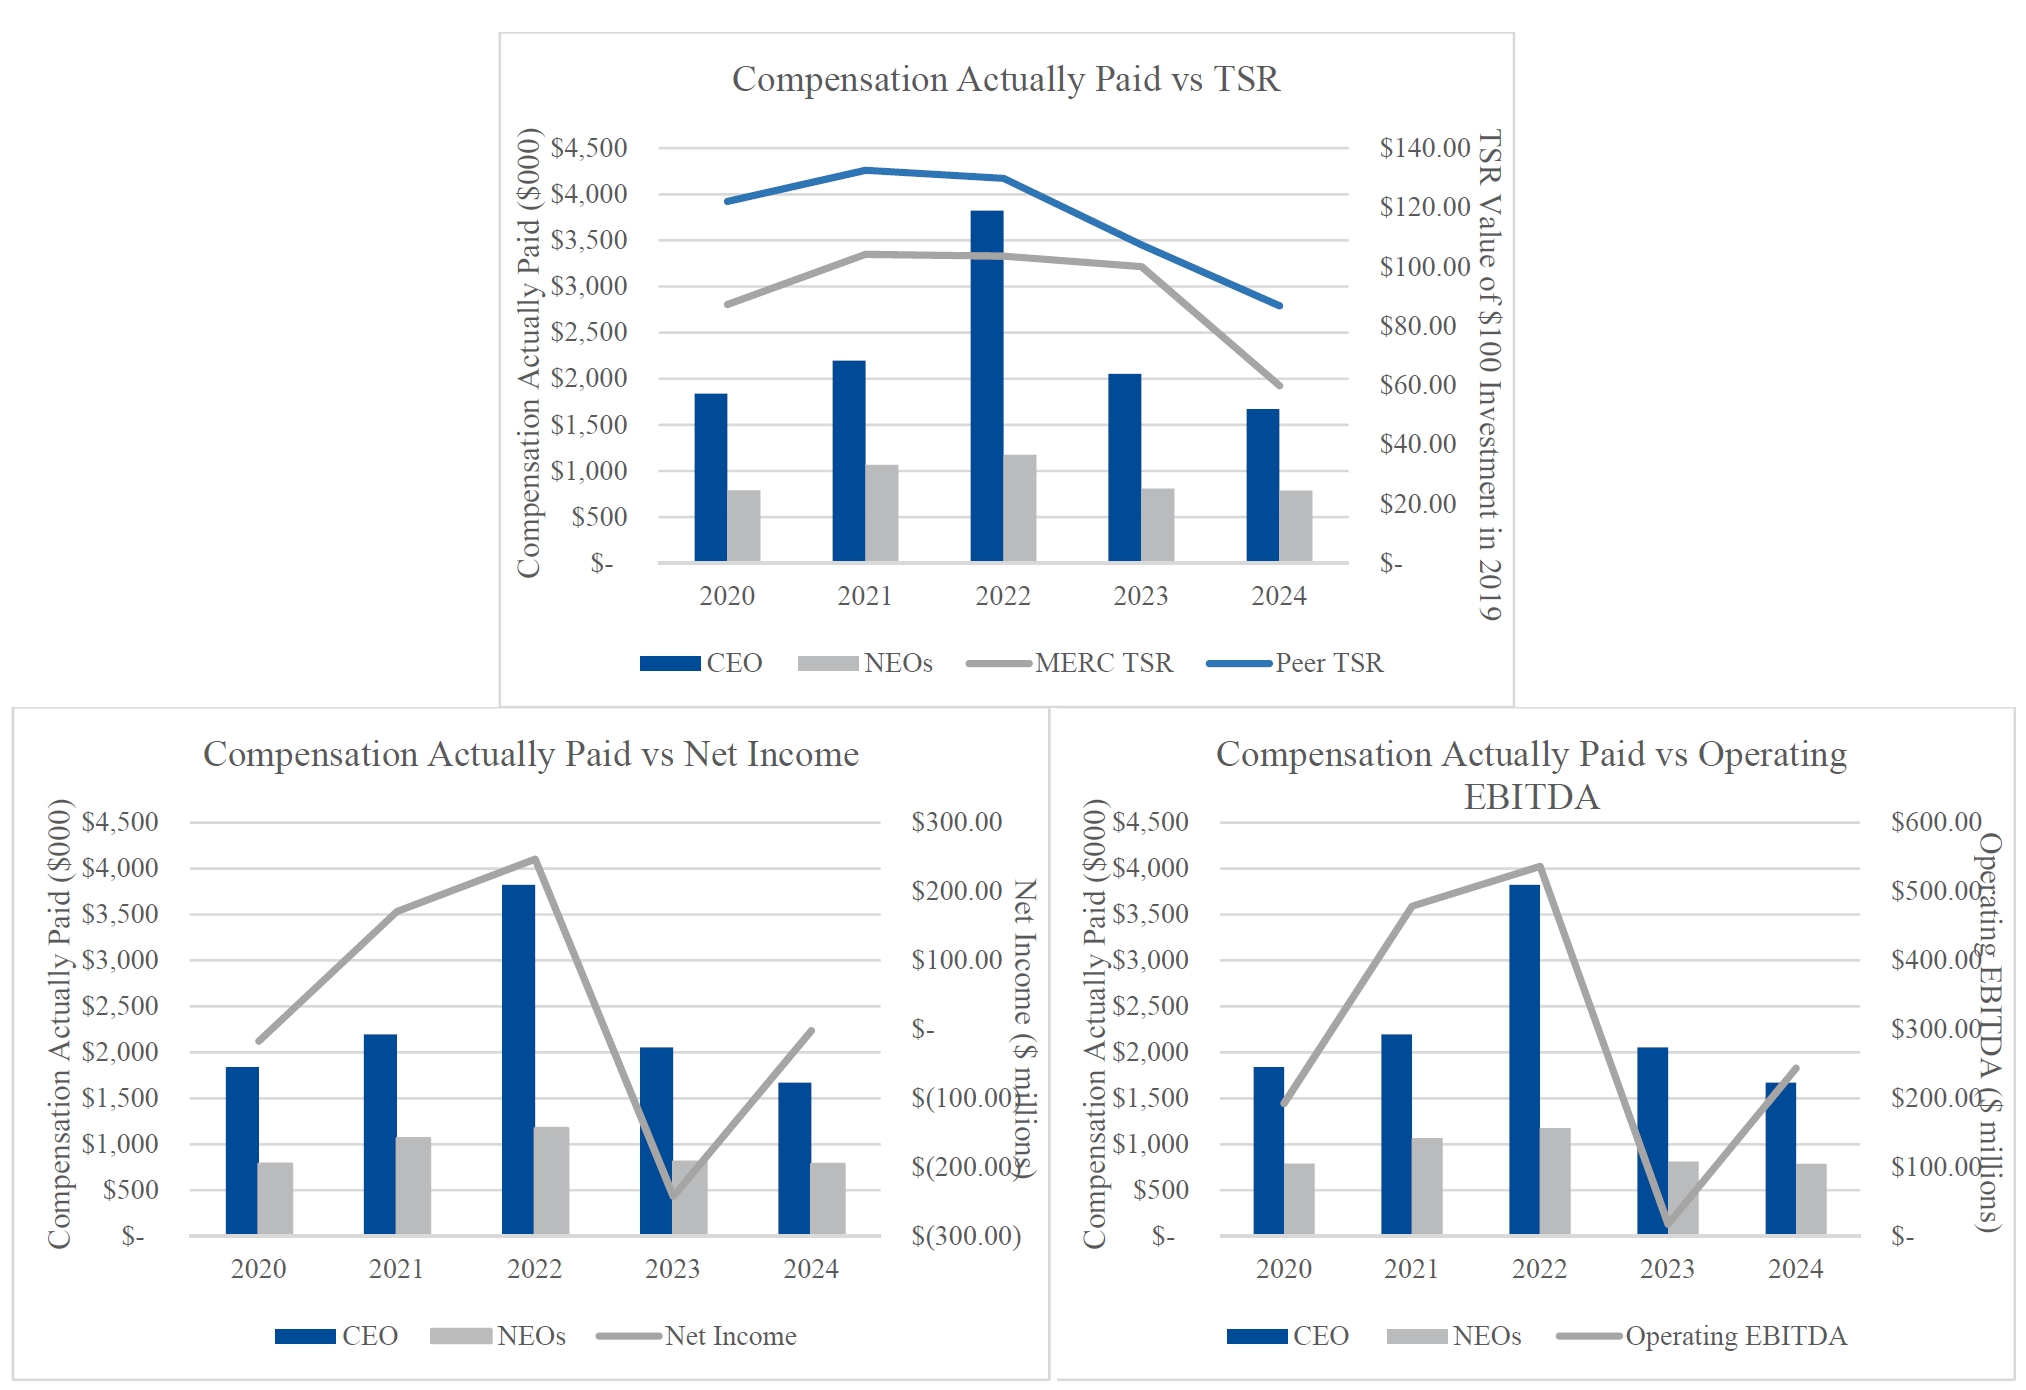
The following table sets forth additional compensation information of our CEO and our non-CEO NEOs along with total shareholder return, net income, and Operating EBITDA performance results for fiscal years 2020, 2021, 2022, 2023 and 2024:


Year

Summary Compensation Table Total for CEO

($)

Compensation Actually Paid to CEO

($)

Average Summary Compensation Table Total for Non-CEO NEOs(2)

($)

Average Compensation Actually Paid to Non-CEO NEOs(2)

($)

Value of Initial Fixed $100 Investment Based On:

Net Income (Loss)

($)

Operating EBITDA (in 000s)(10)

($)

Juan Carlos Bueno(1)

David Gandossi(1)

Juan Carlos Bueno(1)

David Gandossi(1)


Total Shareholder Return(9)

($)

Peer Group Total Shareholder Return(9)

($)


(a)

(b)

(c)

(d)

(e)

(f)

(g)

(h)

(i)

2024

2,951,587

N/A

1,669,153

N/A

1,045,486

784,586

59.84

86.62

(85,141)

243,722

2023

3,174,950

N/A

2,052,731

N/A

1,063,027

809,823

100.06

107.36

(242,056)

17,462

2022

4,945,342

1,518,538

3,016,641

806,333

1,449,725

1,174,802

103.55

129.84

247,039

536,521

2021

-

3,152,658

-

2,194,616

1,374,929

1,065,747

104.19

132.54

170,988

478,782

2020

-

2,647,401

-

1,837,807

1,150,286

791,419

87.24

122.03

(17,235)

192,650

(1)
Mr. Gandossi stepped down as Chief Executive Officer and President on May 1, 2022 and retired as a director effective May 31, 2022. Mr. Bueno was appointed as Chief Executive Officer and President on May 1, 2022, and was elected as a director effective May 31, 2022. In connection with Mr. Bueno's appointment, he was provided with a one-time moving cost allowance and was granted: (i) 50,000 RSUs; (ii) 96,530 PSUs that have a performance period ending on December 31, 2023; and (iii) 96,530 PSUs that have a performance period ending on December 31, 2024. Such one-time RSU and PSU grants were made to attract Mr. Bueno as well as allow Mr. Bueno to enter into the same pay for performance cycle as our other NEOs. PSU grants for the CEO in 2023 have returned to previous levels.
(2)
The CEOs and NEOs in the above compensation columns reflect the following:


Year

CEO

NEOs

2024

Juan Carlos Bueno

Richard Short, Adolf Koppensteiner, Carsten Merforth, Wolfram Ridder

2023

Juan Carlos Bueno

Jimmy S.H. Lee, David Ure (to May 31, 2023), Richard Short (from June 1, 2023), Adolf Koppensteiner, Guy Arguin

2022

David Gandossi (to May 1, 2022)

Juan Carlos Bueno (from May 1, 2022)

Jimmy S.H. Lee, David Ure, Adolf Koppensteiner, Guy Arguin

2021

David Gandossi

Jimmy S.H. Lee, David Ure, Adolf Koppensteiner, Wolfram Ridder

2020

David Gandossi

Jimmy S.H. Lee, David Ure, Adolf Koppensteiner, Wolfram Ridder


(3)
Fair value or change in fair value, as applicable, of equity awards in the "Compensation Actually Paid" columns was determined by reference to (1) for PSU awards (excluding TSR awards), closing price on applicable year-end dates or, in the case of vesting dates, the actual vesting price multiplied by the probability of achievement as of each such date, (2) for TSR-based PSU awards, the fair value calculated by a Monte Carlo simulation model as of the applicable year-end date(s) or, in the case of vesting date, the actual vesting price and probability of achievement, and in all cases based on volatility, dividend rates and risk free rates determined as of the revaluation date.
(4)
2024 "Compensation Actually Paid" to the CEO and the average "Compensation Actually Paid" to the NEOs reflect the adjustments set forth in the table below in Note (11) from Total Compensation reported in the Summary Compensation Table.
(5)
2023 "Compensation Actually Paid" to the CEO and the average "Compensation Actually Paid" to the NEOs reflect the adjustments set forth in the table below in Note (11) from Total Compensation reported in the Summary Compensation Table.
(6)
2022 "Compensation Actually Paid" to the CEO and the average "Compensation Actually Paid" to the NEOs reflect the adjustments set forth in the table below in Note (11) from Total Compensation reported in the Summary Compensation Table.
(7)
2021 "Compensation Actually Paid" to the CEO and the average "Compensation Actually Paid" to the NEOs reflect the adjustments set forth in the table below in Note (11) from Total Compensation reported in the Summary Compensation Table.
(8)
2020 "Compensation Actually Paid" to the CEO and the average "Compensation Actually Paid" to the NEOs reflect the adjustments set forth in the table below in Note (11) from Total Compensation reported in the Summary Compensation Table.
(9)
For the relevant fiscal year, represents the cumulative total shareholder return of Mercer International Inc. and the TSR Peer Group as set forth under the Fiscal 2024 Shareholder Returns section of this Proxy Statement. Each year reflects what the cumulative value of $100 would be, including the reinvestment of dividends, adjusted for stock splits and spinoffs, if such amount were invested by the market close on the last trading day before the beginning of the Company’s third preceding fiscal year.
(10)
EBITDA was selected as our Company Selected Measure for evaluating Pay versus Performance because it is a key metric in our PSU Plans as well as being a performance metric in our Annual Incentive Plans.
(11)
"Compensation Actually Paid" to the CEO and the average "Compensation Actually Paid" to the NEOs reflect the following adjustment from Total Compensation reported in the Summary Compensation Table:


2024

2024

2023

2023

2022

2021

2020


CEO

($)

Average

of NEOs

($)


CEO

($)

Average

of NEOs

($)

CEO

(Gandossi)

($)

CEO

(Bueno)

($)

Average

of NEOs

($)


CEO

($)

Average

of NEOs

($)


CEO

($)

Average

of NEOs

($)

Total Reported in 2024 Summary Compensation Table (SCT)

2,951,587

1,045,486

3,174,950

1,063,027

1,518,538

4,945,342

1,449,725

3,152,658

1,374,929

2,647,401

1,150,286

Less, total fair value of stock and option awards reported in SCT

(1,493,315)

(312,008)

(1,441,904)

(339,825)

(314,028)

(3,757,708)

(454,575)

(1,375,183)

(415,925)

(1,299,232)

(372,768)

Plus, fair value (at end of fiscal year) of awards granted in 2024 fiscal year that are unvested and outstanding

784,193

163,846

704,167

196,417

159,817

1,829,007

231,345

702,051

212,336

990,495

284,187

Plus (less), change in fair (at end of fiscal year) value of prior year awards that are outstanding and unvested

(207,496)

(38,501)

(101,532)

(32,740)

(34,837)

-

(16,581)

(206,224)

(59,168)

(213,615)

(126,039)

Plus, fair value (at vesting date) of awards granted and vested in 2024 fiscal year

-

-

-

-

-

-

-

-

-

-

-

Plus (less), change in fair value (at vesting date) of prior year awards that vested in 2024 fiscal year

-

-

(365,506)

(85,803)

(53,421)

-

(15,096)

15,556

9,179

(46,132)

(23,167)

Plus (less), fair value (at end of prior fiscal year) of prior year awards that failed to vest in 2024 fiscal year (i.e. forfeited)

(365,816)

(74,238)

82,556

8,748

(469,736)

-

(20,015)

(94,243)

(55,603)

(241,110)

(121,079)

Less, change in actuarial present value of all defined benefit and actuarial pension plans

-

-

-

-

-

-

-

-

-

-

-

Plus, pension value attributable to current year's service and any change in pension value attributable to plan amendments made in the current year

-

-

-

-

-

-

-

-

-

-

-

Compensation Actually Paid ($)

1,669,153

784,586

2,052,731

809,823

806,333

3,016,641

1,174,802

2,194,616

1,065,747

1,837,807

791,419


Company Selected Measure Name Operating EBITDA        
Named Executive Officers, Footnote
(1)
Mr. Gandossi stepped down as Chief Executive Officer and President on May 1, 2022 and retired as a director effective May 31, 2022. Mr. Bueno was appointed as Chief Executive Officer and President on May 1, 2022, and was elected as a director effective May 31, 2022. In connection with Mr. Bueno's appointment, he was provided with a one-time moving cost allowance and was granted: (i) 50,000 RSUs; (ii) 96,530 PSUs that have a performance period ending on December 31, 2023; and (iii) 96,530 PSUs that have a performance period ending on December 31, 2024. Such one-time RSU and PSU grants were made to attract Mr. Bueno as well as allow Mr. Bueno to enter into the same pay for performance cycle as our other NEOs. PSU grants for the CEO in 2023 have returned to previous levels.
       
Peer Group Issuers, Footnote
(9)
For the relevant fiscal year, represents the cumulative total shareholder return of Mercer International Inc. and the TSR Peer Group as set forth under the Fiscal 2024 Shareholder Returns section of this Proxy Statement. Each year reflects what the cumulative value of $100 would be, including the reinvestment of dividends, adjusted for stock splits and spinoffs, if such amount were invested by the market close on the last trading day before the beginning of the Company’s third preceding fiscal year.
       
Adjustment To PEO Compensation, Footnote
(11)
"Compensation Actually Paid" to the CEO and the average "Compensation Actually Paid" to the NEOs reflect the following adjustment from Total Compensation reported in the Summary Compensation Table:


2024

2024

2023

2023

2022

2021

2020


CEO

($)

Average

of NEOs

($)


CEO

($)

Average

of NEOs

($)

CEO

(Gandossi)

($)

CEO

(Bueno)

($)

Average

of NEOs

($)


CEO

($)

Average

of NEOs

($)


CEO

($)

Average

of NEOs

($)

Total Reported in 2024 Summary Compensation Table (SCT)

2,951,587

1,045,486

3,174,950

1,063,027

1,518,538

4,945,342

1,449,725

3,152,658

1,374,929

2,647,401

1,150,286

Less, total fair value of stock and option awards reported in SCT

(1,493,315)

(312,008)

(1,441,904)

(339,825)

(314,028)

(3,757,708)

(454,575)

(1,375,183)

(415,925)

(1,299,232)

(372,768)

Plus, fair value (at end of fiscal year) of awards granted in 2024 fiscal year that are unvested and outstanding

784,193

163,846

704,167

196,417

159,817

1,829,007

231,345

702,051

212,336

990,495

284,187

Plus (less), change in fair (at end of fiscal year) value of prior year awards that are outstanding and unvested

(207,496)

(38,501)

(101,532)

(32,740)

(34,837)

-

(16,581)

(206,224)

(59,168)

(213,615)

(126,039)

Plus, fair value (at vesting date) of awards granted and vested in 2024 fiscal year

-

-

-

-

-

-

-

-

-

-

-

Plus (less), change in fair value (at vesting date) of prior year awards that vested in 2024 fiscal year

-

-

(365,506)

(85,803)

(53,421)

-

(15,096)

15,556

9,179

(46,132)

(23,167)

Plus (less), fair value (at end of prior fiscal year) of prior year awards that failed to vest in 2024 fiscal year (i.e. forfeited)

(365,816)

(74,238)

82,556

8,748

(469,736)

-

(20,015)

(94,243)

(55,603)

(241,110)

(121,079)

Less, change in actuarial present value of all defined benefit and actuarial pension plans

-

-

-

-

-

-

-

-

-

-

-

Plus, pension value attributable to current year's service and any change in pension value attributable to plan amendments made in the current year

-

-

-

-

-

-

-

-

-

-

-

Compensation Actually Paid ($)

1,669,153

784,586

2,052,731

809,823

806,333

3,016,641

1,174,802

2,194,616

1,065,747

1,837,807

791,419

       
Non-PEO NEO Average Total Compensation Amount $ 1,045,486 $ 1,063,027 $ 1,449,725 $ 1,374,929 $ 1,150,286
Non-PEO NEO Average Compensation Actually Paid Amount $ 784,586 809,823 1,174,802 1,065,747 791,419
Adjustment to Non-PEO NEO Compensation Footnote
(11)
"Compensation Actually Paid" to the CEO and the average "Compensation Actually Paid" to the NEOs reflect the following adjustment from Total Compensation reported in the Summary Compensation Table:


2024

2024

2023

2023

2022

2021

2020


CEO

($)

Average

of NEOs

($)


CEO

($)

Average

of NEOs

($)

CEO

(Gandossi)

($)

CEO

(Bueno)

($)

Average

of NEOs

($)


CEO

($)

Average

of NEOs

($)


CEO

($)

Average

of NEOs

($)

Total Reported in 2024 Summary Compensation Table (SCT)

2,951,587

1,045,486

3,174,950

1,063,027

1,518,538

4,945,342

1,449,725

3,152,658

1,374,929

2,647,401

1,150,286

Less, total fair value of stock and option awards reported in SCT

(1,493,315)

(312,008)

(1,441,904)

(339,825)

(314,028)

(3,757,708)

(454,575)

(1,375,183)

(415,925)

(1,299,232)

(372,768)

Plus, fair value (at end of fiscal year) of awards granted in 2024 fiscal year that are unvested and outstanding

784,193

163,846

704,167

196,417

159,817

1,829,007

231,345

702,051

212,336

990,495

284,187

Plus (less), change in fair (at end of fiscal year) value of prior year awards that are outstanding and unvested

(207,496)

(38,501)

(101,532)

(32,740)

(34,837)

-

(16,581)

(206,224)

(59,168)

(213,615)

(126,039)

Plus, fair value (at vesting date) of awards granted and vested in 2024 fiscal year

-

-

-

-

-

-

-

-

-

-

-

Plus (less), change in fair value (at vesting date) of prior year awards that vested in 2024 fiscal year

-

-

(365,506)

(85,803)

(53,421)

-

(15,096)

15,556

9,179

(46,132)

(23,167)

Plus (less), fair value (at end of prior fiscal year) of prior year awards that failed to vest in 2024 fiscal year (i.e. forfeited)

(365,816)

(74,238)

82,556

8,748

(469,736)

-

(20,015)

(94,243)

(55,603)

(241,110)

(121,079)

Less, change in actuarial present value of all defined benefit and actuarial pension plans

-

-

-

-

-

-

-

-

-

-

-

Plus, pension value attributable to current year's service and any change in pension value attributable to plan amendments made in the current year

-

-

-

-

-

-

-

-

-

-

-

Compensation Actually Paid ($)

1,669,153

784,586

2,052,731

809,823

806,333

3,016,641

1,174,802

2,194,616

1,065,747

1,837,807

791,419

       
Compensation Actually Paid vs. Total Shareholder Return

img178226991_89.jpg

       
Compensation Actually Paid vs. Net Income

img178226991_89.jpg

       
Compensation Actually Paid vs. Company Selected Measure

img178226991_89.jpg

       
Tabular List, Table

Tabular List

Listed below are the financial and non-financial performance measures which we believe to be our most important measures to link compensation actually paid to our NEOs to Company performance, for fiscal 2024.


Measure

Explanation

Net Income

Net income in accordance with generally accepted accounting principles in the United States ("GAAP").

Operating EBITDA

A non-GAAP financial measure comprised of Net Income before Income tax provision, Interest expense, Other income and Depreciation and amortization.

Total Recordable Incident Rate (TRIR)

Total recordable incident rate; the rate of recordable workplace injuries per 200,000 working hours.

Return on Average Assets (ROAA)

Return on average assets; the ratio of Net income in accordance with GAAP to the average Total Assets of the Company in the year.

Revenues

Revenues for the year in accordance with GAAP.

Other

Other non-financial measures include advancement of strategic priorities related to acquisitions, capital expenditures, productivity, carbon emissions reduction, environmental performance, employee and community engagement and equity and diversity initiatives.

       
Total Shareholder Return Amount $ 59.84 100.06 103.55 104.19 87.24
Peer Group Total Shareholder Return Amount 86.62 107.36 129.84 132.54 122.03
Net Income (Loss) $ (85,141) $ (242,056) $ 247,039 $ 170,988 $ (17,235)
Company Selected Measure Amount 243,722,000 17,462,000 536,521,000 478,782,000 192,650,000
PEO Name Juan Carlos Bueno Juan Carlos Bueno David Gandossi David Gandossi David Gandossi
Measure:: 1          
Pay vs Performance Disclosure          
Name Net Income        
Measure:: 2          
Pay vs Performance Disclosure          
Name Operating EBITDA        
Measure:: 3          
Pay vs Performance Disclosure          
Name Total Recordable Incident Rate (TRIR)        
Measure:: 4          
Pay vs Performance Disclosure          
Name Return on Average Assets (ROAA)        
Measure:: 5          
Pay vs Performance Disclosure          
Name Revenues        
Measure:: 6          
Pay vs Performance Disclosure          
Name Other        
Aggregate Grant Date Fair Value of Equity Award Amounts Reported in Summary Compensation Table          
Pay vs Performance Disclosure          
Adjustment to Compensation, Amount $ (312,008) $ (339,825) $ (454,575) $ (415,925) $ (372,768)
Year-end Fair Value of Equity Awards Granted in Covered Year that are Outstanding and Unvested          
Pay vs Performance Disclosure          
Adjustment to Compensation, Amount 163,846 196,417 231,345 212,336 284,187
Year-over-Year Change in Fair Value of Equity Awards Granted in Prior Years That are Outstanding and Unvested          
Pay vs Performance Disclosure          
Adjustment to Compensation, Amount (38,501) (32,740) (16,581) (59,168) (126,039)
Change in Fair Value as of Vesting Date of Prior Year Equity Awards Vested in Covered Year          
Pay vs Performance Disclosure          
Adjustment to Compensation, Amount   (85,803) (15,096) 9,179 (23,167)
Prior Year End Fair Value of Equity Awards Granted in Any Prior Year that Fail to Meet Applicable Vesting Conditions During Covered Year          
Pay vs Performance Disclosure          
Adjustment to Compensation, Amount (74,238) 8,748 (20,015) (55,603) (121,079)
Juan Carlos Bueno          
Pay vs Performance Disclosure          
PEO Total Compensation Amount 2,951,587 3,174,950 4,945,342    
PEO Actually Paid Compensation Amount 1,669,153 2,052,731 3,016,641    
Juan Carlos Bueno | Aggregate Grant Date Fair Value of Equity Award Amounts Reported in Summary Compensation Table          
Pay vs Performance Disclosure          
Adjustment to Compensation, Amount (1,493,315) (1,441,904) (3,757,708)    
Juan Carlos Bueno | Year-end Fair Value of Equity Awards Granted in Covered Year that are Outstanding and Unvested          
Pay vs Performance Disclosure          
Adjustment to Compensation, Amount 784,193 704,167 1,829,007    
Juan Carlos Bueno | Year-over-Year Change in Fair Value of Equity Awards Granted in Prior Years That are Outstanding and Unvested          
Pay vs Performance Disclosure          
Adjustment to Compensation, Amount (207,496) (101,532)      
Juan Carlos Bueno | Change in Fair Value as of Vesting Date of Prior Year Equity Awards Vested in Covered Year          
Pay vs Performance Disclosure          
Adjustment to Compensation, Amount   (365,506)      
Juan Carlos Bueno | Prior Year End Fair Value of Equity Awards Granted in Any Prior Year that Fail to Meet Applicable Vesting Conditions During Covered Year          
Pay vs Performance Disclosure          
Adjustment to Compensation, Amount $ (365,816) $ 82,556      
David Gandossi          
Pay vs Performance Disclosure          
PEO Total Compensation Amount     1,518,538 3,152,658 2,647,401
PEO Actually Paid Compensation Amount     806,333 2,194,616 1,837,807
David Gandossi | Aggregate Grant Date Fair Value of Equity Award Amounts Reported in Summary Compensation Table          
Pay vs Performance Disclosure          
Adjustment to Compensation, Amount     (314,028) (1,375,183) (1,299,232)
David Gandossi | Year-end Fair Value of Equity Awards Granted in Covered Year that are Outstanding and Unvested          
Pay vs Performance Disclosure          
Adjustment to Compensation, Amount     159,817 702,051 990,495
David Gandossi | Year-over-Year Change in Fair Value of Equity Awards Granted in Prior Years That are Outstanding and Unvested          
Pay vs Performance Disclosure          
Adjustment to Compensation, Amount     (34,837) (206,224) (213,615)
David Gandossi | Change in Fair Value as of Vesting Date of Prior Year Equity Awards Vested in Covered Year          
Pay vs Performance Disclosure          
Adjustment to Compensation, Amount     (53,421) 15,556 (46,132)
David Gandossi | Prior Year End Fair Value of Equity Awards Granted in Any Prior Year that Fail to Meet Applicable Vesting Conditions During Covered Year          
Pay vs Performance Disclosure          
Adjustment to Compensation, Amount     $ (469,736) $ (94,243) $ (241,110)