Pay vs Performance Disclosure
$ / shares in Thousands
$ / shares in Thousands
Dec. 31, 2024
USD ($)
$ / shares
Dec. 31, 2023
USD ($)
$ / shares
Dec. 31, 2022
USD ($)
$ / shares
| Value of Initial Fixed $100 Investment Based on: | ||||||||||||||||||||||||||
Year (1) | Summary Compensation Table Total for PEO ($)(2) | Compensation Actually Paid to PEO ($)(3) | Average Summary Compensation Table Total for Non-PEO NEOs ($)(2) | Average Compensation Actually Paid to Non-PEO NEOs ($)(4) | Company Total Shareholder Return ($)(5) | Peer Group Total Shareholder Return ($)(6) | Net Income (Loss) (in thousands) ($)(7) | Adjusted EBITDA (Loss) (in thousands) ($)(8) | ||||||||||||||||||
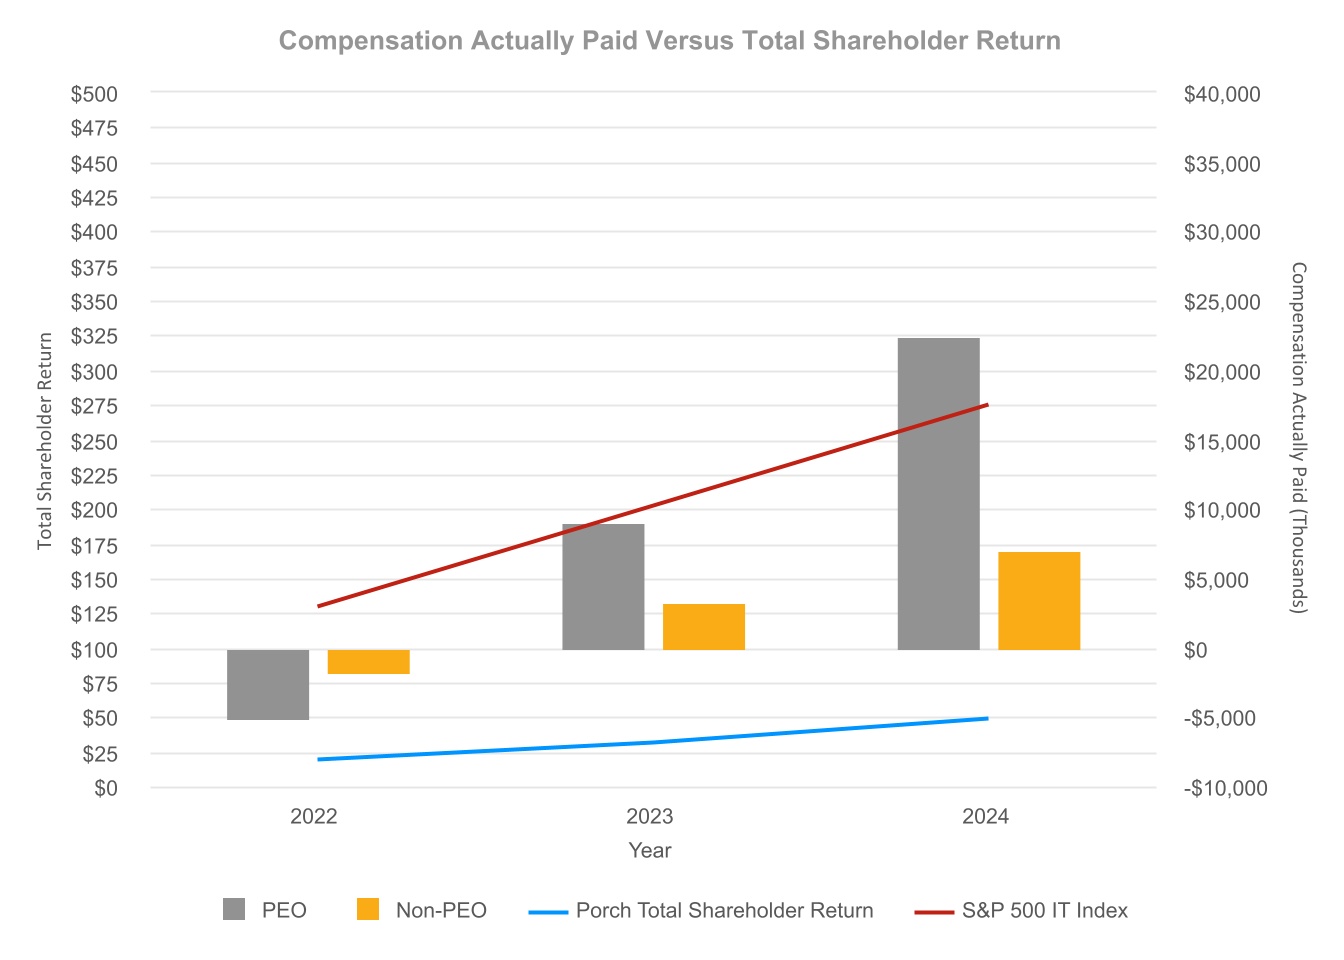
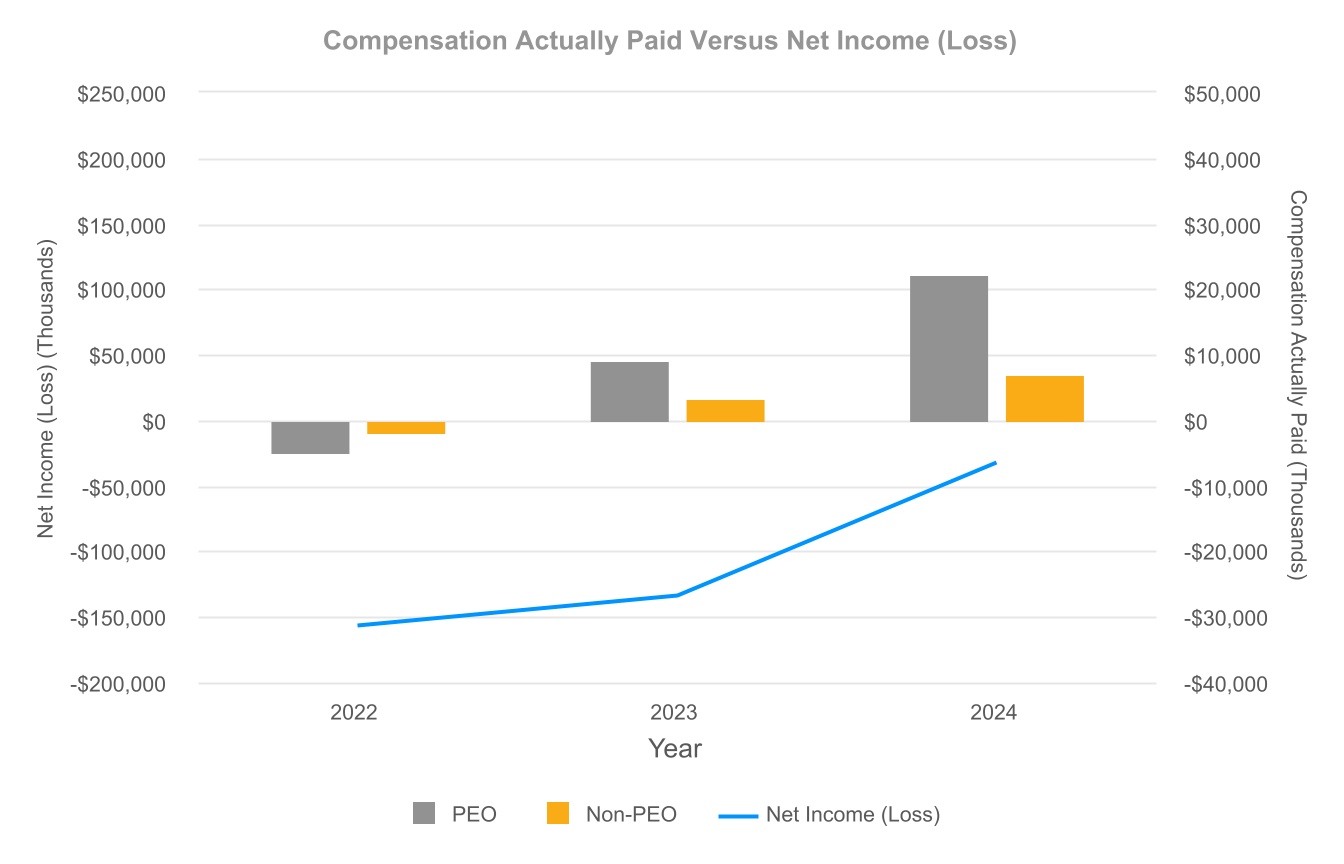
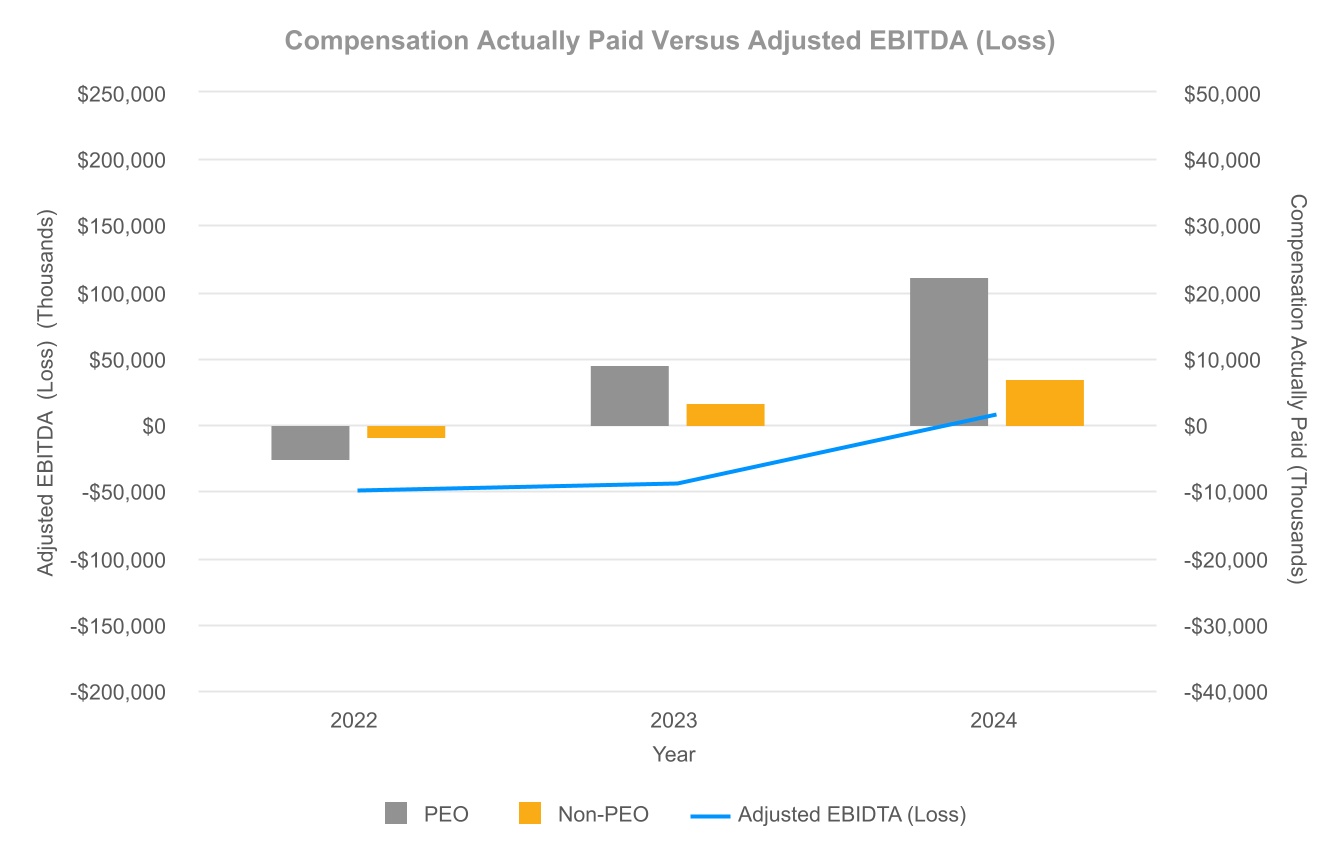
| 2024 | 12,760,578 | 22,388,040 | 4,199,271 | 6,945,312 | 34 | 202 | (32,829) | 7,171 | ||||||||||||||||||
| 2023 | 4,266,774 | 9,047,023 | 1,873,307 | 3,318,178 | 22 | 149 | (133,933) | (44,514) | ||||||||||||||||||
| 2022 | 13,583,222 | (5,051,506) | 896,705 | (1,798,741) | 13 | 95 | (156,559) | (49,601) | ||||||||||||||||||
(2)The dollar amounts reported in the table are the amounts of total compensation reported for Mr. Ehrlichman and the average amounts of total compensation reported for the other NEOs as a group, as listed in footnote (4), for each corresponding year in the "Total" column of the Summary Compensation Table, as applicable. See "NEO Compensation Tables—2024 Summary Compensation Table."
(4)The Non-PEO NEOs reported in the table represent Messrs. Tabak, Neagle, and Heimbigner for year 2022, and Messrs. Tabak and Neagle for 2023 and 2024. To calculate CAP, the following average adjustments were made to the average total compensation number shown in the Summary Compensation Table. See footnotes (a) and (b) to footnote (3) above for information on footnotes (a) and (b) in the table below.
(6)Assumes an investment of $100 was made in the S&P 500 IT Index on December 31, 2020, and measures cumulative TSR from that date through and including December 31 of the specified year.
(3)The PEO reported in the table represents Mr. Ehrlichman for all three years shown. The dollar amounts reported represent the amount of CAP as computed in accordance with Item 402(v) of Regulation S-K. The dollar amounts do not reflect the actual amount of compensation earned by or paid to Mr. Ehrlichman during the applicable year. In accordance with the requirements of Item 402(v) of Regulation S-K, the following table provides the adjustments that were made to Mr. Ehrlichman’s total compensation for each year to determine the CAP.
| Year | Reported Summary Compensation Table Total for PEO ($) | Less | Reported Value of Equity Awards ($)(a) | Plus | Equity Award Adjustments ($)(b) | Equals | CAP for PEO ($) | ||||||||||||||||
| 2024 | 12,760,578 | 11,320,415 | 20,947,877 | 22,388,040 | |||||||||||||||||||
| 2023 | 4,266,774 | 2,445,664 | 7,225,913 | 9,047,023 | |||||||||||||||||||
| 2022 | 13,583,222 | 12,893,066 | (5,741,662) | (5,051,506) | |||||||||||||||||||
| Equity Award Adjustments | ||||||||||||||||||||
| Year | Added Value of Outstanding and Unvested Awards Granted During the Year ($) | Added Change in Value of Outstanding and Unvested Awards Granted in Prior Years ($) | Added Value as of Vesting Date of Awards Granted and Vested During the Year ($) | Added Change in Value of Awards Granted in Prior Years and Vested During the Year ($) | Deducted Fair Value at the End of the Prior Year of Awards that Failed to Meet Vesting Conditions During the Year ($) | Total Equity Award Adjustments ($) | ||||||||||||||
| 2024 | 12,522,171 | 8,509,228 | — | (62,409) | (21,113) | 20,947,877 | ||||||||||||||
| 2023 | 6,974,212 | 471,227 | — | (199,020) | (20,506) | 7,225,913 | ||||||||||||||
| 2022 | 1,520,099 | (6,746,516) | 1,520,122 | (2,035,367) | — | (5,741,662) | ||||||||||||||
(a)The grant date fair value of equity awards represents the total of the amounts reported in the “Stock Awards” and “Option Awards” columns in the Summary Compensation Table for the applicable year.
(b)The equity award adjustments for each applicable year include the addition (or subtraction, as applicable) of the following: (i) the year-end fair value of any equity awards granted in the applicable year that are outstanding and unvested as of the end of the year; (ii) the amount of change as of the end of the applicable year (from the end of the prior year) in fair value of any awards granted in prior years that are outstanding and unvested as of the end of the applicable year; (iii) for awards granted and vested in the same year for any applicable year, the amount equal to the fair value as of the vesting date; (iv) for awards granted in prior years that vest in the applicable year, the amount equal to the change as of the vesting date (from the end of the prior year) in fair value; and (v) the subtraction of the prior year year-end fair value for any awards granted in prior years that fail to meet the applicable vesting conditions during the applicable year. The fair values of RSUs and PRSUs included in the CAP to our PEO and the Average CAP to our other NEOs are calculated at the required measurement dates in accordance with FASB ASC 718, consistent with the approach used to value the awards at the grant date as described in our Form 10-K. In accordance with Item 402(v) of Regulation S-K, the fair values of unvested and outstanding equity awards were remeasured as of the end of each year, and as of each vesting date. The valuation assumptions used to calculate fair values did not materially differ from those disclosed at the grant date. Any material changes to the RSU, PRSU, and stock option fair values from the grant date (for current year grants) and from prior year-end (for prior year grants) are based on our updated stock price at the respective measurement dates, and for PRSUs, updated estimates for performance outcomes.
(4)The Non-PEO NEOs reported in the table represent Messrs. Tabak, Neagle, and Heimbigner for year 2022, and Messrs. Tabak and Neagle for 2023 and 2024. To calculate CAP, the following average adjustments were made to the average total compensation number shown in the Summary Compensation Table. See footnotes (a) and (b) to footnote (3) above for information on footnotes (a) and (b) in the table below.
| Year | Average Reported Summary Compensation Table Total for Non-PEO NEOs ($) | Less | Average Reported Value of Equity Awards ($)(a) | Plus | Average Equity Award Adjustments ($)(b) | Equals | Average CAP for Non-PEO NEOs ($) | ||||||||||||||||
| 2024 | 4,199,271 | 3,336,246 | 6,082,287 | 6,945,312 | |||||||||||||||||||
| 2023 | 1,873,307 | 856,479 | 2,301,350 | 3,318,178 | |||||||||||||||||||
| 2022 | 896,705 | 464,687 | (2,230,759) | (1,798,741) | |||||||||||||||||||
| Equity Award Adjustments | ||||||||||||||||||||
| Year | Added Value of Outstanding and Unvested Awards Granted During the Year ($) | Added Change in Value of Outstanding and Unvested Awards Granted in Prior Years ($) | Added Value as of Vesting Date of Awards Granted and Vested During the Year ($) | Added Change in Value of Awards Granted in Prior Years and Vested During the Year ($) | Deducted Fair Value at the End of the Prior Year of Awards that Failed to Meet Vesting Conditions During the Year ($) | Total Equity Award Adjustments ($) | ||||||||||||||
| 2024 | 3,762,059 | 2,346,205 | — | (20,599) | (5,378) | 6,082,287 | ||||||||||||||
| 2023 | 2,249,022 | 110,119 | — | (57,460) | (331) | 2,301,350 | ||||||||||||||
| 2022 | 223,440 | (765,032) | — | (635,944) | (1,053,223) | (2,230,759) | ||||||||||||||
| MOST IMPORTANT PERFORMANCE MEASURES TO DETERMINE 2024 COMPENSATION ACTUALLY PAID | ||||||||
| Relative Total Shareholder Return | Revenue | Adjusted EBITDA (Loss) | ||||||
(8)Reflects Adjusted EBITDA (Loss) for the specified year as reported in our financial statements.