Pay vs Performance Disclosure - USD ($)
Dec. 31, 2024
Dec. 31, 2023
Dec. 31, 2022
Dec. 31, 2021
Dec. 31, 2020
Pay Versus Performance
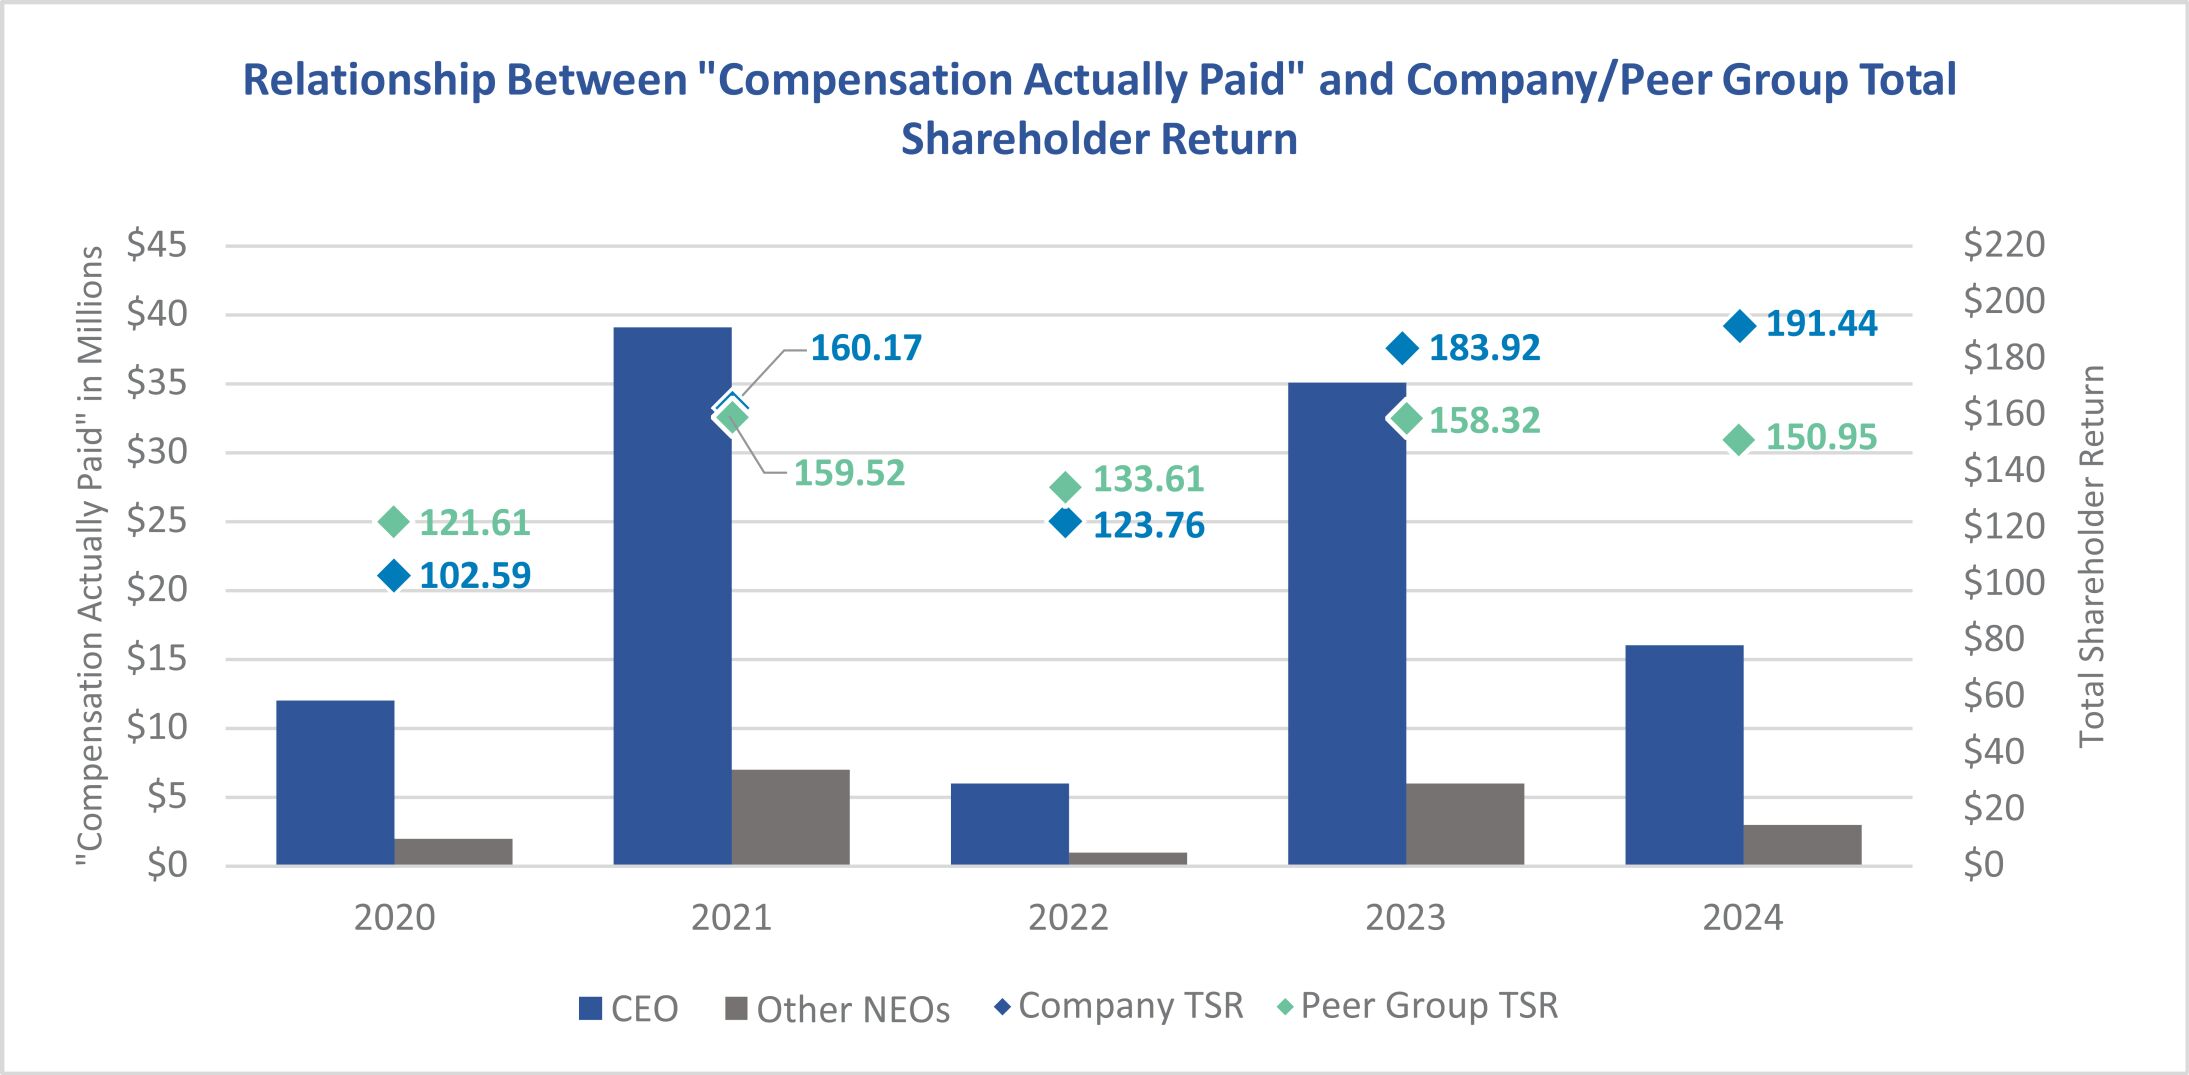
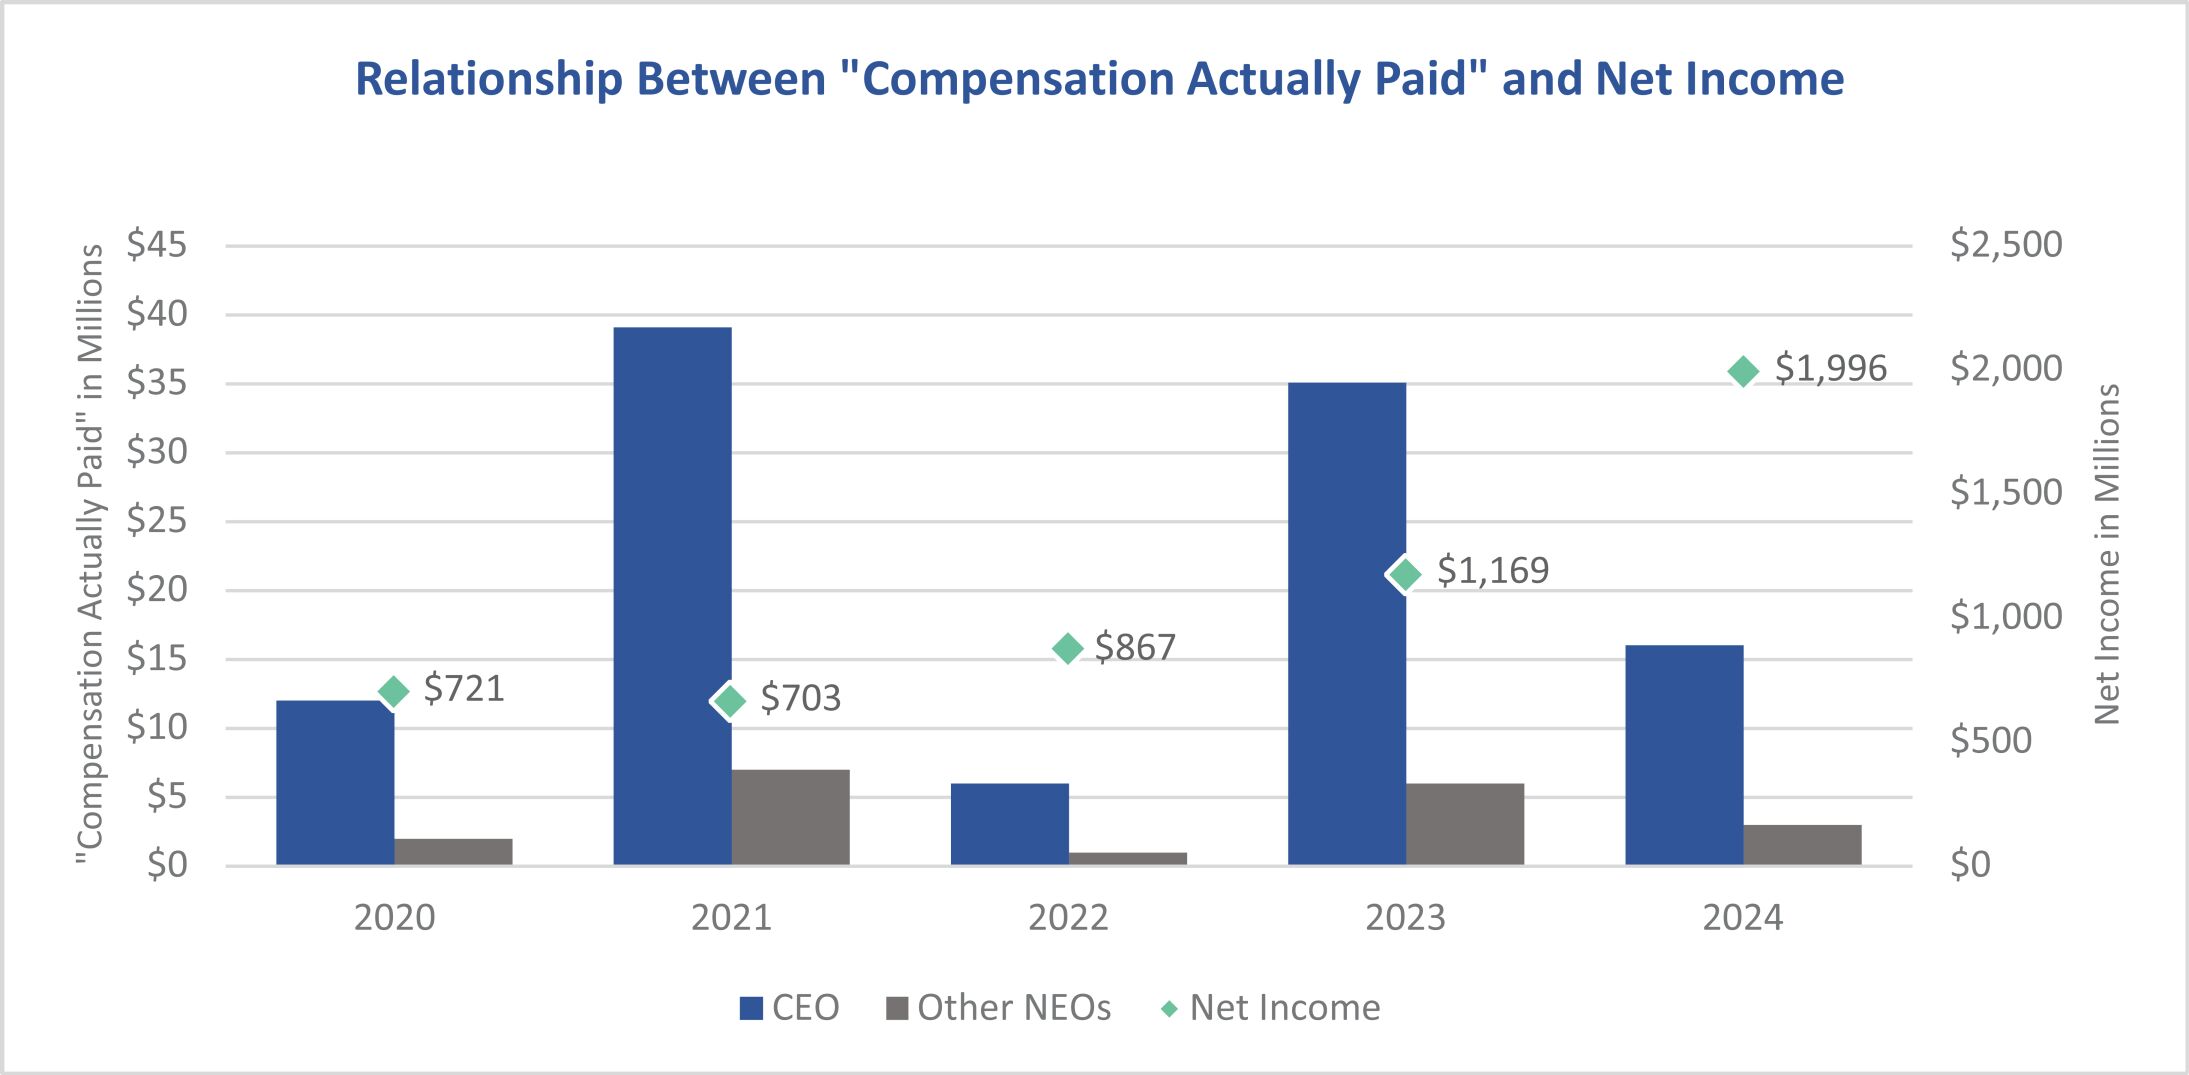
The Company is required to disclose in its Proxy Statement information that shows the relationship between “Compensation Actually Paid” as defined in Item 402(v) of Regulation
S-K
and the financial performance of the Company. The Management Development and Compensation Committee did not consider the Pay Versus Performance disclosure when making its executive pay or incentive compensation decisions for any of the years shown. For a discussion of how the Management Development and Compensation Committee seeks to align pay with performance when making compensation decisions, please review the Compensation Discussion and Analysis beginning on page 43. The table and notes below provide this disclosure for the fiscal years ending December 31, 2024, 2023, 2022, 2021 and 2020. Average Summary Compensation Table Total for Non-PEO Named Executive Officers ($) |
Average Compensation Actually Paid to Non-PEO Named Executive Officers ($) |
Value of Initial Fixed $100 Investment Based on: |
||||||||||||||||||||||||||||||
Year (1) |
Summary Compensation Table Total for PEO ($) |
Compensation Actually Paid to PEO (2),(3) ($) |
Total Shareholder Return (5) ($) |
Peer Group Total Shareholder Return (5) ($) |
Net Income ($) |
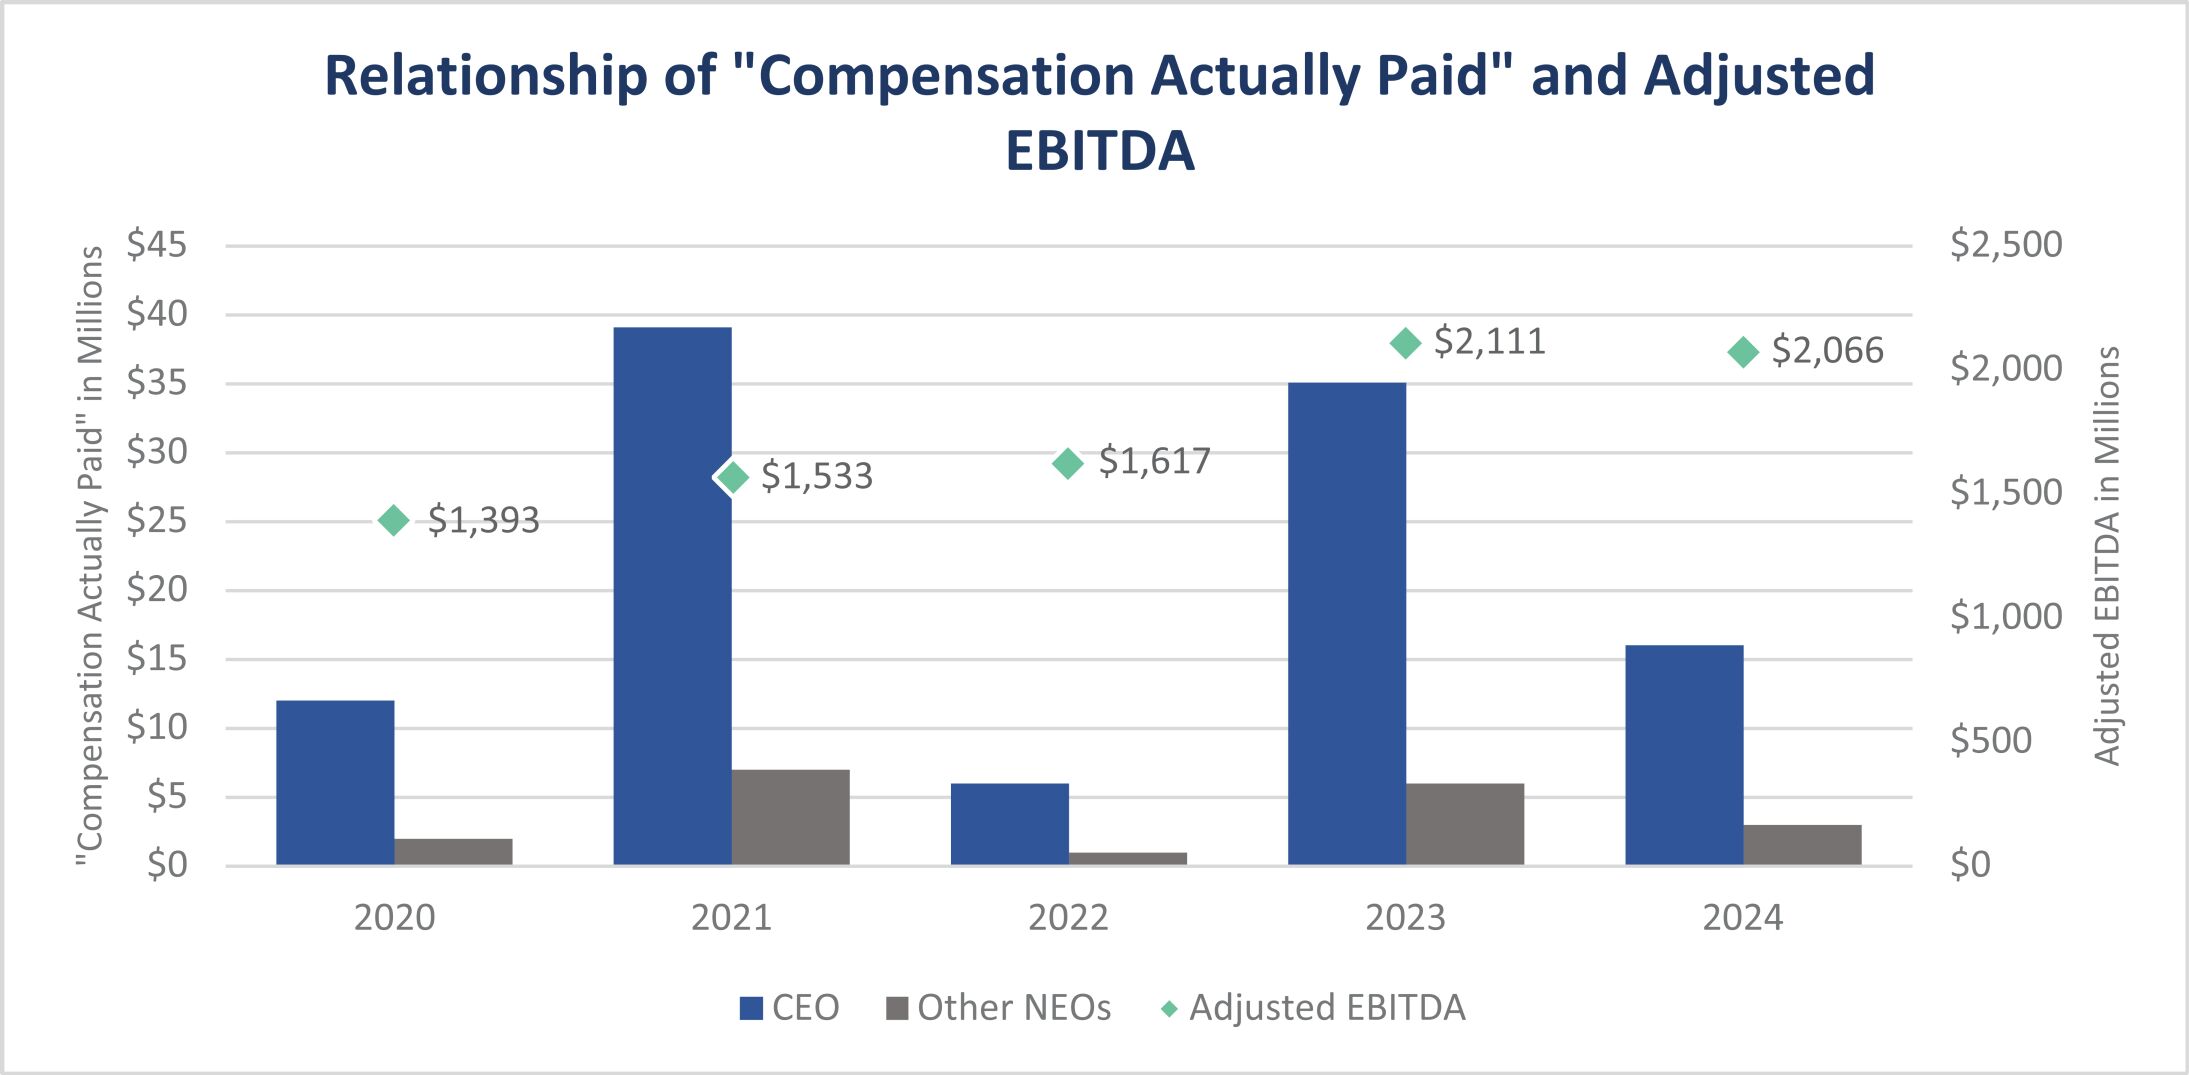
Company Selected Measure (Adjusted EBITDA) (6) ($) |
||||||||||||||||||||||||||
2024 |
17,716,763 | 16,189,220 | (4) |
3,552,457 | 3,410,604 | (4) |
191.44 | 150.95 | 1,995,810,000 | 2,065,910,000 | ||||||||||||||||||||||
2023 |
18,488,885 | 35,058,147 | 3,477,775 | 5,837,293 | 183.92 | 158.32 | 1,169,400,000 | 2,111,400,000 | ||||||||||||||||||||||||
2022 |
12,784,251 | 6,452,731 | 2,438,871 | 1,415,556 | 123.76 | 133.61 | 866,740,000 | 1,617,010,000 | ||||||||||||||||||||||||
2021 |
14,939,587 | 39,031,817 | 2,739,108 | 6,627,252 | 160.17 | 159.52 | 702,770,000 | 1,533,200,000 | ||||||||||||||||||||||||
2020 |
12,818,588 | 12,254,009 | 2,618,321 | 2,456,130 | 102.59 | 121.61 | 721,050,000 | 1,392,820,000 | ||||||||||||||||||||||||
| (1) | The PEO and NEOs included in the above compensation columns reflect the following: |
Year |
PEO |
NEOs | ||
2024 |
C. Howard Nye | James A. J. Nickolas, Roselyn R. Bar, Robert J. Cardin, Michael J. Petro | ||
2023 |
C. Howard Nye | James A. J. Nickolas, Roselyn R. Bar, Robert J. Cardin, Michael J. Petro | ||
2022 |
C. Howard Nye | James A. J. Nickolas, Roselyn R. Bar, Craig M. LaTorre, John P. Mohr | ||
2021 |
C. Howard Nye | James A. J. Nickolas, Roselyn R. Bar, Craig M. LaTorre, John P. Mohr | ||
2020 |
C. Howard Nye | James A. J. Nickolas, Roselyn R. Bar, Daniel L. Grant, Craig M. LaTorre | ||
| (2) | The dollar amounts reported for our PEO and NEOs under “Compensation Actually Paid” represent the amount of “Compensation Actually Paid” to the PEO and NEOs, as computed in accordance with Item 402(v) of Regulation S-K. The dollar amounts do not reflect the actual amount of compensation earned by or paid to the PEO or NEOs during the applicable year. |
| (3) | For the portion of “Compensation Actually Paid” that is based on year-end stock prices, the following prices were used: for 2024: $516.50; 2023: $498.91; for 2022: $337.97; for 2021: $440.52; and for 2020: $283.97. |
| (4) | 2024 “Compensation Actually Paid” to the PEO and the average “Compensation Actually Paid” to the NEOs reflect the following adjustments from Total Compensation reported in the Summary Compensation Table: |
PEO |
Average for non-PEO NEOs |
|||||||
Total Reported in 2024 Summary Compensation Table (SCT) |
17,716,763 | 3,552,457 | ||||||
Less, Value of Stock Awards Reported in SCT |
(9,295,192 | ) | (1,563,814 | ) | ||||
Less, Change in Pension Value and Non-Qualified Deferred Compensation Earnings in SCT |
(5,154,637 | ) | (707,722 | ) | ||||
Plus, Pension Service Cost |
863,309 | 227,328 | ||||||
Plus, Year-End Value of Awards Granted in Fiscal Year that are Unvested and Outstanding |
9,922,483 | 1,609,542 | ||||||
Plus, Change in Fair Value of Prior Year Awards that are Unvested and Outstanding |
550,672 | 86,700 | ||||||
Plus, FMV of Awards Granted this Year and that Vested this Year |
147,096 | 8,952 | ||||||
Plus, Change in Fair Value (from Prior Year-End) of Prior Year Awards that Vested this Year |
1,438,726 | 197,161 | ||||||
Less, Prior Year Fair Value of Prior Year Awards that Failed to Vest this Year |
||||||||
Total Adjustments |
(1,527,543 | ) | (141,853 | ) | ||||
“Compensation Actually Paid” for Fiscal Year 2024 |
16,189,220 | 3,410,604 | ||||||
| (5) | Company and Peer Group TSR reflects the Company’s peer group (S&P 500 Materials Index) as reflected in our Annual Report on Form 10-K pursuant to Item 201(e) of Regulation S-K for the fiscal year ended December 31, 2024. Each year reflects what the cumulative $100 investment would be, including the reinvestment of dividends, if such amount were invested on December 31, 2019. |
| (6) | Consolidated earnings before interest; income taxes; depreciation, depletion and amortization; earnings/loss from nonconsolidated equity affiliates; acquisition divestiture and integration expense; the impact of selling acquired inventory after its markup to fair value as part of acquisition accounting subject to the limitations described below, nonrecurring gains on divestitures; and noncash asset and portfolio rationalization charge of certain ready mixed concrete operations (Adjusted EBITDA) is an indicator used by the Company and investors to evaluate the Company’s operating performance from period to period. Effective January 1, 2024, transaction expenses and inventory acquisition accounting impacts are only excluded for transactions with at least $2 billion in consideration and transaction expenses expected to exceed $15 million. Adjusted EBITDA was selected as the 2024 “Company-Selected Measure” as defined in Item 402(v). Please see Appendix B for a reconciliation of non-GAAP measures to GAAP measures. |
| (1) | The PEO and NEOs included in the above compensation columns reflect the following: |
Year |
PEO |
NEOs | ||
2024 |
C. Howard Nye | James A. J. Nickolas, Roselyn R. Bar, Robert J. Cardin, Michael J. Petro | ||
2023 |
C. Howard Nye | James A. J. Nickolas, Roselyn R. Bar, Robert J. Cardin, Michael J. Petro | ||
2022 |
C. Howard Nye | James A. J. Nickolas, Roselyn R. Bar, Craig M. LaTorre, John P. Mohr | ||
2021 |
C. Howard Nye | James A. J. Nickolas, Roselyn R. Bar, Craig M. LaTorre, John P. Mohr | ||
2020 |
C. Howard Nye | James A. J. Nickolas, Roselyn R. Bar, Daniel L. Grant, Craig M. LaTorre | ||
10-K
pursuant to Item 201(e) of Regulation S-K
for the fiscal year ended December 31, 2024. Each year reflects what the cumulative $100 investment would be, including the reinvestment of dividends, if such amount were invested on December 31, 2019.
| (4) | 2024 “Compensation Actually Paid” to the PEO and the average “Compensation Actually Paid” to the NEOs reflect the following adjustments from Total Compensation reported in the Summary Compensation Table: |
PEO |
Average for non-PEO NEOs |
|||||||
Total Reported in 2024 Summary Compensation Table (SCT) |
17,716,763 | 3,552,457 | ||||||
Less, Value of Stock Awards Reported in SCT |
(9,295,192 | ) | (1,563,814 | ) | ||||
Less, Change in Pension Value and Non-Qualified Deferred Compensation Earnings in SCT |
(5,154,637 | ) | (707,722 | ) | ||||
Plus, Pension Service Cost |
863,309 | 227,328 | ||||||
Plus, Year-End Value of Awards Granted in Fiscal Year that are Unvested and Outstanding |
9,922,483 | 1,609,542 | ||||||
Plus, Change in Fair Value of Prior Year Awards that are Unvested and Outstanding |
550,672 | 86,700 | ||||||
Plus, FMV of Awards Granted this Year and that Vested this Year |
147,096 | 8,952 | ||||||
Plus, Change in Fair Value (from Prior Year-End) of Prior Year Awards that Vested this Year |
1,438,726 | 197,161 | ||||||
Less, Prior Year Fair Value of Prior Year Awards that Failed to Vest this Year |
||||||||
Total Adjustments |
(1,527,543 | ) | (141,853 | ) | ||||
“Compensation Actually Paid” for Fiscal Year 2024 |
16,189,220 | 3,410,604 | ||||||
Financial Performance Measures
The following table lists on an unranked basis the three financial performance measures that, in the Company’s assessment represent the most important performance measures used to link “Compensation Actually Paid” for our NEOs to Company performance for 2024.
| Adjusted EBITDA |
| rTSR |
| Total Revenues |
Adjusted EBITDA
was selected as the 2024 “Company-Selected Measure” as defined in Item 402(v). Please see Appendix B for a reconciliation of non-GAAP
measures to GAAP measures.