Pay vs Performance Disclosure - USD ($)
Dec. 31, 2024
Dec. 31, 2023
Dec. 31, 2022
Dec. 31, 2021
Pay Versus Performance
The following table provides information regarding fiscal years ended December 31, 2024, 2023, 2022 and 2021 in satisfaction of Item 402(v) of Regulation S-K. For the most recently completed fiscal year, we did not use any financial performance measure to link Compensation Actually Paid to our NEOs to the Company’s performance; accordingly, this disclosure does not present a company-selected measure in the table below nor a tabular list of our most important performance measures, as permitted by the SEC.
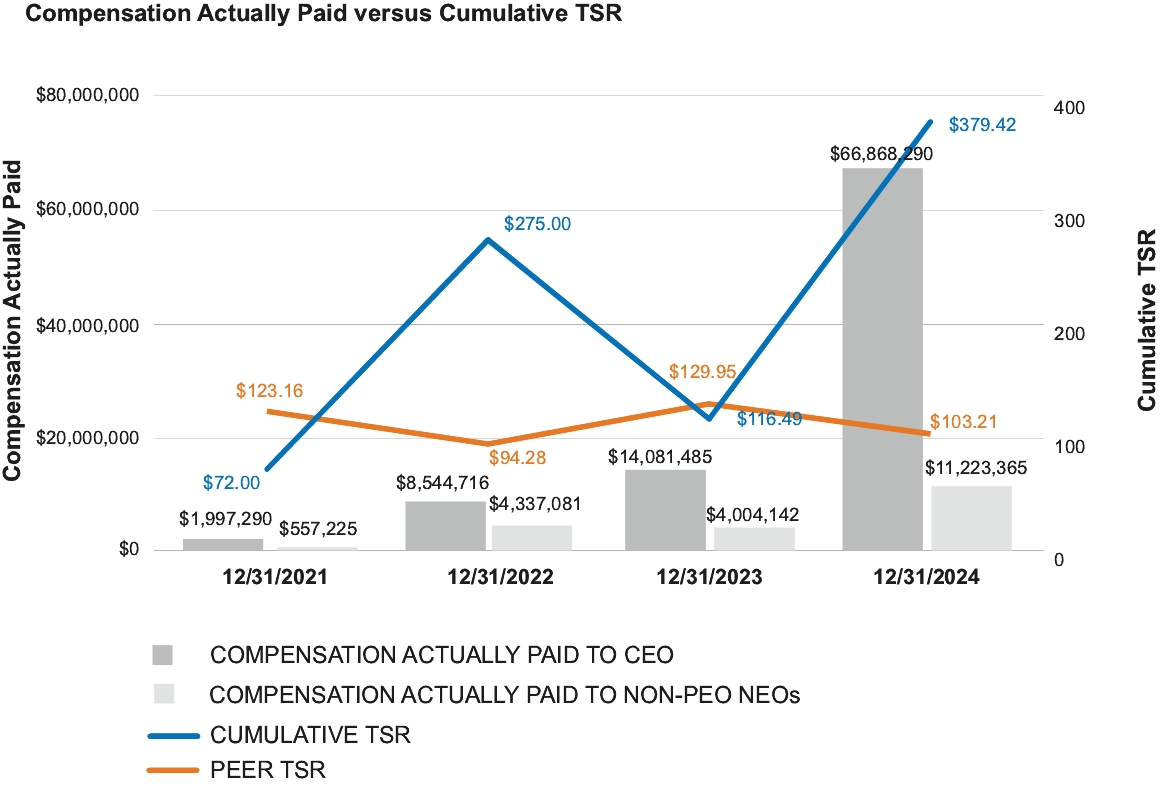
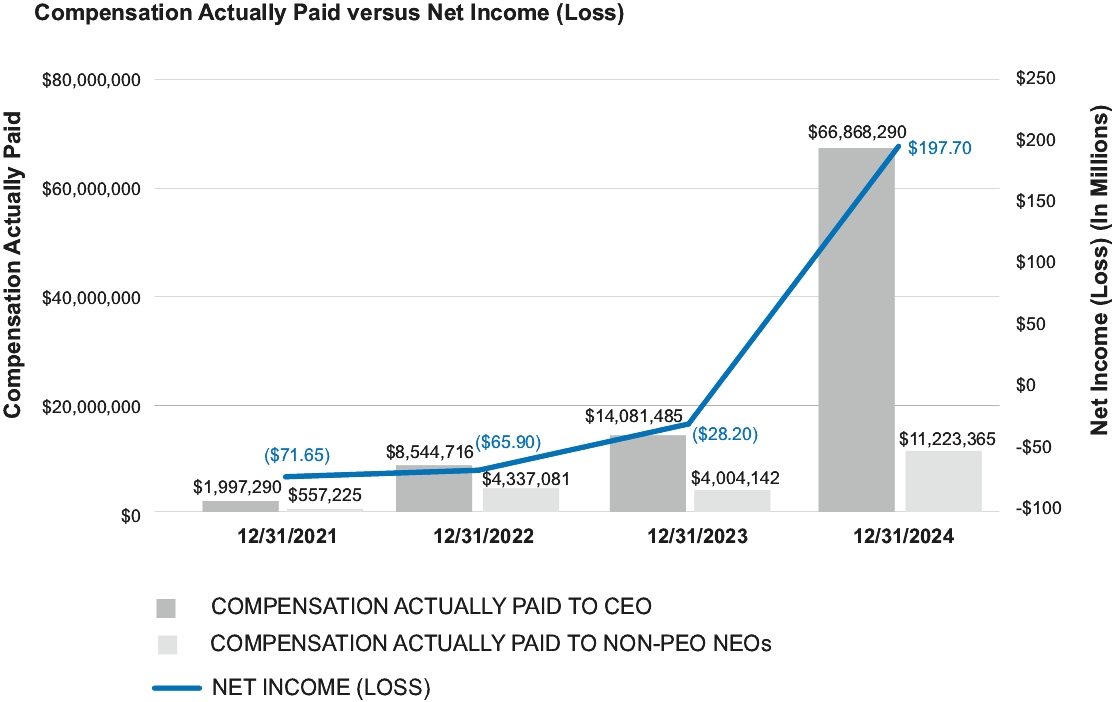
Year (a) | Summary Compensation Table Total for PEO ($)(1) (b) | Compensation Actually paid to PEO ($)(2) (c) | Average Summary Compensation Table Total for Non-PEO Named Executive Officers ($) (d) | Average Compensation Actually Paid to Non-PEO Named Executive Officers ($)(2); (3) (e) | Value of Initial Fixed $100 Investment Based on Total Shareholder Return ($) (f) | Value of Initial Fixed $100 Investment Based on Peer Group Total Shareholder Return ($)(4) (g) | Net Income (Millions) ($) (h) | ||||||||||||||||
2024 | 7,918,734 | 66,868,290 | 2,319,752(5) | 11,223,365 | 379.42 | 103.21 | 197.70 | ||||||||||||||||
2023 | 6,039,649 | 14,081,485 | 1,965,360 | 4,004,142 | 116.49 | 129.95 | (28.20) | ||||||||||||||||
2022 | 2,649,501 | 8,544,716 | 1,601,064 | 4,337,081 | 275.00 | 94.28 | (65.90) | ||||||||||||||||
2021 | 4,361,250 | 1,997,290 | 1,730,385 | 557,225 | 72.00 | 123.16 | (71.65) | ||||||||||||||||
(1) | The amounts in the column reflect the amounts reported in the “Total” column of the Summary Compensation Table for Mr. Adam Grossman, the Company’s President, Chief Executive Officer and Director. |
(2) | “Compensation Actually Paid” as set forth in this column is calculated in accordance with the Rules set forth under Item 402(v) and does not reflect the actual amounts earned or that may be earned by the applicable NEO. |
(3) | The amounts deducted or added in calculating the equity award adjustments required under Item 402(v) are set forth in the following table. The valuation assumptions used to calculate fair values are consistent with those used in our disclosures of fair value as of the grant date. |
(4) | The peer group used for purposes of calculating the amounts in this column is disclosed in “Compensation Discussion and Analysis” above. |
(5) | Mr. Lenz served as Chief Financial Officer until April 1, 2024, and transitioned into a consulting role; and Mr. Grossman served as Interim Chief Financial Officer from April 1, 2024 to July 2024. |
2024 | 2023 | 2022 | 2021 | |||||||||||||||||||||||
PEO ($) | Average non- PEO NEOs ($) | PEO ($) | Average non- PEO NEOs ($) | PEO ($) | Average non- PEO NEOs ($) | PEO ($) | Average non- PEO NEOs ($) | |||||||||||||||||||
Total Compensation from Summary Compensation Table | 7,918,734 | 2,319,752 | 6,039,649 | 1,965,360 | 2,649,501 | 1,601,064 | 4,361,250 | 1,730,385 | ||||||||||||||||||
Adjustments for Pension | ||||||||||||||||||||||||||
Adjustment Summary Compensation Table Pension | — | — | — | — | — | — | — | — | ||||||||||||||||||
Amount added for current year service cost | — | — | — | — | — | — | — | — | ||||||||||||||||||
Amount added for prior service cost impacting current year | — | — | — | — | — | — | — | — | ||||||||||||||||||
Total Adjustments for Pension | — | — | — | — | — | — | — | — | ||||||||||||||||||
Adjustments for Equity Awards | ||||||||||||||||||||||||||
Adjustments for grant date values in the Summary Compensation Table | (6,054,005) | (1,593,232) | (4,449,722) | (1,048,443) | (1,130,064) | (517,946) | (2,968,762) | (1,350,450) | ||||||||||||||||||
Year-end fair value of unvested awards granted in the current year | 21,762,079 | 3,602,224 | 6,056,139 | 1,426,946 | 2,961,868 | 1,357,523 | 622,157 | 184,064 | ||||||||||||||||||
2024 | 2023 | 2022 | 2021 | |||||||||||||||||||||||
PEO ($) | Average non- PEO NEOs ($) | PEO ($) | Average non- PEO NEOs ($) | PEO ($) | Average non- PEO NEOs ($) | PEO ($) | Average non- PEO NEOs ($) | |||||||||||||||||||
Year-over-year difference of year-end fair values for unvested awards granted in prior years | 35,134,796 | 5,711,703 | 6,506,459 | 1,690,652 | 2,462,585 | 1,029,429 | (121,190) | (47,127) | ||||||||||||||||||
Fair values at vest date for awards granted and vested in current year | — | — | — | — | — | — | — | — | ||||||||||||||||||
Difference in fair values between prior year-end fair values and vest date fair values for awards granted in prior years | 8,106,686 | 1,182,918 | (71,039) | (30,373) | 1,600,826 | 867,012 | 103,834 | 40,352 | ||||||||||||||||||
Forfeitures during current year equal to prior year-end fair value | — | — | — | — | — | — | — | — | ||||||||||||||||||
Dividend or dividend equivalents not otherwise included in total compensation | — | — | — | — | — | — | — | — | ||||||||||||||||||
Total Adjustments for Equity Awards | 58,949,556 | 8,903,614 | 8,041,836 | 2,038,782 | 5,895,215 | 2,736,017 | (2,363,960) | (1,173,160) | ||||||||||||||||||
Compensation Actually Paid (as calculated) | 66,868,290 | 11,223,365 | 14,081,485 | 4,004,142 | 8,544,716 | 4,337,081 | 1,997,290 | 557,225 | ||||||||||||||||||
(1) | The amounts in the column reflect the amounts reported in the “Total” column of the Summary Compensation Table for Mr. Adam Grossman, the Company’s President, Chief Executive Officer and Director. |
(5) | Mr. Lenz served as Chief Financial Officer until April 1, 2024, and transitioned into a consulting role; and Mr. Grossman served as Interim Chief Financial Officer from April 1, 2024 to July 2024. |
(4) | The peer group used for purposes of calculating the amounts in this column is disclosed in “Compensation Discussion and Analysis” above. |
(3) | The amounts deducted or added in calculating the equity award adjustments required under Item 402(v) are set forth in the following table. The valuation assumptions used to calculate fair values are consistent with those used in our disclosures of fair value as of the grant date. |
2024 | 2023 | 2022 | 2021 | |||||||||||||||||||||||
PEO ($) | Average non- PEO NEOs ($) | PEO ($) | Average non- PEO NEOs ($) | PEO ($) | Average non- PEO NEOs ($) | PEO ($) | Average non- PEO NEOs ($) | |||||||||||||||||||
Total Compensation from Summary Compensation Table | 7,918,734 | 2,319,752 | 6,039,649 | 1,965,360 | 2,649,501 | 1,601,064 | 4,361,250 | 1,730,385 | ||||||||||||||||||
Adjustments for Pension | ||||||||||||||||||||||||||
Adjustment Summary Compensation Table Pension | — | — | — | — | — | — | — | — | ||||||||||||||||||
Amount added for current year service cost | — | — | — | — | — | — | — | — | ||||||||||||||||||
Amount added for prior service cost impacting current year | — | — | — | — | — | — | — | — | ||||||||||||||||||
Total Adjustments for Pension | — | — | — | — | — | — | — | — | ||||||||||||||||||
Adjustments for Equity Awards | ||||||||||||||||||||||||||
Adjustments for grant date values in the Summary Compensation Table | (6,054,005) | (1,593,232) | (4,449,722) | (1,048,443) | (1,130,064) | (517,946) | (2,968,762) | (1,350,450) | ||||||||||||||||||
Year-end fair value of unvested awards granted in the current year | 21,762,079 | 3,602,224 | 6,056,139 | 1,426,946 | 2,961,868 | 1,357,523 | 622,157 | 184,064 | ||||||||||||||||||
2024 | 2023 | 2022 | 2021 | |||||||||||||||||||||||
PEO ($) | Average non- PEO NEOs ($) | PEO ($) | Average non- PEO NEOs ($) | PEO ($) | Average non- PEO NEOs ($) | PEO ($) | Average non- PEO NEOs ($) | |||||||||||||||||||
Year-over-year difference of year-end fair values for unvested awards granted in prior years | 35,134,796 | 5,711,703 | 6,506,459 | 1,690,652 | 2,462,585 | 1,029,429 | (121,190) | (47,127) | ||||||||||||||||||
Fair values at vest date for awards granted and vested in current year | — | — | — | — | — | — | — | — | ||||||||||||||||||
Difference in fair values between prior year-end fair values and vest date fair values for awards granted in prior years | 8,106,686 | 1,182,918 | (71,039) | (30,373) | 1,600,826 | 867,012 | 103,834 | 40,352 | ||||||||||||||||||
Forfeitures during current year equal to prior year-end fair value | — | — | — | — | — | — | — | — | ||||||||||||||||||
Dividend or dividend equivalents not otherwise included in total compensation | — | — | — | — | — | — | — | — | ||||||||||||||||||
Total Adjustments for Equity Awards | 58,949,556 | 8,903,614 | 8,041,836 | 2,038,782 | 5,895,215 | 2,736,017 | (2,363,960) | (1,173,160) | ||||||||||||||||||
Compensation Actually Paid (as calculated) | 66,868,290 | 11,223,365 | 14,081,485 | 4,004,142 | 8,544,716 | 4,337,081 | 1,997,290 | 557,225 | ||||||||||||||||||