| Year(1) | Summary Compensation Table Total for PEO ($) (2) | Compensation Actually Paid to PEO ($) (3) | Average Summary Compensation Table Total for Non-PEO NEOs ($)(2) | Average Compensation Actually Paid to Non-PEO NEOs ($)(3) | AST SpaceMobile Total Shareholder Return ($)(4) | Peer Group Total Shareholder Return ($)(5) | Net Income (Loss) ($000)(6) | Company Selected Measure(7) | ||||||||||||||||||||||||
| 2024 | $ | 1,609,800 | $ | 3,975,708 | $ | 179 | $ | 94 | $ | (300,083 | ) | |||||||||||||||||||||
| 2023 | $ | 250,000 | $ | 537,444 | $ | 51 | $ | 85 | $ | (86,897 | ) | |||||||||||||||||||||
| 2022 | $ | 1,716,496 | $ | 989,452 | $ | 41 | $ | 75 | $ | (31,640 | ) | |||||||||||||||||||||
| 2021 | $ | 8,995 | $ | 8,995 | $ | 1,430,211 | $ | 160,579 | $ | 67 | $ | 101 | $ | (30,553 | ) | |||||||||||||||||
| (1) | Abel Avellan served as the PEO for the entirety of 2024, 2023, 2022, and 2021. Our Non-PEO NEOs for the applicable years were as follows:
● 2024: Scott Wisniewski, Andrew Johnson, Shanti Gupta, Huiwen Yao, Sean Wallace and Brian Heller ● 2023: Sean Wallace and Brian Heller ● 2022: Sean Wallace and Brian Heller ● 2021: Brian Heller and Thomas Severson |
A reconciliation of the adjustments for Mr. Avellan and for the average of the Non-PEO NEOs is set forth in the following table, which describes the adjustments, each of which is prescribed by the SEC rules, to calculate the CAP from SCT amounts. Equity values are calculated in accordance with FASB ASC 718.
| 2024 PEO | 2024 Non-PEO NEOs | 2023 PEO | 2023 Non-PEO NEOs | 2022 PEO | 2022 Non-PEO NEOs | 2021 PEO | 2021 Non-PEO NEOs | |||||||||||||||||||||||||
| Summary Compensation Table Total (1) | $ | 1,609,800 | $ | 250,000 | $ | 1,716,496 | $ | 8,995 | $ | 1,430,211 | ||||||||||||||||||||||
| Minus Stock Award Value & Option Award Value Reported in SCT for the Covered Year | 1,311,575 | $ | 1,392,000 | $ | 1,025,000 | |||||||||||||||||||||||||||
| Plus Year End Fair Value of Equity Awards Granted During the Covered Year that Remain Outstanding and Unvested as of Last Day of the Covered Year | 2,417,708 | 964,000 | 813,850 | |||||||||||||||||||||||||||||
| Plus Year over Year Change in Fair Value as of the Last Day of the Covered Year of Outstanding and Unvested Equity Awards Granted in Prior Years | 783,060 | 243,513 | (239,850 | ) | (735,900 | ) | ||||||||||||||||||||||||||
| Plus Fair Value as of Vesting Date of Equity Awards Granted and Vested in the Covered Year | 131,250 | |||||||||||||||||||||||||||||||
| Plus Year over Year Change in Fair Value as of the Vesting Date of Equity Awards Granted in Prior Years that Vested During the Covered Year | 541,801 | 43,931 | (59,194 | ) | (322,582 | ) | ||||||||||||||||||||||||||
| Minus Fair Value at the End of the Prior Year of Equity Awards that Failed to Meet Vesting Conditions in the Covered Year | (196,337 | ) | ||||||||||||||||||||||||||||||
| Plus Value of Dividends or other Earnings Paid on Stock or Option Awards Not Otherwise Reflected in Fair Value or Total Compensation for the Covered Year | ||||||||||||||||||||||||||||||||
| Compensation Actually Paid | $ | 3,975,708 | $ | 537,444 | $ | 989,452 | $ | 8,995 | $ | 160,579 | ||||||||||||||||||||||
| (1) | Unvested equity values are computed in accordance with the methodology used for financial reporting purposes, and for unvested awards subject to performance-based vesting conditions, based on the probable outcome of such performance-based vesting conditions as of the last day of the year. |
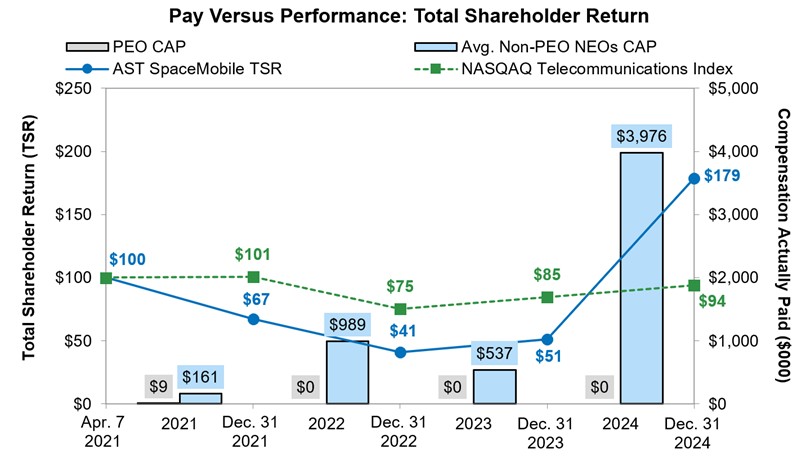
Relationship Between CAP and TSR
The graph below reflects the relationship between the PEO and Average Non-PEO NEOs CAP and our TSR.
Relationship Between CAP and Net Income (Loss) Attributable to Stockholders
The graph below reflects the relationship between the PEO and Average Non-PEO NEOs CAP and our net income (loss) attributable to stockholders.
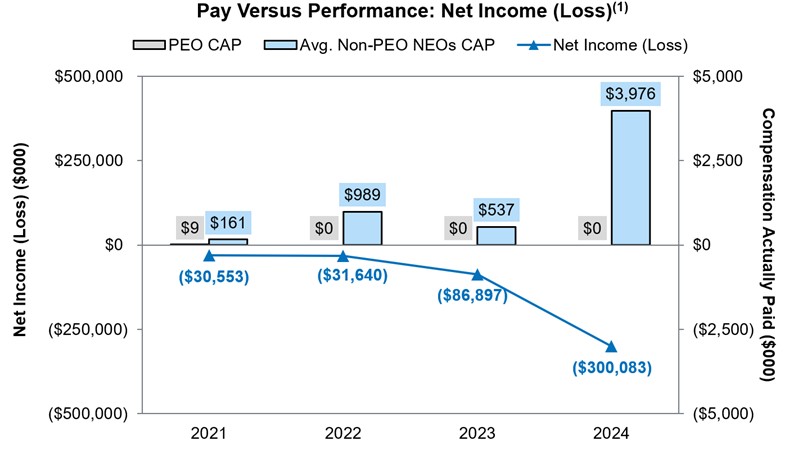
| (1) | Represents the amount of net loss attributable to common stockholders reflected in the Company’s audited financial statements for the applicable year. |
| [1] | Abel Avellan served as the PEO for the entirety of 2024, 2023, 2022, and 2021. Our Non-PEO NEOs for the applicable years were as follows: |
| [2] | Amounts reported in these columns represent (i) the total compensation reported in the Summary Compensation Table (“SCT”) for the applicable year in the case of our PEO, Mr. Avellan, and (ii) the average of the total compensation reported in the SCT for the applicable year for our Non-PEO NEOs reported for the applicable year. |
| [3] | Amounts reported in these columns represent compensation actually paid; adjustments were made to the amounts reported in the SCT for the applicable year. |
| [4] | Total Shareholder Return (“TSR”) is cumulative for the measurement periods beginning on April 7, 2021 (the closing date of our Business Combination as defined in our Annual Report) and ending on December 31 of each of 2024, 2023, 2022 and 2021, respectively, calculated in accordance with Item 201(e) of Regulation S-K. |
| [5] | Peer Group reflects the Nasdaq Telecommunications Index, which is the same industry peer group used in the stock performance graph required by Item 201(e) of Regulation S-K and included in our Annual Report. |
| [6] | The dollar amounts reported represent the amount of net income (loss) attributable to common stockholders reflected in our audited Consolidated Financial Statements included in our Annual Report. |
| [7] | Consistent with SEC guidance, no Company Selected Measure is shown in the table above because AST SpaceMobile does not use any financial performance measure to link 2024 compensation of its PEO or non-PEO NEOs. |
| [8] | Unvested equity values are computed in accordance with the methodology used for financial reporting purposes, and for unvested awards subject to performance-based vesting conditions, based on the probable outcome of such performance-based vesting conditions as of the last day of the year. |