Pay vs Performance Disclosure
Dec. 31, 2024
USD ($)
Dec. 31, 2023
USD ($)
Dec. 31, 2022
USD ($)
Dec. 31, 2021
USD ($)
Dec. 31, 2020
USD ($)
Value of Initial Fixed $100 Investment Based On: | ||||||||||||||||||||||||||||||||
Year(1) | Summary Compensation Table Total for PEO ($) (1,2) | Summary Compensation Table Total for PEO ($) (1,3) | Compensation Actually Paid to PEO ($) (1,2 ) | Compensation Actually Paid to PEO ($) (1,3) | Average Summary Compensation Table Total for Non-PEO NEO ($) (1) | Average Compensation Actually Paid to Non-PEO NEO ($) (1) | Total Shareholder Return ($)(4) | Peer Group Total Shareholder Return ($)(5) | Net Income Attributable to Common Stockholders (In thousands) ($) (6) | Normalized FFO per diluted share ($) (7) | ||||||||||||||||||||||
| 2024 | 20,200,824 | — | 106,628,885 | — | 5,767,430 | 30,904,176 | 180.71 | 114.71 | 951,680 | 4.32 | ||||||||||||||||||||||
| 2023 | 17,250,363 | — | 40,809,501 | — | 5,038,923 | 10,743,501 | 126.31 | 113.36 | 340,094 | 3.64 | ||||||||||||||||||||||
| 2022 | 14,317,407 | — | 5,970,149 | — | 4,121,683 | 2,497,577 | 89.10 | 99.68 | 141,214 | 3.35 | ||||||||||||||||||||||
| 2021 | 12,787,358 | — | 22,858,790 | — | 3,096,543 | 4,768,476 | 113.03 | 131.78 | 336,138 | 3.21 | ||||||||||||||||||||||
| 2020 | 9,557,434 | 14,589,584 | 5,290,290 | (7,391,356) | 2,590,052 | 1,401,426 | 82.51 | 92.00 | 978,844 | 3.56 | ||||||||||||||||||||||
| Year | PEO | Non-PEO NEOS | ||||||
| 2024 | Shankh Mitra | Timothy G. McHugh, John F. Burkart, Matthew G. McQueen, and Nikhil Chaudhri | ||||||
| 2021-2023 | Shankh Mitra | Timothy G. McHugh, John F. Burkart, Matthew G. McQueen, and Ayesha Menon | ||||||
| 2020 | Thomas J. DeRosa and Shankh Mitra | Timothy G. McHugh, Matthew G. McQueen, and Ayesha Menon | ||||||
| Shankh Mitra, CEO | 2024 | 2023 | 2022 | 2021 | 2020 | ||||||||||||
| SCT Total | $ | 20,200,824 | $ | 17,250,363 | $ | 14,317,407 | $ | 12,787,358 | $ | 9,557,434 | |||||||
| Less: Fair Value of Awards Reported in the SCT | (13,532,489) | (11,653,191) | (10,454,249) | (7,500,075) | (6,528,373) | ||||||||||||
| Plus: Fair Value of Awards Granted in Year and Outstanding and Unvested at Year-End | 30,189,488 | 19,380,298 | 7,822,060 | 14,018,154 | 4,703,812 | ||||||||||||
| Plus: Change in Fair Value from Prior Year-End to Current Year-End of Awards Granted Prior to Year that were Outstanding and Unvested as of Year-End | 59,995,952 | 11,237,147 | (5,103,585) | 2,964,149 | (1,337,571) | ||||||||||||
| Plus: Change in Fair Value from Prior Year-End to Vesting Date of Awards Granted Prior to Year that Vested During Year | 9,775,110 | 4,594,884 | (611,484) | 589,204 | (1,105,012) | ||||||||||||
| Total Compensation Actually Paid | $ | 106,628,885 | $ | 40,809,501 | $ | 5,970,149 | $ | 22,858,790 | $ | 5,290,290 | |||||||
| Thomas J. DeRosa, Former CEO | 2024 | 2023 | 2022 | 2021 | 2020 | ||||||||||||
| SCT Total | $ | 14,589,584 | |||||||||||||||
| Less: Fair Value of Awards Reported in the SCT | (10,501,359) | ||||||||||||||||
| Plus: Fair Value of Awards Granted in Year and Outstanding and Unvested at Year-End | — | ||||||||||||||||
| Plus: Change in Fair Value from Prior Year-End to Current Year-End of Awards Granted Prior to Year that were Outstanding and Unvested as of Year-End | — | ||||||||||||||||
| Plus: Value of Awards Granted and Vested in the Year | 2,533,763 | ||||||||||||||||
| Plus: Change in Fair Value from Prior Year-End to Vesting Date of Awards Granted Prior to Year that Vested During Year | (14,013,344) | ||||||||||||||||
| Total Compensation Actually Paid | $ | (7,391,356) | |||||||||||||||
| Average of Other NEOs | 2024 | 2023 | 2022 | 2021 | 2020 | ||||||||||||
| SCT Total | $ | 5,767,430 | $ | 5,038,923 | $ | 4,121,683 | $ | 3,096,543 | $ | 2,590,052 | |||||||
| Less: Fair Value of Awards Reported in the SCT | (3,239,296) | (3,047,939) | (2,634,005) | (1,475,967) | (1,365,328) | ||||||||||||
| Plus: Fair Value of Awards Granted in Year and Outstanding and Unvested at Year-End | 8,149,325 | 5,046,550 | 2,018,683 | 2,563,124 | 846,041 | ||||||||||||
| Plus: Change in Fair Value from Prior Year-End to Current Year-End of Awards Granted Prior to Year that were Outstanding and Unvested as of Year-End | 17,904,140 | 2,819,526 | (930,824) | 427,784 | (498,132) | ||||||||||||
| Plus: Change in Fair Value from Prior Year-End to Vesting Date of Awards Granted Prior to Year that Vested During Year | 2,322,577 | 886,441 | (77,960) | 156,992 | (171,207) | ||||||||||||
| Total Average Compensation Actually Paid | $ | 30,904,176 | $ | 10,743,501 | $ | 2,497,577 | $ | 4,768,476 | $ | 1,401,426 | |||||||
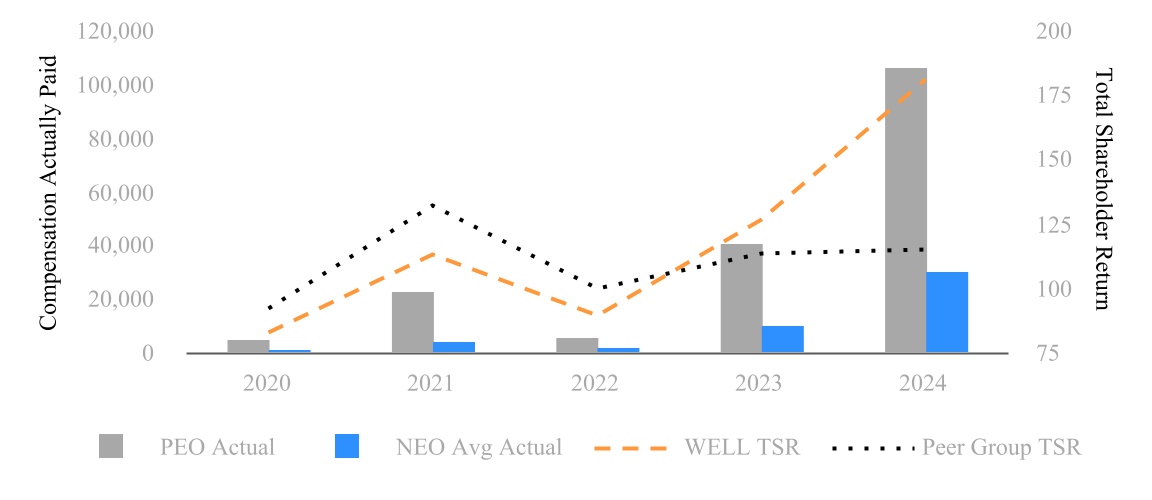
The NEOs’ pay, particularly the PEO’s, closely tracks with our TSR since, in any year, generally more than 70 percent of the NEOs’ compensation is comprised of equity awards. The chart below shows Mr. Mitra’s and the average of our other NEOs’ pay compared to our annual TSR performance and the Peer Group’s TSR performance (in thousands, except TSR data):
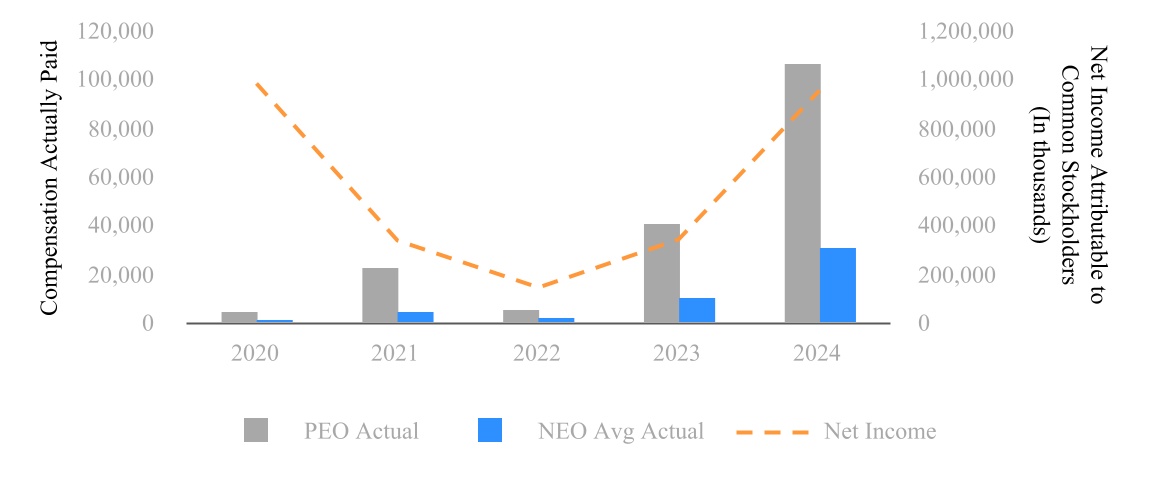
The chart below shows Mr. Mitra’s and the average of our other NEOs’ average pay compared to our net income attributable to common stockholders (in thousands):
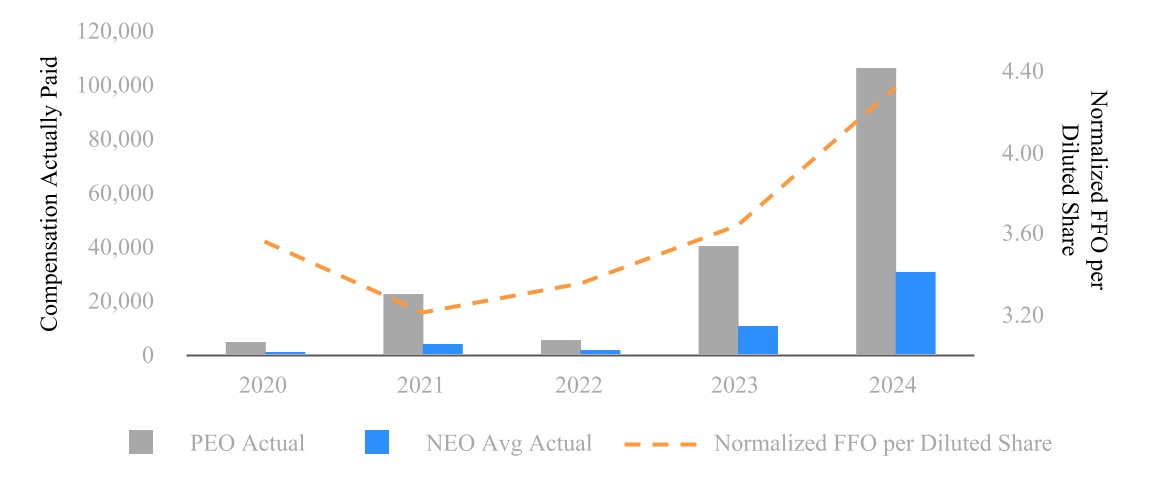
The chart below shows Mr. Mitra’s and the average of our other NEOs’ pay compared to our normalized FFO per diluted share performance (in thousands, except per share data):
The NEOs’ pay, particularly the PEO’s, closely tracks with our TSR since, in any year, generally more than 70 percent of the NEOs’ compensation is comprised of equity awards. The chart below shows Mr. Mitra’s and the average of our other NEOs’ pay compared to our annual TSR performance and the Peer Group’s TSR performance (in thousands, except TSR data):
The following table lists the most important financial performance measures used to link compensation actually paid to our NEOs to company performance.
| Important Financial Performance Measures | ||
| Relative Total Shareholder Return | ||
| Normalized FFO per Diluted Share | ||
| Adjusted Fixed Charge Coverage | ||
| General and Administrative Expense Controls | ||
| (Net Debt + Preferred) / Annualized Adjusted EBITDA | ||