Pay vs Performance Disclosure
|
12 Months Ended |
|
Dec. 31, 2024
USD ($)
|
Dec. 31, 2023
USD ($)
|
Dec. 31, 2022
USD ($)
|
Dec. 31, 2021
USD ($)
|
Dec. 31, 2020
USD ($)
|
| Pay vs Performance Disclosure |
|
|
|
|
|
| Pay vs Performance Disclosure, Table |
| | | | | | | | | | Summary Compensation Table Total for PEO ($)(1) | Compensation Actually Paid to PEO ($) | Average Summary Compensation Table Total for Non-PEO NEOs ($)(2) | Average Compensation Actually Paid to Non-PEO NEOs ($) | Value of Initial Fixed $100 Investment(3) Based on: | | Adjusted Operating ROE (%)(6) | | | Total Shareholder Return ($)(4) | Peer Group Total Shareholder Return ($)(5) | | | | | | | | | | | | | | | | | | | | | | | | | | | | | | | | | | | | | | | | | | | | | |
|
|
|
|
|
| Company Selected Measure Name |
Adjusted Net Operating Income ROE
|
|
|
|
|
| Named Executive Officers, Footnote |
Juan C. Andrade served as the Principal Executive Officer (“PEO”) of Everest for all applicable years in this table.The non-PEO NEOs include: (a) for 2020, John Doucette, Craig Howie, Mark Kociancic, Sanjoy Mukherjee and Jonathon Zaffino; (b) for 2021, John Doucette, Mike Karmilowicz, Mark Kociancic, Sanjoy Mukherjee and Jim Williamson; (c) for 2022, Mike Karmilowicz, Mark Kociancic, Sanjoy Mukherjee and Jim Williamson; (d) for 2023, Mike Karmilowicz, Mark Kociancic, Sanjoy Mukherjee, Gail Van Beveren and Jim Williamson; and (e) for 2024, Mike Karmilowicz, Mark Kociancic, Jim Williamson and Ricardo Anzaldua.
|
|
|
|
|
| Peer Group Issuers, Footnote |
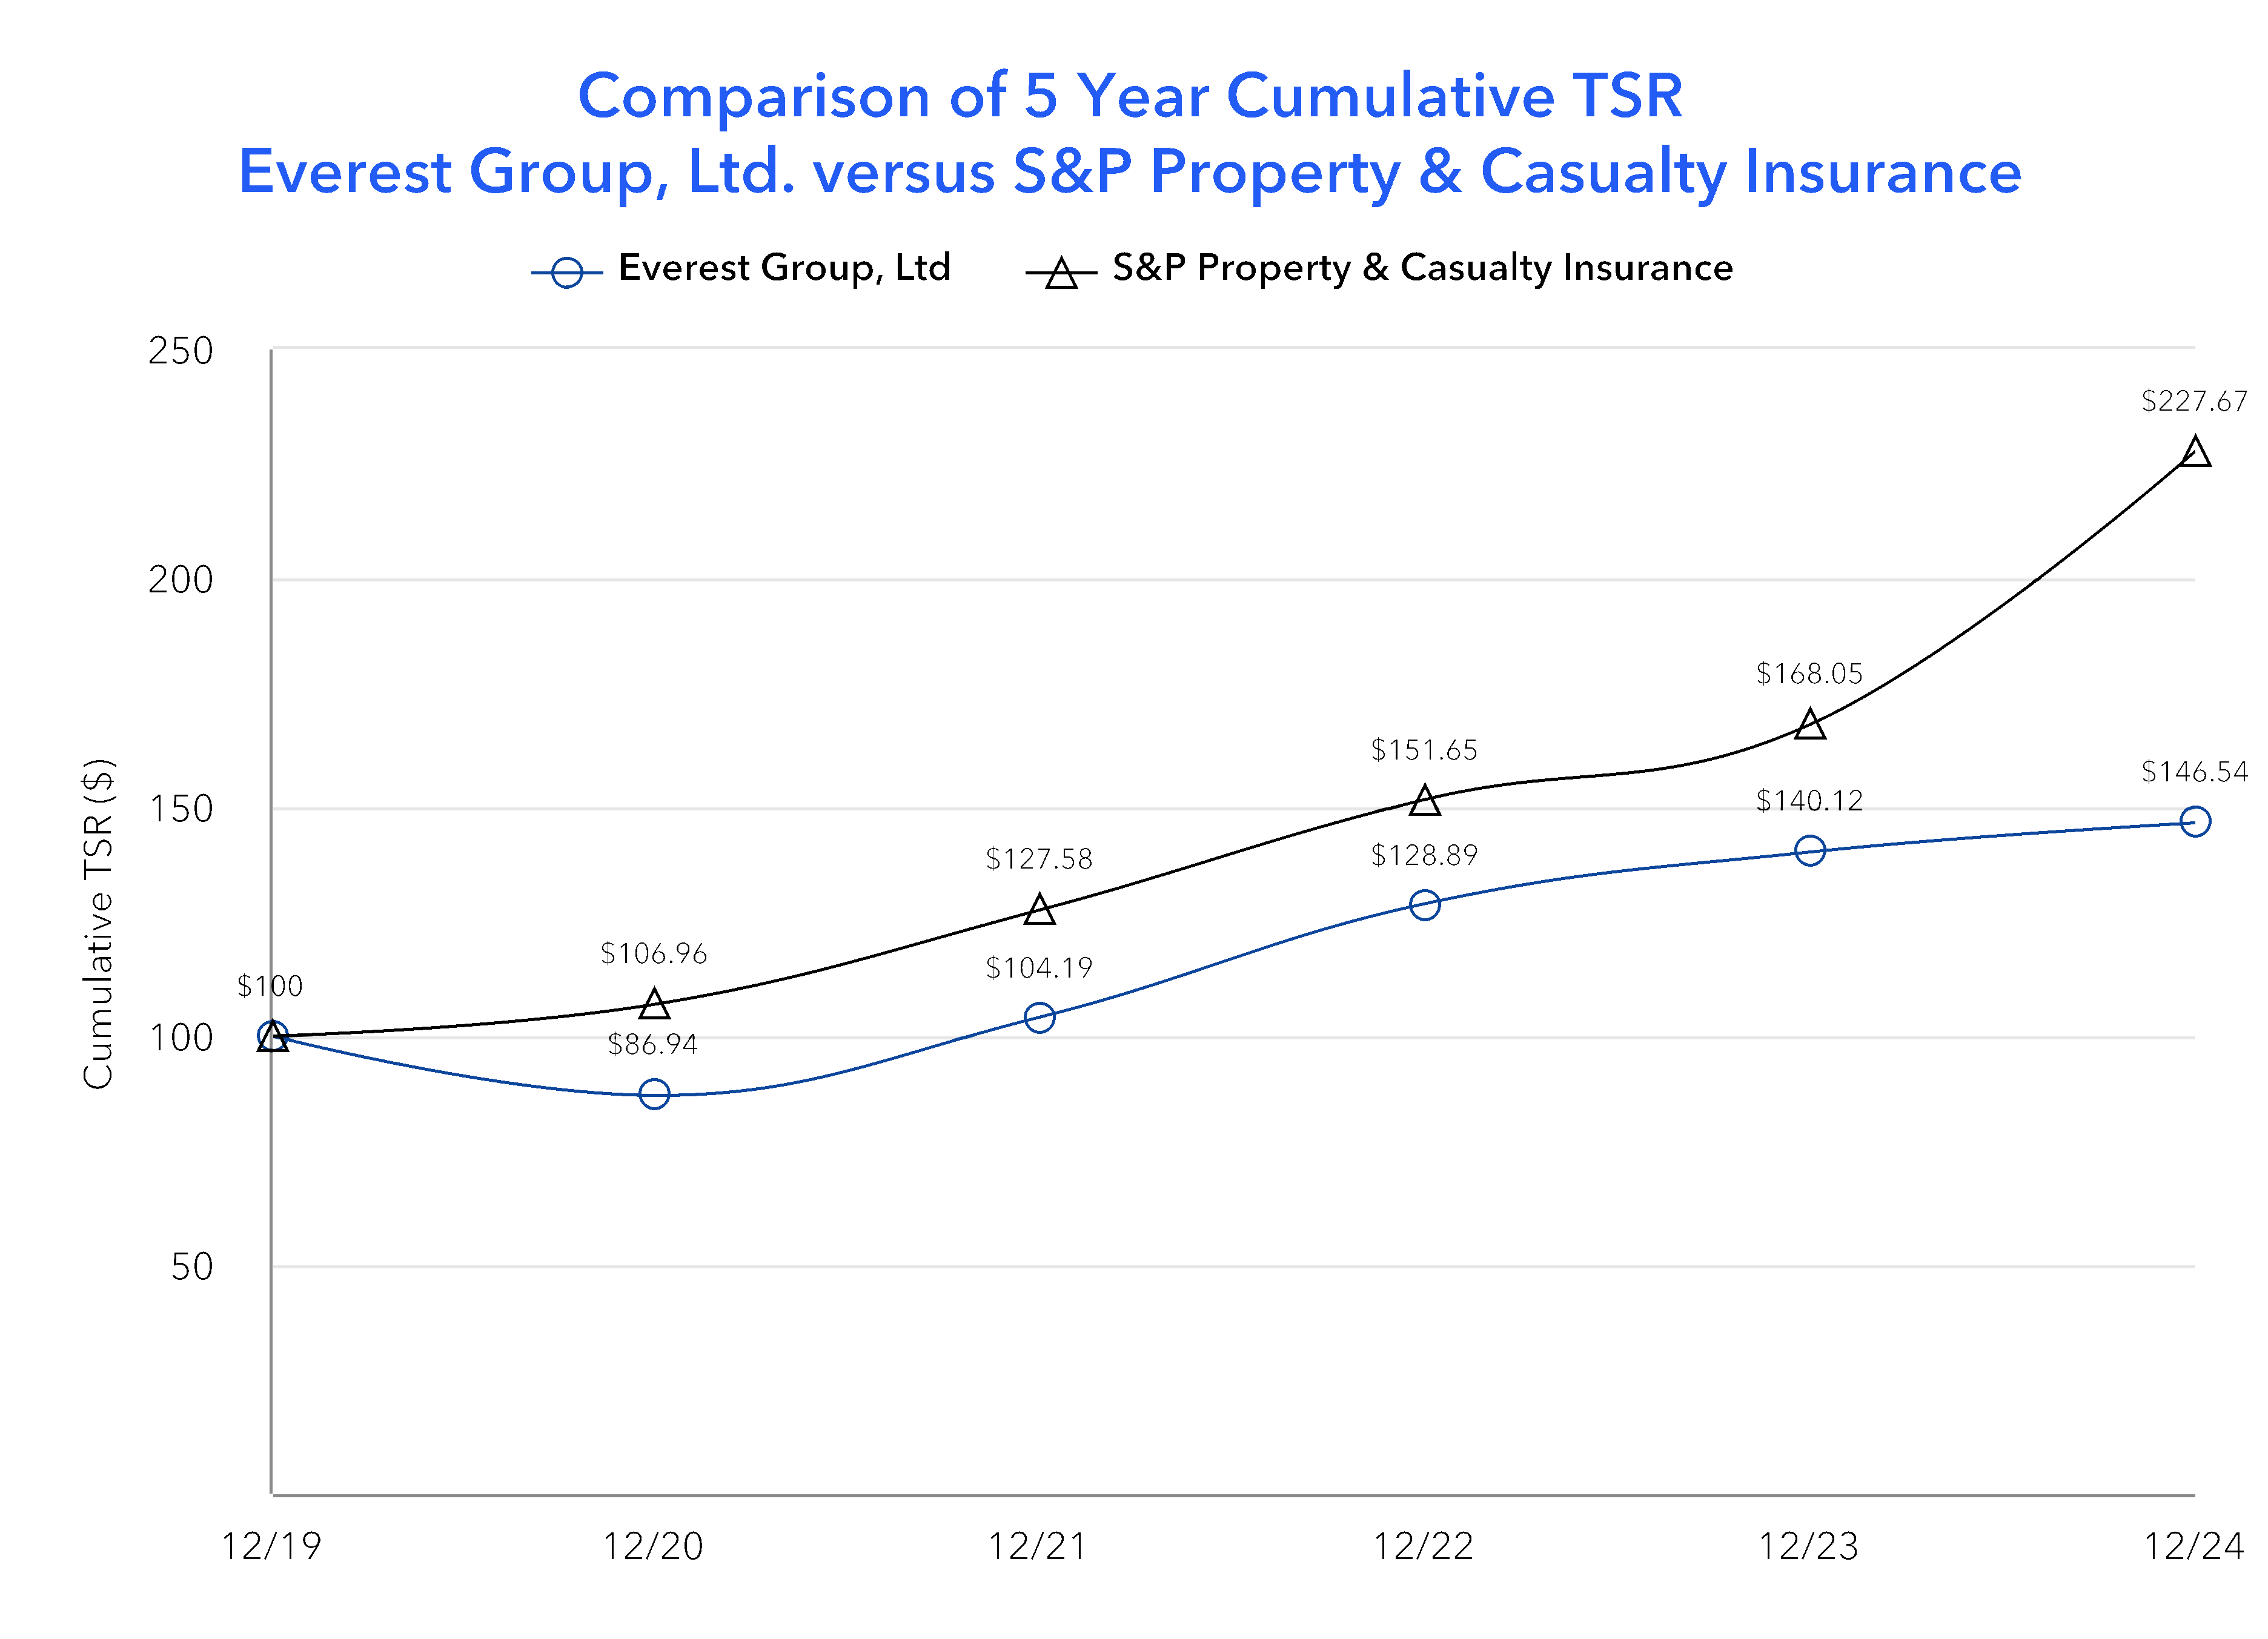
The S&P Insurance (Property and Casualty) is used as Everest’s peer group for purposes of this pay versus performance table.
|
|
|
|
|
| PEO Total Compensation Amount |
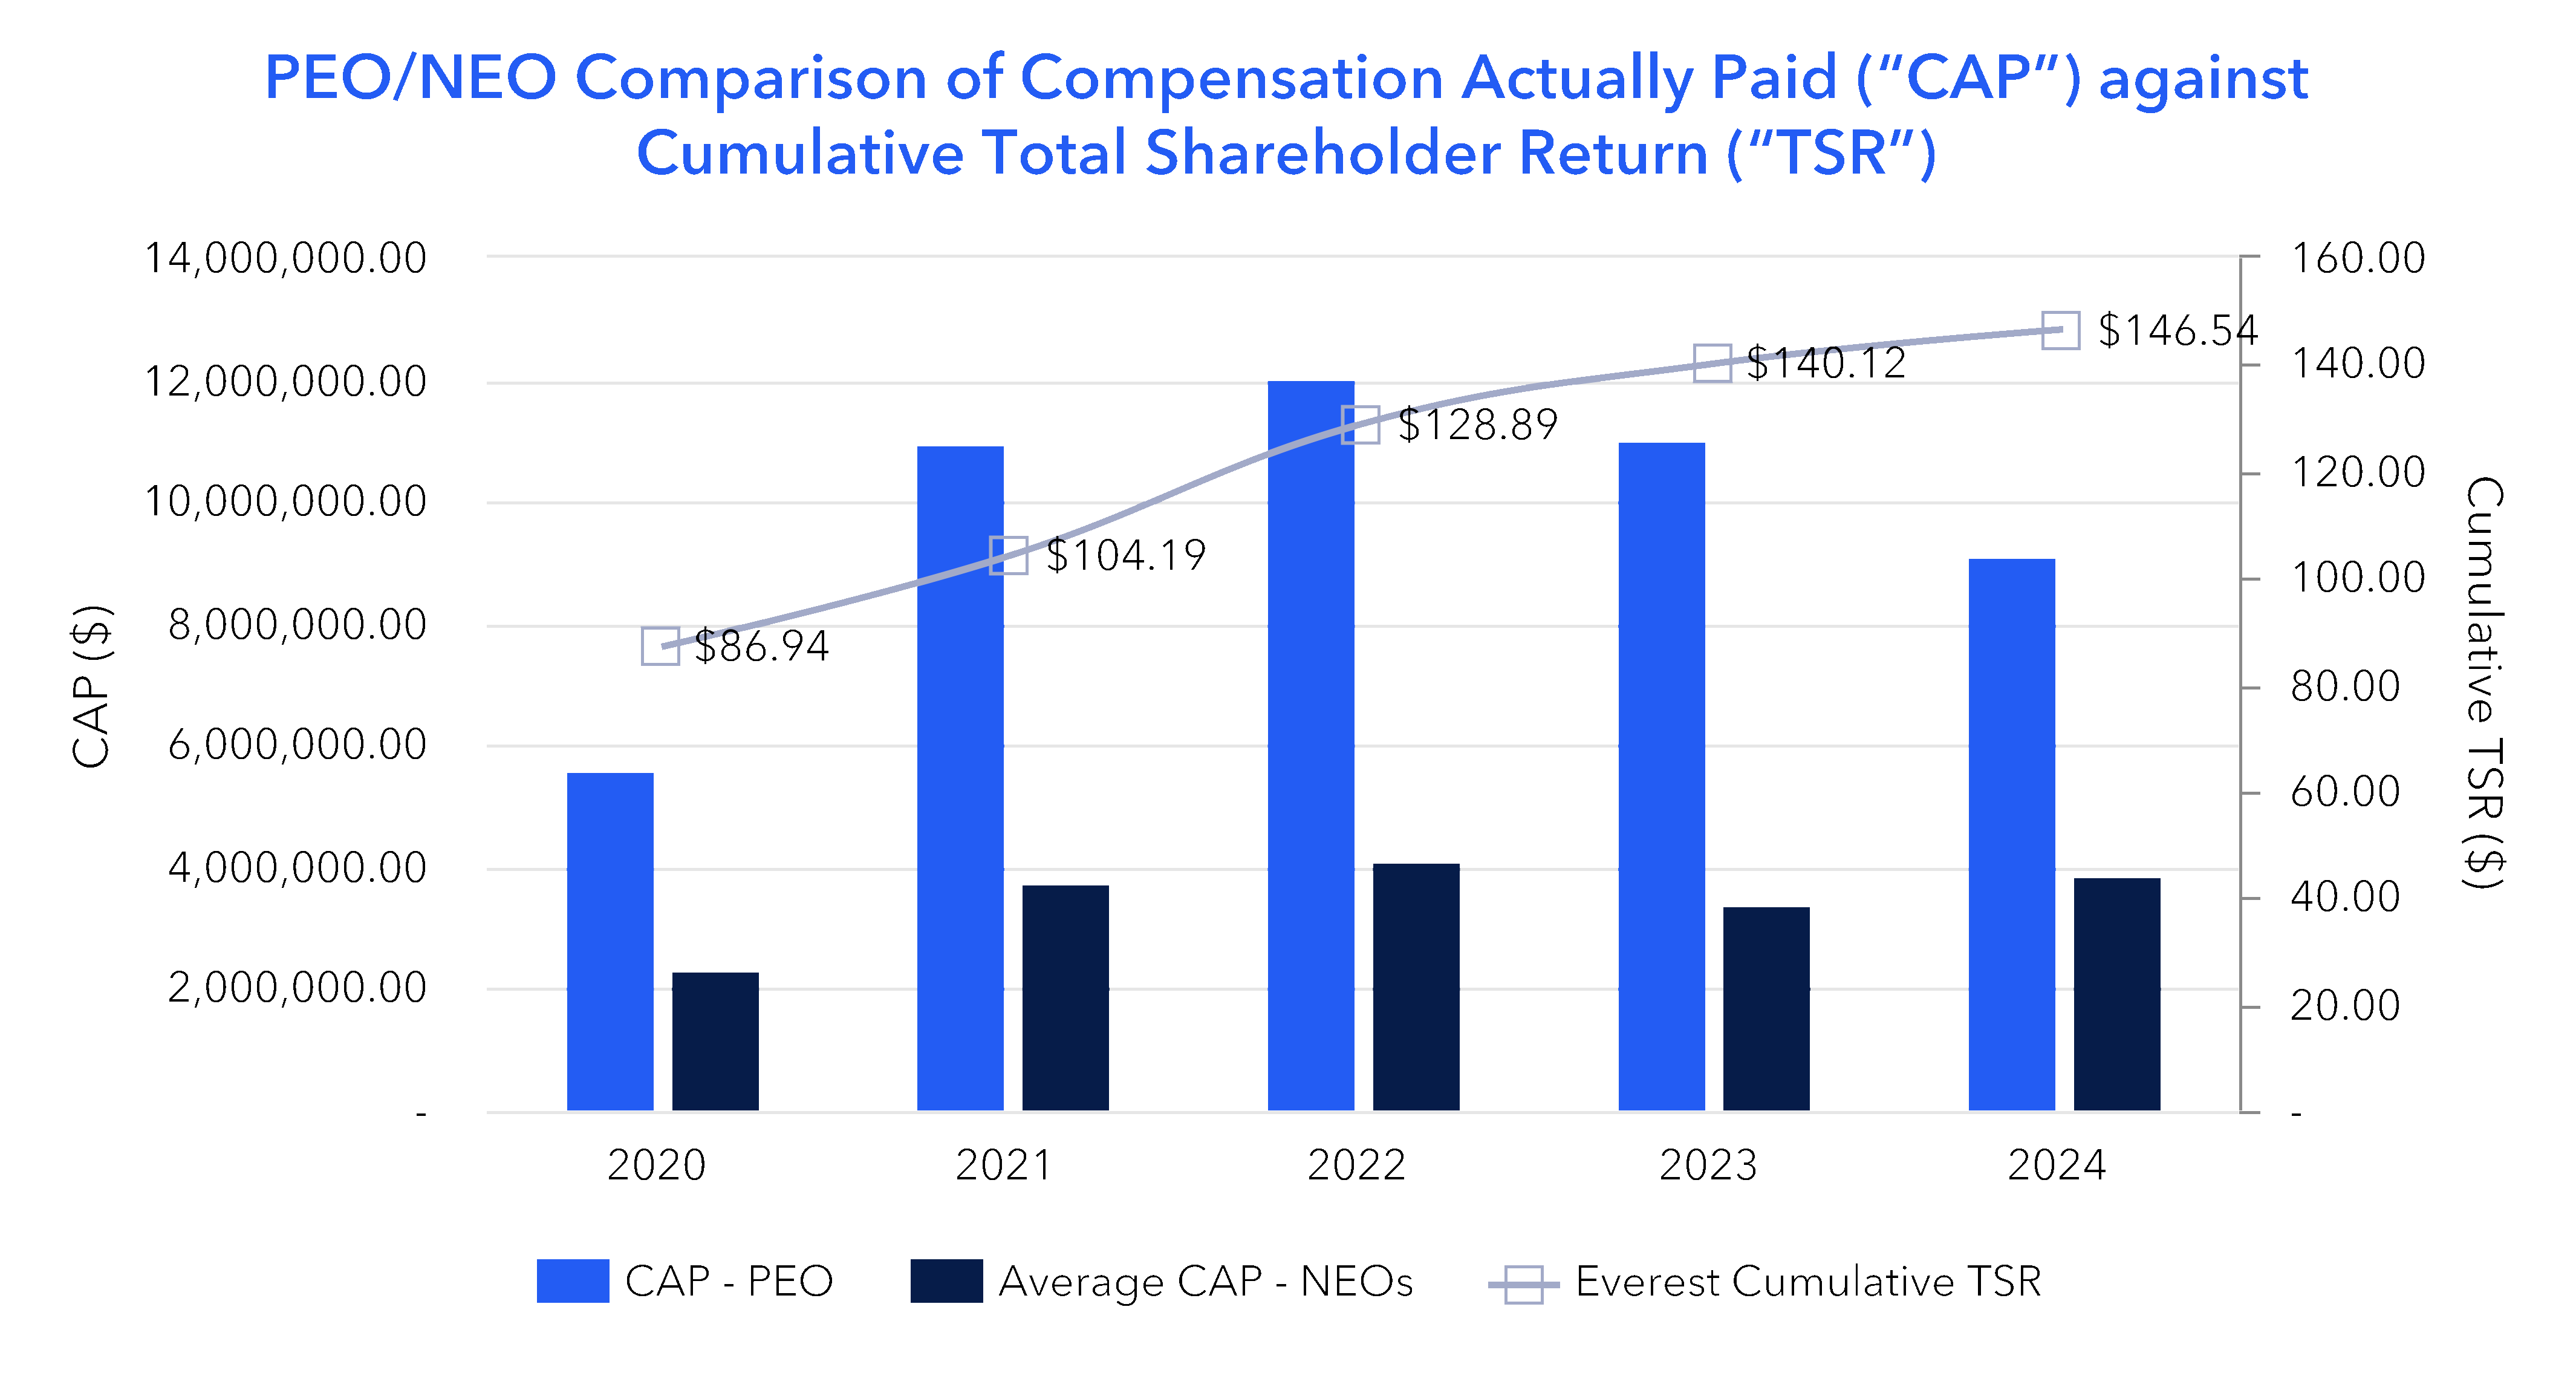
$ 7,939,305
|
$ 9,909,531
|
$ 9,106,199
|
$ 8,866,126
|
$ 8,063,212
|
| PEO Actually Paid Compensation Amount |
$ 9,092,751
|
11,044,080
|
12,022,512
|
10,939,500
|
5,604,559
|
| Adjustment To PEO Compensation, Footnote |
The following table details the adjustment to the SCT Total Pay for our PEO to determine the CAP as computed in accordance with Item 402(v) of SEC Regulation S-K (17 C.F.R. § 229.402(v), or “Item 402(v)”). Amounts do not reflect actual compensation earned by or paid to our NEOs during the applicable year. The PEO did not participate in any defined benefit pension plan. PEO SCT Total Pay to CAP Reconciliation | | | | | | | | | | | | | | | | | | – Grant Date Fair Value of Stock Awards Granted in Fiscal Year | | | | | | + Fair Value at Fiscal Year-End of Outstanding Unvested Stock Awards Granted in Fiscal Year | | | | | | ± Change in Fair Value of Outstanding Unvested Stock Awards Granted in Prior Fiscal Years(1) | | | | | | ± Change in Fair Value as of Vesting Date of Stock Awards Granted in Prior Fiscal Years for Which Applicable Vesting Conditions Were Satisfied During Fiscal Year(2) | | | | | | Compensation Actually Paid | | | | | |
|
|
|
|
|
| Non-PEO NEO Average Total Compensation Amount |
$ 3,673,476
|
3,126,187
|
3,275,300
|
3,185,203
|
3,209,042
|
| Non-PEO NEO Average Compensation Actually Paid Amount |
$ 3,850,216
|
3,394,495
|
4,098,150
|
3,763,485
|
2,323,534
|
| Adjustment to Non-PEO NEO Compensation Footnote |
The following table details the adjustment to the SCT Total Pay as the average for our other NEOs to determine “compensation actually paid” as computed in accordance with Item 402(v) for the other NEOs. Amounts do not reflect actual compensation earned by or paid to our NEOs during the applicable year. NEO Average SCT Total Pay to CAP Reconciliation | | | | | | | | | | | | | | | | | | – Grant Date Fair Value of Stock Awards Granted in Fiscal Year | | | | | | + Fair Value at Fiscal Year-End of Outstanding Unvested Stock Awards Granted in Fiscal Year | | | | | | ± Change in Fair Value of Outstanding Unvested Stock Awards Granted in Prior Fiscal Years(3) | | | | | | ± Change in Fair Value as of Vesting Date of Stock Awards Granted in Prior Fiscal Years for Which Applicable Vesting Conditions Were Satisfied During Fiscal Year(4) | | | | | | – Change in Actuarial Present Value of Accumulated Benefit Under Defined Benefit Pension Plan | | | | | | + Service cost and prior service cost | | | | | | Average Compensation Actually Paid | | | | | |
(1)Difference between Fair Value from End of Prior Year to End of Current Year (2)Difference between Fair Value from End of Prior Year to Vesting Date (3)Difference between Fair Value from End of Prior Year to End of Current Year (4)Difference between Fair Value from End of Prior Year to Vesting Date (5) In 2021, the change in actuarial present value was $(11,030) for John Doucette and $81,008 for Sanjoy Mukherjee. Under Item 402(v), the change in actuarial present value is deducted only if the value is positive. Thus, only Mr. Mukherjee’s value was incorporated into the calculation. (6)The change in actuarial present value for Mr. Mukherjee was $(600,167) in 2022. Under Item 402(v), the change in actuarial present value is deducted only if the value is positive. Thus, this value was not incorporated into the calculation.
|
|
|
|
|
| Compensation Actually Paid vs. Total Shareholder Return |
|
|
|
|
|
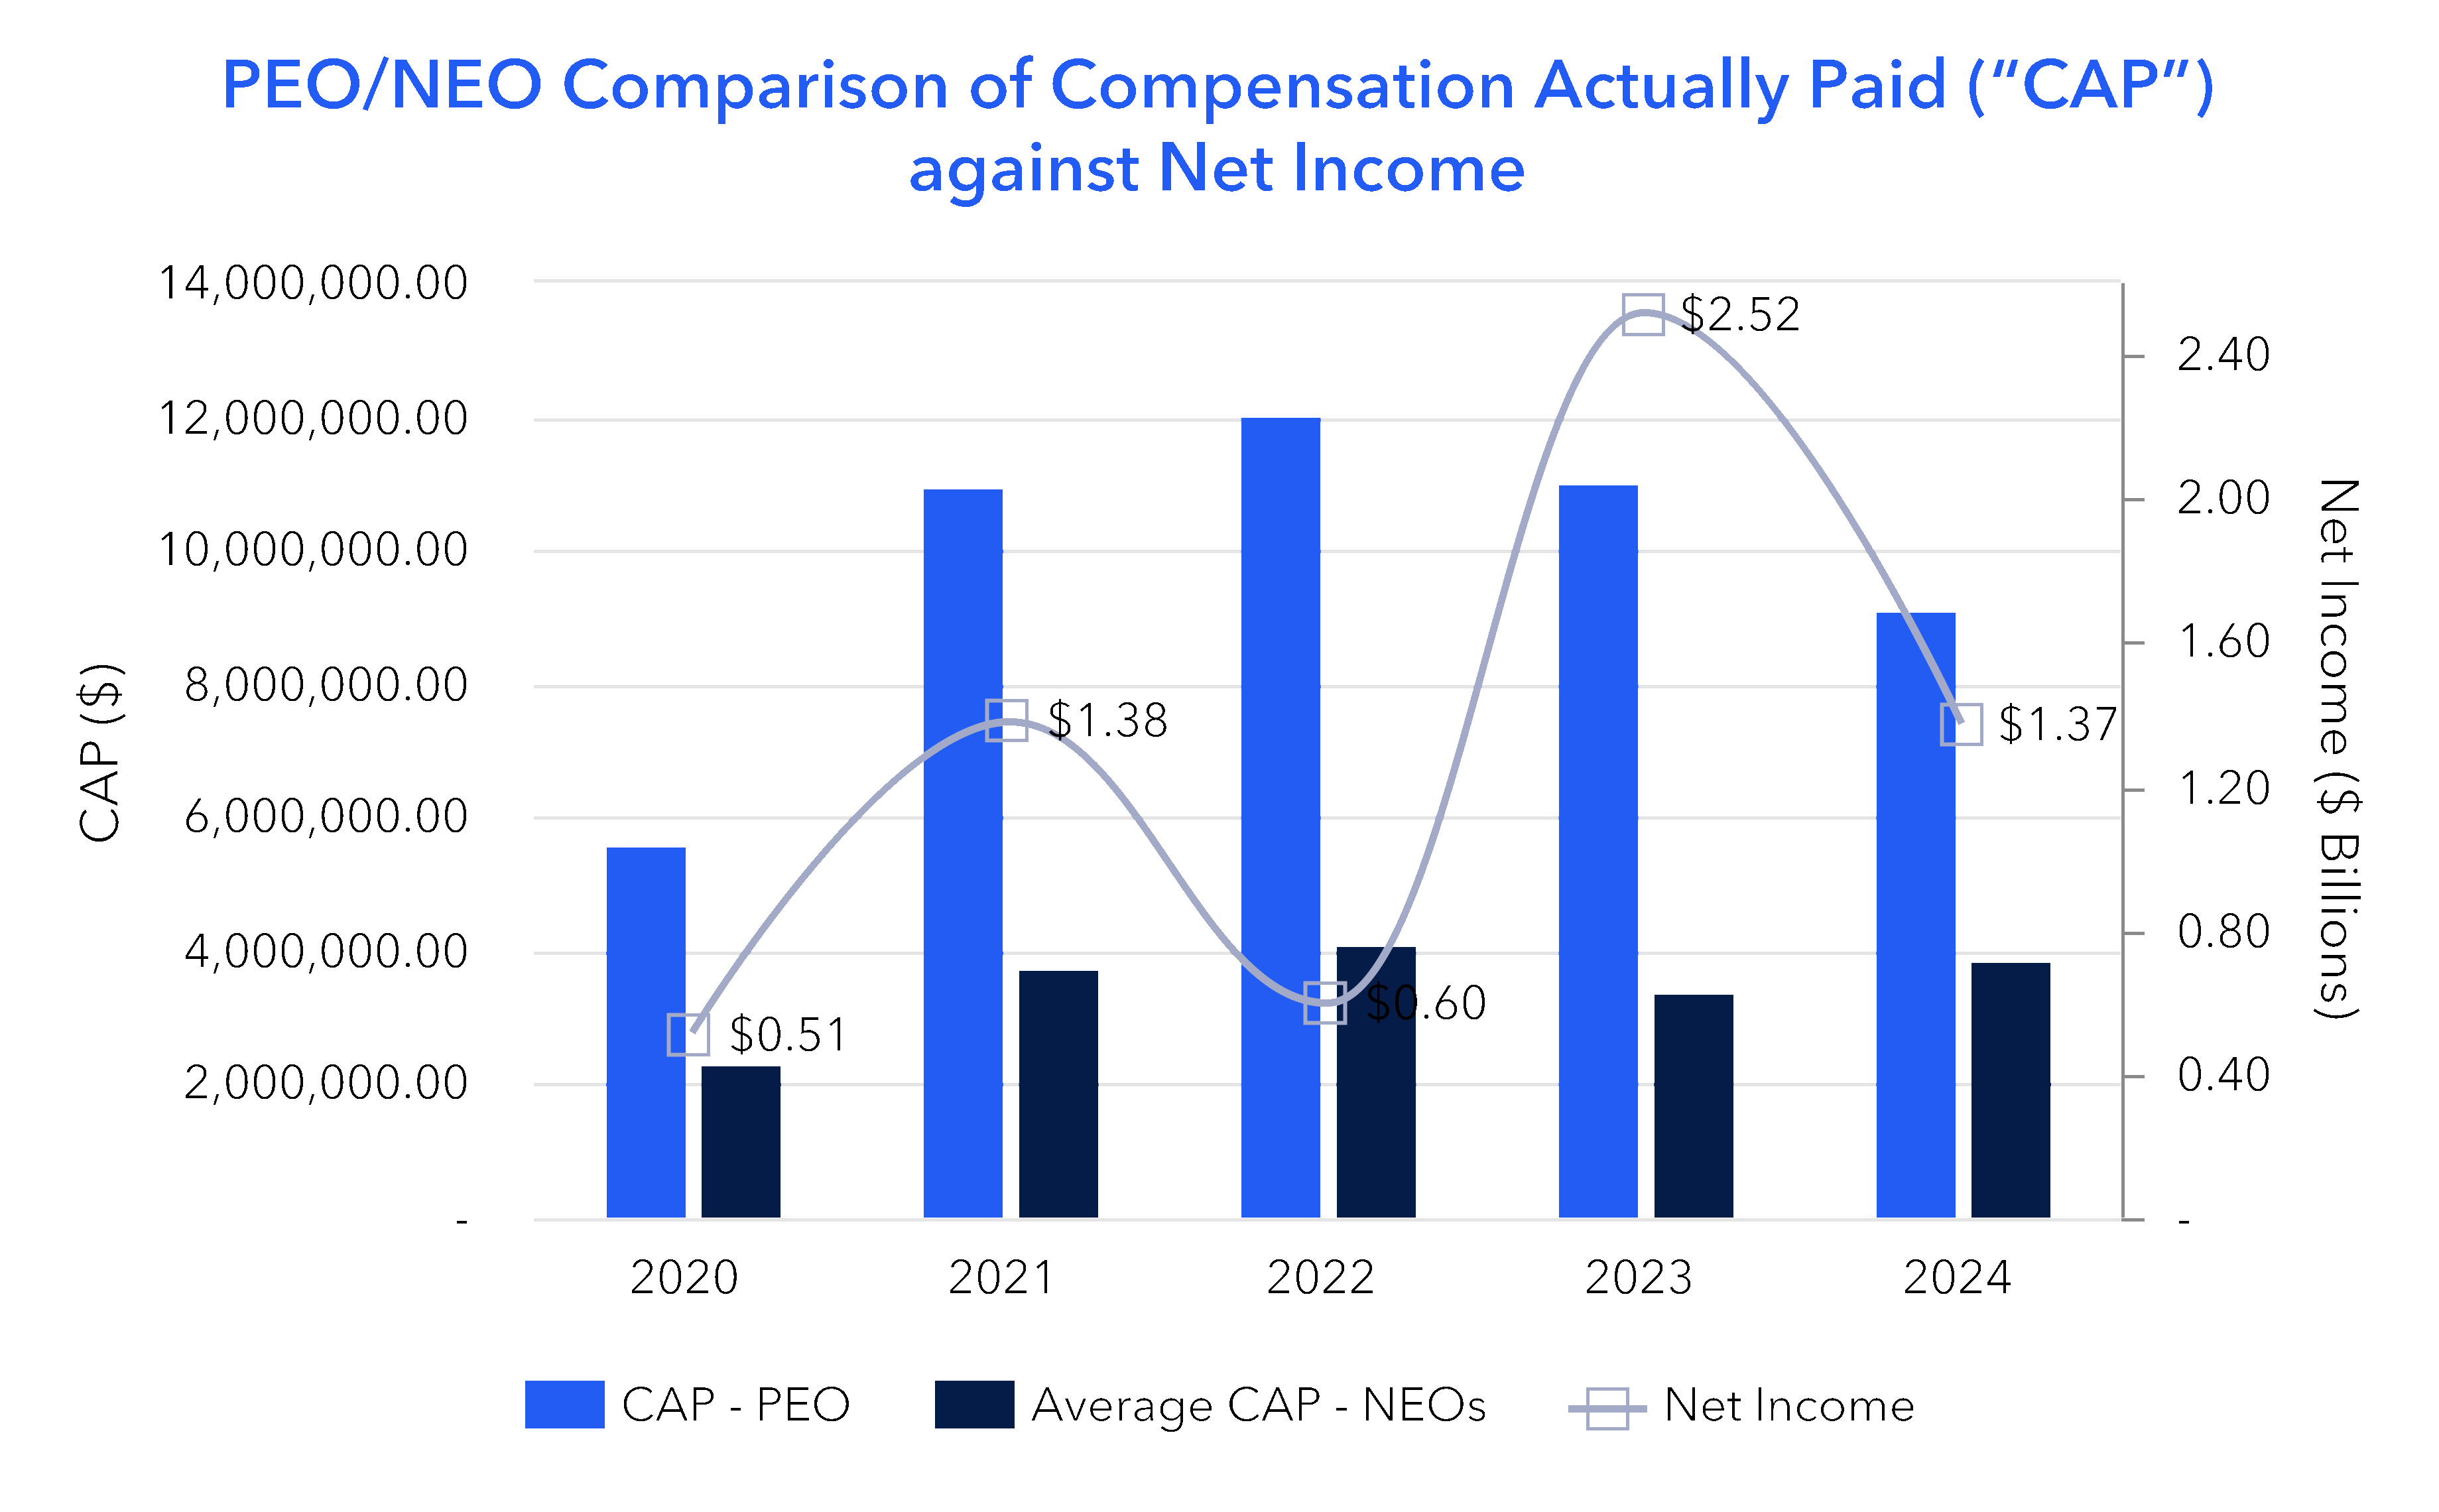
| Compensation Actually Paid vs. Net Income |
|
|
|
|
|
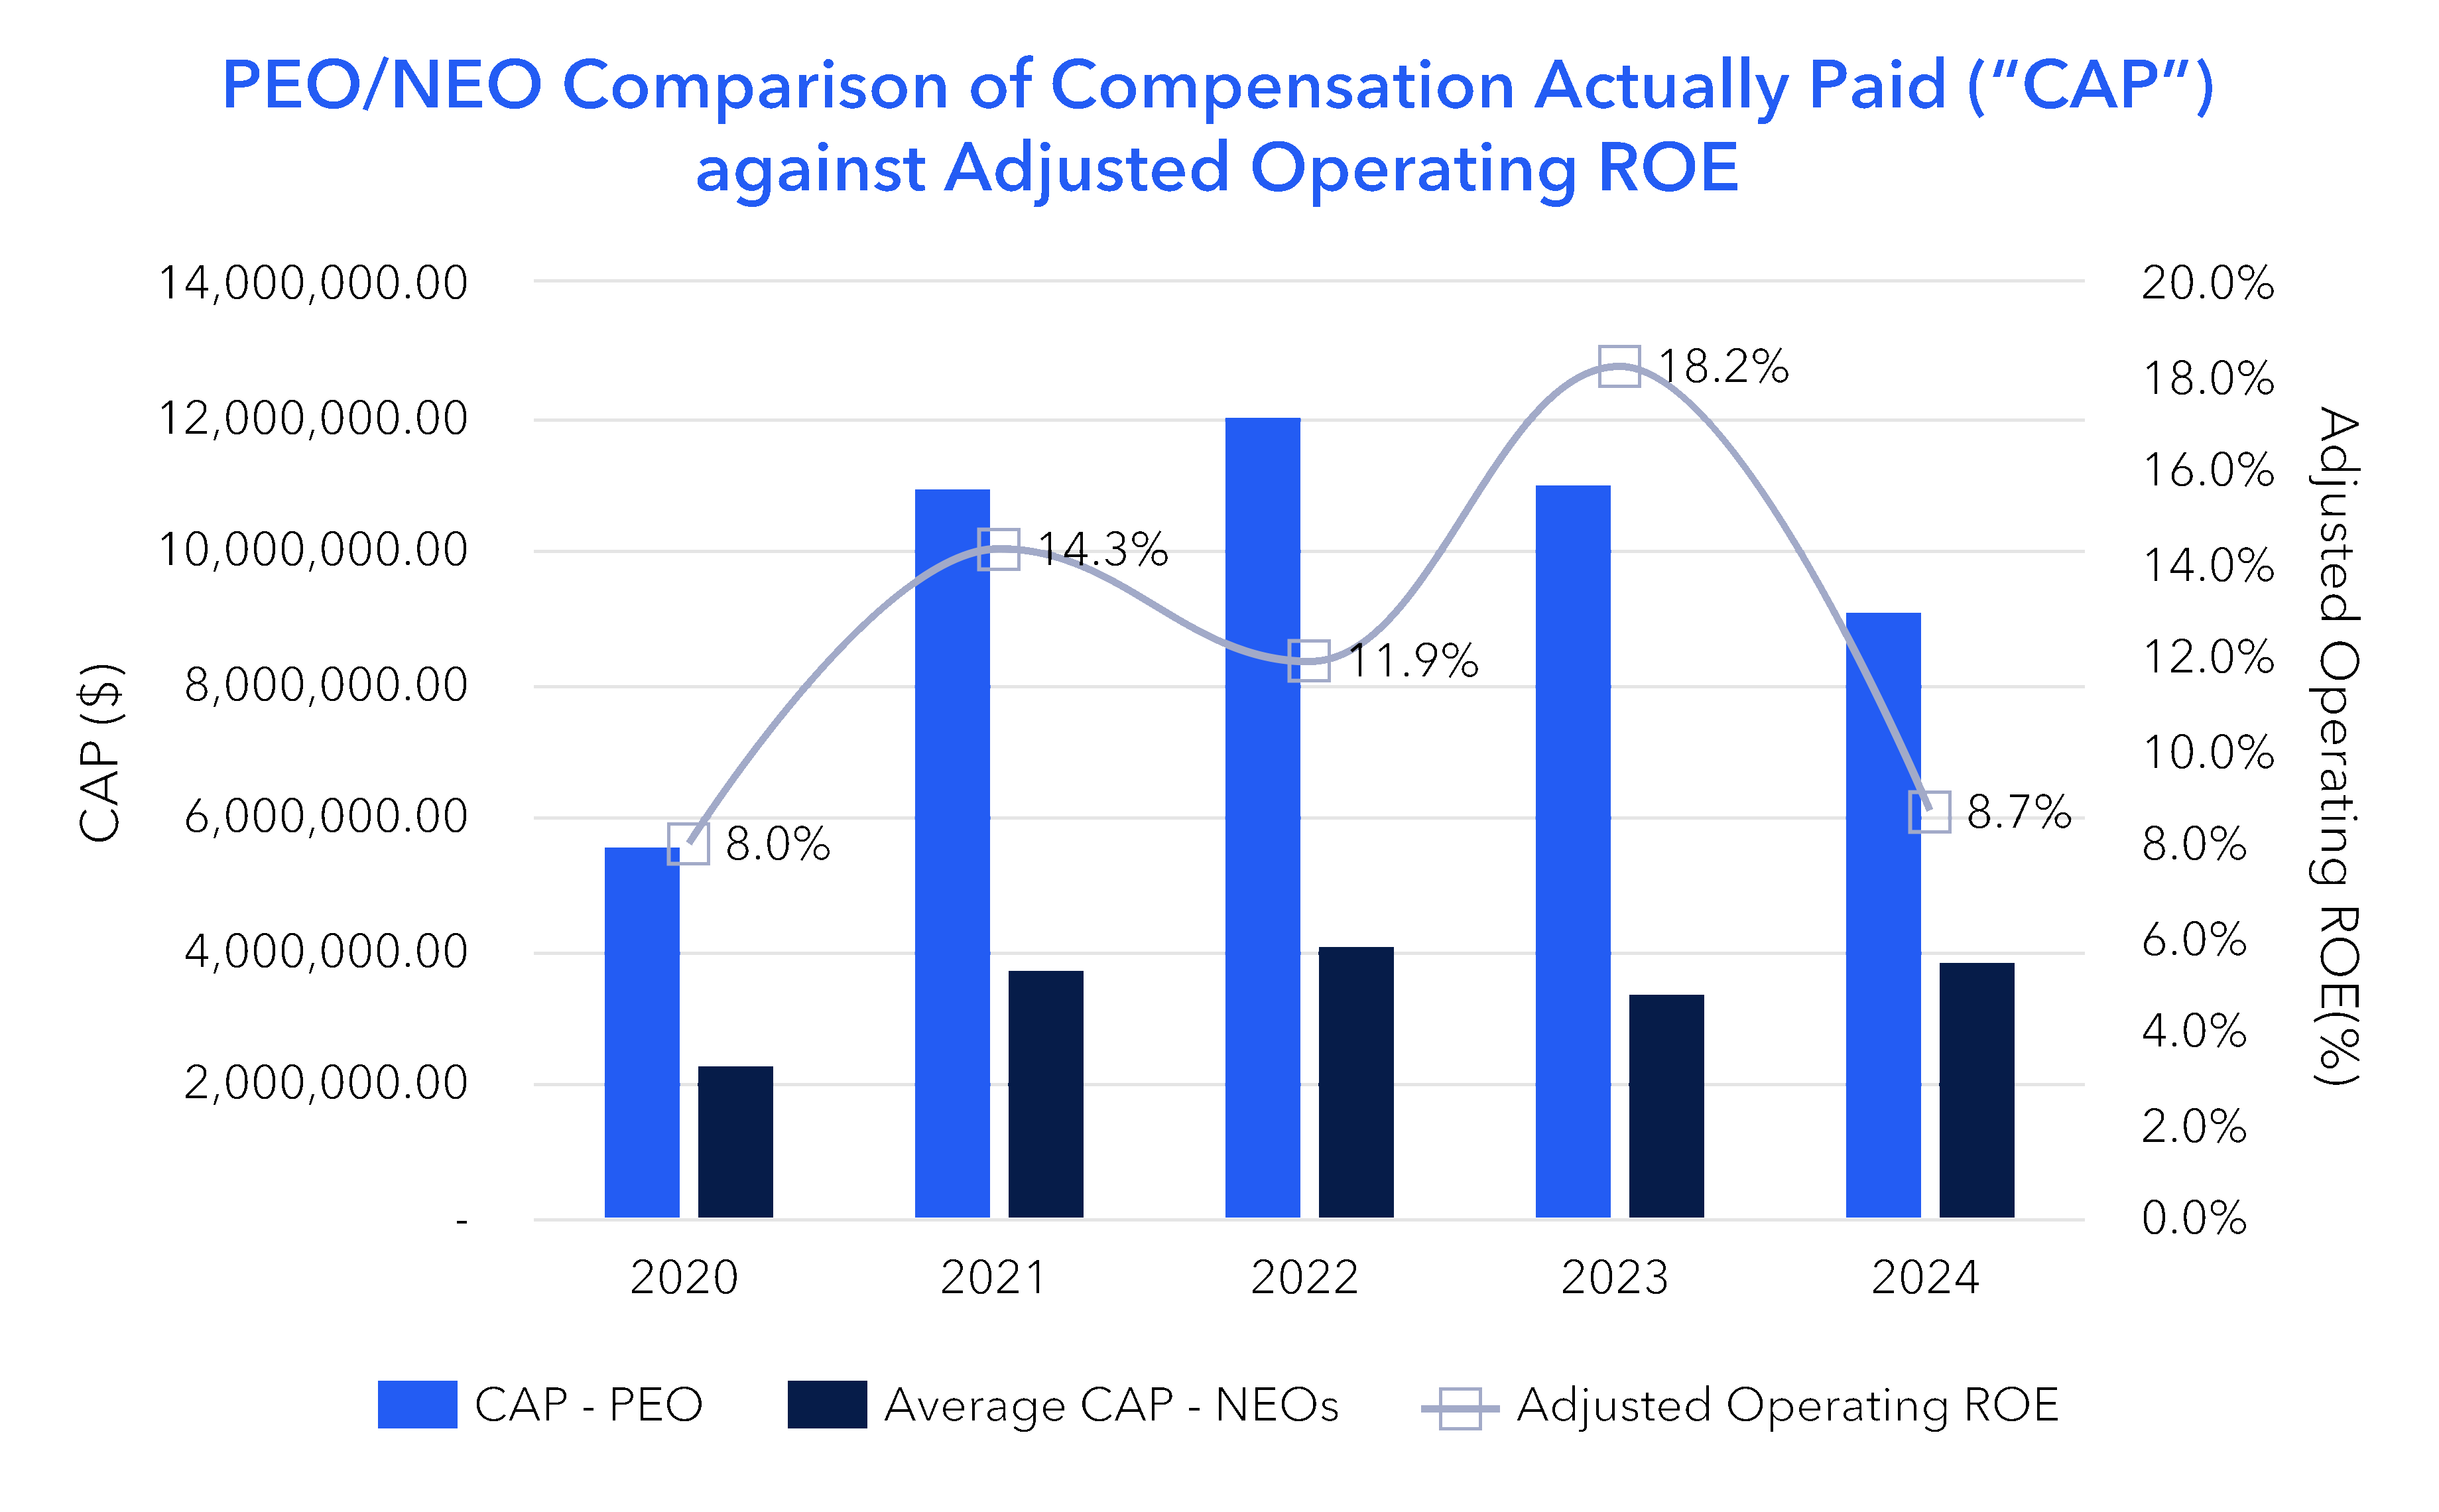
| Compensation Actually Paid vs. Company Selected Measure |
|
|
|
|
|
| Total Shareholder Return Vs Peer Group |
|
|
|
|
|
| Total Shareholder Return Amount |
$ 146.54
|
140.12
|
128.89
|
104.19
|
86.94
|
| Peer Group Total Shareholder Return Amount |
227.67
|
168.05
|
151.65
|
127.58
|
106.96
|
| Net Income (Loss) |
$ 1,373,000,000
|
$ 2,517,000,000
|
$ 597,000,000
|
$ 1,379,000,000
|
$ 514,000,000
|
| Company Selected Measure Amount |
0.087
|
0.182
|
0.119
|
0.143
|
0.080
|
| PEO Name |
Juan C. Andrade
|
|
|
|
|
| Additional 402(v) Disclosure |
Assumes $100 invested on 12/31/2019 in Everest Common Shares, including reinvestment of dividends. For purposes of this Pay Versus Performance table, “Total Shareholder Return” is defined as the change in the total dollar value of a given security or entire portfolio of securities, over a given period, assuming $100 dollars of initial investment. Total returns reflect changes in stock price as well as all distributions or dividends paid to shareholders. TSR in all other sections of this Proxy Statement is defined as annual growth in Book Value Per Share (excluding Unrealized Gains and Losses on Fixed Maturity investments) plus Dividends Per Share. Below is a list, not presented in order of importance, of the Company’s most important financial performance measures used to link the PEO’s and NEOs’ Item 402(v) “Compensation actually Paid” to Company performance for 2024. For further information regarding these financial performance measures and their function in our executive compensation program, please see the CD&A section above. For definitions and available reconciliations of Non-GAAP measures used below, please see Appendix A.
|
|
|
|
|
| Measure:: 1 |
|
|
|
|
|
| Pay vs Performance Disclosure |
|
|
|
|
|
| Name |
Adjusted Operating ROE
|
|
|
|
|
| Non-GAAP Measure Description |
Adjusted Net Operating Income ROE for 2023 and 2024 adjusts actual operating ROE by treating catastrophe losses as the sum of (1) 40% of anticipated catastrophe losses in the annual operating plan for the current fiscal year and (2) 60% of actual catastrophe losses for the current fiscal year. For 2021 and 2022, the ratio for determining Adjusted Operating ROE was 50% anticipated catastrophe losses in the operating plan and 50% actual catastrophe losses for the respective fiscal years.
|
|
|
|
|
| Measure:: 2 |
|
|
|
|
|
| Pay vs Performance Disclosure |
|
|
|
|
|
| Name |
Combined Ratio
|
|
|
|
|
| Measure:: 3 |
|
|
|
|
|
| Pay vs Performance Disclosure |
|
|
|
|
|
| Name |
TSR
|
|
|
|
|
| Measure:: 4 |
|
|
|
|
|
| Pay vs Performance Disclosure |
|
|
|
|
|
| Name |
Gross Written Premium Annual Growth Rate
|
|
|
|
|
| PEO | Aggregate Grant Date Fair Value of Equity Award Amounts Reported in Summary Compensation Table |
|
|
|
|
|
| Pay vs Performance Disclosure |
|
|
|
|
|
| Adjustment to Compensation, Amount |
$ (6,000,225)
|
$ (4,753,046)
|
$ (4,251,644)
|
$ (4,001,805)
|
$ (3,752,544)
|
| PEO | Year-end Fair Value of Equity Awards Granted in Covered Year that are Outstanding and Unvested |
|
|
|
|
|
| Pay vs Performance Disclosure |
|
|
|
|
|
| Adjustment to Compensation, Amount |
5,885,625
|
4,394,999
|
4,670,907
|
4,525,158
|
3,169,579
|
| PEO | Year-over-Year Change in Fair Value of Equity Awards Granted in Prior Years That are Outstanding and Unvested |
|
|
|
|
|
| Pay vs Performance Disclosure |
|
|
|
|
|
| Adjustment to Compensation, Amount |
240,870
|
809,630
|
2,354,332
|
1,402,574
|
(1,312,596)
|
| PEO | Change in Fair Value as of Vesting Date of Prior Year Equity Awards Vested in Covered Year |
|
|
|
|
|
| Pay vs Performance Disclosure |
|
|
|
|
|
| Adjustment to Compensation, Amount |
1,027,176
|
682,966
|
142,718
|
147,447
|
(563,092)
|
| Non-PEO NEO | Aggregate Change in Present Value of Accumulated Benefit for All Pension Plans Reported in Summary Compensation Table |
|
|
|
|
|
| Pay vs Performance Disclosure |
|
|
|
|
|
| Adjustment to Compensation, Amount |
0
|
(29,575)
|
|
(16,202)
|
(235,821)
|
| Non-PEO NEO | Aggregate Pension Adjustments Service Cost |
|
|
|
|
|
| Pay vs Performance Disclosure |
|
|
|
|
|
| Adjustment to Compensation, Amount |
0
|
14,841
|
19,050
|
30,048
|
26,334
|
| Non-PEO NEO | Aggregate Grant Date Fair Value of Equity Award Amounts Reported in Summary Compensation Table |
|
|
|
|
|
| Pay vs Performance Disclosure |
|
|
|
|
|
| Adjustment to Compensation, Amount |
(1,651,651)
|
(1,203,366)
|
(1,276,247)
|
(1,164,932)
|
(1,799,573)
|
| Non-PEO NEO | Year-end Fair Value of Equity Awards Granted in Covered Year that are Outstanding and Unvested |
|
|
|
|
|
| Pay vs Performance Disclosure |
|
|
|
|
|
| Adjustment to Compensation, Amount |
1,620,106
|
1,112,716
|
1,402,100
|
1,317,281
|
1,455,572
|
| Non-PEO NEO | Year-over-Year Change in Fair Value of Equity Awards Granted in Prior Years That are Outstanding and Unvested |
|
|
|
|
|
| Pay vs Performance Disclosure |
|
|
|
|
|
| Adjustment to Compensation, Amount |
64,791
|
205,511
|
563,880
|
362,214
|
(236,502)
|
| Non-PEO NEO | Change in Fair Value as of Vesting Date of Prior Year Equity Awards Vested in Covered Year |
|
|
|
|
|
| Pay vs Performance Disclosure |
|
|
|
|
|
| Adjustment to Compensation, Amount |
$ 143,494
|
$ 168,181
|
114,067
|
49,873
|
$ (95,518)
|
| Non-PEO NEO | Mr. Doucette [Member] | Aggregate Change in Present Value of Accumulated Benefit for All Pension Plans Reported in Summary Compensation Table |
|
|
|
|
|
| Pay vs Performance Disclosure |
|
|
|
|
|
| Adjustment to Compensation, Amount |
|
|
|
(11,030)
|
|
| Non-PEO NEO | Mr. Mukherjee [Member] | Aggregate Change in Present Value of Accumulated Benefit for All Pension Plans Reported in Summary Compensation Table |
|
|
|
|
|
| Pay vs Performance Disclosure |
|
|
|
|
|
| Adjustment to Compensation, Amount |
|
|
$ (600,167)
|
$ 81,008
|
|


