Pay vs Performance Disclosure - USD ($)
|
5 Months Ended |
7 Months Ended |
12 Months Ended |
Jun. 14, 2024 |
Dec. 31, 2024 |
Dec. 31, 2024 |
Dec. 31, 2023 |
Dec. 31, 2022 |
| Pay vs Performance Disclosure [Table] |
|
|
|
|
|
|
| Pay vs Performance [Table Text Block] |
|
|
|
| Year | |
Summary
Compensation Table Total for the Principal Executive Officer (“PEO”) (Current) (1)
($) | | |
CAP
to PEO (Current)
(2)(3) ($) | | |
Summary
Compensation Table Total for PEO (Former) (1)
($) | | |
CAP
to PEO (Former)
(2)(3) ($) | | |
Average
Summary Compensation Table Total for Non-PEO NEOs (4)
($) | | |
Average CAP to Non-PEO NEOs (3)(4) ($)
(4) | | |
Value
of Initial Fixed
$100 Investment
based on
Total
Stockholder
Return
(“TSR”) (5)
($) | | |
Net
(Loss) Income (6)
($) | |
| 2024 | |
$ | 175,833 | | |
$ | 175,833 | | |
$ | 420,231 | | |
$ | (1,100,241 | ) | |
$ | 120,066 | | |
$ | 94,166 | | |
| 29 | | |
$ | (27,161,219 | ) |
| 2023 | |
| 2,884,326 | | |
| (6,400,989 | ) | |
| - | | |
| - | | |
| 444,756 | | |
| (2,041,030 | ) | |
| 195 | | |
| (8,218,163 | ) |
| 2022 | |
| 261,827 | | |
| (4,105,250 | ) | |
| - | | |
| - | | |
| 234,657 | | |
| - | | |
| 29 | | |
| (15,197,336 | ) |
|
|
|
| Named Executive Officers, Footnote [Text Block] |
|
|
|
| (1) |
The dollar amounts reported in this column are the amounts of total compensation reported in the “Total” column of the Summary Compensation Table for the 2022, 2023 and 2024 fiscal years for the persons who served as our PEO for the applicable year. Effective April 16, 2021, Dr. Christopher Chapman was appointed as President and Chief Medical Officer, and since such date and until June 14, 2024, has performed the duties of PEO. Effective June 13, 2024, Dr. Glass was appointed as President and Chief Medical Officer. Dr. Glass’ compensation information for 2023 and 2022 is not included because he did not serve as our PEO during 2022 or 2023. For additional information, see “Executive Compensation—Summary Compensation Table.” |
| (2) |
The dollar amounts reported in this column represent the amount of “CAP” to our PEO, as computed in accordance with Item 402(v) of Regulation S-K. |
| (3) |
The following table reflects the adjustments made to compute CAP for each applicable year: |
| (4) |
The dollar amounts reported in this column represent the average of the amounts reported for our Non-PEO NEOs as a group in the “Total” column of the Summary Compensation Table in each applicable year. The Non-PEO NEOs in each applicable year were Ian Rhodes and Dr. Adam Kaplin, as applicable. Effective November 14, 2024, Dr. Adam Kaplin resigned as a Non-PEO NEO. Dr. Kaplin’s compensation information for 2022 and 2023 is included in this table as a former Non-PEO NEO in accordance with Item 402(v) of Regulation S-K. |
| (5) |
The amounts reported in this column reflect our cumulative TSR, assuming an initial fixed $100 investment in the Company for the period starting January 1, 2022 through the end of each listed fiscal year. Cumulative TSR is calculated by dividing the sum of the cumulative amount of dividends for the measurement period, assuming dividend reinvestment, and the difference between the Company’s share price at the end and the beginning of the measurement period by the Company’s share price at the beginning of the measurement period. No dividends were paid on stock or option awards in 2022, 2023 or 2024. |
| (6) |
The dollar amounts reported in this column represent the amount of net loss attributable to the Company’s stockholders as reflected in our consolidated audited financial statements for each applicable year. |
|
|
|
| Adjustment To PEO Compensation, Footnote [Text Block] |
|
|
|
Calculation of Compensation Actually Paid
For the Years Ending December 31 2024, 2023, and
2022
| | |
PEO | | |
Former PEO | | |
Non-PEO NEOs | | |
PEO | | |
Non-PEO NEOs | | |
PEO | | |
Non-PEO NEOs | |
| | |
2024 | | |
2023 | | |
2022 | |
| | |
PEO | | |
Former PEO | | |
Non-PEO NEOs | | |
PEO | | |
Non-PEO NEOs | | |
PEO | | |
Non-PEO NEOs | |
| | |
($) | | |
($) | | |
($) | | |
($) | | |
($) | | |
($) | | |
($) | |
| Summary Compensation Table Total | |
| 175,833 | | |
| 420,231 | | |
| 240,131 | | |
| 2,884,326 | | |
| 1,334,268 | | |
| 261,627 | | |
| 541,972 | |
| Adjustments | |
| | | |
| | | |
| | | |
| | | |
| | | |
| | | |
| | |
| Stock Awards | |
| - | | |
| - | | |
| - | | |
| (2,218,565 | ) | |
| (470,490 | ) | |
| - | | |
| - | |
| Fair Value of Equity Awards | |
| | | |
| | | |
| | | |
| | | |
| | | |
| | | |
| | |
| Year-End Fair Value of Outstanding and Unvested Equity Awards Granted in the Covered Year. | |
| - | | |
| - | | |
| - | | |
| 440,305 | | |
| 51,800 | | |
| - | | |
| - | |
| Change in Fair Value of Outstanding and Unvested Equitry Awards Granted in the Prior Year. | |
| - | | |
| - | | |
| - | | |
| (7,047,900 | ) | |
| (6,264,878 | ) | |
| (4,367,077 | ) | |
| (5,064,861 | ) |
| Fair Value on Vesting Date of Equity Awards Granted and Vested in the Coverred Year | |
| - | | |
| - | | |
| - | | |
| 553,500 | | |
| 166,000 | | |
| - | | |
| - | |
| Change in Fair Value of Prior Year Equity Awards Vested in the Covered Year | |
| - | | |
| (1,080,167 | ) | |
| - | | |
| (462,850 | ) | |
| (140,100 | ) | |
| - | | |
| - | |
| Year-End Fair Value in the Prior Year of Equity Awards Granted in any Prior Year that are Forfieted or Expired During the Covered Year | |
| - | | |
| (440,305 | ) | |
| (51,800 | ) | |
| (549,805 | ) | |
| (799,688 | ) | |
| - | | |
| - | |
| Dollar Value of Dividends or Other Earnings Paid on Stock or Option Awards in the Covered Year Prior to the Vesting Date If Not Otherwise Reflected | |
| - | | |
| - | | |
| - | | |
| - | | |
| - | | |
| - | | |
| - | |
| Total Adjustments for Fair Value of Equity Awards | |
| - | | |
| (1,520,472 | ) | |
| (51,800 | ) | |
| (7,066,750 | ) | |
| (6,986,867 | ) | |
| (4,367,077 | ) | |
| (5,064,861 | ) |
| Compensation Actually Paid | |
| 175,833 | | |
| (1,100,241 | ) | |
| 188,331 | | |
| (6,400,989 | ) | |
| (6,123,089 | ) | |
| (4,105,250 | ) | |
| (4,522,889 | ) |
|
|
|
| Non-PEO NEO Average Total Compensation Amount |
[1] |
|
|
$ 120,066
|
$ 444,756
|
$ 234,657
|
| Non-PEO NEO Average Compensation Actually Paid Amount |
[1],[2] |
|
|
$ 94,166
|
(2,041,030)
|
|
| Compensation Actually Paid vs. Total Shareholder Return [Text Block] |
|
|
|
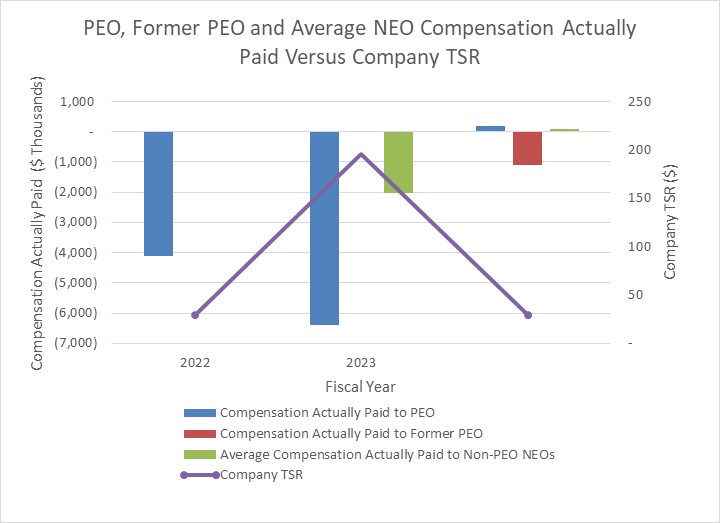
Compensation Actually Paid and Cumulative TSR
The following chart sets forth
the relationship between CAP to our PEO, the average of CAP to our Non-PEO NEOs, and our cumulative TSR over the three most recently
completed fiscal years.
|
|
|
| Compensation Actually Paid vs. Net Income [Text Block] |
|
|
|
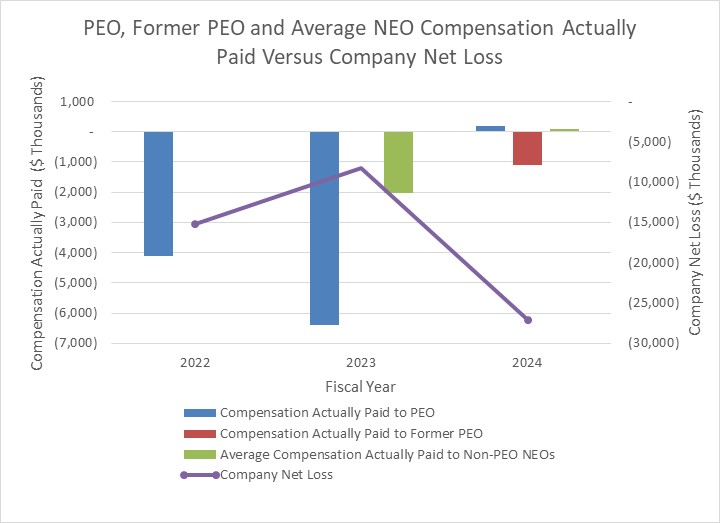
Compensation Actually Paid and Net Loss
The following chart sets forth
the relationship between CAP to our PEO, the average of CAP to our Non-PEO NEOs, and our net loss during the three most recently completed
fiscal years.
|
|
|
| Total Shareholder Return Amount |
[3] |
|
|
$ 29
|
195
|
29
|
| Net Income (Loss) |
[4] |
|
|
$ (27,161,219)
|
(8,218,163)
|
(15,197,336)
|
| Additional 402(v) Disclosure [Text Block] |
|
|
|
Analysis of the Information Presented in the Pay
Versus Performance Table
We generally seek to incentivize
long-term performance, and therefore do not specifically align our performance measures with “compensation actually paid”
(as computed in accordance with Item 402(v) of Regulation S-K) for a particular year. In accordance with Item 402(v) of Regulation S-K,
we are providing the following descriptions of the relationships between information presented in the Pay Versus Performance table.
|
|
|
| PEO [Member] |
|
|
|
|
|
|
| Pay vs Performance Disclosure [Table] |
|
|
|
|
|
|
| PEO Total Compensation Amount |
[5] |
|
|
$ 175,833
|
2,884,326
|
261,827
|
| Compensation Actually Paid |
[2],[6] |
|
|
175,833
|
(6,400,989)
|
(4,105,250)
|
| PEO [Member] | Summary Compensation Table Total [Member] |
|
|
|
|
|
|
| Pay vs Performance Disclosure [Table] |
|
|
|
|
|
|
| Total Adjustments for Fair Value of Equity Awards |
|
|
|
175,833
|
2,884,326
|
261,627
|
| PEO [Member] | Stock Awards [Member] |
|
|
|
|
|
|
| Pay vs Performance Disclosure [Table] |
|
|
|
|
|
|
| Total Adjustments for Fair Value of Equity Awards |
|
|
|
|
(2,218,565)
|
|
| PEO [Member] | Year End Fair Value of Outstanding and Unvested Equity Awards Granted in Covered Year [Member] |
|
|
|
|
|
|
| Pay vs Performance Disclosure [Table] |
|
|
|
|
|
|
| Total Adjustments for Fair Value of Equity Awards |
|
|
|
|
440,305
|
|
| PEO [Member] | Change in Fair Value of Outstanding and Unvested Equity Awards Granted in Prior Year [Member] |
|
|
|
|
|
|
| Pay vs Performance Disclosure [Table] |
|
|
|
|
|
|
| Total Adjustments for Fair Value of Equity Awards |
|
|
|
|
(7,047,900)
|
(4,367,077)
|
| PEO [Member] | Fair Value on Vesting Date of Equity Awards Granted and Vested in Covered Year [Member] |
|
|
|
|
|
|
| Pay vs Performance Disclosure [Table] |
|
|
|
|
|
|
| Total Adjustments for Fair Value of Equity Awards |
|
|
|
|
553,500
|
|
| PEO [Member] | Change in Fair Value of Prior Year Equity Awards Vested in Covered Year [Member] |
|
|
|
|
|
|
| Pay vs Performance Disclosure [Table] |
|
|
|
|
|
|
| Total Adjustments for Fair Value of Equity Awards |
|
|
|
|
(462,850)
|
|
| PEO [Member] | Year End Fair Value in Prior Year of Equity Awards Granted in Any Prior Year That Forfeited or Expired During Covered Year [Member] |
|
|
|
|
|
|
| Pay vs Performance Disclosure [Table] |
|
|
|
|
|
|
| Total Adjustments for Fair Value of Equity Awards |
|
|
|
|
(549,805)
|
|
| PEO [Member] | Dollar Value of Dividends or Other Earnings Paid on Stock or Option Awards in Covered Year Prior to Vesting Date if Not Otherwise Reflected [Member] |
|
|
|
|
|
|
| Pay vs Performance Disclosure [Table] |
|
|
|
|
|
|
| Total Adjustments for Fair Value of Equity Awards |
|
|
|
|
|
|
| PEO [Member] | Total Adjustments for Fair Value of Equity Awards [Member] |
|
|
|
|
|
|
| Pay vs Performance Disclosure [Table] |
|
|
|
|
|
|
| Total Adjustments for Fair Value of Equity Awards |
|
|
|
|
(7,066,750)
|
(4,367,077)
|
| Former PEO [Member] |
|
|
|
|
|
|
| Pay vs Performance Disclosure [Table] |
|
|
|
|
|
|
| PEO Total Compensation Amount |
[5] |
|
|
420,231
|
|
|
| Compensation Actually Paid |
[2],[6] |
|
|
(1,100,241)
|
|
|
| Former PEO [Member] | Summary Compensation Table Total [Member] |
|
|
|
|
|
|
| Pay vs Performance Disclosure [Table] |
|
|
|
|
|
|
| Total Adjustments for Fair Value of Equity Awards |
|
|
|
420,231
|
|
|
| Former PEO [Member] | Stock Awards [Member] |
|
|
|
|
|
|
| Pay vs Performance Disclosure [Table] |
|
|
|
|
|
|
| Total Adjustments for Fair Value of Equity Awards |
|
|
|
|
|
|
| Former PEO [Member] | Year End Fair Value of Outstanding and Unvested Equity Awards Granted in Covered Year [Member] |
|
|
|
|
|
|
| Pay vs Performance Disclosure [Table] |
|
|
|
|
|
|
| Total Adjustments for Fair Value of Equity Awards |
|
|
|
|
|
|
| Former PEO [Member] | Change in Fair Value of Outstanding and Unvested Equity Awards Granted in Prior Year [Member] |
|
|
|
|
|
|
| Pay vs Performance Disclosure [Table] |
|
|
|
|
|
|
| Total Adjustments for Fair Value of Equity Awards |
|
|
|
|
|
|
| Former PEO [Member] | Fair Value on Vesting Date of Equity Awards Granted and Vested in Covered Year [Member] |
|
|
|
|
|
|
| Pay vs Performance Disclosure [Table] |
|
|
|
|
|
|
| Total Adjustments for Fair Value of Equity Awards |
|
|
|
|
|
|
| Former PEO [Member] | Change in Fair Value of Prior Year Equity Awards Vested in Covered Year [Member] |
|
|
|
|
|
|
| Pay vs Performance Disclosure [Table] |
|
|
|
|
|
|
| Total Adjustments for Fair Value of Equity Awards |
|
|
|
(1,080,167)
|
|
|
| Former PEO [Member] | Year End Fair Value in Prior Year of Equity Awards Granted in Any Prior Year That Forfeited or Expired During Covered Year [Member] |
|
|
|
|
|
|
| Pay vs Performance Disclosure [Table] |
|
|
|
|
|
|
| Total Adjustments for Fair Value of Equity Awards |
|
|
|
(440,305)
|
|
|
| Former PEO [Member] | Dollar Value of Dividends or Other Earnings Paid on Stock or Option Awards in Covered Year Prior to Vesting Date if Not Otherwise Reflected [Member] |
|
|
|
|
|
|
| Pay vs Performance Disclosure [Table] |
|
|
|
|
|
|
| Total Adjustments for Fair Value of Equity Awards |
|
|
|
|
|
|
| Former PEO [Member] | Total Adjustments for Fair Value of Equity Awards [Member] |
|
|
|
|
|
|
| Pay vs Performance Disclosure [Table] |
|
|
|
|
|
|
| Total Adjustments for Fair Value of Equity Awards |
|
|
|
(1,520,472)
|
|
|
| Dr. Christopher Chapman [Member] |
|
|
|
|
|
|
| Pay vs Performance Disclosure [Table] |
|
|
|
|
|
|
| PEO Name |
|
Dr. Christopher Chapman
|
|
|
Dr. Christopher Chapman
|
Dr. Christopher Chapman
|
| Dr. Glass [Member] |
|
|
|
|
|
|
| Pay vs Performance Disclosure [Table] |
|
|
|
|
|
|
| PEO Name |
|
|
Dr. Glass
|
|
|
|
| Non-PEO NEO [Member] |
|
|
|
|
|
|
| Pay vs Performance Disclosure [Table] |
|
|
|
|
|
|
| Compensation Actually Paid |
|
|
|
188,331
|
$ (6,123,089)
|
$ (4,522,889)
|
| Non-PEO NEO [Member] | Summary Compensation Table Total [Member] |
|
|
|
|
|
|
| Pay vs Performance Disclosure [Table] |
|
|
|
|
|
|
| Total Adjustments for Fair Value of Equity Awards |
|
|
|
240,131
|
1,334,268
|
541,972
|
| Non-PEO NEO [Member] | Stock Awards [Member] |
|
|
|
|
|
|
| Pay vs Performance Disclosure [Table] |
|
|
|
|
|
|
| Total Adjustments for Fair Value of Equity Awards |
|
|
|
|
(470,490)
|
|
| Non-PEO NEO [Member] | Year End Fair Value of Outstanding and Unvested Equity Awards Granted in Covered Year [Member] |
|
|
|
|
|
|
| Pay vs Performance Disclosure [Table] |
|
|
|
|
|
|
| Total Adjustments for Fair Value of Equity Awards |
|
|
|
|
51,800
|
|
| Non-PEO NEO [Member] | Change in Fair Value of Outstanding and Unvested Equity Awards Granted in Prior Year [Member] |
|
|
|
|
|
|
| Pay vs Performance Disclosure [Table] |
|
|
|
|
|
|
| Total Adjustments for Fair Value of Equity Awards |
|
|
|
|
(6,264,878)
|
(5,064,861)
|
| Non-PEO NEO [Member] | Fair Value on Vesting Date of Equity Awards Granted and Vested in Covered Year [Member] |
|
|
|
|
|
|
| Pay vs Performance Disclosure [Table] |
|
|
|
|
|
|
| Total Adjustments for Fair Value of Equity Awards |
|
|
|
|
166,000
|
|
| Non-PEO NEO [Member] | Change in Fair Value of Prior Year Equity Awards Vested in Covered Year [Member] |
|
|
|
|
|
|
| Pay vs Performance Disclosure [Table] |
|
|
|
|
|
|
| Total Adjustments for Fair Value of Equity Awards |
|
|
|
|
(140,100)
|
|
| Non-PEO NEO [Member] | Year End Fair Value in Prior Year of Equity Awards Granted in Any Prior Year That Forfeited or Expired During Covered Year [Member] |
|
|
|
|
|
|
| Pay vs Performance Disclosure [Table] |
|
|
|
|
|
|
| Total Adjustments for Fair Value of Equity Awards |
|
|
|
(51,800)
|
(799,688)
|
|
| Non-PEO NEO [Member] | Dollar Value of Dividends or Other Earnings Paid on Stock or Option Awards in Covered Year Prior to Vesting Date if Not Otherwise Reflected [Member] |
|
|
|
|
|
|
| Pay vs Performance Disclosure [Table] |
|
|
|
|
|
|
| Total Adjustments for Fair Value of Equity Awards |
|
|
|
|
|
|
| Non-PEO NEO [Member] | Total Adjustments for Fair Value of Equity Awards [Member] |
|
|
|
|
|
|
| Pay vs Performance Disclosure [Table] |
|
|
|
|
|
|
| Total Adjustments for Fair Value of Equity Awards |
|
|
|
$ (51,800)
|
$ (6,986,867)
|
$ (5,064,861)
|
|
|