Pay vs Performance Disclosure - USD ($)
Dec. 31, 2024
Dec. 31, 2023
Dec. 31, 2022
Dec. 31, 2021
Dec. 31, 2020
Pay versus Performance
As required by Section 953(a) of the Dodd-Frank Act and Item 402(v) of Regulation
S-K
(the PvP Rule), we provide the following disclosure regarding executive “compensation actually paid” (CAP), calculated in accordance with SEC rules, and certain Company performance for the fiscal years listed below. This disclosure was prepared in accordance with the requirements of the PvP Rule and does not necessarily reflect the value actually realized by our executives, how our executives’ compensation relates to Company performance, or how the MD&C Committee evaluates compensation decisions in light of Company or individual performance. For example, the MD&C Committee does not use CAP as a basis for making compensation decisions, nor does it use net income (as reflected below) for purposes of determining our executives’ incentive compensation. Please refer to our for a complete description of how executive compensation relates to Company performance and how the MD&C Committee makes its compensation decisions.
Compensation Discussion and Analysis
The information provided under this Pay versus Performance section will not be deemed to be incorporated by reference into any filing made by the Company under the Securities Act or the Securities Exchange Act of 1934, as amended (the Exchange Act), except to the extent the Company specifically incorporates it by reference.
Year (a) |
Summary Compensation Table Total for PEO (1) ($) (b) |
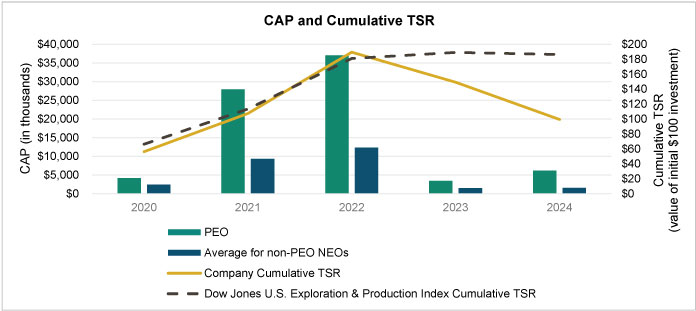
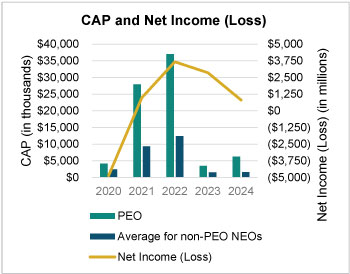
Compensation Actually Paid to PEO (2)(3) ($) (c) |
Average Summary Compensation Table Total for Non-PEO Named Executive Officers (1) ($) (d) |
Average Compensation Actually Paid to Non-PEO Named Executive Officers (2)(4) ($) (e) |
Value of Initial Fixed $100 Investment Based On: |
Net Income (6) (in millions) ($) (h) |
Free Cash Flow (7) (in millions) ($) (i) |
|||||||||||||||||||||||||
Total Shareholder Return ($) (f) |
Peer Group Total Shareholder Return (5) ($) (g) |
|||||||||||||||||||||||||||||||
2024 |
11,440,709 |
6,216,553 |
4,099,763 |
1,549,100 |
99.33 |
186.27 |
804 |
841 |
||||||||||||||||||||||||
2023 |
13,763,441 |
3,438,692 |
5,142,656 |
1,481,677 |
149.23 |
189.15 |
2,855 |
965 |
||||||||||||||||||||||||
2022 |
13,802,119 |
37,002,785 |
5,258,220 |
12,358,523 |
189.47 |
180.98 |
3,674 |
2,458 |
||||||||||||||||||||||||
2021 |
15,040,707 |
27,948,348 |
5,318,503 |
9,347,083 |
107.38 |
113.41 |
973 |
1,823 |
||||||||||||||||||||||||
2020 |
14,321,225 |
4,161,792 |
5,049,645 |
2,445,197 |
56.29 |
66.35 |
(4,860 |
) |
182 |
|||||||||||||||||||||||
(1) |
The dollar amounts reported in columns (b) and (d) are the amounts of total compensation reported for the PEO and the average of the amounts reported for the Company’s non-PEO NEOs as a group, respectively, for each corresponding year in the “Total” column of the Summary Compensation Table |
Year |
PEO |
Non-PEO NEOs | ||
2024 |
John J. Christmann IV |
Stephen J. Riney, D. Clay Bretches, Tracey K. Henderson, Mark D. Maddox, P. Anthony Lannie, and David A. Pursell | ||
2023 |
John J. Christmann IV |
Stephen J. Riney, David A. Pursell, D. Clay Bretches, and Tracey K. Henderson | ||
2022–2020 |
John J. Christmann IV |
Stephen J. Riney, P. Anthony Lannie, David A. Pursell, and D. Clay Bretches | ||
(2) |
The dollar amounts reported in columns (c) and (e) represent the amount of CAP to the PEO and the non-PEO NEOs as a group, respectively, as computed in accordance with the PvP Rule. The dollar amounts do not reflect the actual amount of compensation earned by or paid to these individuals during the applicable year. In accordance with the requirements of the PvP Rule, the adjustments in the tables in the following footnotes below were made to the total compensation of the PEO and the average compensation paid to the non-PEO NEOs as a group, as reported in the SCT for the most recent year, and the addition (or subtraction, as applicable) of the amounts shown in the table for equity award adjustments, as required by the PVP Rule, to determine the CAP. Similar adjustments were made for prior years shown in the table above. No pension benefit adjustments were made, as the Company does not have any defined benefit or actuarial pension plans applicable to our U.S. employees, including our NEOs. The grant date fair value of equity awards represents the total (or average, as applicable) of the amounts reported in the “Stock Awards” and “Option Awards” columns in the SCT for the applicable year. The valuation assumptions used to calculate fair values did not materially differ from those disclosed at the time of grant. |
(3) |
Adjustments made to the total compensation of the PEO for the most recent year were as follows: |
Calculation of CAP for PEO |
2024 |
|||
Reported SCT total ($) |
11,440,709 |
|||
– |
(7,555,373 |
) | ||
+ |
6,091,918 |
|||
+ |
(8,359,619 |
) | ||
+ |
— |
|||
+ |
3,761,435 |
|||
– |
— |
|||
+ |
837,482 |
|||
= CAP* |
6,216,553 |
|||
* |
Individual amounts above and the totals are rounded to the nearest dollar. |
(4) |
Adjustments made to the average compensation of the non-PEO NEOs as a group for the most recent year were as follows: |
Calculation of Average CAP for Non-PEO NEOs as a Group |
2024 |
|||
Reported SCT total ($) |
4,099,763 |
|||
– |
(2,269,443 |
) | ||
+ |
1,354,071 |
|||
+ |
(2,548,922 |
) | ||
+ |
— |
|||
+ |
896,072 |
|||
– |
(203,709 |
) | ||
+ |
221,268 |
|||
= CAP* |
1,549,100 |
|||
* |
Individual amounts above and the totals are rounded to the nearest dollar. |
(5) |
Represents the weighted peer group cumulative TSR, weighted according to the respective companies’ stock market capitalization at the beginning of each period for which a return is indicated. The peer group used for this purpose is the Dow Jones U.S. Exploration & Production Index, which is the same published industry index the Company uses for purposes of Item 201(e)(1)(ii) of Regulation S-K. |
(6) |
The dollar amounts reported represent the amount of net income (loss) previously disclosed in the Company’s audited GAAP financial statements for the applicable year, as required by Regulation S-X. |
(7) |
Free Cash Flow for purposes of this Pay versus Performance table is calculated by taking cash flows from operations before changes in operating assets and liabilities, including Sinopec’s noncontrolling interest, and subtracts upstream capital investment and distributions to Sinopec’s noncontrolling interest. This is a different formulation of Free Cash Flow as compared to what is used in the Company’s goal metrics, as described in the Compensation Discussion and Analysis |
(1) |
The dollar amounts reported in columns (b) and (d) are the amounts of total compensation reported for the PEO and the average of the amounts reported for the Company’s non-PEO NEOs as a group, respectively, for each corresponding year in the “Total” column of the Summary Compensation Table |
Year |
PEO |
Non-PEO NEOs | ||
2024 |
John J. Christmann IV |
Stephen J. Riney, D. Clay Bretches, Tracey K. Henderson, Mark D. Maddox, P. Anthony Lannie, and David A. Pursell | ||
2023 |
John J. Christmann IV |
Stephen J. Riney, David A. Pursell, D. Clay Bretches, and Tracey K. Henderson | ||
2022–2020 |
John J. Christmann IV |
Stephen J. Riney, P. Anthony Lannie, David A. Pursell, and D. Clay Bretches | ||
S-K.
(2) |
The dollar amounts reported in columns (c) and (e) represent the amount of CAP to the PEO and the non-PEO NEOs as a group, respectively, as computed in accordance with the PvP Rule. The dollar amounts do not reflect the actual amount of compensation earned by or paid to these individuals during the applicable year. In accordance with the requirements of the PvP Rule, the adjustments in the tables in the following footnotes below were made to the total compensation of the PEO and the average compensation paid to the non-PEO NEOs as a group, as reported in the SCT for the most recent year, and the addition (or subtraction, as applicable) of the amounts shown in the table for equity award adjustments, as required by the PVP Rule, to determine the CAP. Similar adjustments were made for prior years shown in the table above. No pension benefit adjustments were made, as the Company does not have any defined benefit or actuarial pension plans applicable to our U.S. employees, including our NEOs. The grant date fair value of equity awards represents the total (or average, as applicable) of the amounts reported in the “Stock Awards” and “Option Awards” columns in the SCT for the applicable year. The valuation assumptions used to calculate fair values did not materially differ from those disclosed at the time of grant. |
(3) |
Adjustments made to the total compensation of the PEO for the most recent year were as follows: |
Calculation of CAP for PEO |
2024 |
|||
Reported SCT total ($) |
11,440,709 |
|||
– |
(7,555,373 |
) | ||
+ |
6,091,918 |
|||
+ |
(8,359,619 |
) | ||
+ |
— |
|||
+ |
3,761,435 |
|||
– |
— |
|||
+ |
837,482 |
|||
= CAP* |
6,216,553 |
|||
* |
Individual amounts above and the totals are rounded to the nearest dollar. |
(4) |
Adjustments made to the average compensation of the non-PEO NEOs as a group for the most recent year were as follows: |
Calculation of Average CAP for Non-PEO NEOs as a Group |
2024 |
|||
Reported SCT total ($) |
4,099,763 |
|||
– |
(2,269,443 |
) | ||
+ |
1,354,071 |
|||
+ |
(2,548,922 |
) | ||
+ |
— |
|||
+ |
896,072 |
|||
– |
(203,709 |
) | ||
+ |
221,268 |
|||
= CAP* |
1,549,100 |
|||
* |
Individual amounts above and the totals are rounded to the nearest dollar. |

Financial Performance Measures
In our assessment, the most important financial performance measures used to link CAP (as calculated in accordance with the SEC rules) to our
NEOs
in
2024 to our performance were: • |
Free Cash Flow |
• |
Cash Return on Invested Capital |
• |
Cash Costs per BOE ($/BOE) |
• |
All-in Finding and Development ($/BOE) |
Compensation Discussion and Analysis