Pay vs Performance Disclosure - USD ($)
Dec. 31, 2023
Oct. 26, 2023
Dec. 31, 2024
Dec. 31, 2023
Dec. 31, 2022
Dec. 31, 2021
Dec. 31, 2020
Pay Versus Performance
The following information has been prepared in accordance with the SEC’s pay versus performance (“PvP”) disclosure requirements under Item 402(v) of Regulation S-K for fiscal years 2024, 2023, 2022, 2021 and 2020 (each, a “Covered Year”).
Our Compensation Committee has implemented an executive compensation program that is intended to link a substantial portion of our NEOs’ total compensation to the achievement of various short- and long-term financial and operational metrics, and to be aligned with shareholder value. The Committee does not consider the Compensation Actually Paid (“CAP”) metric as a basis for making compensation decisions. Refer to the CD&A beginning on page 42 for details on how we align pay with performance, and how the Committee approaches designing our executive compensation program.
2024 Pay Versus Performance Table
Value of initial fixed $100 investment based on: | ||||||||||||||||||||||||||||||||
Year (a) | Summary Compensation Table Total for First PEO (b1) | Summary Compensation Table Total for Second PEO (b2) | Compensation Actually Paid to First PEO (c1) | Compensation Actually Paid to Second PEO (c2) | Average Summary Compensation Table Total for non-PEO NEOs (d) | Average Compensation Actually Paid to non-PEO NEOs (e) | Total Shareholder Return (f) | Peer Group Total Shareholder Return (g) | Net Income (000s) (h) | Shyft Adjusted EBITDA (000s) (i) | ||||||||||||||||||||||
2024 | $6,704,927 | — | $6,824,031 | — | $3,068,125 | $2,552,066 | $64.93 | $244.65 | $(2,795) | $48,848 | ||||||||||||||||||||||
2023 | 3,402,383 | $3,755,905 | 2,706,203 | $263,813 | 1,131,628 | 541,211 | 67.59 | 204.99 | 6,464 | 39,968 | ||||||||||||||||||||||
2022 | — | 3,417,703 | — | (7,264,177) | 1,295,458 | (151,088) | 137.50 | 177.95 | 36,558 | 70,793 | ||||||||||||||||||||||
2021 | — | 5,147,927 | — | 17,936,324 | 1,423,191 | 3,782,664 | 271.74 | 151.52 | 70,155 | 108,066 | ||||||||||||||||||||||
2020 | — | 4,495,767 | — | 11,205,332 | 1,274,709 | 2,655,111 | 156.97 | 128.80 | 33,166 | 76,346 | ||||||||||||||||||||||
Column (a): Indicates the Covered Year.
Column (b1): Contains the Total Compensation from the Summary Compensation Table (“SCT”) for each of the respective Covered Years for Mr. Dunn, who served as our PEO for each of the Covered Years shown in the table beginning October 26, 2023.
Column (b2): Contains the Total Compensation from the SCT in prior years for Mr. Daryl Adams, who served as our PEO until October 26, 2023.
Columns (c1) and (c2): The “Compensation Actually Paid to PEO” (in column c1 to Mr. Dunn our current PEO, and in column c2 to Mr. Adams, our former PEO) for each of the respective Covered Years reflects the Total Compensation in columns (b1) and (b2) adjusted per the table below in accordance with the SEC rules for calculating Compensation Actually Paid. The amounts in columns (c1) do not represent the actual amount of compensation earned by or paid to Mr. Dunn during the applicable Covered Years. For the actual amounts earned by Mr. Dunn, and for information about the decisions made by our Compensation Committee, please review the respective CD&As in the proxy statements applicable to each Covered Year in the table above.
First PEO (Dunn) | Second PEO (Adams) | |||||||||||||||||||
Compensation Actually Paid to PEO | 2024 | 2023 | 2023 | 2022 | 2021 | 2020 | ||||||||||||||
SCT Total Compensation ($) | 6,704,927 | 3,402,383 | 3,755,905 | 3,417,703 | 5,147,927 | 4,495,767 | ||||||||||||||
Less: Stock and Option Award Values Reported in SCT for the Covered Year ($) | (4,983,273) | (2,230,214) | (2,567,922) | (2,211,760) | (2,554,773) | (1,978,913) | ||||||||||||||
Plus: Covered Year-End Fair Value for Stock and Option Awards Granted in and Outstanding at the End of the Covered Year ($) | 4,142,312 | 1,534,034 | 627,261 | 1,053,484 | 4,349,758 | 6,021,187 | ||||||||||||||
Plus/Minus: Change in Fair Value (From Prior Year-End to Covered Year-End) of Outstanding Unvested Stock and Option Awards Granted Prior to the Covered Year ($) | (302,657) | — | (847,981) | (3,172,834) | 5,666,217 | 3,547,420 | ||||||||||||||
Plus/Minus: Change in Fair Value (From Prior Year-End to Vesting Date) of Stock and Option Awards Granted Prior to the Covered Year that Vested in the Covered Year ($) | 1,262,722 | — | (703,450) | (6,350,770) | 5,327,195 | (880,130) | ||||||||||||||
Compensation Actually Paid ($) | 6,824,031 | 2,706,203 | 263,813 | (7,264,177) | 17,936,324 | 11,205,332 | ||||||||||||||
Column (d): Contains the average Total Compensation of the non-PEOs NEOs from the SCT in the proxy statement for each of the respective Covered Years shown in the table. The following non-PEO NEOs are included in the average figures shown:
2024: Jonathan Douyard, Jacob Farmer, Colin Hindman, Joshua Sherbin
2023: Jonathan Douyard, Jacob Farmer, Colin Hindman, Joshua Sherbin
2022: Jonathan Douyard, Stephen Guillaume, Colin Hindman, Joshua Sherbin
2021: Jonathan Douyard, Stephen Guillaume, Todd Heavin, Chad Heminover
2020: Jonathan Douyard, Stephen Guillaume, Todd Heavin, Chad Heminover, Frederick Sohm
Column (e): The “Average Compensation Actually Paid to non-PEO NEOs” for each of the respective Covered Years reflects the Total Compensation in column (d) adjusted per the table below in accordance with the SEC rules for calculating Compensation Actually Paid. The amounts in column (e) do not represent the actual average amount of compensation earned by or paid to our non-PEO NEOs during the applicable Covered Years. For the actual amounts earned by our non-PEO NEOs and for information about the decisions made by our Compensation Committee, please review the respective CD&As in the proxy statements applicable to each Covered Year in the table above.
Average Compensation Actually Paid to Non-PEO NEOs | 2024 | 2023 | 2022 | 2021 | 2020 | ||||||||||||
SCT Total Compensation ($) | 3,068,125 | 1,131,628 | 1,295,458 | 1,423,191 | 1,274,709 | ||||||||||||
Less: Stock and Option Award Values Reported in SCT for the Covered Year ($) | (1,885,322) | (560,801) | (670,736) | (663,829) | (526,733) | ||||||||||||
Plus: Covered Year-End Fair Value for Stock and Option Awards Granted in and Outstanding at the End of the Covered Year ($) | 1,033,505 | 317,112 | 507,847 | 1,086,806 | 1,630,064 | ||||||||||||
Plus/Minus: Change in Fair Value (From Prior Year-End to Covered Year-End) of Outstanding Unvested Stock and Option Awards Granted Prior to the Covered Year ($) | (214,741) | (258,504) | (605,195) | 1,550,824 | 354,922 | ||||||||||||
Plus/Minus: Change in Fair Value (From Prior Year-End to Vesting Date) of Stock and Option Awards Granted Prior to the Covered Year that Vested in the Covered Year ($) | 550,499 | (88,225) | (678,462) | 385,671 | (77,851) | ||||||||||||
Compensation Actually Paid ($) | 2,552,066 | 541,211 | (151,088) | 3,782,664 | 2,655,111 | ||||||||||||
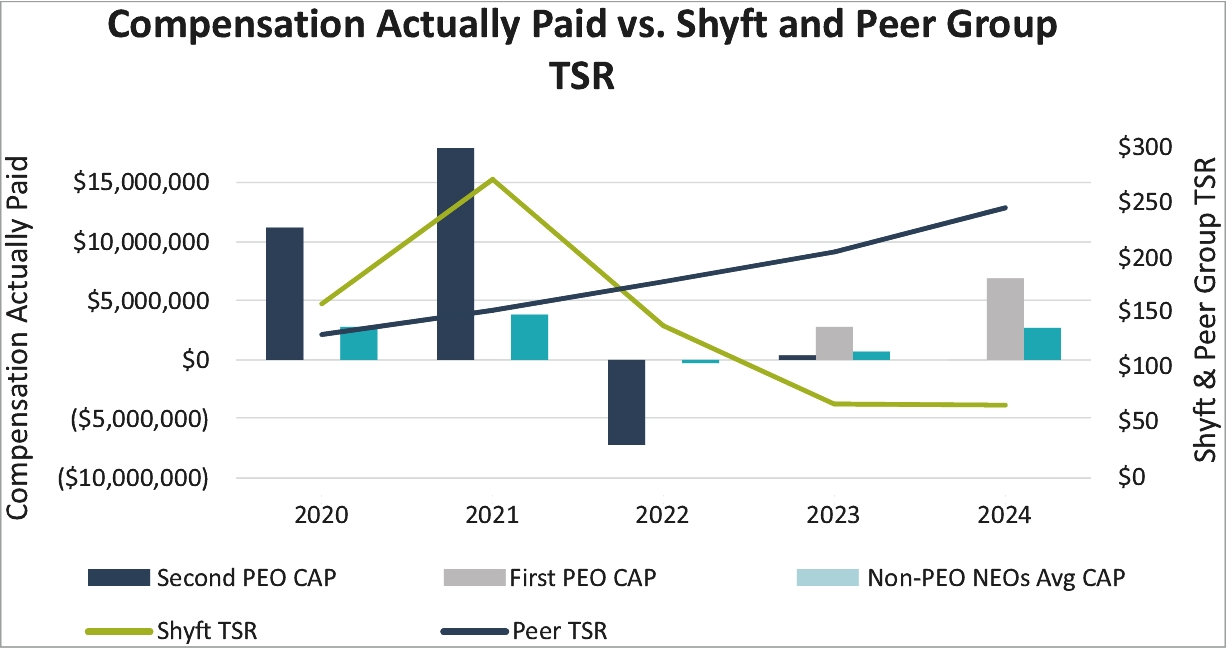
Columns (f) and (g): The TSR figures assume an initial investment of $100 on December 31, 2019 and show the resulting cumulative total shareholder return for the applicable periods in the table (assuming reinvestment of any dividends), for The Shyft Group in column (f) and for the Peer Group in column (g). The Peer Group is comprised of the Dow Jones Commercial Trucks and Vehicles Total Stock Market Index.
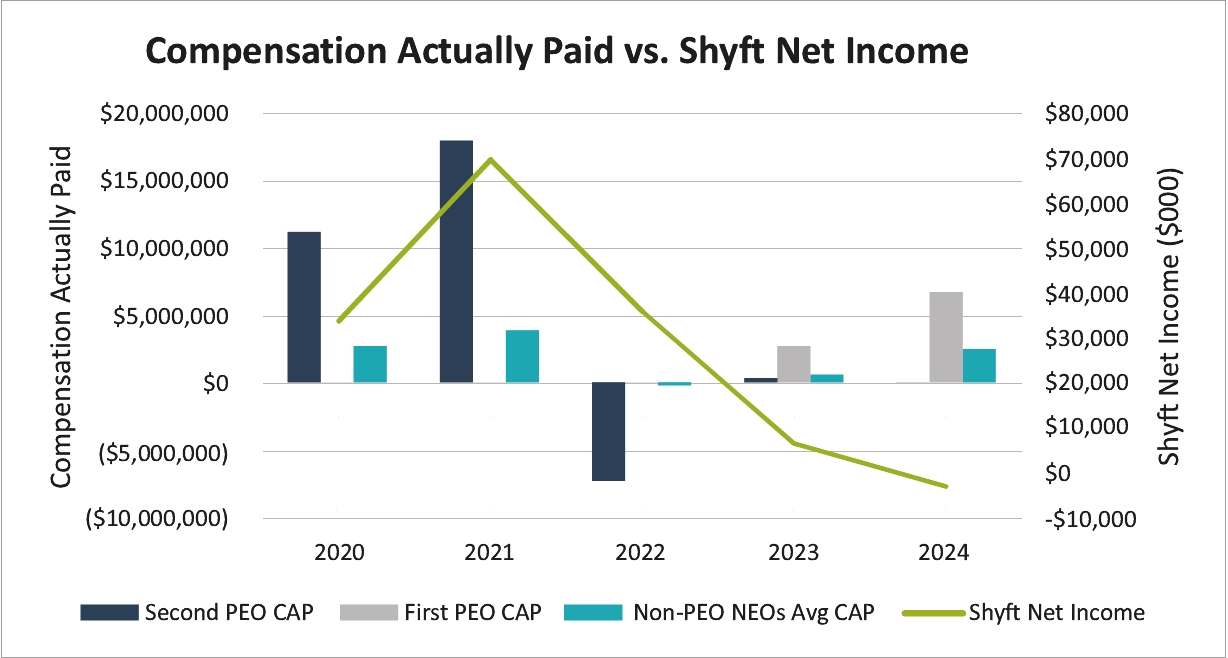
Column (h): Reflects the Company’s GAAP Net Income for each of the respective Covered Years as disclosed in the Company’s Consolidated Income Statements included in the Company’s Annual Reports on Form 10-K for each of the years ended December 31, 2024, 2023, 2022, 2021 and 2020.
Column (i): The Company-Selected Measure is Shyft Adjusted EBITDA, which is a non-GAAP financial measure defined as income from continuing operations before interest, income taxes, depreciation, and amortization, as adjusted to eliminate the impact of restructuring charges, acquisition related expenses and adjustments, non-cash stock-based compensation expenses, and other gains and losses not reflective of our ongoing operations.
Column (b1): Contains the Total Compensation from the Summary Compensation Table (“SCT”) for each of the respective Covered Years for Mr. Dunn, who served as our PEO for each of the Covered Years shown in the table beginning October 26, 2023.
Column (b2): Contains the Total Compensation from the SCT in prior years for Mr. Daryl Adams, who served as our PEO until October 26, 2023.
Column (d): Contains the average Total Compensation of the non-PEOs NEOs from the SCT in the proxy statement for each of the respective Covered Years shown in the table. The following non-PEO NEOs are included in the average figures shown:
2024: Jonathan Douyard, Jacob Farmer, Colin Hindman, Joshua Sherbin
2023: Jonathan Douyard, Jacob Farmer, Colin Hindman, Joshua Sherbin
2022: Jonathan Douyard, Stephen Guillaume, Colin Hindman, Joshua Sherbin
2021: Jonathan Douyard, Stephen Guillaume, Todd Heavin, Chad Heminover
2020: Jonathan Douyard, Stephen Guillaume, Todd Heavin, Chad Heminover, Frederick Sohm
Columns (f) and (g): The TSR figures assume an initial investment of $100 on December 31, 2019 and show the resulting cumulative total shareholder return for the applicable periods in the table (assuming reinvestment of any dividends), for The Shyft Group in column (f) and for the Peer Group in column (g). The Peer Group is comprised of the Dow Jones Commercial Trucks and Vehicles Total Stock Market Index.
Columns (c1) and (c2): The “Compensation Actually Paid to PEO” (in column c1 to Mr. Dunn our current PEO, and in column c2 to Mr. Adams, our former PEO) for each of the respective Covered Years reflects the Total Compensation in columns (b1) and (b2) adjusted per the table below in accordance with the SEC rules for calculating Compensation Actually Paid. The amounts in columns (c1) do not represent the actual amount of compensation earned by or paid to Mr. Dunn during the applicable Covered Years. For the actual amounts earned by Mr. Dunn, and for information about the decisions made by our Compensation Committee, please review the respective CD&As in the proxy statements applicable to each Covered Year in the table above.
First PEO (Dunn) | Second PEO (Adams) | |||||||||||||||||||
Compensation Actually Paid to PEO | 2024 | 2023 | 2023 | 2022 | 2021 | 2020 | ||||||||||||||
SCT Total Compensation ($) | 6,704,927 | 3,402,383 | 3,755,905 | 3,417,703 | 5,147,927 | 4,495,767 | ||||||||||||||
Less: Stock and Option Award Values Reported in SCT for the Covered Year ($) | (4,983,273) | (2,230,214) | (2,567,922) | (2,211,760) | (2,554,773) | (1,978,913) | ||||||||||||||
Plus: Covered Year-End Fair Value for Stock and Option Awards Granted in and Outstanding at the End of the Covered Year ($) | 4,142,312 | 1,534,034 | 627,261 | 1,053,484 | 4,349,758 | 6,021,187 | ||||||||||||||
Plus/Minus: Change in Fair Value (From Prior Year-End to Covered Year-End) of Outstanding Unvested Stock and Option Awards Granted Prior to the Covered Year ($) | (302,657) | — | (847,981) | (3,172,834) | 5,666,217 | 3,547,420 | ||||||||||||||
Plus/Minus: Change in Fair Value (From Prior Year-End to Vesting Date) of Stock and Option Awards Granted Prior to the Covered Year that Vested in the Covered Year ($) | 1,262,722 | — | (703,450) | (6,350,770) | 5,327,195 | (880,130) | ||||||||||||||
Compensation Actually Paid ($) | 6,824,031 | 2,706,203 | 263,813 | (7,264,177) | 17,936,324 | 11,205,332 | ||||||||||||||
Column (e): The “Average Compensation Actually Paid to non-PEO NEOs” for each of the respective Covered Years reflects the Total Compensation in column (d) adjusted per the table below in accordance with the SEC rules for calculating Compensation Actually Paid. The amounts in column (e) do not represent the actual average amount of compensation earned by or paid to our non-PEO NEOs during the applicable Covered Years. For the actual amounts earned by our non-PEO NEOs and for information about the decisions made by our Compensation Committee, please review the respective CD&As in the proxy statements applicable to each Covered Year in the table above.
Average Compensation Actually Paid to Non-PEO NEOs | 2024 | 2023 | 2022 | 2021 | 2020 | ||||||||||||
SCT Total Compensation ($) | 3,068,125 | 1,131,628 | 1,295,458 | 1,423,191 | 1,274,709 | ||||||||||||
Less: Stock and Option Award Values Reported in SCT for the Covered Year ($) | (1,885,322) | (560,801) | (670,736) | (663,829) | (526,733) | ||||||||||||
Plus: Covered Year-End Fair Value for Stock and Option Awards Granted in and Outstanding at the End of the Covered Year ($) | 1,033,505 | 317,112 | 507,847 | 1,086,806 | 1,630,064 | ||||||||||||
Plus/Minus: Change in Fair Value (From Prior Year-End to Covered Year-End) of Outstanding Unvested Stock and Option Awards Granted Prior to the Covered Year ($) | (214,741) | (258,504) | (605,195) | 1,550,824 | 354,922 | ||||||||||||
Plus/Minus: Change in Fair Value (From Prior Year-End to Vesting Date) of Stock and Option Awards Granted Prior to the Covered Year that Vested in the Covered Year ($) | 550,499 | (88,225) | (678,462) | 385,671 | (77,851) | ||||||||||||
Compensation Actually Paid ($) | 2,552,066 | 541,211 | (151,088) | 3,782,664 | 2,655,111 | ||||||||||||
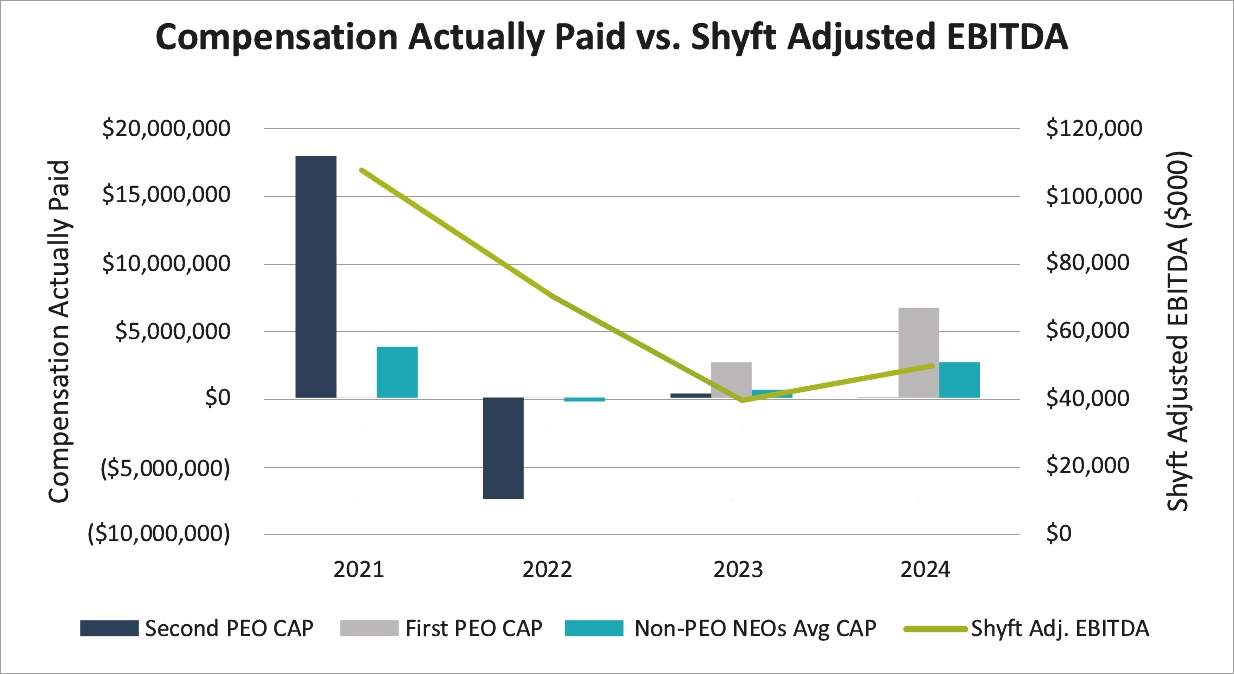
We selected Adjusted EBITDA as our most important performance measure used to link NEO Compensation Actually Paid for 2024 (as described above) and Company performance in 2024 because it is viewed as the primary indicator of the performance and strength of our business. As described in the CD&A section of this proxy, this is the metric with the greatest weight in our Annual Incentive Compensation plan.
Listed below are the metrics we believe are the most important financial performance measures we used to link Compensation Actually Paid for 2024 (as described above) to Company performance for 2024.
Financial Performance Measures | ||||||||
Adjusted EBITDA (Company and segment) | Net Income | Relative TSR | ||||||
Free Cash Flow Conversion | ||||||||
Column (i): The Company-Selected Measure is Shyft Adjusted EBITDA, which is a non-GAAP financial measure defined as income from continuing operations before interest, income taxes, depreciation, and amortization, as adjusted to eliminate the impact of restructuring charges, acquisition related expenses and adjustments, non-cash stock-based compensation expenses, and other gains and losses not reflective of our ongoing operations.