Pay Versus Performance Table
The following table sets forth information concerning the compensation of our NEOs for each of the fiscal years in the five-year period ended December 31, 2024, and our financial performance for each such fiscal year:
| Year | Summary | Compensation | Average | Average | Value of Initial Fixed $100 |
|
| |
| Total | Peer | |||||||
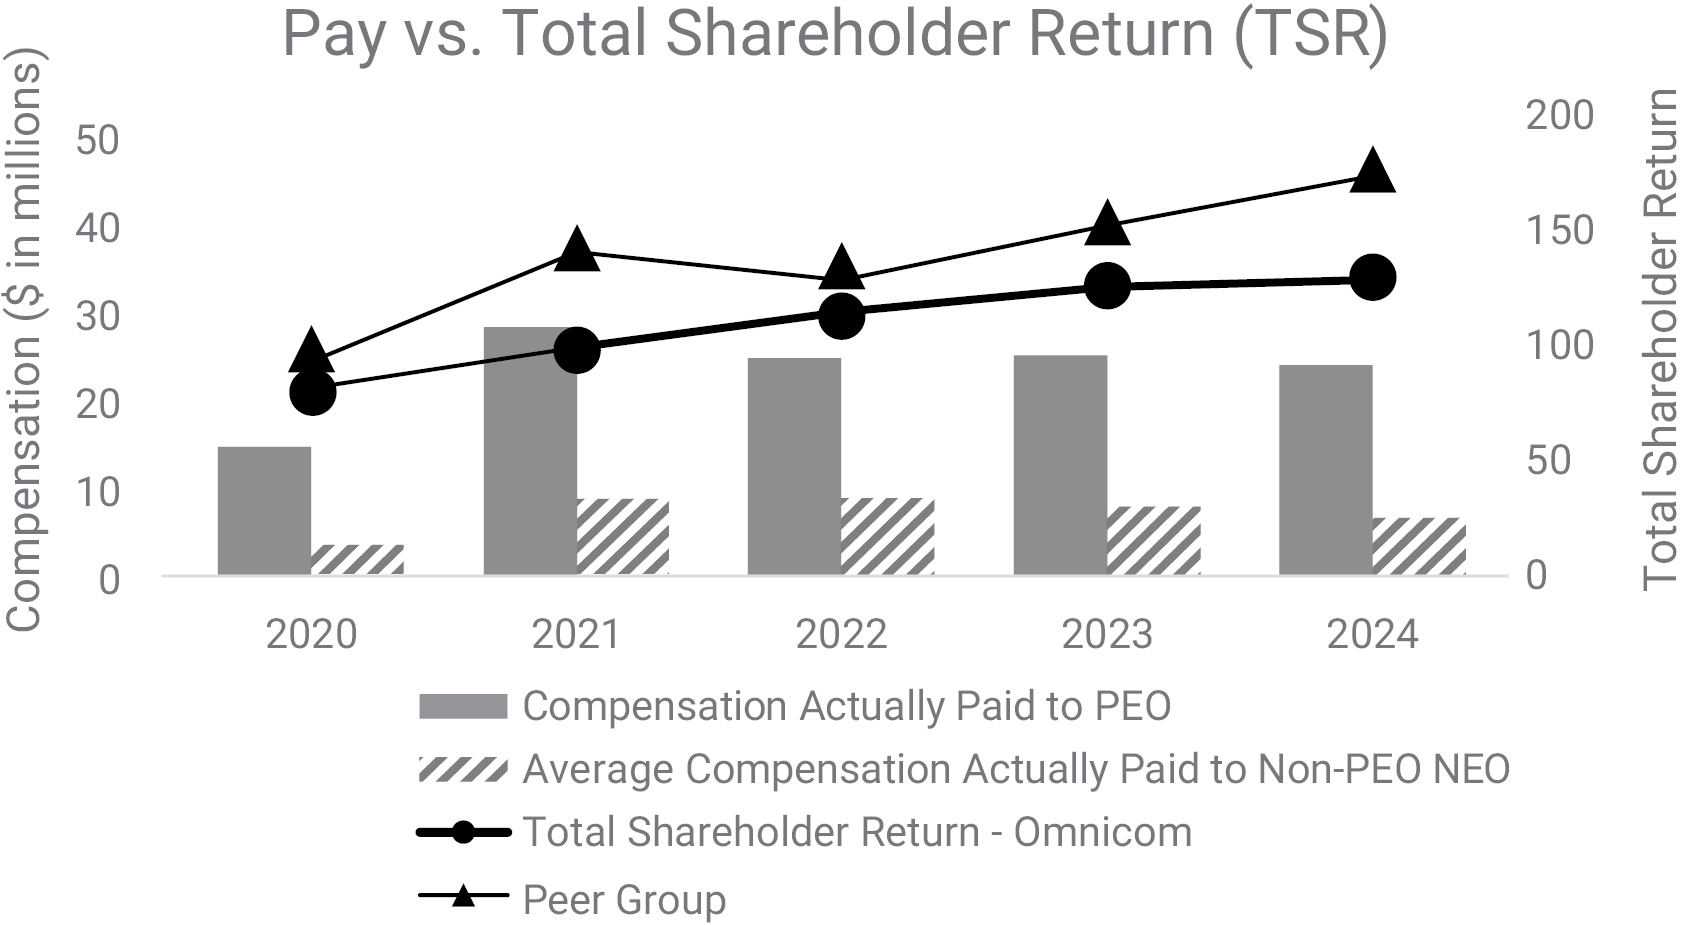
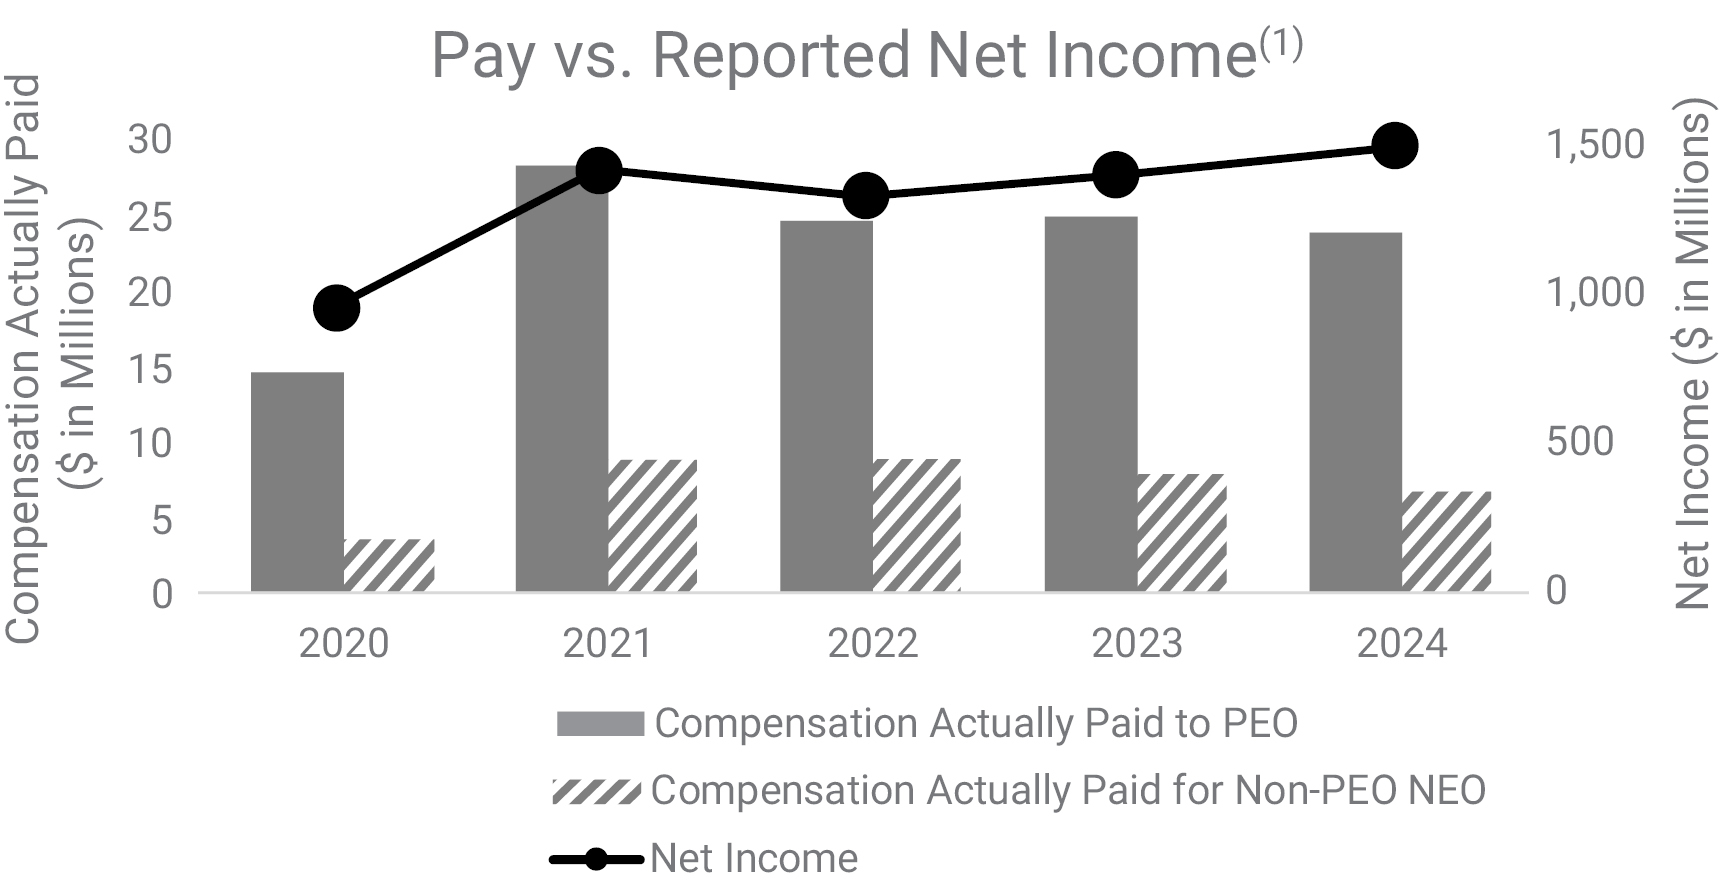
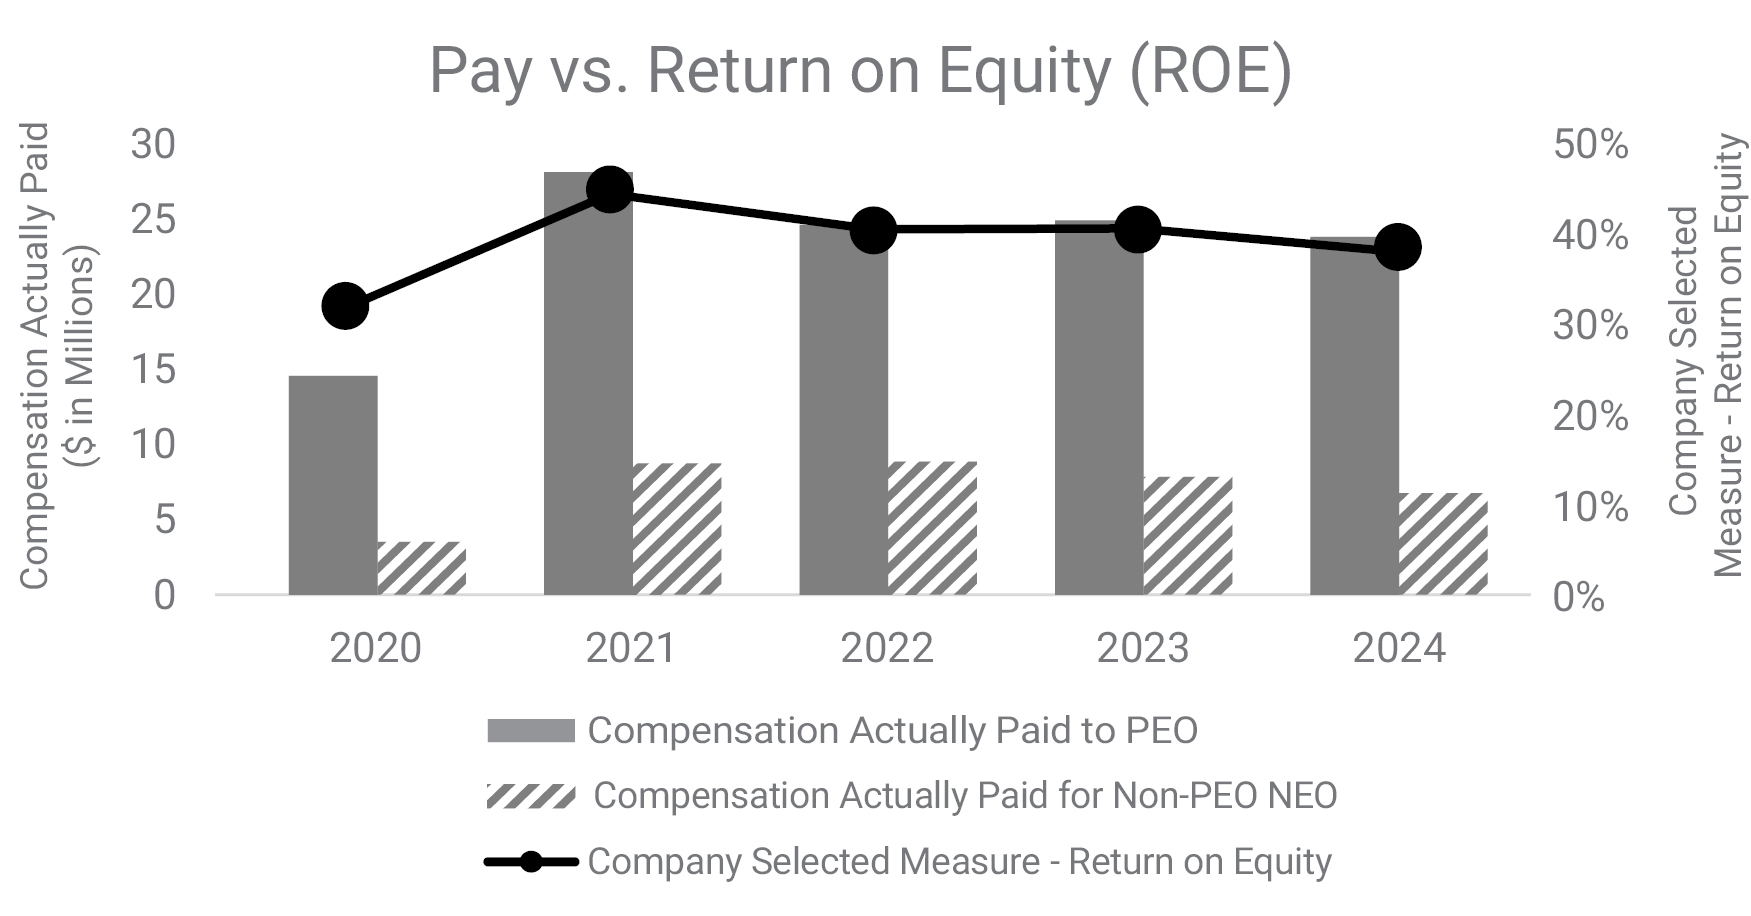
| 2024 | 21,673,595 | 23,662,700 | 6,108,608 | 6,476,397 | 127.36 | 172.47 | 1,480,600,000 | 37.9% |
| 2023 | 20,150,620 | 24,757,884 | 7,028,000 | 7,810,003 | 124.27 | 150.97 | 1,391,400,000 | 40.5% |
| 2022 | 20,679,168 | 24,500,414 | 7,771,045 | 8,841,167 | 113.42 | 127.21 | 1,316,500,000 | 40.4% |
| 2021 | 19,981,715 | 28,011,719 | 7,294,539 | 8,650,622 | 98.01 | 139.44 | 1,407,800,000 | 44.3% |
| 2020 | 11,147,799 | 14,522,809 | 2,569,825 | 3,475,738 | 80.42 | 91.93 | 945,400,000 | 31.8% |
(1) Amounts represent compensation actually paid to our PEO and the average compensation actually paid to our remaining NEOs for the relevant fiscal year, as determined under SEC rules (and described below), which includes the individuals indicated in the table below for each fiscal year:
(2) Represents the cumulative TSR (the “Peer Group TSR”) for the following peer companies for each fiscal year: The Interpublic Group of Companies, Inc., WPP plc and Publicis Groupe SA.
(3) Return on Equity is a non-GAAP measure and is calculated by dividing our total net income for the applicable fiscal year, as reported in our consolidated financial statements contained in our Annual Report on Form 10-K for the applicable fiscal year, by our average shareholders’ equity for such fiscal year. Average shareholders’ equity for a fiscal year is determined by averaging our fiscal year-end shareholders’ equity and our prior fiscal year-end shareholders’ equity, as reported in our consolidated financial statements contained in our Annual Report on Form 10-K for the applicable fiscal year.
| Year | PEO | Non-PEO NEOs | ||
|
| 2024 | John Wren | Daryl Simm, Philip Angelastro, Louis Januzzi and Rochelle Tarlowe |
|
| 2023 | John Wren | Daryl Simm, Philip Angelastro, Jonathan Nelson and Louis Januzzi | ||
| 2022 | John Wren | Daryl Simm, Philip Angelastro, Jonathan Nelson and Michael O’Brien | ||
| 2021 | John Wren | Daryl Simm, Philip Angelastro, Jonathan Nelson and Michael O’Brien | ||
| 2020 | John Wren | Philip Angelastro, Jonathan Nelson, Michael O’Brien and Rochelle Tarlowe |
|
| 2024 | |
| PEO | Average | |
| Deduction for Amounts Reported under the “Stock Awards” and “Option Awards” Columns in the Summary Compensation Table for Applicable FY | $ (7,000,060) | $ (2,612,535) |
| Increase based on ASC 718 Fair Value of Awards Granted during Applicable FY that Remain Unvested as of Applicable FY End, determined as of Applicable FY End(4) | $ 6,186,019 | $ 2,337,316 |
| Increase/deduction for Awards Granted during Prior FY that were Outstanding and Unvested as of Applicable FY End, determined based on change in ASC 718 Fair Value from Prior FY End to Applicable FY End | $ (81,595) | $ (31,484) |
| Increase/deduction for Awards Granted during Prior FY that Vested During Applicable FY, determined based on change in ASC 718 Fair Value from Prior FY End to Vesting Date | $ 720,271 | $ 177,487 |
| Increase based on Dividends or Other Earnings Paid during Applicable FY prior to Vesting Date | $ 2,164,470 | $ 497,005 |
| TOTAL ADJUSTMENTS | $ 1,989,105 | $ 367,789 |
(4) Amount includes both (i) the fair value of the awards granted in 2024, as reported in the Summary Compensation Table for 2024 on page 59, that remain unvested as of 2024 fiscal year-end, determined as of 2024 fiscal year-end, and (ii) the incremental change in the value of the portion of the Annual Incentive Award for performance in 2023 that the Compensation Committee elected to pay in RSUs, as reflected in the Summary Compensation Table for 2024.
Pay Versus Performance Tabular List
We believe the following performance measures represent the most important financial performance measures used by us to determine compensation actually paid to our NEOs for the fiscal year ended December 31, 2024:
■ Return on Equity;
■ Organic Growth;
■ Adjusted Operating Margin;
■ Adjusted Diluted EPS Growth; and
■ Adjusted EBITA Margin.
For additional details regarding our most important financial performance measures, please see the section titled “Performance-Based Compensation Awards” in our Compensation Discussion and Analysis elsewhere in this Proxy Statement.
| [1] | Amounts represent compensation actually paid to our PEO and the average compensation actually paid to our remaining NEOs for the relevant fiscal year, as determined under SEC rules (and described below), which includes the individuals indicated in the table below for each fiscal year: |
| [2] | Represents the cumulative TSR (the “Peer Group TSR”) for the following peer companies for each fiscal year: The Interpublic Group of Companies, Inc., WPP plc and Publicis Groupe SA. |
| [3] | Return on Equity is a non-GAAP measure and is calculated by dividing our total net income for the applicable fiscal year, as reported in our consolidated financial statements contained in our Annual Report on Form 10-K for the applicable fiscal year, by our average shareholders’ equity for such fiscal year. Average shareholders’ equity for a fiscal year is determined by averaging our fiscal year-end shareholders’ equity and our prior fiscal year-end shareholders’ equity, as reported in our consolidated financial statements contained in our Annual Report on Form 10-K for the applicable fiscal year. |
| [4] | Amount includes both (i) the fair value of the awards granted in 2024, as reported in the Summary Compensation Table for 2024 on page 59, that remain unvested as of 2024 fiscal year-end, determined as of 2024 fiscal year-end, and (ii) the incremental change in the value of the portion of the Annual Incentive Award for performance in 2023 that the Compensation Committee elected to pay in RSUs, as reflected in the Summary Compensation Table for 2024. |