Pay vs Performance Disclosure
Dec. 31, 2024
USD ($)
Dec. 31, 2023
USD ($)
Dec. 31, 2022
USD ($)
Dec. 31, 2021
USD ($)
Dec. 31, 2020
USD ($)
Pay Versus Performance Table
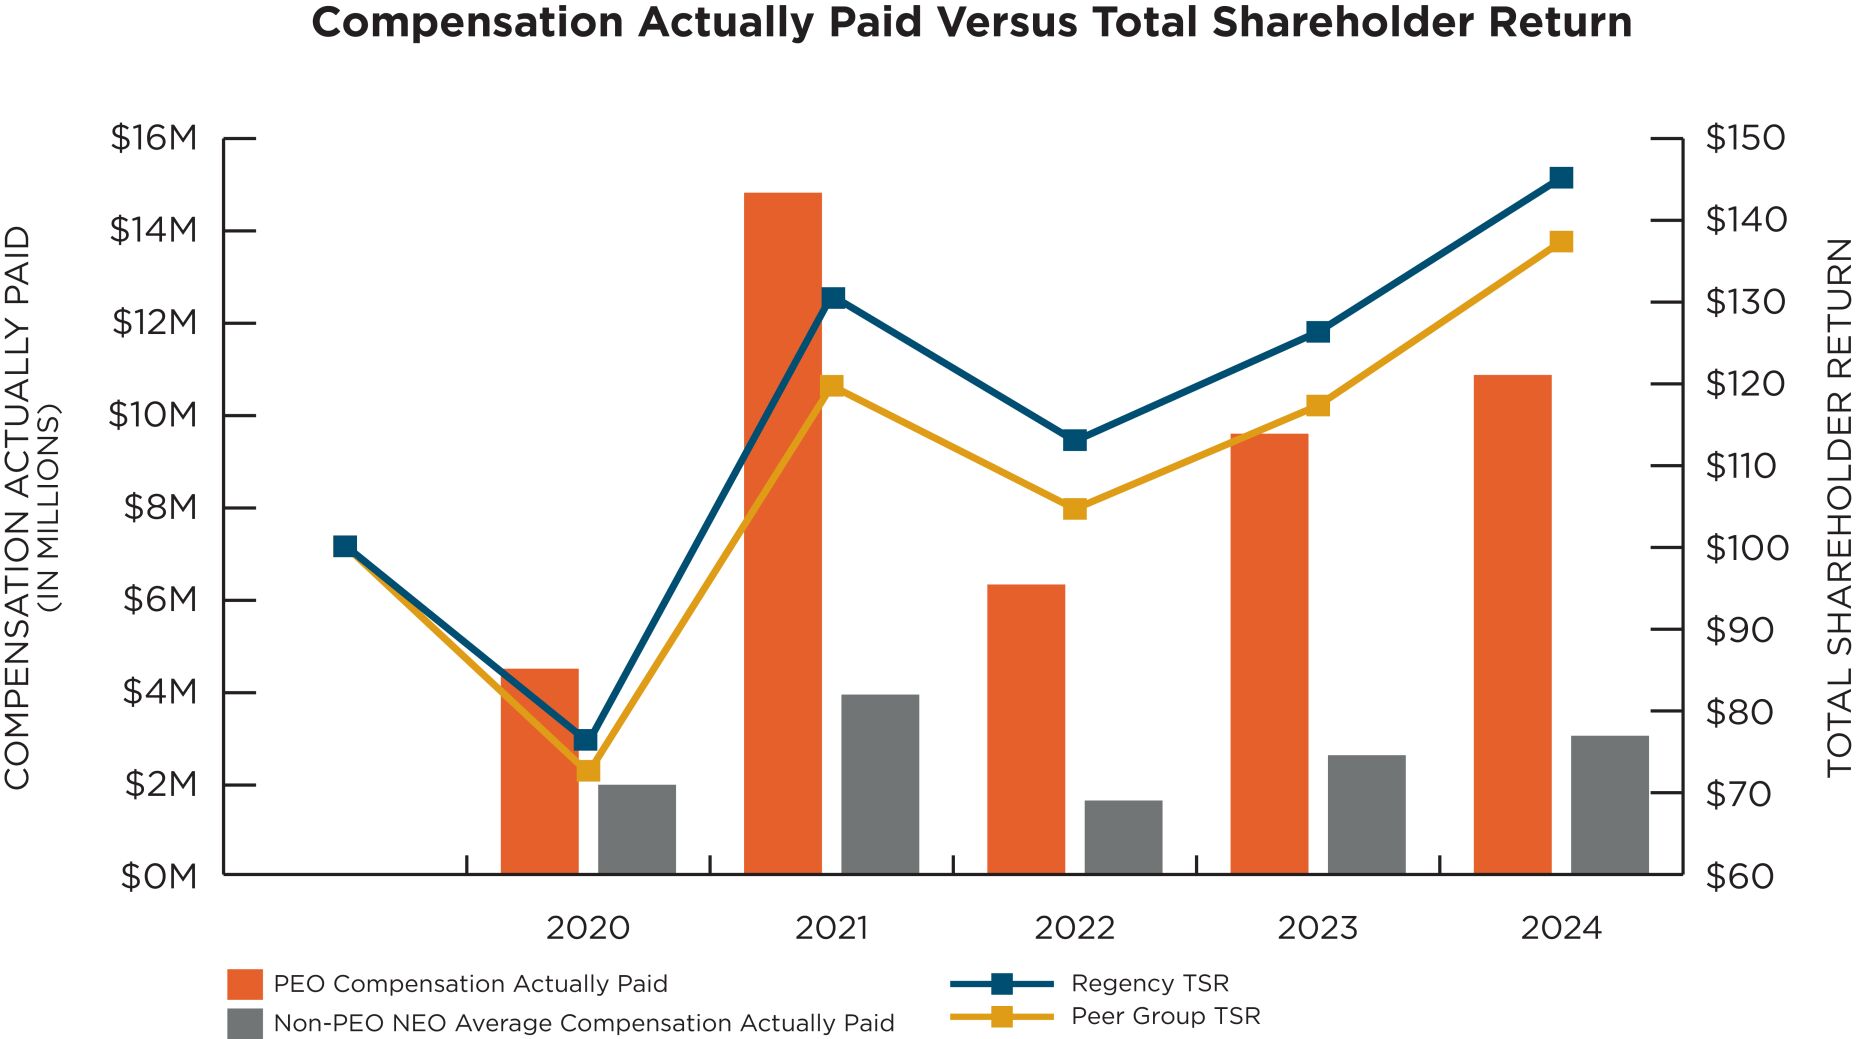
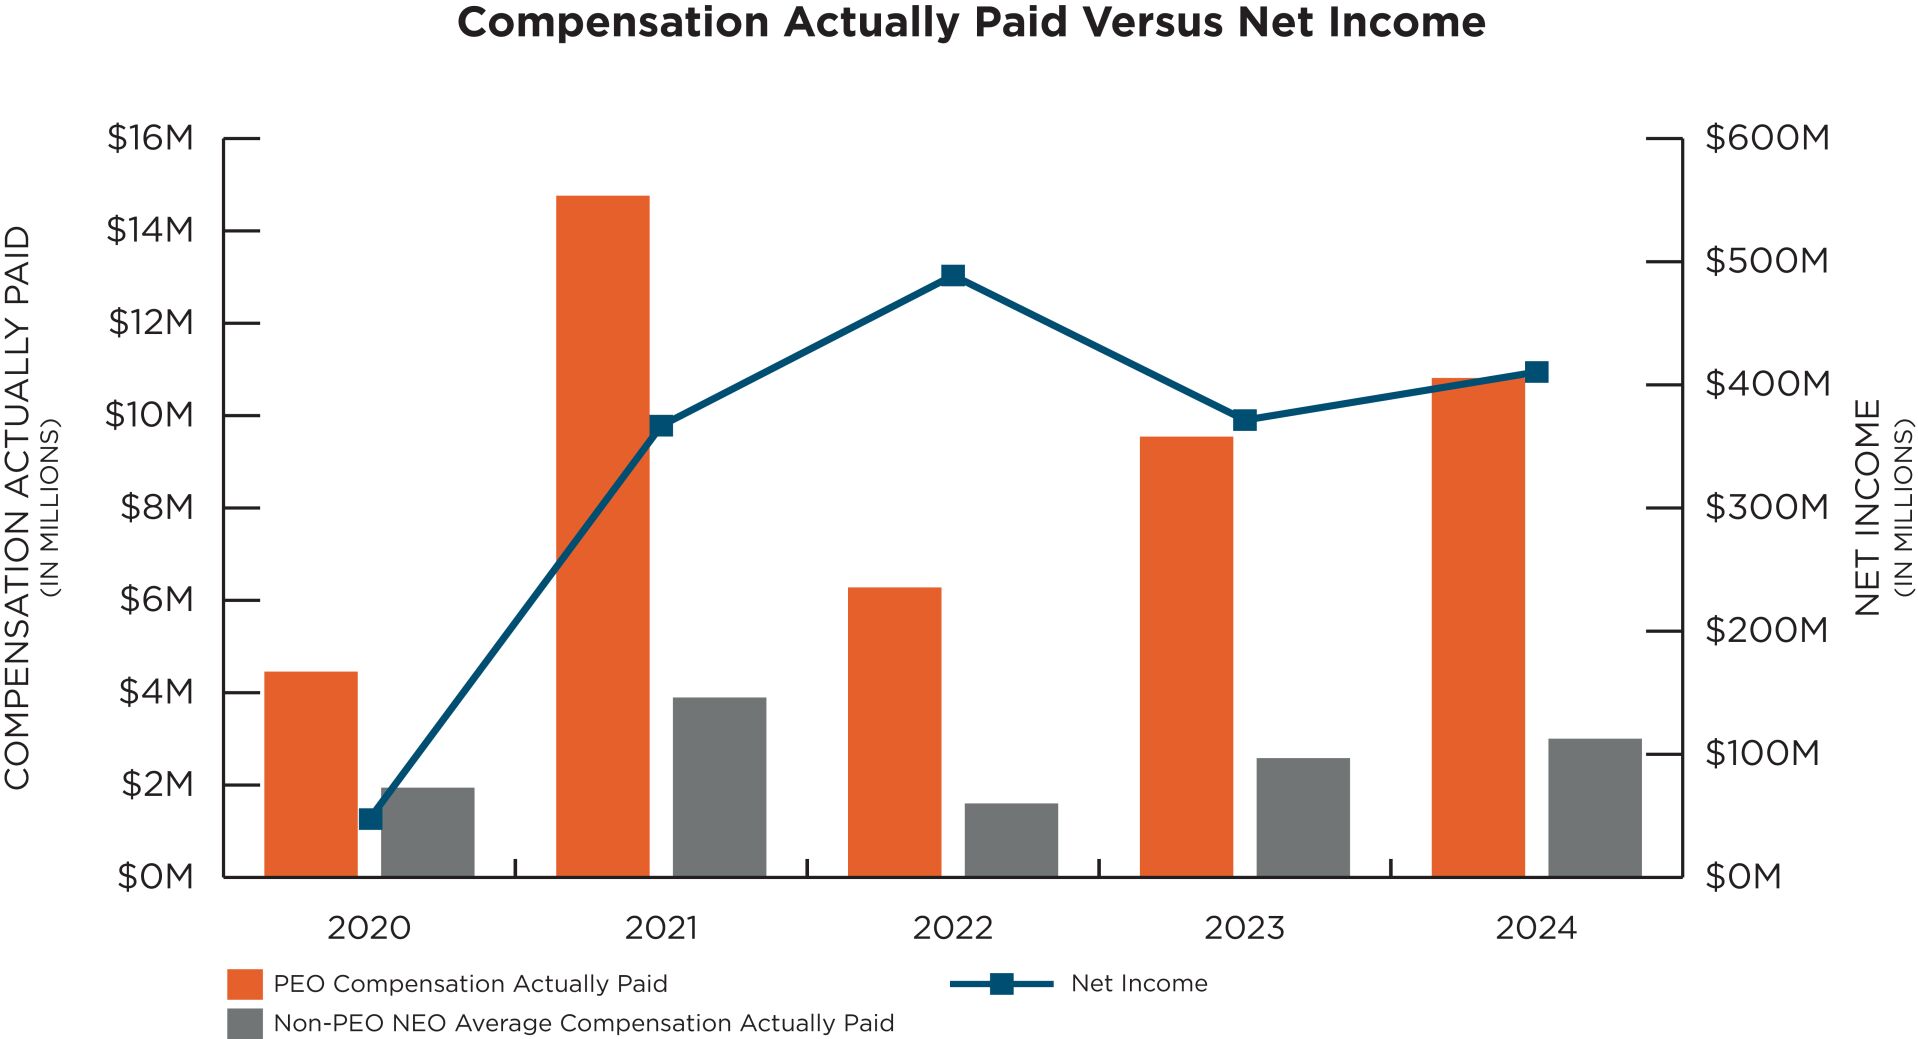
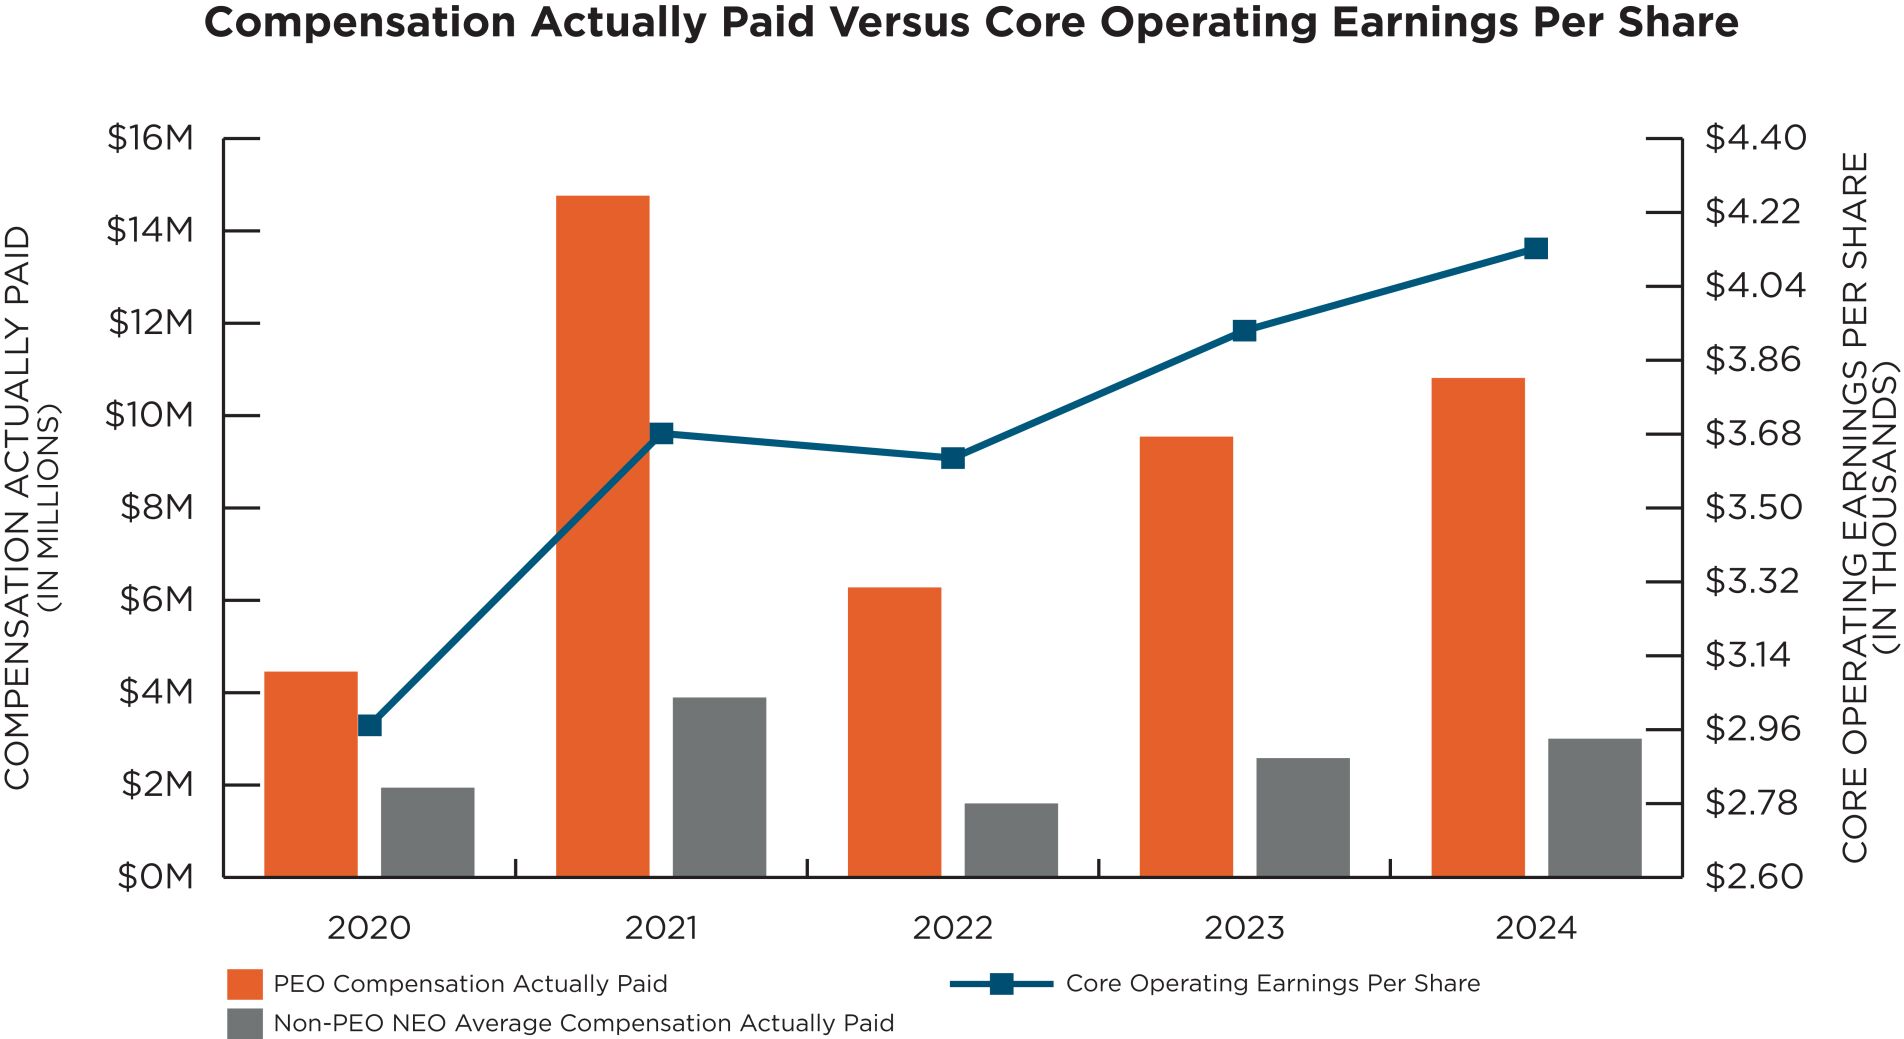
The following tables and discussion summarize the relationship between NEO compensation actually paid (“Compensation
Actually
Paid”) and our financial performance results for our last four completed fiscal years, calculated in the manner required by Item 402(v) of Regulation S-K. The tables and the associated narrative and graphical disclosure should be viewed together for a more complete presentation of such relationship over the time periods presented. The calculations and analysis below do not necessarily reflect the Company’s approach to aligning executive compensation with performance. For information concerning the Company’s compensation philosophy and how the Company aligns executive compensation with financial performance, refer to the Compensation Discussion and Analysis on page 28 of this proxy statement.
Value of Initial Fixed $100 Investment Based On: |
||||||||||||||||||||||||||||||||
Year (1) |
Summary Compensation Table Total for Principal Executive Officer (PEO) |
Compensation Actually Paid to PEO (2)(3) |
Average Summary Compensation Table Total for non-PEO NEOs |
Average Compensation Actually Paid to non-PEO NEOs (2)(3) |
Total Shareholder Return (9) |
Peer Group Total Shareholder Return (9) |
Net Income (in thousands) |
Core Operating Earnings Per Share (10) |
||||||||||||||||||||||||
2024 |
$9,559,263 | $10,808,053 | (4) |
$2,713,582 | $3,048,249 | (4) |
$144.74 | $136.97 | $409,840 | $4.13 | ||||||||||||||||||||||
2023 |
$9,269,035 | $9,530,042 | (5) |
$2,479,595 | $2,586,810 | (5) |
$125.99 | $117.03 | $370,867 | $3.93 (11) |
||||||||||||||||||||||
2022 |
$8,649,788 | $6,276,760 | (6) |
$2,291,627 | $1,608,823 | (6) |
$112.72 | $104.46 | $488,035 | $3.62 (11) |
||||||||||||||||||||||
2021 |
$7,026,315 | $14,742,502 | (7) |
$2,374,789 | $3,894,473 | (7) |
$130.41 | $119.43 | $366,288 | $3.68 | ||||||||||||||||||||||
2020 |
$4,944,744 | $4,451,284 | (8) |
$2,138,002 | $1,942,653 | (8) |
$76.09 | $72.36 | $47,317 | $2.97 | ||||||||||||||||||||||
(1) NEOs included in the above compensation columns reflect the following:
Year |
PEO |
Non-PEOs | ||||||
2024 |
Ms. Palmer |
Mr. Stein, Mr. Mas, Mr. Roth and Mr. Wibbenmeyer | ||||||
2023 |
Ms. Palmer |
Mr. Stein, Mr. Mas, Mr. Roth and Mr. Wibbenmeyer | ||||||
2022 |
Ms. Palmer |
Mr. Stein, Mr. Mas, Mr. James D. Thompson, and Mr. Roth | ||||||
2021 |
Ms. Palmer |
Mr. Stein, Mr. Mas, Mr. James D. Thompson, and Mr. Dan M. Chandler | ||||||
2020 |
Ms. Palmer |
Mr. Stein, Mr. Mas, Mr. James D. Thompson, and Mr. Dan M. Chandler | ||||||
(2) The dollar amounts reported represent the amount of “Compensation Actually Paid”, as computed in accordance with SEC rules, but do not reflect the actual amount of compensation received by our PEO (CEO) or other NEOs during the applicable year. Fair value or change in fair value, as applicable, of equity awards in the “Compensation Actually Paid” columns was determined by reference to (a) for restricted share awards (excluding performance share awards), closing price on applicable year-end date(s) or, in the case of vesting dates, the actual vesting price, (b) for performance share awards that are not market based, the same valuation methodology as restricted share awards above except year-end values are multiplied times the probability of achievement as of each such date, and (c) for market-based performance share awards the fair value calculated by a Monte Carlo simulation model as of the applicable year-end dates.
(3) For the portion of “Compensation Actually Paid” that is based on year-end stock prices, the following prices were used: $73.93, $67.00, $62.50, $75.35, $45.59, and $63.09 for year-end 2024, 2023, 2022, 2021, 2020, and 2019, respectively.
(4) 2024 “Compensation Actually Paid” to Ms. Palmer and the average “
Compensation
Actually
Paid” to non-PEOs reflects the following adjustments from Total Compensation reported in the Summary Compensation Table: PEO |
Average Non-PEO |
|||||||
Total Reported in 2024 Summary Compensation Table (SCT) |
$9,559,263 |
$2,713,582 |
||||||
Less, value of Stock Awards reported in SCT |
($5,702,941 | ) | ($1,295,055 | ) | ||||
Plus, Year-End value of Awards Granted in Fiscal Year that are Unvested and Outstanding |
$7,340,943 | $1,667,006 | ||||||
Plus, Change in Fair Value of Prior Year awards that are Outstanding and Unvested |
$185,673 | $52,457 | ||||||
Plus, FMV of Awards Granted this Year and that Vested this Year |
$0 | $0 | ||||||
Plus, Change in Fair Value (from prior year-end) of Prior Year awards that Vested this year |
($574,885 | ) | ($89,740 | ) | ||||
Less Prior Year Fair Value of Prior Year awards that Failed to vest this year |
$0 | $0 | ||||||
Total Adjustments |
$1,248,790 | $334,667 | ||||||
Compensation Actually Paid for Fiscal Year 2024 |
$10,808,053 |
$3,048,249 |
||||||
(5) 2023 “Compensation Actually Paid” to Ms. Palmer and the average “Compensation Actually Paid” to non-PEOs reflects the following adjustments from Total Compensation reported in the Summary Compensation Table:
PEO |
Average Non-PEO |
|||||||
Total Reported in 2023 Summary Compensation Table (SCT) |
$9,269,035 |
$2,479,595 |
||||||
Less, value of Stock Awards reported in SCT |
($5,536,918 | ) | ($1,265,942 | ) | ||||
Plus, Year-End value of Awards Granted in Fiscal Year that are Unvested and Outstanding |
$5,517,908 | $1,263,196 | ||||||
Plus, Change in Fair Value of Prior Year awards that are Outstanding and Unvested |
$216,704 | $72,835 | ||||||
Plus, FMV of Awards Granted this Year and that Vested this Year |
$0 | $0 | ||||||
Plus, Change in Fair Value (from prior year-end) of Prior Year awards that Vested this year |
$63,313 | $37,126 | ||||||
Less Prior Year Fair Value of Prior Year awards that Failed to vest this year |
$0 | $0 | ||||||
Total Adjustments |
$261,007 | $107,215 | ||||||
Compensation Actually Paid for Fiscal Year 2023 |
$9,530,042 |
$2,586,810 |
||||||
(6) 2022 “Compensation Actually Paid” to Ms. Palmer and the average “Compensation Actually Paid” to non-PEOs reflects the following adjustments from Total Compensation reported in the Summary Compensation Table:
PEO |
Average Non-PEO |
|||||||
Total Reported in 2022 Summary Compensation Table (SCT) |
$8,649,788 |
$2,291,627 |
||||||
Less, value of Stock Awards reported in SCT |
($5,184,152 | ) | ($1,212,490 | ) | ||||
Plus, Year-End value of Awards Granted in Fiscal Year that are Unvested and Outstanding |
$4,567,311 | $1,085,215 | ||||||
Plus, Change in Fair Value of Prior Year awards that are Outstanding and Unvested |
($1,288,996 | ) | ($384,424 | ) | ||||
Plus, FMV of Awards Granted this Year and that Vested this Year |
$0 | $0 | ||||||
Plus, Change in Fair Value (from prior year-end) of Prior Year awards that Vested this year |
($467,191 | ) | ($171,104 | ) | ||||
Less Prior Year Fair Value of Prior Year awards that Failed to vest this year |
$0 | $0 | ||||||
Total Adjustments |
($2,373,028 | ) | ($682,803 | ) | ||||
Compensation Actually Paid for Fiscal Year 2022 |
$6,276,760 |
$1,608,823 |
||||||
(7) 2021 compensation “Actually Paid” to Ms. Palmer and the average Actually Paid to non-PEOs reflects the following adjustments from Total Compensation reported in the Summary Compensation Table:
PEO |
Average Non-PEO |
|||||||
Total Reported in 2021 Summary Compensation Table (SCT) |
$7,026,315 |
$2,374,789 |
||||||
Less, value of Stock Awards reported in SCT |
($3,950,257 | ) | ($1,420,337 | ) | ||||
Plus, Year-End value of Awards Granted in Fiscal Year that are Unvested and Outstanding |
$7,830,287 | $2,153,181 | ||||||
Plus, Change in Fair Value of Prior Year awards that are Outstanding and Unvested |
$2,664,658 | $790,463 | ||||||
Plus, FMV of Awards Granted this Year and that Vested this Year |
$0 | $0 | ||||||
Plus, Change in Fair Value (from prior year-end) of Prior Year awards that Vested this year |
$1,171,500 | $608,353 | ||||||
Less Prior Year Fair Value of Prior Year awards that Failed to vest this year |
$0 | ($611,977 | ) | |||||
Total Adjustments |
$7,716,187 | $1,519,684 | ||||||
Compensation Actually Paid for Fiscal Year 2021 |
$14,742,502 |
$3,894,473 |
||||||
(8) 2020 compensation “Actually Paid” to Ms. Palmer and the average Actually Paid to non-PEOs reflects the following adjustments from Total Compensation reported in the Summary Compensation Table:
PEO |
Average Non-PEO |
|||||||
Total Reported in 2020 Summary Compensation Table (SCT) |
$4,944,744 |
$2,138,002 |
||||||
Less, value of Stock Awards reported in SCT |
($3,588,410 | ) | ($1,332,018 | ) | ||||
Plus, Year-End value of Awards Granted in Fiscal Year that are Unvested and Outstanding |
$2,811,435 | $1,043,604 | ||||||
Plus, Change in Fair Value of Prior Year awards that are Outstanding and Unvested |
$56,637 | ($40,231 | ) | |||||
Plus, FMV of Awards Granted this Year and that Vested this Year |
$0 | $0 | ||||||
Plus, Change in Fair Value (from prior year-end) of Prior Year awards that Vested this year |
$226,878 | $133,297 | ||||||
Less Prior Year Fair Value of Prior Year awards that Failed to vest this year |
$0 | $0 | ||||||
Total Adjustments |
($493,460 | ) | ($195,349 | ) | ||||
Compensation Actually Paid for Fiscal Year 2020 |
$4,451,284 |
$1,942,653 |
||||||
(9) Peer group Total Shareholder Return reflects the FTSE Nareit
Shopping
Center Index. Each year reflects what the cumulative value of $100 would be, including reinvestment of dividends, if such amount were invested on December 31, 2019. (10) Core Operating Earnings per Share is a
non-GAAP
financial measure. See Appendix A for reconciliations of GAAP to non-GAAP financial
measures. (11) For 2023 and 2022, Adjusted Core Operating Earnings Per Share was utilized as the Company’s Selected Measure, to
eliminate
the impact of COVID-related collections and/or prior period recoveries. See Appendix A for reconciliations of GAAP to non-GAAP financial measures. Year |
PEO |
Non-PEOs | ||||||
2024 |
Ms. Palmer |
Mr. Stein, Mr. Mas, Mr. Roth and Mr. Wibbenmeyer | ||||||
2023 |
Ms. Palmer |
Mr. Stein, Mr. Mas, Mr. Roth and Mr. Wibbenmeyer | ||||||
2022 |
Ms. Palmer |
Mr. Stein, Mr. Mas, Mr. James D. Thompson, and Mr. Roth | ||||||
2021 |
Ms. Palmer |
Mr. Stein, Mr. Mas, Mr. James D. Thompson, and Mr. Dan M. Chandler | ||||||
2020 |
Ms. Palmer |
Mr. Stein, Mr. Mas, Mr. James D. Thompson, and Mr. Dan M. Chandler | ||||||
(9) Peer group Total Shareholder Return reflects the FTSE Nareit
Shopping
Center Index. Each year reflects what the cumulative value of $100 would be, including reinvestment of dividends, if such amount were invested on December 31, 2019. (4) 2024 “Compensation Actually Paid” to Ms. Palmer and the average “
Compensation
Actually
Paid” to non-PEOs reflects the following adjustments from Total Compensation reported in the Summary Compensation Table: PEO |
Average Non-PEO |
|||||||
Total Reported in 2024 Summary Compensation Table (SCT) |
$9,559,263 |
$2,713,582 |
||||||
Less, value of Stock Awards reported in SCT |
($5,702,941 | ) | ($1,295,055 | ) | ||||
Plus, Year-End value of Awards Granted in Fiscal Year that are Unvested and Outstanding |
$7,340,943 | $1,667,006 | ||||||
Plus, Change in Fair Value of Prior Year awards that are Outstanding and Unvested |
$185,673 | $52,457 | ||||||
Plus, FMV of Awards Granted this Year and that Vested this Year |
$0 | $0 | ||||||
Plus, Change in Fair Value (from prior year-end) of Prior Year awards that Vested this year |
($574,885 | ) | ($89,740 | ) | ||||
Less Prior Year Fair Value of Prior Year awards that Failed to vest this year |
$0 | $0 | ||||||
Total Adjustments |
$1,248,790 | $334,667 | ||||||
Compensation Actually Paid for Fiscal Year 2024 |
$10,808,053 |
$3,048,249 |
||||||
(5) 2023 “Compensation Actually Paid” to Ms. Palmer and the average “Compensation Actually Paid” to non-PEOs reflects the following adjustments from Total Compensation reported in the Summary Compensation Table:
PEO |
Average Non-PEO |
|||||||
Total Reported in 2023 Summary Compensation Table (SCT) |
$9,269,035 |
$2,479,595 |
||||||
Less, value of Stock Awards reported in SCT |
($5,536,918 | ) | ($1,265,942 | ) | ||||
Plus, Year-End value of Awards Granted in Fiscal Year that are Unvested and Outstanding |
$5,517,908 | $1,263,196 | ||||||
Plus, Change in Fair Value of Prior Year awards that are Outstanding and Unvested |
$216,704 | $72,835 | ||||||
Plus, FMV of Awards Granted this Year and that Vested this Year |
$0 | $0 | ||||||
Plus, Change in Fair Value (from prior year-end) of Prior Year awards that Vested this year |
$63,313 | $37,126 | ||||||
Less Prior Year Fair Value of Prior Year awards that Failed to vest this year |
$0 | $0 | ||||||
Total Adjustments |
$261,007 | $107,215 | ||||||
Compensation Actually Paid for Fiscal Year 2023 |
$9,530,042 |
$2,586,810 |
||||||
(6) 2022 “Compensation Actually Paid” to Ms. Palmer and the average “Compensation Actually Paid” to non-PEOs reflects the following adjustments from Total Compensation reported in the Summary Compensation Table:
PEO |
Average Non-PEO |
|||||||
Total Reported in 2022 Summary Compensation Table (SCT) |
$8,649,788 |
$2,291,627 |
||||||
Less, value of Stock Awards reported in SCT |
($5,184,152 | ) | ($1,212,490 | ) | ||||
Plus, Year-End value of Awards Granted in Fiscal Year that are Unvested and Outstanding |
$4,567,311 | $1,085,215 | ||||||
Plus, Change in Fair Value of Prior Year awards that are Outstanding and Unvested |
($1,288,996 | ) | ($384,424 | ) | ||||
Plus, FMV of Awards Granted this Year and that Vested this Year |
$0 | $0 | ||||||
Plus, Change in Fair Value (from prior year-end) of Prior Year awards that Vested this year |
($467,191 | ) | ($171,104 | ) | ||||
Less Prior Year Fair Value of Prior Year awards that Failed to vest this year |
$0 | $0 | ||||||
Total Adjustments |
($2,373,028 | ) | ($682,803 | ) | ||||
Compensation Actually Paid for Fiscal Year 2022 |
$6,276,760 |
$1,608,823 |
||||||
(7) 2021 compensation “Actually Paid” to Ms. Palmer and the average Actually Paid to non-PEOs reflects the following adjustments from Total Compensation reported in the Summary Compensation Table:
PEO |
Average Non-PEO |
|||||||
Total Reported in 2021 Summary Compensation Table (SCT) |
$7,026,315 |
$2,374,789 |
||||||
Less, value of Stock Awards reported in SCT |
($3,950,257 | ) | ($1,420,337 | ) | ||||
Plus, Year-End value of Awards Granted in Fiscal Year that are Unvested and Outstanding |
$7,830,287 | $2,153,181 | ||||||
Plus, Change in Fair Value of Prior Year awards that are Outstanding and Unvested |
$2,664,658 | $790,463 | ||||||
Plus, FMV of Awards Granted this Year and that Vested this Year |
$0 | $0 | ||||||
Plus, Change in Fair Value (from prior year-end) of Prior Year awards that Vested this year |
$1,171,500 | $608,353 | ||||||
Less Prior Year Fair Value of Prior Year awards that Failed to vest this year |
$0 | ($611,977 | ) | |||||
Total Adjustments |
$7,716,187 | $1,519,684 | ||||||
Compensation Actually Paid for Fiscal Year 2021 |
$14,742,502 |
$3,894,473 |
||||||
(8) 2020 compensation “Actually Paid” to Ms. Palmer and the average Actually Paid to non-PEOs reflects the following adjustments from Total Compensation reported in the Summary Compensation Table:
PEO |
Average Non-PEO |
|||||||
Total Reported in 2020 Summary Compensation Table (SCT) |
$4,944,744 |
$2,138,002 |
||||||
Less, value of Stock Awards reported in SCT |
($3,588,410 | ) | ($1,332,018 | ) | ||||
Plus, Year-End value of Awards Granted in Fiscal Year that are Unvested and Outstanding |
$2,811,435 | $1,043,604 | ||||||
Plus, Change in Fair Value of Prior Year awards that are Outstanding and Unvested |
$56,637 | ($40,231 | ) | |||||
Plus, FMV of Awards Granted this Year and that Vested this Year |
$0 | $0 | ||||||
Plus, Change in Fair Value (from prior year-end) of Prior Year awards that Vested this year |
$226,878 | $133,297 | ||||||
Less Prior Year Fair Value of Prior Year awards that Failed to vest this year |
$0 | $0 | ||||||
Total Adjustments |
($493,460 | ) | ($195,349 | ) | ||||
Compensation Actually Paid for Fiscal Year 2020 |
$4,451,284 |
$1,942,653 |
||||||
(4) 2024 “Compensation Actually Paid” to Ms. Palmer and the average “
Compensation
Actually
Paid” to non-PEOs reflects the following adjustments from Total Compensation reported in the Summary Compensation Table: PEO |
Average Non-PEO |
|||||||
Total Reported in 2024 Summary Compensation Table (SCT) |
$9,559,263 |
$2,713,582 |
||||||
Less, value of Stock Awards reported in SCT |
($5,702,941 | ) | ($1,295,055 | ) | ||||
Plus, Year-End value of Awards Granted in Fiscal Year that are Unvested and Outstanding |
$7,340,943 | $1,667,006 | ||||||
Plus, Change in Fair Value of Prior Year awards that are Outstanding and Unvested |
$185,673 | $52,457 | ||||||
Plus, FMV of Awards Granted this Year and that Vested this Year |
$0 | $0 | ||||||
Plus, Change in Fair Value (from prior year-end) of Prior Year awards that Vested this year |
($574,885 | ) | ($89,740 | ) | ||||
Less Prior Year Fair Value of Prior Year awards that Failed to vest this year |
$0 | $0 | ||||||
Total Adjustments |
$1,248,790 | $334,667 | ||||||
Compensation Actually Paid for Fiscal Year 2024 |
$10,808,053 |
$3,048,249 |
||||||
(5) 2023 “Compensation Actually Paid” to Ms. Palmer and the average “Compensation Actually Paid” to non-PEOs reflects the following adjustments from Total Compensation reported in the Summary Compensation Table:
PEO |
Average Non-PEO |
|||||||
Total Reported in 2023 Summary Compensation Table (SCT) |
$9,269,035 |
$2,479,595 |
||||||
Less, value of Stock Awards reported in SCT |
($5,536,918 | ) | ($1,265,942 | ) | ||||
Plus, Year-End value of Awards Granted in Fiscal Year that are Unvested and Outstanding |
$5,517,908 | $1,263,196 | ||||||
Plus, Change in Fair Value of Prior Year awards that are Outstanding and Unvested |
$216,704 | $72,835 | ||||||
Plus, FMV of Awards Granted this Year and that Vested this Year |
$0 | $0 | ||||||
Plus, Change in Fair Value (from prior year-end) of Prior Year awards that Vested this year |
$63,313 | $37,126 | ||||||
Less Prior Year Fair Value of Prior Year awards that Failed to vest this year |
$0 | $0 | ||||||
Total Adjustments |
$261,007 | $107,215 | ||||||
Compensation Actually Paid for Fiscal Year 2023 |
$9,530,042 |
$2,586,810 |
||||||
(6) 2022 “Compensation Actually Paid” to Ms. Palmer and the average “Compensation Actually Paid” to non-PEOs reflects the following adjustments from Total Compensation reported in the Summary Compensation Table:
PEO |
Average Non-PEO |
|||||||
Total Reported in 2022 Summary Compensation Table (SCT) |
$8,649,788 |
$2,291,627 |
||||||
Less, value of Stock Awards reported in SCT |
($5,184,152 | ) | ($1,212,490 | ) | ||||
Plus, Year-End value of Awards Granted in Fiscal Year that are Unvested and Outstanding |
$4,567,311 | $1,085,215 | ||||||
Plus, Change in Fair Value of Prior Year awards that are Outstanding and Unvested |
($1,288,996 | ) | ($384,424 | ) | ||||
Plus, FMV of Awards Granted this Year and that Vested this Year |
$0 | $0 | ||||||
Plus, Change in Fair Value (from prior year-end) of Prior Year awards that Vested this year |
($467,191 | ) | ($171,104 | ) | ||||
Less Prior Year Fair Value of Prior Year awards that Failed to vest this year |
$0 | $0 | ||||||
Total Adjustments |
($2,373,028 | ) | ($682,803 | ) | ||||
Compensation Actually Paid for Fiscal Year 2022 |
$6,276,760 |
$1,608,823 |
||||||
(7) 2021 compensation “Actually Paid” to Ms. Palmer and the average Actually Paid to non-PEOs reflects the following adjustments from Total Compensation reported in the Summary Compensation Table:
PEO |
Average Non-PEO |
|||||||
Total Reported in 2021 Summary Compensation Table (SCT) |
$7,026,315 |
$2,374,789 |
||||||
Less, value of Stock Awards reported in SCT |
($3,950,257 | ) | ($1,420,337 | ) | ||||
Plus, Year-End value of Awards Granted in Fiscal Year that are Unvested and Outstanding |
$7,830,287 | $2,153,181 | ||||||
Plus, Change in Fair Value of Prior Year awards that are Outstanding and Unvested |
$2,664,658 | $790,463 | ||||||
Plus, FMV of Awards Granted this Year and that Vested this Year |
$0 | $0 | ||||||
Plus, Change in Fair Value (from prior year-end) of Prior Year awards that Vested this year |
$1,171,500 | $608,353 | ||||||
Less Prior Year Fair Value of Prior Year awards that Failed to vest this year |
$0 | ($611,977 | ) | |||||
Total Adjustments |
$7,716,187 | $1,519,684 | ||||||
Compensation Actually Paid for Fiscal Year 2021 |
$14,742,502 |
$3,894,473 |
||||||
(8) 2020 compensation “Actually Paid” to Ms. Palmer and the average Actually Paid to non-PEOs reflects the following adjustments from Total Compensation reported in the Summary Compensation Table:
PEO |
Average Non-PEO |
|||||||
Total Reported in 2020 Summary Compensation Table (SCT) |
$4,944,744 |
$2,138,002 |
||||||
Less, value of Stock Awards reported in SCT |
($3,588,410 | ) | ($1,332,018 | ) | ||||
Plus, Year-End value of Awards Granted in Fiscal Year that are Unvested and Outstanding |
$2,811,435 | $1,043,604 | ||||||
Plus, Change in Fair Value of Prior Year awards that are Outstanding and Unvested |
$56,637 | ($40,231 | ) | |||||
Plus, FMV of Awards Granted this Year and that Vested this Year |
$0 | $0 | ||||||
Plus, Change in Fair Value (from prior year-end) of Prior Year awards that Vested this year |
$226,878 | $133,297 | ||||||
Less Prior Year Fair Value of Prior Year awards that Failed to vest this year |
$0 | $0 | ||||||
Total Adjustments |
($493,460 | ) | ($195,349 | ) | ||||
Compensation Actually Paid for Fiscal Year 2020 |
$4,451,284 |
$1,942,653 |
||||||
(1) See footnote (9) in Pay Versus Performance Table.
The following unranked list of
performance
measures reflects the Company’s most important performance measures used by our Company to link Compensation Actually Paid for fiscal 2024 to our performance. Each of these financial performance measures is further described and defined in the Compensation Discussion and Analysis section of this proxy statement. Most Important Performance Measures for 2024
Core Operating Earnings Per Share (Company-Selected Measure) |
Corporate Responsibility Objectives |
Relative Total Shareholder Return |
(10) Core Operating Earnings per Share is a
non-GAAP
financial measure. See Appendix A for reconciliations of GAAP to non-GAAP financial
measures. (11) For 2023 and 2022, Adjusted Core Operating Earnings Per Share was utilized as the Company’s Selected Measure, to
eliminate
the impact of COVID-related collections and/or prior period recoveries. See Appendix A for reconciliations of GAAP to non-GAAP financial measures.