Pay vs Performance Disclosure - USD ($)
|
12 Months Ended |
Dec. 31, 2023 |
Dec. 31, 2022 |
Dec. 31, 2021 |
| Pay vs Performance Disclosure [Table] |
|
|
|
|
| Pay vs Performance [Table Text Block] |
|
| | |
| | |
| | |
| | |
| | |
Value Of Initial Fixed $100 Investment Based On: | | |
| |
| | |
Summary Compensation Table Total for CEO(1)(2) ($) | | |
Compensation Actually Paid to CEO(1)(2) ($) | | |
Average Summary Compensation Table Total for Other NEOs(1)(2) ($) | | |
Average Compensation Actually Paid to Other NEOs(1)(2) ($) | | |
Total Shareholder Return(3) ($) | | |
Net Loss
($ in thousands) | |
| 2023 | |
| 888,803 | | |
| 948,303 | | |
| 2,099,175 | | |
| 2,820,243 | | |
| 105.61 | | |
| (17,839 | ) |
| 2022 | |
| 255,000 | | |
| 255,000 | | |
| 1,078,398 | | |
| 441,541 | | |
| 29.71 | | |
| (45,021 | ) |
| 2021 | |
| 180,000 | | |
| 180,000 | | |
| 5,862,099 | | |
| 1,211,572 | | |
| 59.26 | | |
| (61,324 | ) |
|
|
|
| Total Compensation From SCT, CEO |
[1],[2] |
$ 888,803
|
$ 255,000
|
$ 180,000
|
| Compensation Actually Paid, CEO |
[1],[2] |
948,303
|
255,000
|
180,000
|
| Total Compensation From SCT, Average of Other NEO |
[1],[2] |
2,099,175
|
1,078,398
|
5,862,099
|
| Compensation Actually Paid, Average of Other NEO |
[1],[2] |
$ 2,820,243
|
441,541
|
1,211,572
|
| Equity Valuation Assumption Difference, Footnote [Text Block] |
|
| Adjustments | |
CEO ($) | | |
Average of Other NEOs ($) | | |
CEO ($) | | |
Average of Other NEOs ($) | | |
CEO ($) | | |
Average of Other NEOs ($) | |
| | |
2023 | | |
2022 | | |
2021 | |
| Adjustments | |
CEO ($) | | |
Average of Other NEOs ($) | | |
CEO ($) | | |
Average of Other NEOs ($) | | |
CEO ($) | | |
Average of Other NEOs ($) | |
| Total Compensation From SCT | |
| 888,803 | | |
| 2,099,175 | | |
| 255,000 | | |
| 1,078,398 | | |
| 180,000 | | |
| 5,862,099 | |
| Adjustments for defined benefit and actuarial pension plans: | |
| — | | |
| — | | |
| — | | |
| — | | |
| — | | |
| — | |
| Adjustments for stock awards: | |
| | | |
| | | |
| | | |
| | | |
| | | |
| | |
| (Subtraction): SCT amounts | |
| (355,000 | ) | |
| (1,502,169 | ) | |
| — | | |
| (717,613 | ) | |
| — | | |
| (5,483,557 | ) |
| Addition: Fair value at year-end of awards granted during the covered fiscal year that are outstanding and unvested at year-end | |
| 414,500 | | |
| 2,288,006 | | |
| — | | |
| 417,100 | | |
| — | | |
| 602,269 | |
| Addition (Subtraction): Year-over-year change in fair value of awards granted in any prior fiscal year that are outstanding and unvested at year-end | |
| — | | |
| 11,906 | | |
| — | | |
| (131,256 | ) | |
| — | | |
| — | |
| Addition: Vesting date fair value of awards granted and vesting during such year | |
| — | | |
| — | | |
| — | | |
| 57,563 | | |
| — | | |
| 230,761 | |
| Addition (Subtraction): Change as of the vesting date (from the end of the prior fiscal year) in fair value of awards granted in any prior fiscal year for which vesting conditions were satisfied during such year | |
| — | | |
| 39,169 | | |
| — | | |
| (262,651 | ) | |
| — | | |
| — | |
| (Subtraction): Fair value at end of prior year of awards granted in any prior fiscal year that fail to meet the applicable vesting conditions during such year | |
| — | | |
| (115,844 | ) | |
| — | | |
| — | | |
| — | | |
| — | |
| Addition: Dividends or other earnings paid on stock or option awards in the covered year prior to vesting if not otherwise included in the total compensation for the covered year | |
| — | | |
| — | | |
| — | | |
| — | | |
| — | | |
| — | |
| Adjustments for stock awards | |
| — | | |
| — | | |
| — | | |
| — | | |
| — | | |
| — | |
| Compensation Actually Paid (as calculated) | |
| 948,303 | | |
| 2,820,243 | | |
| 255,000 | | |
| 441,541 | | |
| 180,000 | | |
| 1,211,572 | |
|
|
|
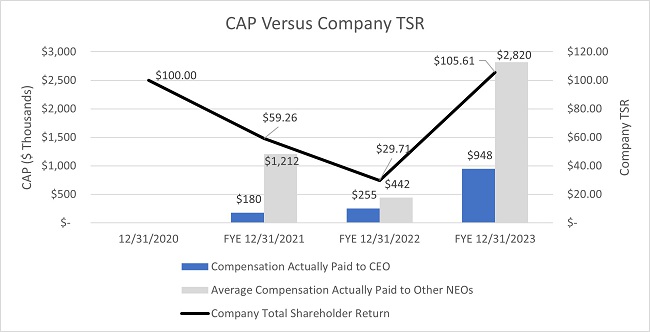
| Compensation Actually Paid vs. Total Shareholder Return [Text Block] |
|
|
|
|
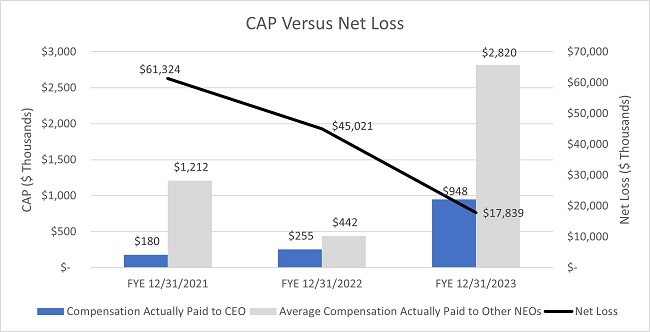
| Compensation Actually Paid vs. Net Income [Text Block] |
|
Changes
in Compensation actually paid to our NEOs from year to year are generally aligned with trends in our cumulative TSR, as well as trends
in important financial measures such as net loss.
|
|
|
| Total Shareholder Return Amount |
[3] |
$ 105.61
|
29.71
|
59.26
|
| Net Income (Loss) Attributable to Parent |
|
$ (17,839)
|
$ (45,021)
|
$ (61,324)
|
| CEO name |
|
Mr. Schreiber
|
Mr. Schreiber
|
Mr. Schreiber
|
| PEO [Member] | Adjustments for Defined Benefit and Actuarial Pension Plans [Member] |
|
|
|
|
| Pay vs Performance Disclosure [Table] |
|
|
|
|
| Adjustments for stock awards |
|
|
|
|
| PEO [Member] | SCT Amounts [Member] |
|
|
|
|
| Pay vs Performance Disclosure [Table] |
|
|
|
|
| Adjustments for stock awards |
|
(355,000)
|
|
|
| PEO [Member] | Fair Value at Year-end of Awards Granted during Covered Fiscal Year that are Outstanding and Unvested at Year-end [Member] |
|
|
|
|
| Pay vs Performance Disclosure [Table] |
|
|
|
|
| Adjustments for stock awards |
|
414,500
|
|
|
| PEO [Member] | Year-Over-Year Change in Fair Value of Awards Granted in Any Prior Fiscal Year that are Outstanding and Unvested at Year-end [Member] |
|
|
|
|
| Pay vs Performance Disclosure [Table] |
|
|
|
|
| Adjustments for stock awards |
|
|
|
|
| PEO [Member] | Vesting Date Fair Value of Awards Granted and Vesting during such Year [Member] |
|
|
|
|
| Pay vs Performance Disclosure [Table] |
|
|
|
|
| Adjustments for stock awards |
|
|
|
|
| PEO [Member] | Change as of Vesting Date in Fair Value of Awards Granted in any Prior Fiscal Year for which Vesting Conditions were Satisfied during such Year [Member] |
|
|
|
|
| Pay vs Performance Disclosure [Table] |
|
|
|
|
| Adjustments for stock awards |
|
|
|
|
| PEO [Member] | Fair Value at End of Prior Year of Awards Granted in any Prior Fiscal Year that Fail to Meet Applicable Vesting Conditions during such Year [Member] |
|
|
|
|
| Pay vs Performance Disclosure [Table] |
|
|
|
|
| Adjustments for stock awards |
|
|
|
|
| PEO [Member] | Dividends or Other Earnings Paid on Stock or Option Awards in Covered Year Prior to Vesting if not Otherwise included in Total Compensation for Covered Year [Member] |
|
|
|
|
| Pay vs Performance Disclosure [Table] |
|
|
|
|
| Adjustments for stock awards |
|
|
|
|
| Non-PEO NEO [Member] | Adjustments for Defined Benefit and Actuarial Pension Plans [Member] |
|
|
|
|
| Pay vs Performance Disclosure [Table] |
|
|
|
|
| Adjustments for stock awards |
|
|
|
|
| Non-PEO NEO [Member] | SCT Amounts [Member] |
|
|
|
|
| Pay vs Performance Disclosure [Table] |
|
|
|
|
| Adjustments for stock awards |
|
(1,502,169)
|
(717,613)
|
(5,483,557)
|
| Non-PEO NEO [Member] | Fair Value at Year-end of Awards Granted during Covered Fiscal Year that are Outstanding and Unvested at Year-end [Member] |
|
|
|
|
| Pay vs Performance Disclosure [Table] |
|
|
|
|
| Adjustments for stock awards |
|
2,288,006
|
417,100
|
602,269
|
| Non-PEO NEO [Member] | Year-Over-Year Change in Fair Value of Awards Granted in Any Prior Fiscal Year that are Outstanding and Unvested at Year-end [Member] |
|
|
|
|
| Pay vs Performance Disclosure [Table] |
|
|
|
|
| Adjustments for stock awards |
|
11,906
|
(131,256)
|
|
| Non-PEO NEO [Member] | Vesting Date Fair Value of Awards Granted and Vesting during such Year [Member] |
|
|
|
|
| Pay vs Performance Disclosure [Table] |
|
|
|
|
| Adjustments for stock awards |
|
|
57,563
|
230,761
|
| Non-PEO NEO [Member] | Change as of Vesting Date in Fair Value of Awards Granted in any Prior Fiscal Year for which Vesting Conditions were Satisfied during such Year [Member] |
|
|
|
|
| Pay vs Performance Disclosure [Table] |
|
|
|
|
| Adjustments for stock awards |
|
39,169
|
(262,651)
|
|
| Non-PEO NEO [Member] | Fair Value at End of Prior Year of Awards Granted in any Prior Fiscal Year that Fail to Meet Applicable Vesting Conditions during such Year [Member] |
|
|
|
|
| Pay vs Performance Disclosure [Table] |
|
|
|
|
| Adjustments for stock awards |
|
(115,844)
|
|
|
| Non-PEO NEO [Member] | Dividends or Other Earnings Paid on Stock or Option Awards in Covered Year Prior to Vesting if not Otherwise included in Total Compensation for Covered Year [Member] |
|
|
|
|
| Pay vs Performance Disclosure [Table] |
|
|
|
|
| Adjustments for stock awards |
|
|
|
|
|
|