Pay vs Performance Disclosure - USD ($)
Feb. 29, 2024
Feb. 28, 2023
Feb. 28, 2022
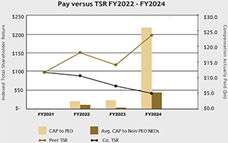
Pay Versus Performance
As required by Section 953(a) of the Dodd-Frank Wall Street Reform and Consumer Protection Act, and Item 402(v) of Regulation S-K (“Item 402(v)”), the Company is providing the following information regarding the relationship between
the
executive “Compensation Actually Paid” as defined in Item 402(v)) (“CAP”) by the Company and the financial performance of the Company over
the applicable time period of the disclosure, calculated in a manner consistent with Item 402(v). For a more comprehensive description of our executive compensation program and the factors used by the Compensation Committee to determine pay for our NEOs, see the “Compensation Discussion and Analysis” section of this Proxy Statement. Accordingly, the table below provides information about CAP for the Company’s Principal Executive Officer (“PEO”) and the average CAP for our non-PEO NEOs alongside certain Company financial metrics during fiscal year 2024 and the two preceding fiscal years. Value of Initial Fixed $100 |
||||||||||||||||
Investment Based on: |
||||||||||||||||
| Fiscal Year Ended |
Summary Compensation Table Total for PEO ($)(1) |
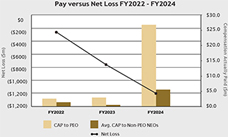
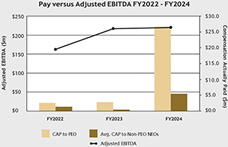
Compensation Actually Paid to PEO ($) |
Average Summary Compensation Table Total for Non-PEO NEOs ($)(2) |
Average Compensation Actually Paid to Non-PEO NEOs ($) |
Total Shareholder Return ($) |
Peer Group Total Shareholder Return ($)(3) |
Net Loss ($ in thousands) |
Adjusted EBITDA ($ in thousands) | ||||||||
| February 29, 2024 |
27,649,449 |
26,733,804 |
4,906,364 |
5,485,810 |
42.70 |
201.60 |
(1,185,079) |
220,333 | ||||||||
| February 28, 2023 |
7,587,609 |
2,865,300 |
3,387,231 |
434,813 |
62.60 |
120.60 |
(720,202) |
217,130 | ||||||||
| February 28, 2022 |
9,363,036 |
2,538,732 |
3,982,531 |
1,374,531 |
90.70 |
154.10 |
(189,914) |
162,479 | ||||||||
1. |
For fiscal year 2024, this is the total compensation, as depicted in the Summary Compensation Table, for Mr. Andrew Appel, our Chief Executive Officer and Principal Executive Officer For the the fiscal years 2023 and 2022, this is the total compensation, as depicted in the Summary Compensation Table, for Mr. Farlekas, our former Chief Executive Officer and Principal Executive Officer. |
2. |
For fiscal year 2024, this is the average total compensation, as depicted in the Summary Compensation Table, for the following executives, Ms. Marje Armstrong, Chief Financial Officer; Ms. Jennifer Grafton, Executive Vice President, General Counsel and Secretary; Mr. Greg Randolph, Chief Commercial Officer; and Mr. Pawan Joshi, Executive Vice President, Product Management & Strategy. For fiscal year 2023, this is the average total compensation as depicted in the Summary Compensation Table, for the following executives, Ms. Marje Armstrong, Chief Financial Officer; Ms. Laura Fese, Former Executive Vice President and General Counsel; Mr. Peter Hantman, Former Chief Opertating Officer; and Mr. Pawan Joshi, Executive Vice President, Product Management & Strategy. For fiscal year 2022, this is the average total compensation as depicted in the Summary Compensation Table, for the following executives, Mr. Jarett Janik, Former Chief Financial Officer; Ms. Laura Fese, Former Executive Vice President and General Counsel; Mr. Peter Hantman, Former Chief Opertating Officer; and Mr. Pawan Joshi, Executive Vice President, Product Management & Strategy. |
3. |
Our total shareholder return assumes the investment of $100 in our common stock on June 15, 2022, the day the units and warrants began trading on the NYSE through and including the end of the fiscal year for which the total shareholder return is depicted. Peer group total shareholder return is based on the weighted-average total shareholder of the respective peer group for each fiscal year. The companies in the fiscal 2024 peer group were American Software, Inc. (AMSWA), Manhattan Associates, Inc. (MANH), ReposiTrak, Inc. (TRAK), SPS Commerce, Inc. (SPCS), Tecsys, Inc. (TCS.TO) and The Descartes Systems Group, Inc. (DSG.TO). The companies in the fiscal 2023 peer group were American Software, Inc. (AMSWA), Manhattan Associates, Inc. (MANH), Park City Group, Inc. (PCYG), SPS Commerce, Inc. (SPCS), Tecsys, Inc. (TCS.TO), The Descartes Systems Group, Inc. (DSG.TO) and TrackX Holdings Inc. (TKX.V). The companies in the fiscal 2022 peer group were American Software, Inc. (AMSWA), Generix SA (GENX.PA), GTY Technology Holdings Inc. (GTYH), Manhattan Associates, Inc. (MANH), Park City Group, Inc. (PCYG), SPS Commerce, Inc. (SPCS), Tecsys, Inc. (TCS.TO), The Descartes Systems Group, Inc. (DSG.TO) and TrackX Holdings Inc. (TKX.V). |
Deductions |
Additions |
|||||||||||||
Fiscal Year Ended |
Year |
Summary |
Amounts Reported in Summary Compensation Table for Stock Awards ($) |
Value of Stock Awards Granted During the Year, Outstanding and Unvested at Fiscal Year- End ($) |
Change in Value of |
Change in |
Compensation | |||||||
Compensation |
Stock |
Value of Stock |
Actually Paid | |||||||||||
Table Total |
Awards Granted in |
Awards |
Total | |||||||||||
($) |
Any |
Granted in Any |
($) | |||||||||||
Prior Year, |
Prior Year, |
|||||||||||||
Outstanding |
Vested During |
|||||||||||||
and Unvested at |
the Fiscal Year |
|||||||||||||
Fiscal |
($) |
|||||||||||||
Year-End |
||||||||||||||
| ($) |
||||||||||||||
| PEO |
February 29, 2024 |
27,649,449 |
(27,265,168) |
26,349,523 |
— |
— |
26,733,804 | |||||||
February 28, 2023 |
7,587,609 |
(3,041,971) |
(328,249) |
(1,055,416) |
(296,673) |
2,865,300 | ||||||||
February 28, 2022 |
9,363,036 |
(3,951,888) |
(1,439,637) |
(1,439,637) |
6,858 |
2,538,732 | ||||||||
| Average Non-PEO NEO |
February 29, 2024 |
4,906,364 |
(2,092,684) |
3,625,563 |
(407,335) |
(546,098) |
5,485,810 | |||||||
February 28, 2023 |
3,387,231 |
(2,024,889) |
(293,623) |
(520,275) |
(113,630) |
434,813 | ||||||||
February 28, 2022 |
3,982,531 |
(1,511,527) |
(557,914) |
(543,362) |
4,802 |
1,374,531 | ||||||||
Tabular List of Most Important Performance Measures
In accordance with the requirements of Item 402(v)(6), we have identified an unranked list of the most important financial performance measures, which represent the most important financial metrics used by the Company to link fiscal 2024 CAP, for our PEO and other NEOs, to Company performance. These metrics are described further under Compensation Discussion and Analysis, specifically under the subheadings “Short-Term Incentive” and “Long-Term Incentive.”
| The Compensation Committee has not historically and does not currently evaluate CAP as calculated pursuant to Item 402(v)(2) as part of its executive compensation determinations; accordingly, the Compensation Committee does not actually use any financial or non-financial performance measures specifically to link NEO CAP to Company performance. All information provided above under the “Pay Versus Performance” heading will not be deemed to be incorporated by reference in any filing of our Company under the Securities Act of 1933, as amended, whether made before or after the date hereof and irrespective of any general incorporation language in any such filing. |
|
Most Important Performance Measures |
|
 |
| |||
| • Adjusted EBITDA • Net Bookings • Organic Revenue Growth |
| |||||||