| Investor Presentation June 2023 |

| 2 Akoya Disclaimer Disclaimer Akoya Biosciences, Inc. (the "Company") has filed a registration statement (including a preliminary prospectus supplement and an accompanying prospectus) with the Securities Exchange Commission ("SEC") for the offering to which this communication relates. Before you invest, you should read the prospectus in that registration statement, including the preliminary prospectus supplement, and other documents the Company has filed with the SEC for more complete information about the issuer and this offering. You may get these documents for free by visiting EDGAR on the SEC Web site at www.sec.gov. Alternatively, copies of the preliminary prospectus supplement and the accompanying prospectus may be obtained by contacting Morgan Stanley & Co. LLC, Attention: Prospectus Department, 180 Varick Street, 2nd Floor, New York, New York 10014, by phone at 1-866-718-1649 or by email at prospectus@morganstanley.com and Piper Sandler & Co., Attention: Prospectus Department, 800 Nicollet Maill J12S03, Minneapolis, Minnesota 55402, by telephone at 1-800-747-3924 or by email at prospectus@psc.com. The registration statement relating to the securities discussed in this presentation has become effective. This presentation shall not constitute an offer to sell, nor shall there be any sale of these securities, in any state or jurisdiction in which such offer, solicitation or sale would be unlawful prior to registration or qualification under the securities laws of any such state or jurisdiction. Cautionary Note Regarding Forward-Looking Statements This presentation includes express and implied “forward-looking statements.” In some cases, you can identify forward-looking statements by terms such as “ anticipate,” “estimate,” “expect,”“ intend,”“ may,”“ might,”“ plan,”“ project,”“ will,”“ would,”“ should,”“ could,” “can,”“ predict,”“ potential,”“ or the negative of these terms, and similar expressions intended to identify forward-looking statements However, not all forward-looking statements contain these identifying words These statements may relate to our strategic plans or objectives, revenues or earnings projections, or other financial items. By their nature, these statements are subject to numerous uncertainties, including factors beyond our control, that could cause actual results, performance or achievement to differ materially and adversely from those anticipated or implied in the statements You should not rely upon forward-looking statements as predictions of future events. Although our management believes that the expectations reflected in our statements are reasonable, we cannot guarantee that the future results, levels of activity, performance or events and circumstances described in the forward-looking statements will be achieved or occur. Moreover, neither we, nor any other person, assumes responsibility for the accuracy and completeness of these statements Recipients are cautioned not to place undue reliance on these forward-looking statements, which speak only as of the date such statements are made and should not be construed as statements of fact. We undertake no obligation to update these forward-looking statements to reflect events or circumstances after the date hereof, or to reflect the occurrence of unanticipated events. Market Industry Data Projections, estimates, industry data and information contained in this presentation, including the Company’s general expectations and market position and market opportunity, are based on information from third-party sources and management estimates Although the Company believes that its third-party sources are reliable, the Company cannot guarantee the accuracy or completeness of its sources The Company’s estimates are derived from third-party sources, publicly available information, the Company’s knowledge of its industry and assumptions based on such information and knowledge The Company’s estimates have not been verified by any independent source All of the projections, estimates, market data and industry information used in this presentation involve a number of assumptions and limitations, and you are cautioned not to give undue weight to such information In addition, projections, estimates and assumptions relating to the Company’s and its industry’s future performance are necessarily subject to a high degree of uncertainty and risk due to a variety of factors, including, but not limited to, those described above, that could cause future performance to differ materially from the Company’s expressed projections, estimates and assumptions or those provided by third parties |
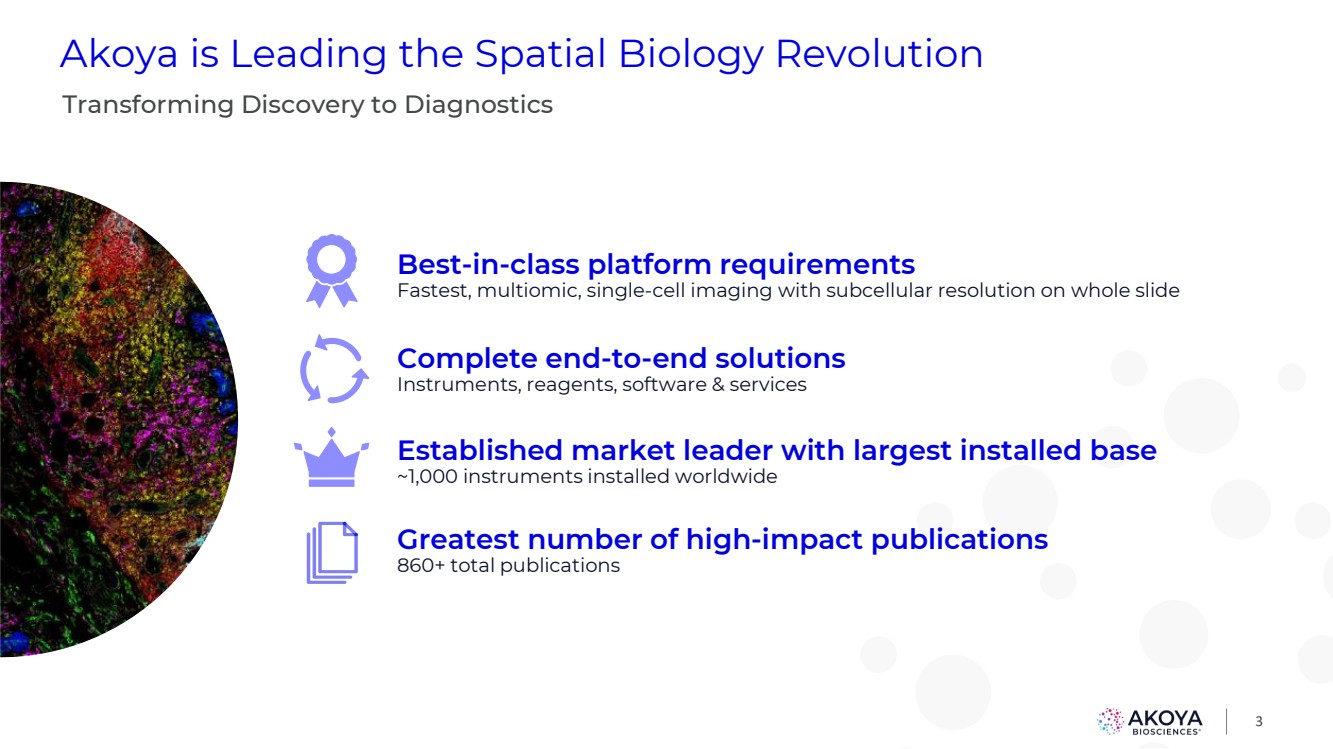
| 3 Akoya is Leading the Spatial Biology Revolution Complete end-to-end solutions Instruments, reagents, software & services Established market leader with largest installed base ~1,000 instruments installed worldwide Greatest number of high-impact publications 860+ total publications Transforming Discovery to Diagnostics Best-in-class platform requirements Fastest, multiomic, single-cell imaging with subcellular resolution on whole slide |
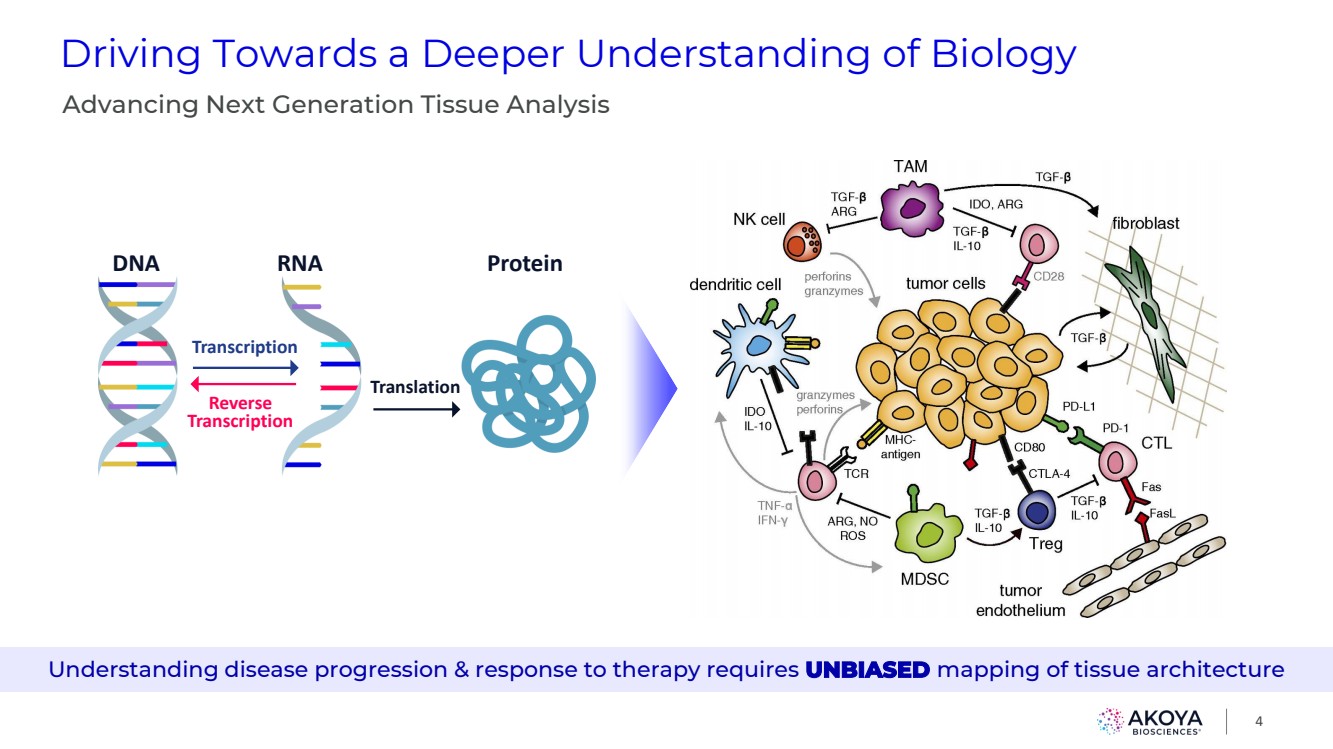
| 4 Driving Towards a Deeper Understanding of Biology Advancing Next Generation Tissue Analysis DNA RNA Protein Translation Transcription Reverse Transcription Understanding disease progression & response to therapy requires UNBIASED mapping of tissue architecture |
| 5 Akoya is Transforming Tissue Analysis Mapping Whole Tissue Unlocks an Understanding of Disease Progression & Response to Therapy The LOCATION of key cell types, proteins & transcripts drives tumor activity & immune response Single-Cell Resolution Subcellular Resolution Single-Section Whole Slide Cell Segmentation Spatial Phenotyping |

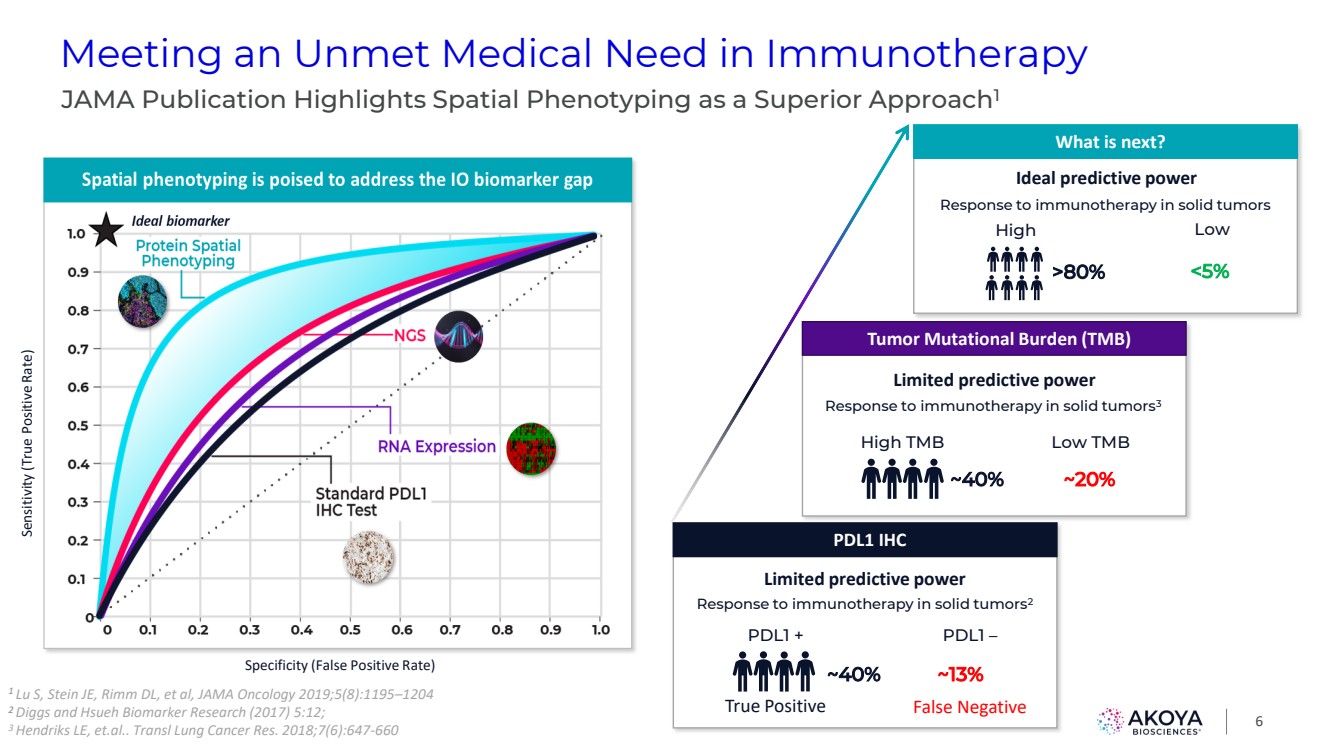
| What is next? High >80% Low <5% Ideal predictive power Response to immunotherapy in solid tumors Tumor Mutational Burden (TMB) High TMB ~40% Low TMB ~20% Limited predictive power Response to immunotherapy in solid tumors3 Meeting an Unmet Medical Need in Immunotherapy 6 1 Lu S, Stein JE, Rimm DL, et al, JAMA Oncology 2019;5(8):1195–1204 2 Diggs and Hsueh Biomarker Research (2017) 5:12; 3 Hendriks LE, et.al.. Transl Lung Cancer Res. 2018;7(6):647-660 JAMA Publication Highlights Spatial Phenotyping as a Superior Approach1 PDL1 IHC PDL1 + ~40% PDL1 – ~13% Limited predictive power Response to immunotherapy in solid tumors2 True Positive False Negative Specificity (False Positive Rate) Sensitivity (True Positive Rate) |
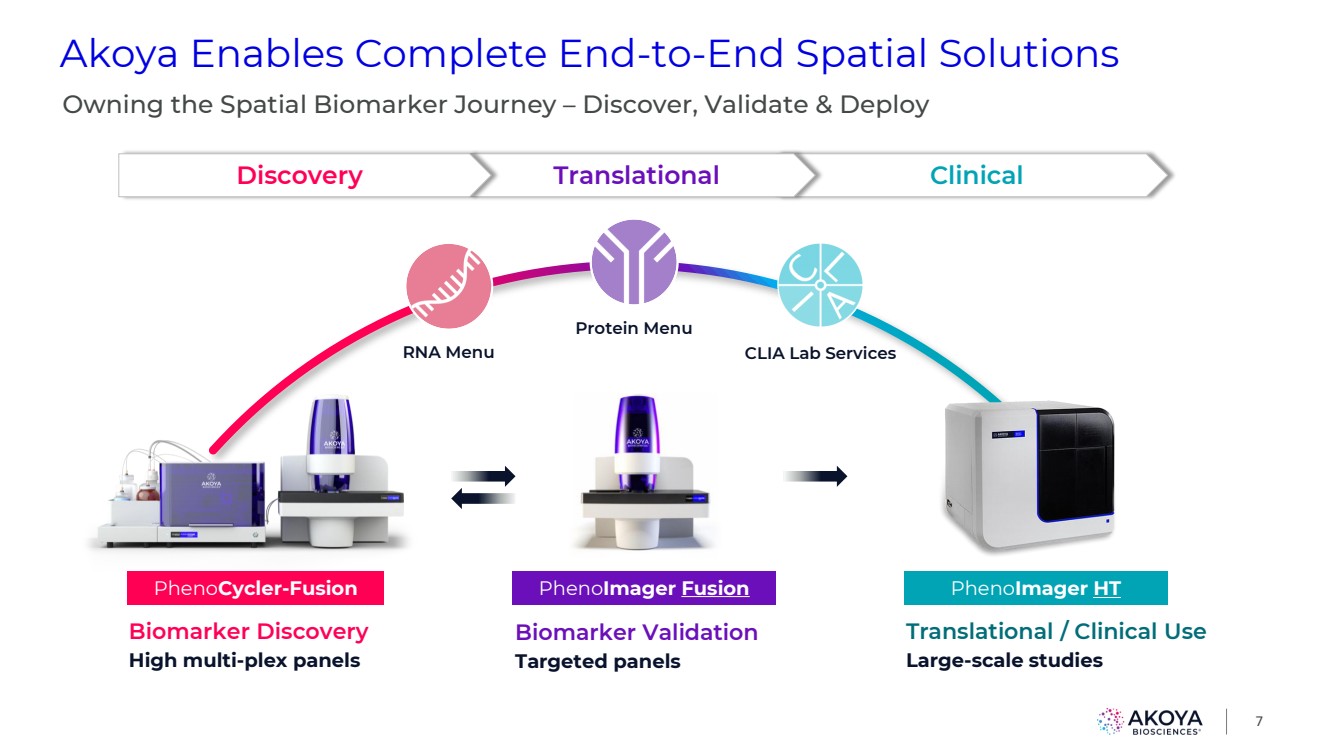
| Biomarker Discovery High multi-plex panels Biomarker Validation Targeted panels Translational / Clinical Use Large-scale studies Akoya Enables Complete End-to-End Spatial Solutions 7 Owning the Spatial Biomarker Journey – Discover, Validate & Deploy PhenoCycler-Fusion PhenoImager Fusion PhenoImager HT Discovery Translational Clinical RNA Menu Protein Menu CLIA Lab Services |
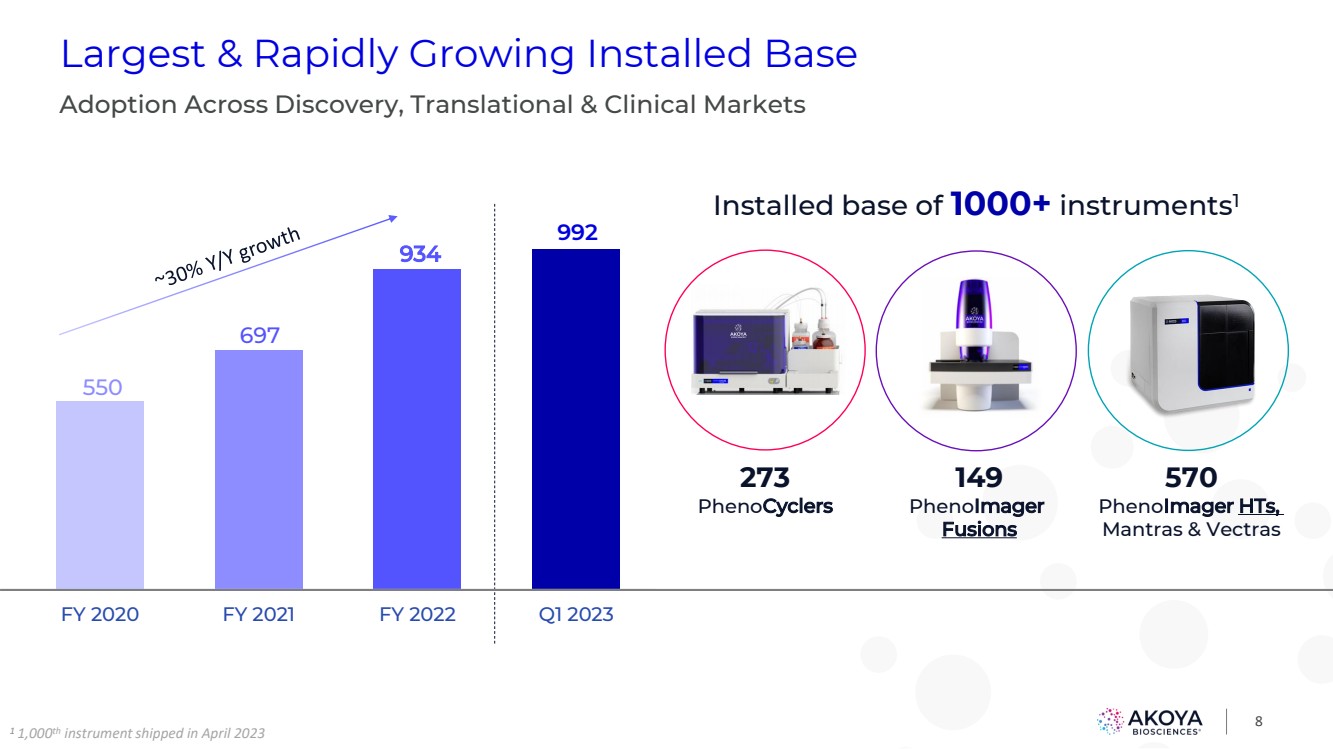
| 8 Largest & Rapidly Growing Installed Base Adoption Across Discovery, Translational & Clinical Markets 273 PhenoCyclers 149 PhenoImager Fusions 570 PhenoImager HTs, Mantras & Vectras Installed base of 1000+ instruments1 550 697 934 992 FY 2020 FY 2021 FY 2022 Q1 2023 1 1,000th instrument shipped in April 2023 |
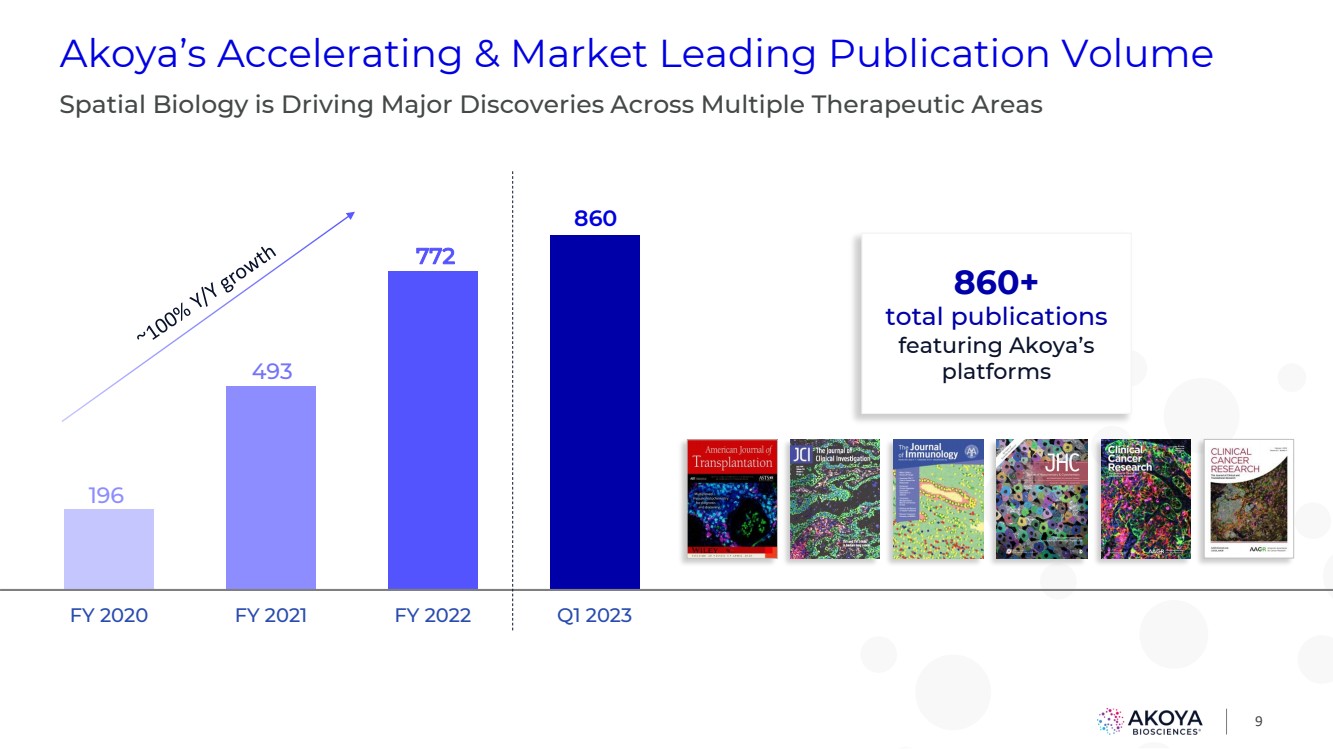
| 9 Akoya’s Accelerating & Market Leading Publication Volume Spatial Biology is Driving Major Discoveries Across Multiple Therapeutic Areas 860+ total publications featuring Akoya’s platforms 196 493 772 860 FY 2020 FY 2021 FY 2022 Q1 2023 |
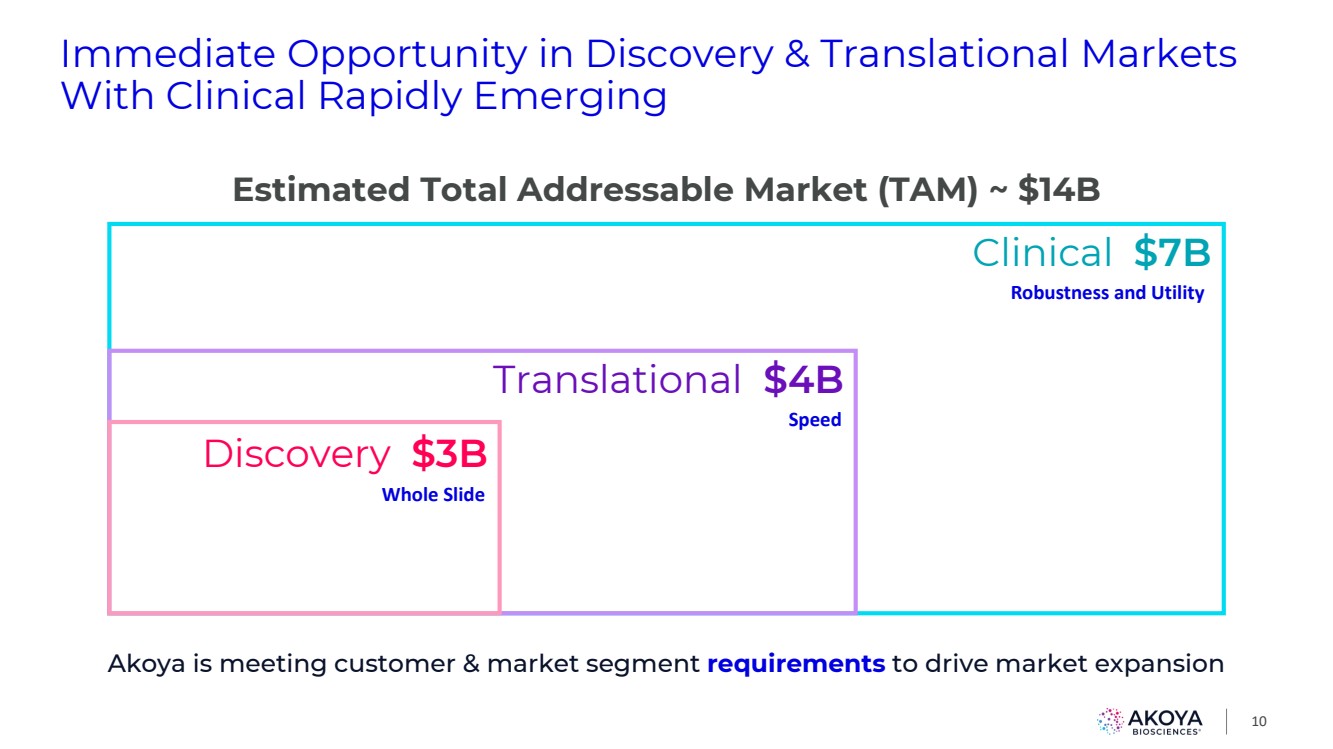
| Immediate Opportunity in Discovery & Translational Markets With Clinical Rapidly Emerging Clinical $7B Translational $4B Discovery $3B Akoya is meeting customer & market segment requirements to drive market expansion Speed Whole Slide 10 Robustness and Utility Estimated Total Addressable Market (TAM) ~ $14B |
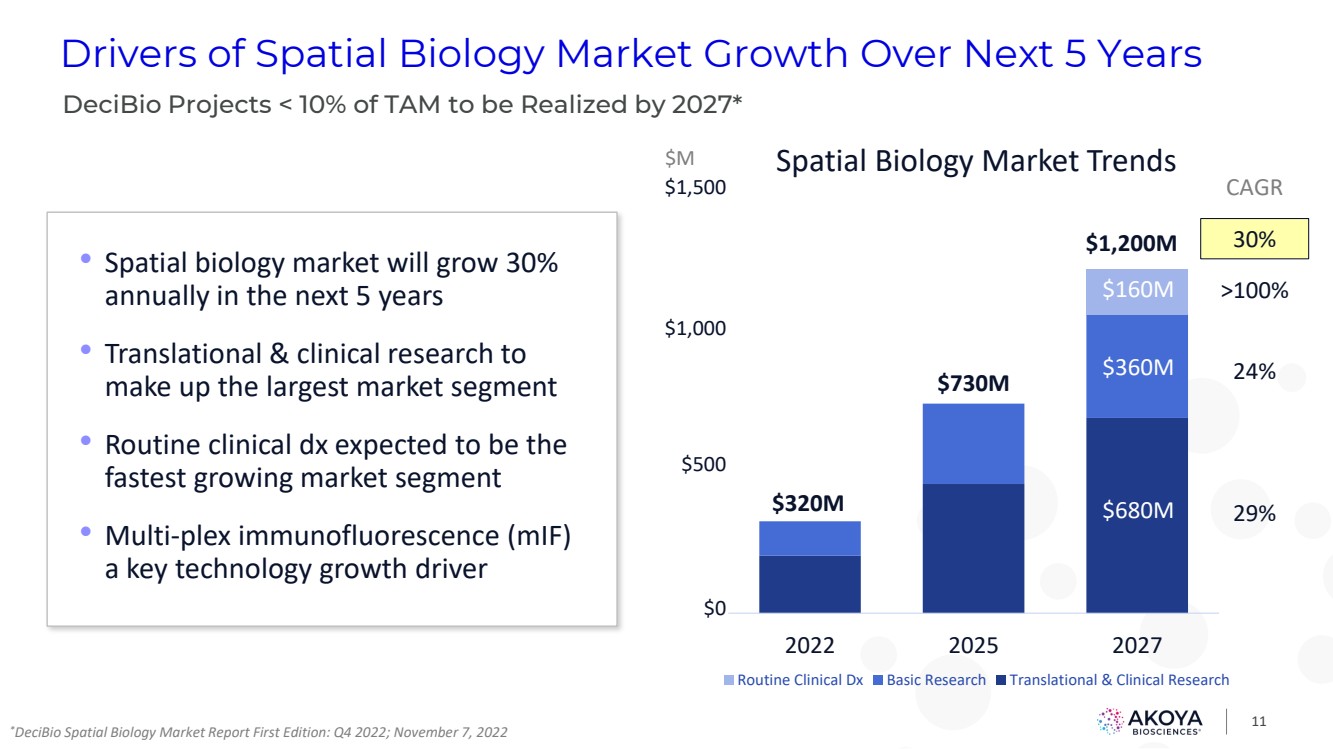
| 11 Drivers of Spatial Biology Market Growth Over Next 5 Years *DeciBio Spatial Biology Market Report First Edition: Q4 2022; November 7, 2022 • Spatial biology market will grow 30% annually in the next 5 years • Translational & clinical research to make up the largest market segment • Routine clinical dx expected to be the fastest growing market segment • Multi-plex immunofluorescence (mIF) a key technology growth driver DeciBio Projects < 10% of TAM to be Realized by 2027* 2022 2025 2027 Spatial Biology Market Trends Routine Clinical Dx Basic Research Translational & Clinical Research $1,500 $1,000 $500 $0 $M $1,200M $730M $320M $680M $360M $160M 30% >100% 24% 29% CAGR |
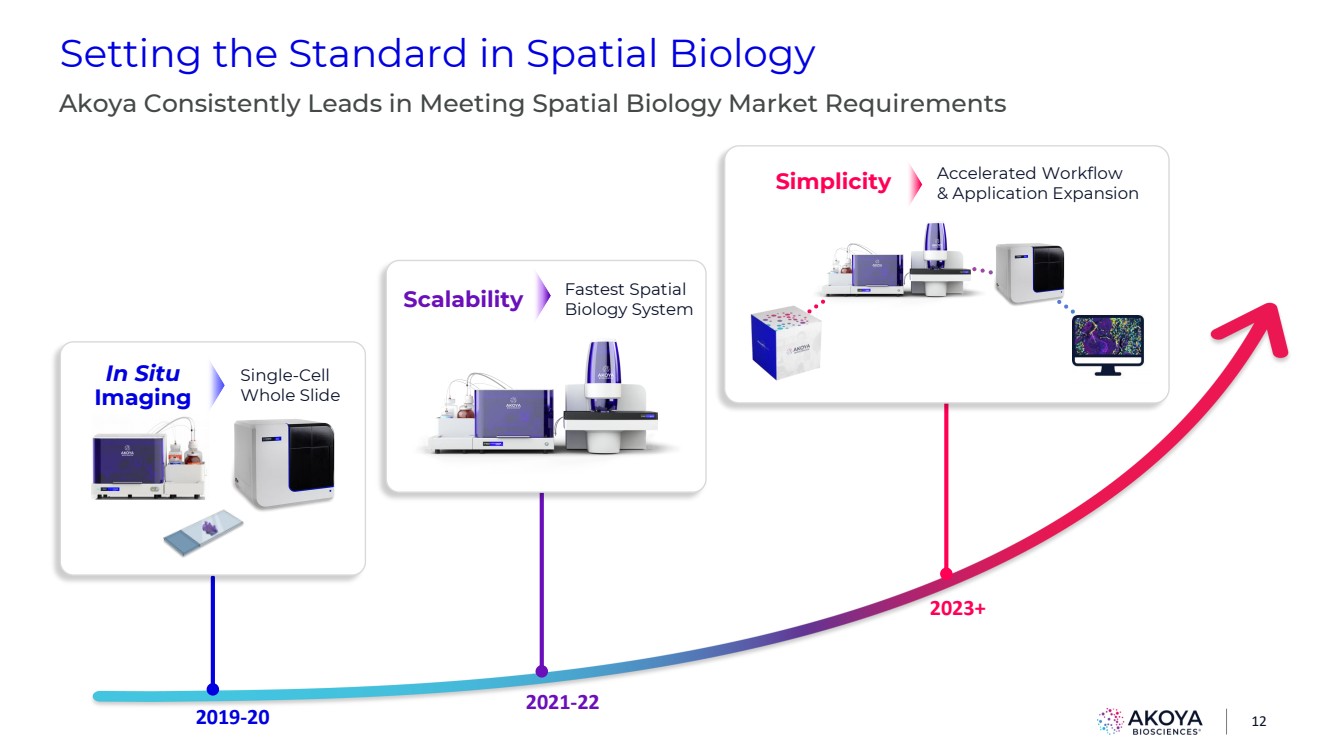
| Setting the Standard in Spatial Biology Akoya Consistently Leads in Meeting Spatial Biology Market Requirements 2019-20 12 2021-22 2023+ Single-Cell Whole Slide In Situ Imaging Fastest Spatial Scalability Biology System Accelerated Workflow & Application Expansion Simplicity |
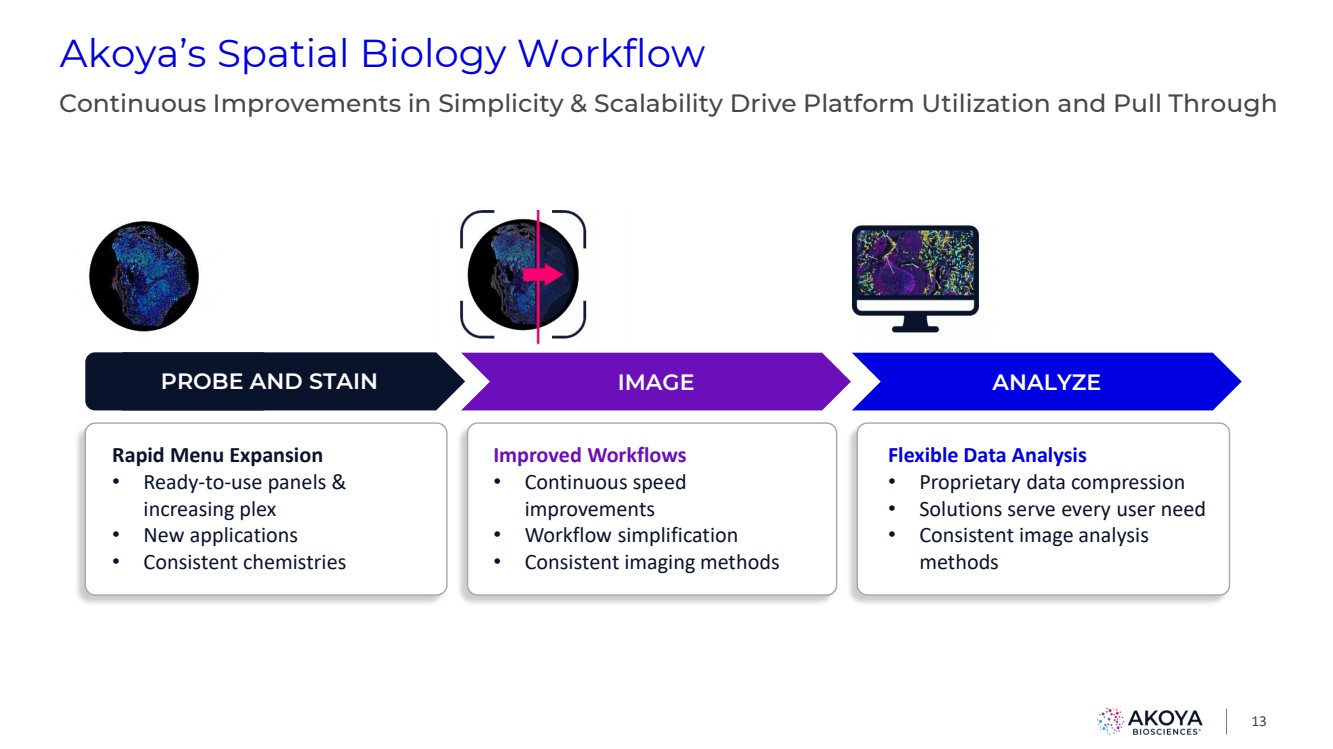
| Akoya’s Spatial Biology Workflow 13 Rapid Menu Expansion • Ready-to-use panels & increasing plex • New applications • Consistent chemistries PROBE AND STAIN IMAGE ANALYZE Improved Workflows • Continuous speed improvements • Workflow simplification • Consistent imaging methods Flexible Data Analysis • Proprietary data compression • Solutions serve every user need • Consistent image analysis methods Continuous Improvements in Simplicity & Scalability Drive Platform Utilization and Pull Through |
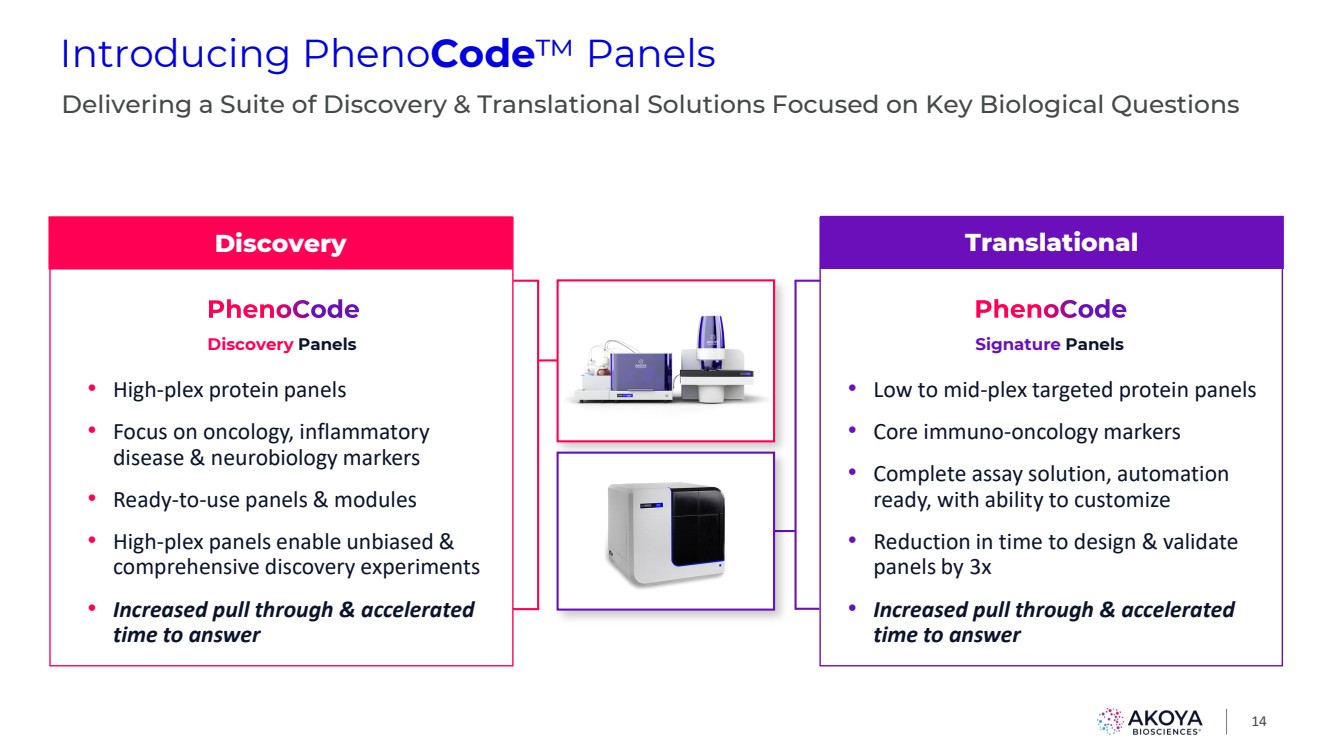
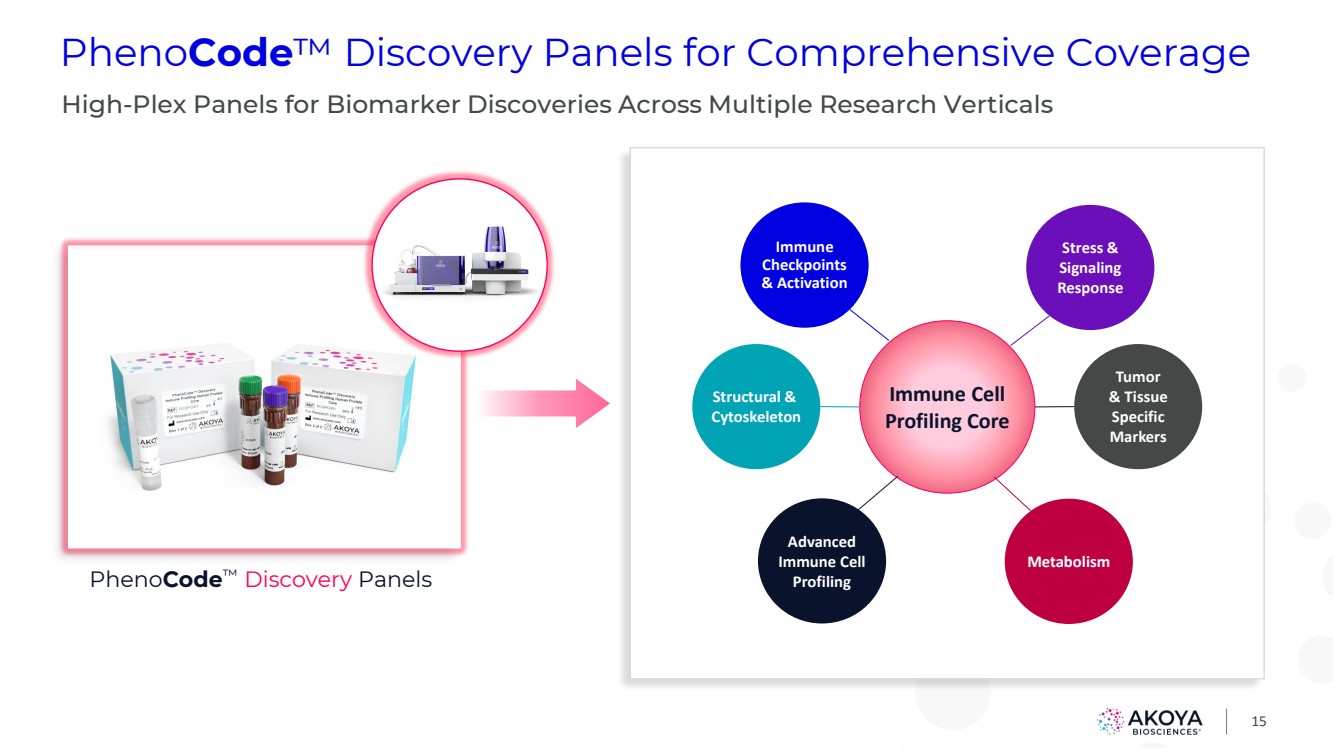
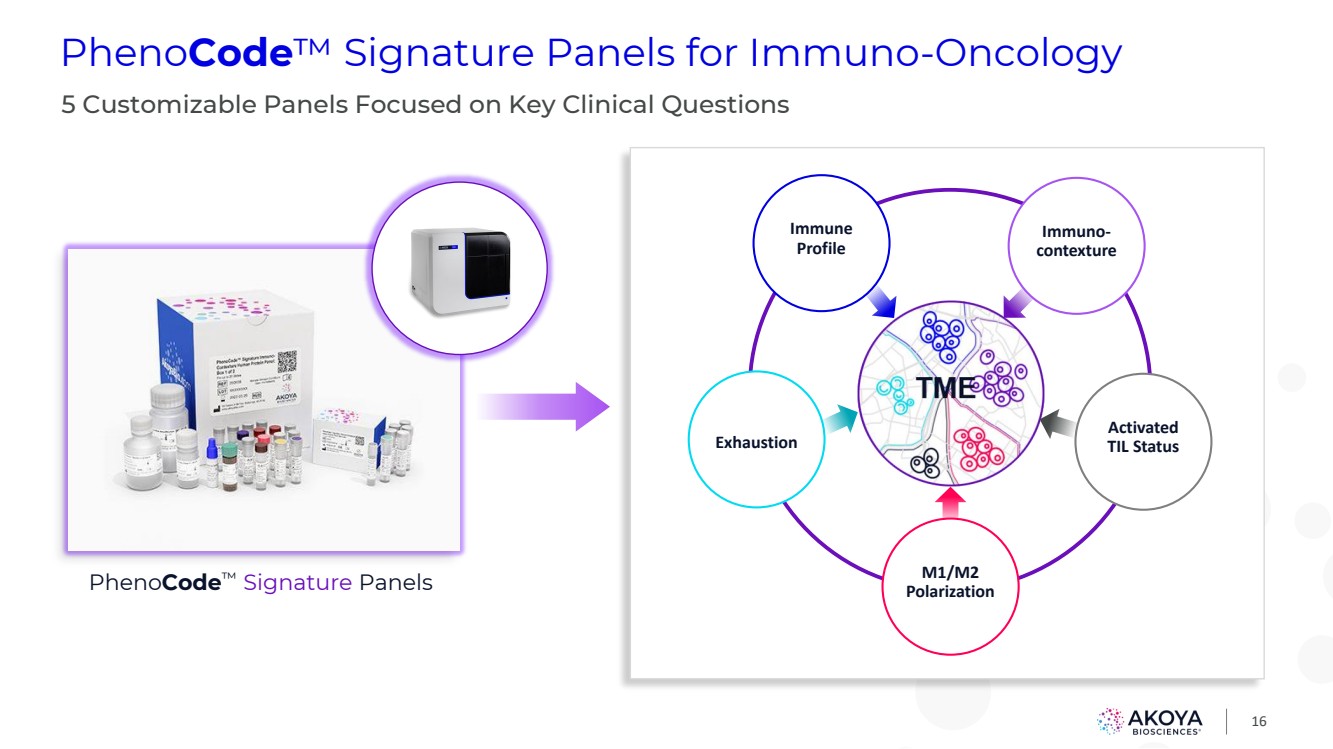
| 14 • High-plex protein panels • Focus on oncology, inflammatory disease & neurobiology markers • Ready-to-use panels & modules • High-plex panels enable unbiased & comprehensive discovery experiments • Increased pull through & accelerated time to answer Introducing PhenoCode™ Panels Delivering a Suite of Discovery & Translational Solutions Focused on Key Biological Questions • Low to mid-plex targeted protein panels • Core immuno-oncology markers • Complete assay solution, automation ready, with ability to customize • Reduction in time to design & validate panels by 3x • Increased pull through & accelerated time to answer Discovery Panels Signature Panels Discovery Translational |
| 15 PhenoCode™ Discovery Panels PhenoCode™ Discovery Panels for Comprehensive Coverage High-Plex Panels for Biomarker Discoveries Across Multiple Research Verticals Immune Cell Profiling Core Immune Checkpoints & Activation Stress & Signaling Response Tumor & Tissue Specific Markers Metabolism Advanced Immune Cell Profiling Structural & Cytoskeleton |
| 16 PhenoCode™ Signature Panels Immune Profile Immuno-contexture Activated TIL Status M1/M2 Polarization Exhaustion PhenoCode™ Signature Panels for Immuno-Oncology 5 Customizable Panels Focused on Key Clinical Questions |
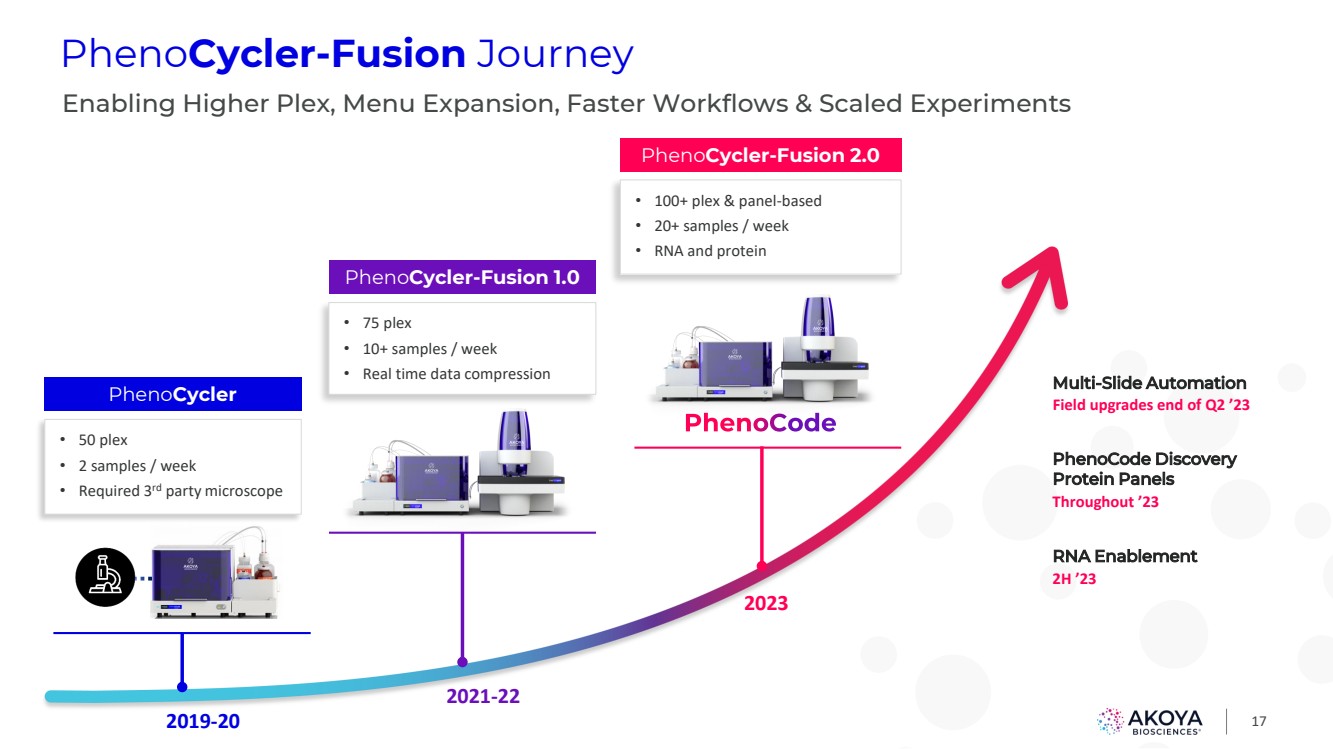
| 17 PhenoCycler-Fusion Journey PhenoCycler • 50 plex • 2 samples / week • Required 3rd party microscope 2019-20 2021-22 2023 Enabling Higher Plex, Menu Expansion, Faster Workflows & Scaled Experiments PhenoCycler-Fusion 1.0 • 75 plex • 10+ samples / week • Real time data compression PhenoCycler-Fusion 2.0 • 100+ plex & panel-based • 20+ samples / week • RNA and protein Throughout ’23 PhenoCode Discovery Protein Panels Field upgrades end of Q2 ’23 Multi-Slide Automation 2H ’23 RNA Enablement |
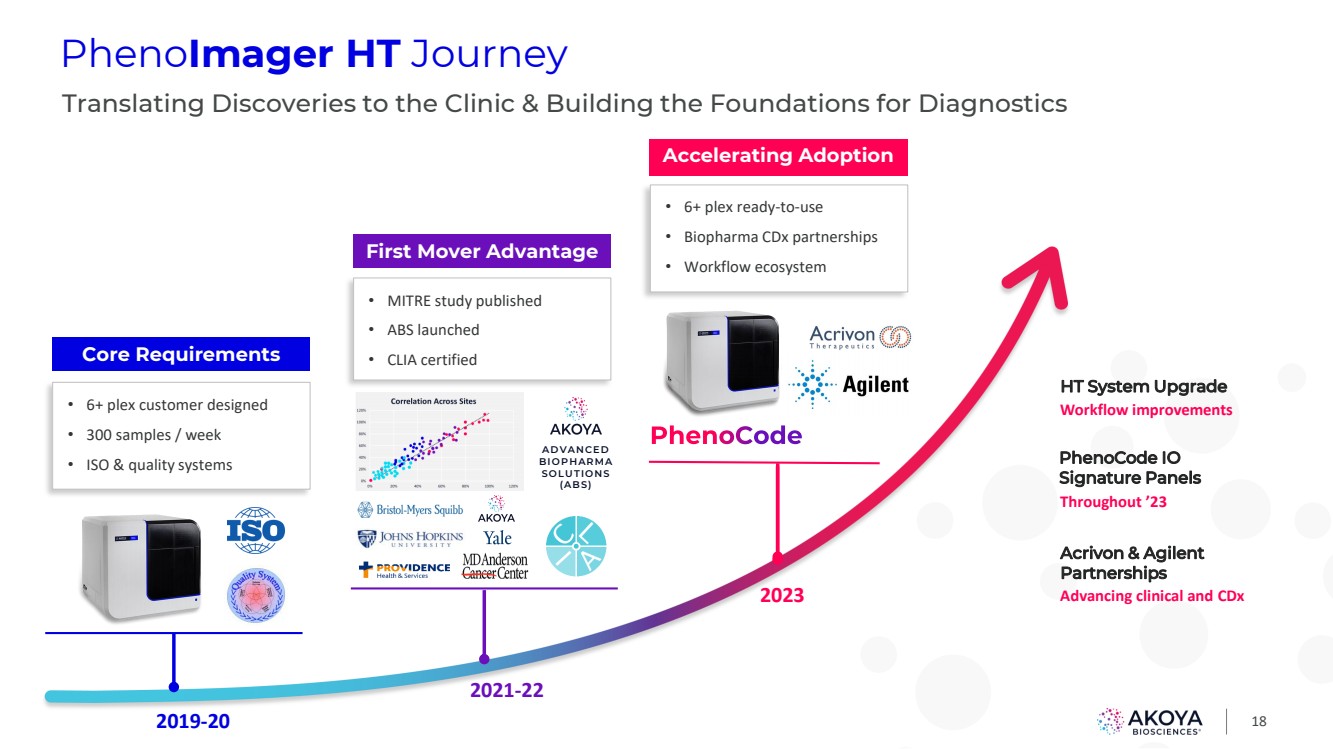
| 18 PhenoImager HT Journey 2019-20 2021-22 2023 Translating Discoveries to the Clinic & Building the Foundations for Diagnostics • 6+ plex customer designed • 300 samples / week • ISO & quality systems • MITRE study published • ABS launched • CLIA certified • 6+ plex ready-to-use • Biopharma CDx partnerships • Workflow ecosystem ADVANCED BIOPHARMA SOLUTIONS (ABS) Core Requirements First Mover Advantage Accelerating Adoption Throughout ’23 PhenoCode IO Signature Panels Workflow improvements HT System Upgrade Advancing clinical and CDx Acrivon & Agilent Partnerships Accelerating Adoption |
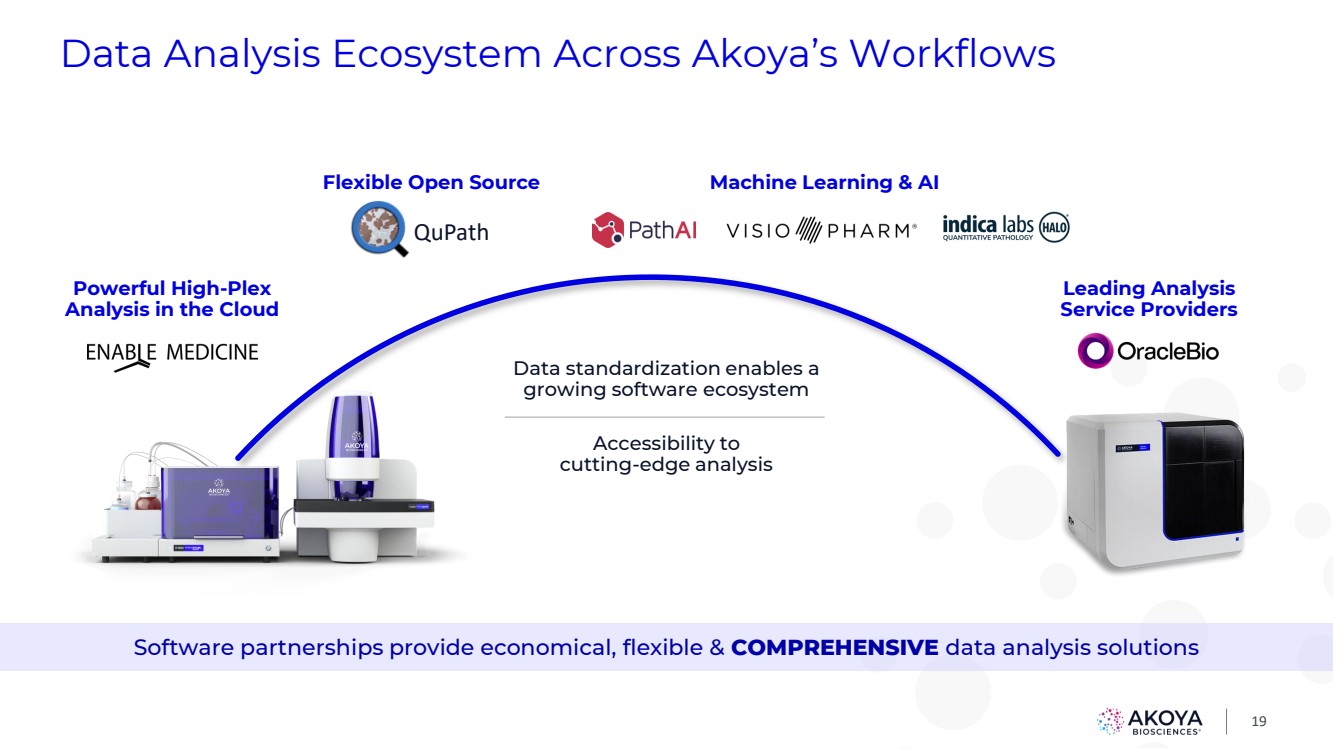
| 19 Data Analysis Ecosystem Across Akoya’s Workflows QuPath Flexible Open Source Leading Analysis Service Providers Powerful High-Plex Analysis in the Cloud Machine Learning & AI Data standardization enables a growing software ecosystem Accessibility to cutting-edge analysis Software partnerships provide economical, flexible & COMPREHENSIVE data analysis solutions |
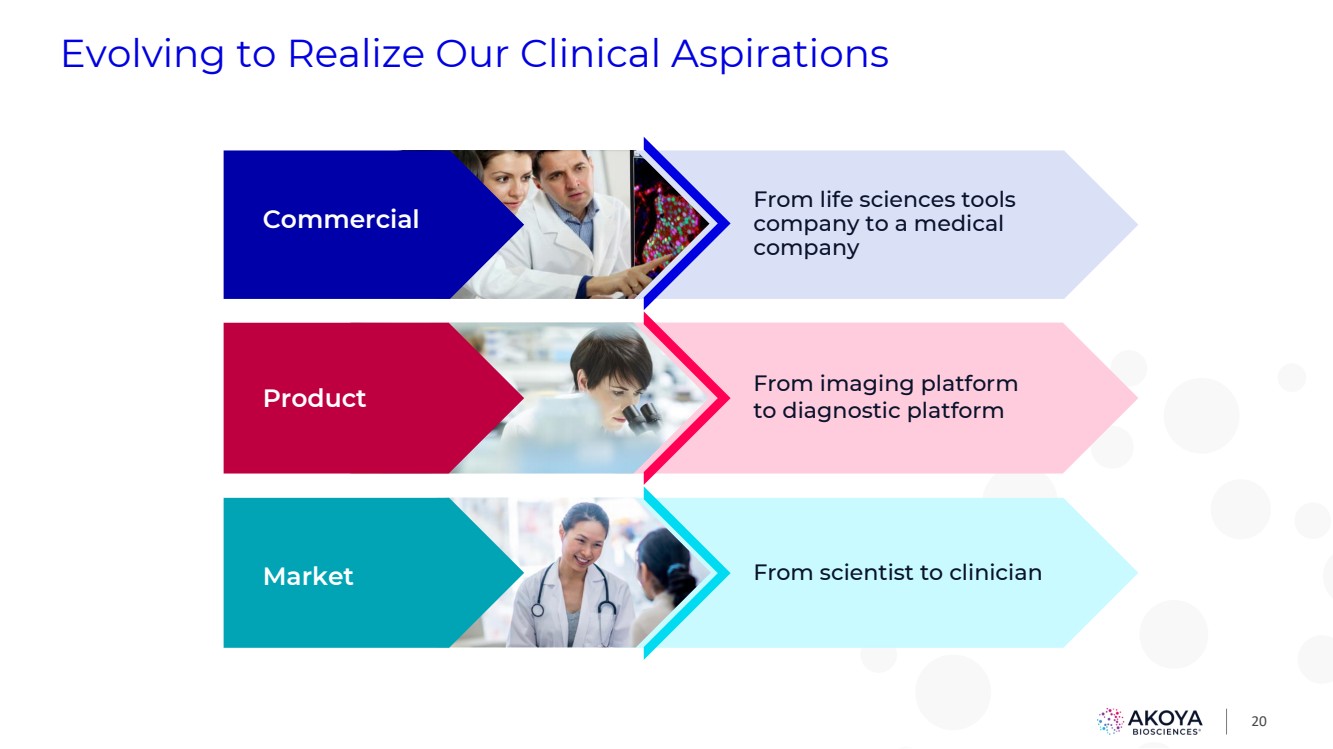
| 20 Evolving to Realize Our Clinical Aspirations From life sciences tools company to a medical company From imaging platform to diagnostic platform From scientist to clinician Commercial Product Market |
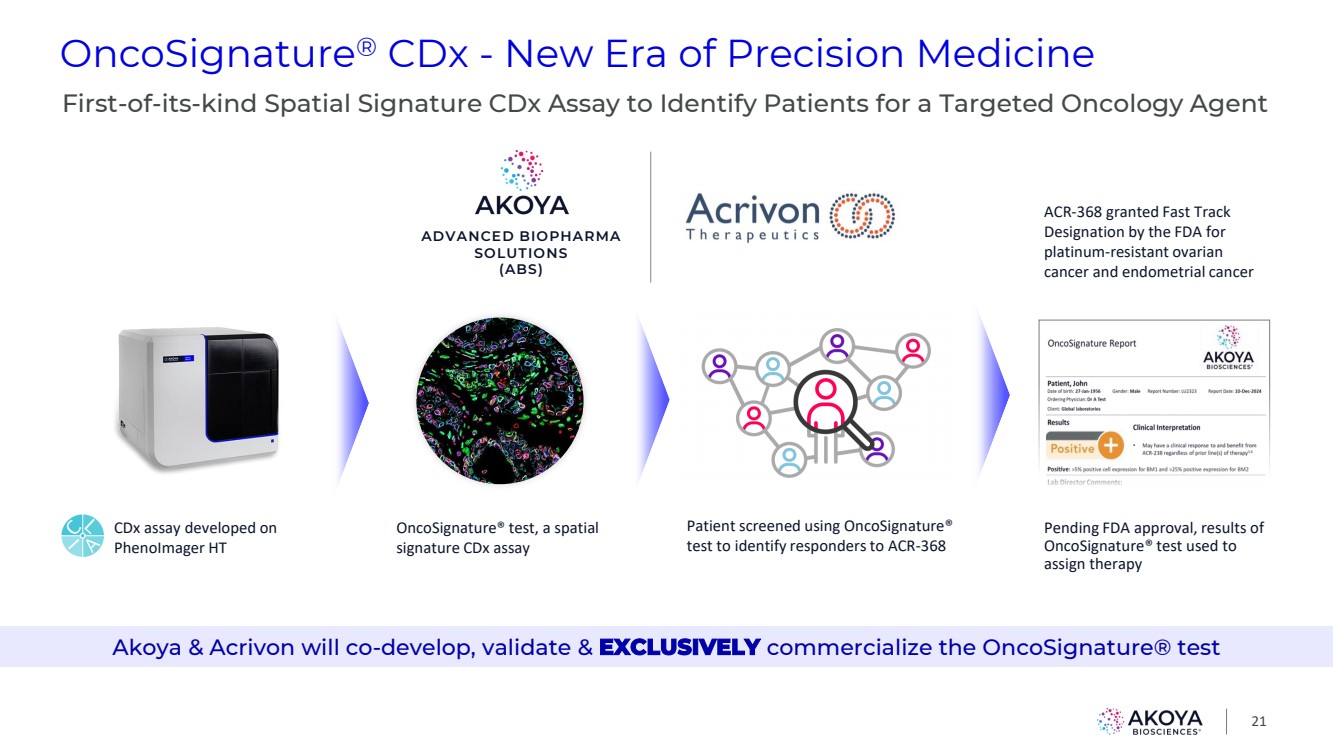
| OncoSignature® CDx - New Era of Precision Medicine 21 ADVANCED BIOPHARMA SOLUTIONS (ABS) CDx assay developed on PhenoImager HT OncoSignature® test, a spatial signature CDx assay Patient screened using OncoSignature® test to identify responders to ACR-368 Pending FDA approval, results of OncoSignature® test used to assign therapy First-of-its-kind Spatial Signature CDx Assay to Identify Patients for a Targeted Oncology Agent Akoya & Acrivon will co-develop, validate & EXCLUSIVELY commercialize the OncoSignature® test ACR-368 granted Fast Track Designation by the FDA for platinum-resistant ovarian cancer and endometrial cancer |
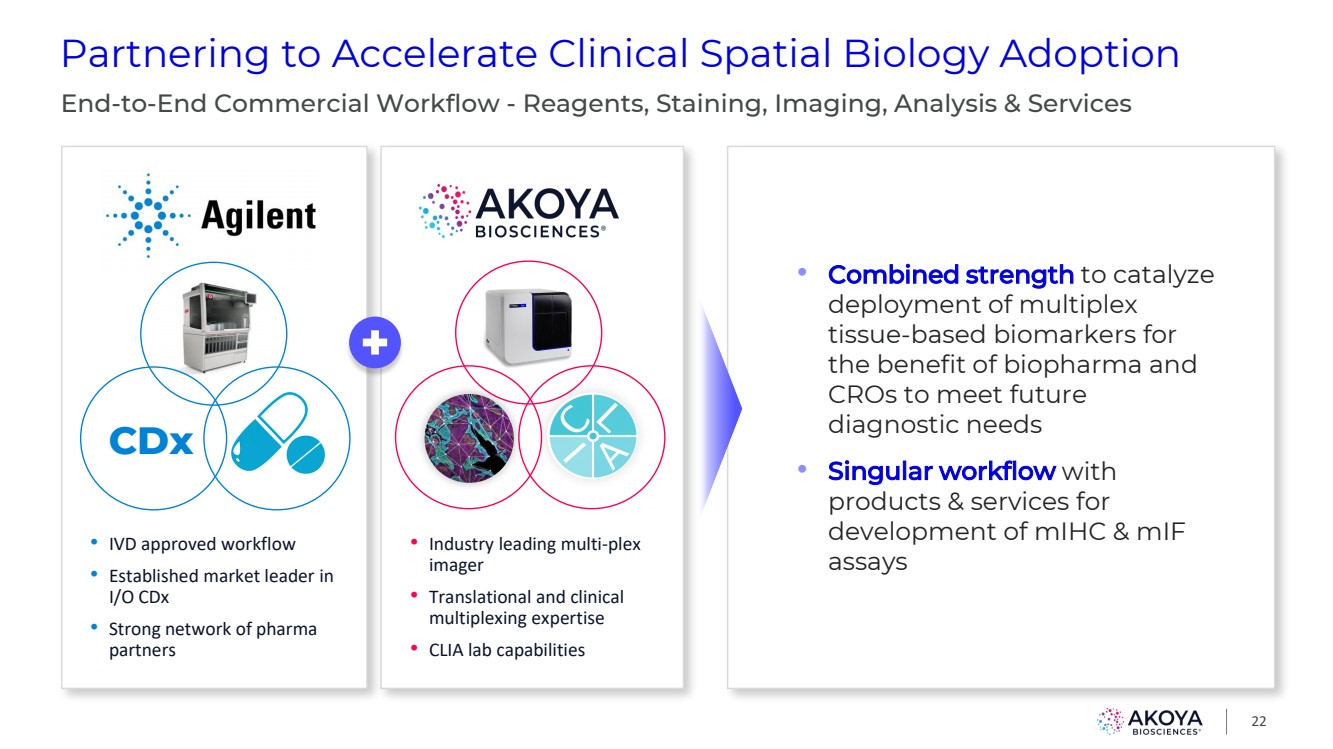
| Partnering to Accelerate Clinical Spatial Biology Adoption 22 End-to-End Commercial Workflow - Reagents, Staining, Imaging, Analysis & Services • Industry leading multi-plex imager • Translational and clinical multiplexing expertise • CLIA lab capabilities • IVD approved workflow • Established market leader in I/O CDx • Strong network of pharma partners • Combined strength to catalyze deployment of multiplex tissue-based biomarkers for the benefit of biopharma and CROs to meet future diagnostic needs • Singular workflow with products & services for development of mIHC & mIF assays CDx |
| 23 Qualified CRO Service Provider Network • To support and guide drug development programs, spatial phenotyping techniques using Akoya’s platforms can be accessed through our global network of qualified CRO service providers • Each provider has completed a qualification process designed for evaluating basic service provider proficiency in staining, imaging, & analysis |
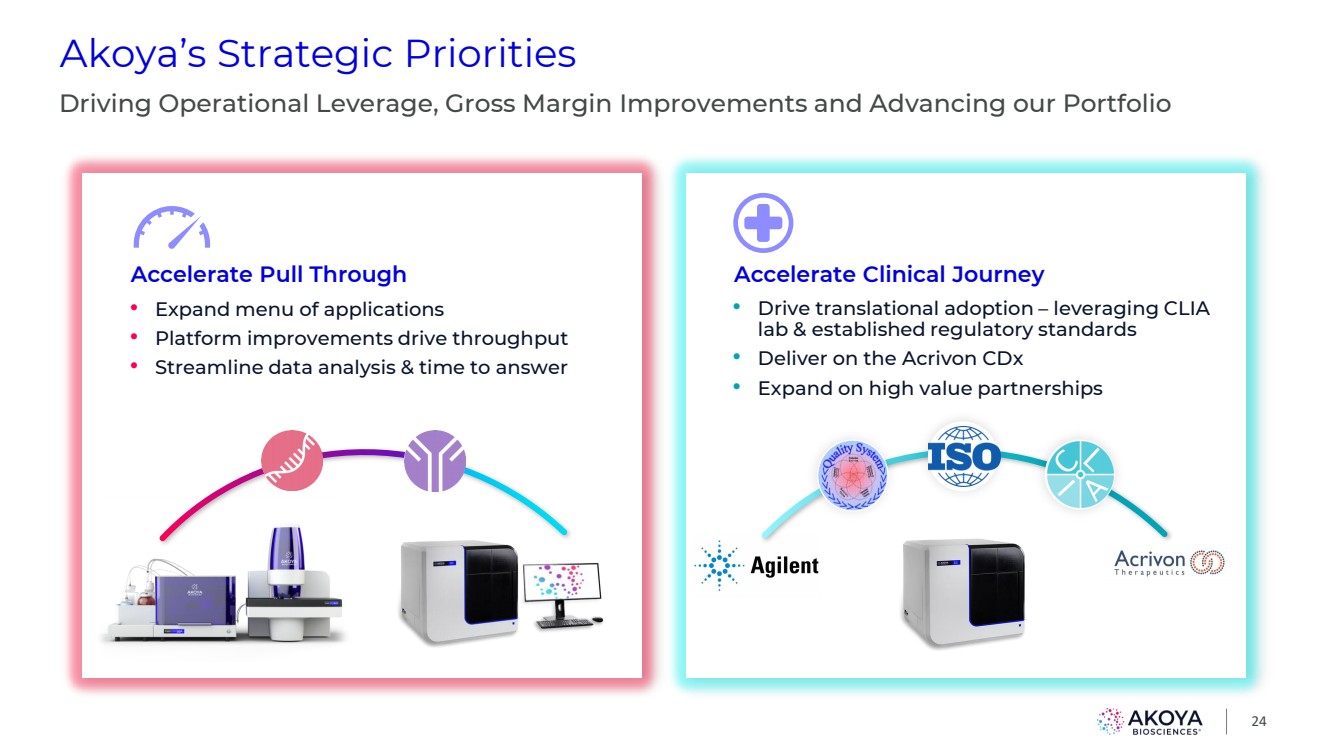
| Akoya’s Strategic Priorities 24 Driving Operational Leverage, Gross Margin Improvements and Advancing our Portfolio • Expand menu of applications • Platform improvements drive throughput • Streamline data analysis & time to answer Accelerate Pull Through • Drive translational adoption – leveraging CLIA lab & established regulatory standards • Deliver on the Acrivon CDx • Expand on high value partnerships Accelerate Clinical Journey |
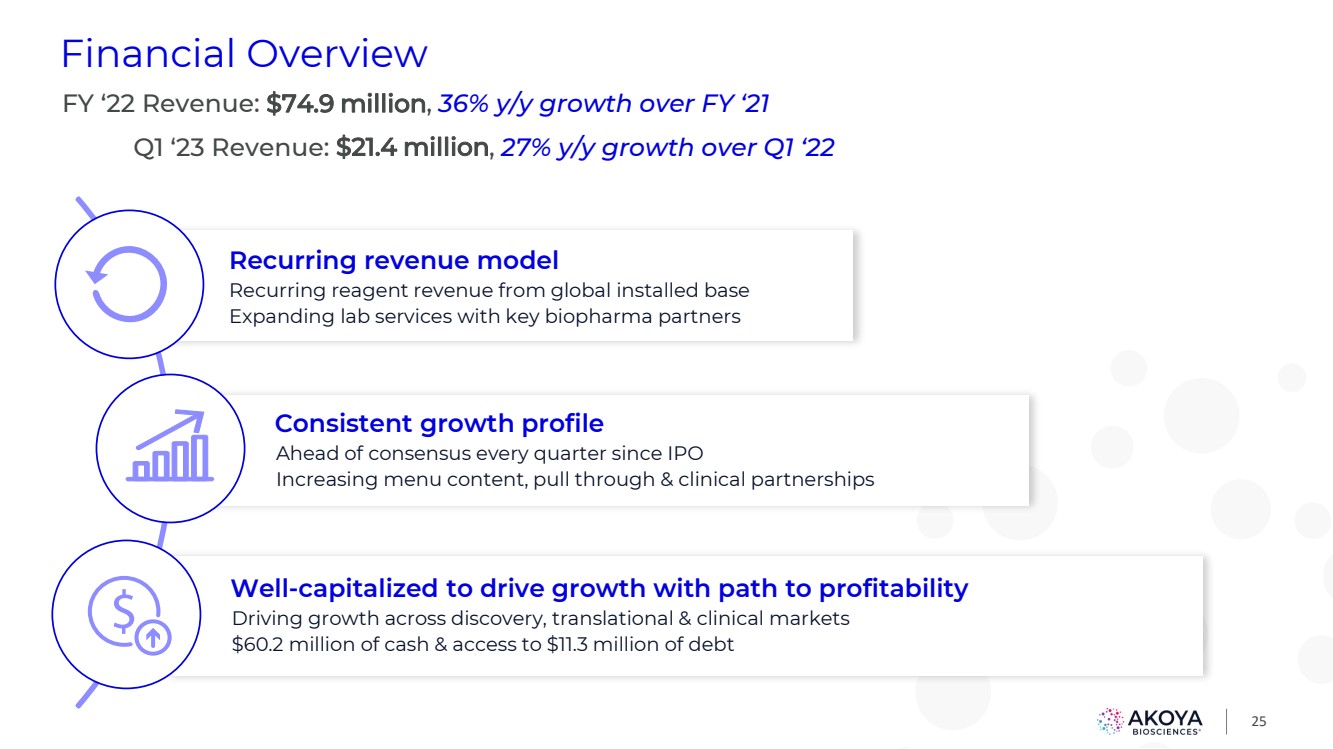
| 25 Financial Overview Recurring revenue model Recurring reagent revenue from global installed base Expanding lab services with key biopharma partners Consistent growth profile Ahead of consensus every quarter since IPO Increasing menu content, pull through & clinical partnerships Well-capitalized to drive growth with path to profitability Driving growth across discovery, translational & clinical markets $60.2 million of cash & access to $11.3 million of debt FY ‘22 Revenue: $74.9 million, 36% y/y growth over FY ‘21 Q1 ‘23 Revenue: $21.4 million, 27% y/y growth over Q1 ‘22 |
| Catalyzing Discovery & Improving Patient Care |