http://fasb.org/us-gaap/2022#AccountingStandardsUpdate201602Memberhttp://fasb.org/us-gaap/2022#AccountingStandardsUpdate201602Memberhttp://fasb.org/us-gaap/2022#OtherComprehensiveIncomeLossNetOfTaxhttp://fasb.org/us-gaap/2022#RealizedInvestmentGainsLosseshttp://fasb.org/us-gaap/2022#RealizedInvestmentGainsLosseshttp://fasb.org/us-gaap/2022#RealizedInvestmentGainsLosseshttp://fasb.org/us-gaap/2022#RealizedInvestmentGainsLosseshttp://fasb.org/us-gaap/2022#RealizedInvestmentGainsLosseshttp://fasb.org/us-gaap/2022#RealizedInvestmentGainsLosseshttp://fasb.org/us-gaap/2022#RealizedInvestmentGainsLosseshttp://fasb.org/us-gaap/2022#RealizedInvestmentGainsLosseshttp://fasb.org/us-gaap/2022#RealizedInvestmentGainsLosseshttp://fasb.org/us-gaap/2022#RealizedInvestmentGainsLosseshttp://fasb.org/us-gaap/2022#RealizedInvestmentGainsLosseshttp://fasb.org/us-gaap/2022#RealizedInvestmentGainsLosseshttp://fasb.org/us-gaap/2022#OtherLiabilitieshttp://fasb.org/us-gaap/2022#OtherLiabilitieshttp://fasb.org/us-gaap/2022#RealizedInvestmentGainsLosseshttp://fasb.org/us-gaap/2022#RealizedInvestmentGainsLosseshttp://fasb.org/us-gaap/2022#RealizedInvestmentGainsLossesP3YP3YP3YP3YP3YP3YP3YP3YP3YP3YP3YP3YP3YP3YP3Yhttp://fasb.org/us-gaap/2022#OtherLiabilitieshttp://fasb.org/us-gaap/2022#OtherAssetshttp://fasb.org/us-gaap/2022#OtherLiabilitieshttp://fasb.org/us-gaap/2022#OtherAssetshttp://fasb.org/us-gaap/2022#OtherLiabilitieshttp://fasb.org/us-gaap/2022#OtherAssetshttp://fasb.org/us-gaap/2022#OtherLiabilitieshttp://fasb.org/us-gaap/2022#OtherAssetshttp://fasb.org/us-gaap/2022#OtherAssetshttp://fasb.org/us-gaap/2022#OtherAssetshttp://fasb.org/us-gaap/2022#OtherAssetsP3YP3YP3Y0001889539false0001889539us-gaap:FairValueInputsLevel3Memberus-gaap:FairValueMeasurementsRecurringMember2022-12-31iso4217:USD0001889539us-gaap:FairValueInputsLevel3Memberus-gaap:FairValueMeasurementsRecurringMember2021-12-3100018895392022-12-3100018895392021-12-310001889539us-gaap:FairValueMeasurementsRecurringMember2022-12-310001889539us-gaap:FairValueMeasurementsRecurringMember2021-12-310001889539us-gaap:ShortTermInvestmentsMember2022-12-310001889539us-gaap:ShortTermInvestmentsMember2021-12-310001889539crbg:FortitudeReMember2022-12-310001889539crbg:FortitudeReMember2021-12-310001889539crbg:ExcludingFortitudeMember2022-12-310001889539crbg:ExcludingFortitudeMember2021-12-310001889539us-gaap:OtherAssetsMember2022-12-310001889539us-gaap:OtherAssetsMember2021-12-310001889539crbg:ConsolidatedEntitiesExcludingConsolidatedInvestmentsMember2022-12-310001889539crbg:ConsolidatedEntitiesExcludingConsolidatedInvestmentsMember2021-12-310001889539crbg:ConsolidatedInvestmentsIncludingVariableInterestEntitiesPrimaryBeneficiaryMember2022-12-310001889539crbg:ConsolidatedInvestmentsIncludingVariableInterestEntitiesPrimaryBeneficiaryMember2021-12-31iso4217:USDxbrli:sharesxbrli:shares0001889539us-gaap:CommonClassAMember2021-12-310001889539us-gaap:CommonClassBMember2021-12-3100018895392022-01-012022-12-3100018895392021-01-012021-12-3100018895392020-01-012020-12-310001889539crbg:ExcludingFortitudeReFundWithheldAssetsMember2022-01-012022-12-310001889539crbg:ExcludingFortitudeReFundWithheldAssetsMember2021-01-012021-12-310001889539crbg:ExcludingFortitudeReFundWithheldAssetsMember2020-01-012020-12-310001889539crbg:ModifiedCoinsuranceAndFundsWithheldAssetsMember2022-01-012022-12-310001889539crbg:ModifiedCoinsuranceAndFundsWithheldAssetsMember2021-01-012021-12-310001889539crbg:ModifiedCoinsuranceAndFundsWithheldAssetsMember2020-01-012020-12-310001889539crbg:ModifiedCoinsuranceAndFundsWithheldEmbeddedDerivativesMember2022-01-012022-12-310001889539crbg:ModifiedCoinsuranceAndFundsWithheldEmbeddedDerivativesMember2021-01-012021-12-310001889539crbg:ModifiedCoinsuranceAndFundsWithheldEmbeddedDerivativesMember2020-01-012020-12-310001889539us-gaap:CommonClassAMember2021-01-012021-12-310001889539us-gaap:CommonClassAMember2020-01-012020-12-310001889539us-gaap:CommonClassBMember2021-01-012021-12-310001889539us-gaap:CommonClassBMember2020-01-012020-12-310001889539us-gaap:CommonStockMember2019-12-310001889539us-gaap:CommonClassAMemberus-gaap:CommonStockMember2019-12-310001889539us-gaap:CommonClassBMemberus-gaap:CommonStockMember2019-12-310001889539us-gaap:AdditionalPaidInCapitalMember2019-12-310001889539us-gaap:RetainedEarningsMember2019-12-310001889539crbg:ShareholdersNetInvestmentMember2019-12-310001889539us-gaap:AccumulatedOtherComprehensiveIncomeMember2019-12-310001889539us-gaap:ParentMember2019-12-310001889539us-gaap:NoncontrollingInterestMember2019-12-3100018895392019-12-310001889539crbg:ShareholdersNetInvestmentMembersrt:CumulativeEffectPeriodOfAdoptionAdjustmentMember2019-12-310001889539us-gaap:ParentMembersrt:CumulativeEffectPeriodOfAdoptionAdjustmentMember2019-12-310001889539srt:CumulativeEffectPeriodOfAdoptionAdjustmentMember2019-12-310001889539crbg:ShareholdersNetInvestmentMember2020-01-012020-12-310001889539us-gaap:ParentMember2020-01-012020-12-310001889539us-gaap:RetainedEarningsMember2020-01-012020-12-310001889539us-gaap:NoncontrollingInterestMember2020-01-012020-12-310001889539us-gaap:AccumulatedOtherComprehensiveIncomeMember2020-01-012020-12-310001889539us-gaap:CommonStockMember2020-12-310001889539us-gaap:CommonClassAMemberus-gaap:CommonStockMember2020-12-310001889539us-gaap:CommonClassBMemberus-gaap:CommonStockMember2020-12-310001889539us-gaap:AdditionalPaidInCapitalMember2020-12-310001889539us-gaap:RetainedEarningsMember2020-12-310001889539crbg:ShareholdersNetInvestmentMember2020-12-310001889539us-gaap:AccumulatedOtherComprehensiveIncomeMember2020-12-310001889539us-gaap:ParentMember2020-12-310001889539us-gaap:NoncontrollingInterestMember2020-12-3100018895392020-12-310001889539crbg:ShareholdersNetInvestmentMembersrt:CumulativeEffectPeriodOfAdoptionAdjustmentMember2020-12-310001889539us-gaap:AccumulatedOtherComprehensiveIncomeMembersrt:CumulativeEffectPeriodOfAdoptionAdjustmentMember2020-12-310001889539us-gaap:ParentMembersrt:CumulativeEffectPeriodOfAdoptionAdjustmentMember2020-12-310001889539srt:CumulativeEffectPeriodOfAdoptionAdjustmentMember2020-12-310001889539crbg:ShareholdersNetInvestmentMember2021-01-012021-12-310001889539us-gaap:ParentMember2021-01-012021-12-310001889539us-gaap:RetainedEarningsMember2021-01-012021-12-310001889539us-gaap:NoncontrollingInterestMember2021-01-012021-12-310001889539us-gaap:AccumulatedOtherComprehensiveIncomeMember2021-01-012021-12-310001889539us-gaap:AdditionalPaidInCapitalMember2021-01-012021-12-310001889539us-gaap:CommonStockMember2021-12-310001889539us-gaap:CommonClassAMemberus-gaap:CommonStockMember2021-12-310001889539us-gaap:CommonClassBMemberus-gaap:CommonStockMember2021-12-310001889539us-gaap:AdditionalPaidInCapitalMember2021-12-310001889539us-gaap:RetainedEarningsMember2021-12-310001889539crbg:ShareholdersNetInvestmentMember2021-12-310001889539us-gaap:AccumulatedOtherComprehensiveIncomeMember2021-12-310001889539us-gaap:ParentMember2021-12-310001889539us-gaap:NoncontrollingInterestMember2021-12-310001889539us-gaap:RetainedEarningsMember2022-01-012022-12-310001889539us-gaap:ParentMember2022-01-012022-12-310001889539us-gaap:NoncontrollingInterestMember2022-01-012022-12-310001889539us-gaap:CommonClassBMemberus-gaap:RetainedEarningsMember2022-01-012022-12-310001889539us-gaap:CommonClassBMemberus-gaap:ParentMember2022-01-012022-12-310001889539us-gaap:CommonClassBMember2022-01-012022-12-310001889539us-gaap:AccumulatedOtherComprehensiveIncomeMember2022-01-012022-12-310001889539us-gaap:AdditionalPaidInCapitalMember2022-01-012022-12-310001889539us-gaap:CommonStockMember2022-01-012022-12-310001889539us-gaap:CommonClassAMemberus-gaap:CommonStockMember2022-01-012022-12-310001889539us-gaap:CommonClassBMemberus-gaap:CommonStockMember2022-01-012022-12-310001889539us-gaap:CommonStockMember2022-12-310001889539us-gaap:CommonClassAMemberus-gaap:CommonStockMember2022-12-310001889539us-gaap:CommonClassBMemberus-gaap:CommonStockMember2022-12-310001889539us-gaap:AdditionalPaidInCapitalMember2022-12-310001889539us-gaap:RetainedEarningsMember2022-12-310001889539crbg:ShareholdersNetInvestmentMember2022-12-310001889539us-gaap:AccumulatedOtherComprehensiveIncomeMember2022-12-310001889539us-gaap:ParentMember2022-12-310001889539us-gaap:NoncontrollingInterestMember2022-12-310001889539us-gaap:VariableInterestEntityPrimaryBeneficiaryMember2022-01-012022-12-310001889539us-gaap:VariableInterestEntityPrimaryBeneficiaryMember2021-01-012021-12-310001889539us-gaap:VariableInterestEntityPrimaryBeneficiaryMember2020-01-012020-12-310001889539us-gaap:ShortTermInvestmentsMember2020-12-310001889539us-gaap:OtherAssetsMember2020-12-310001889539crbg:CorebridgeFinancialMember2022-09-192022-09-190001889539crbg:CorebridgeFinancialIncMember2022-12-31xbrli:pure0001889539crbg:AIGTAndEastgreenMembersrt:AffiliatedEntityMember2022-02-282022-02-280001889539crbg:BlackstoneMembercrbg:CorebridgeFinancialIncMember2021-11-020001889539crbg:CorebridgeFinancialMember2021-11-020001889539crbg:CorebridgeFinancialMember2022-12-310001889539srt:ScenarioForecastMembercrbg:CorebridgeFinancialMember2027-09-300001889539crbg:BlackstoneMembercrbg:CorebridgeFinancialMember2021-11-022021-11-020001889539crbg:AIGMember2021-11-0100018895392021-11-0100018895392021-12-152021-12-1500018895392021-07-162021-07-16crbg:mutualFund0001889539crbg:SAAMCoMember2021-07-162021-07-160001889539crbg:SAAMCoMember2021-07-160001889539crbg:FortitudeMember2020-07-012020-07-010001889539crbg:FortitudeMembercrbg:TCGroupCaymanMember2018-11-300001889539crbg:FortitudeMembercrbg:CarlyleFRLMember2018-11-300001889539crbg:FortitudeMembercrbg:TDMember2018-11-300001889539crbg:FortitudeMembercrbg:AIGMembercrbg:FortitudeHoldingsMember2018-11-300001889539crbg:FortitudeMembercrbg:FortitudeHoldingsMembercrbg:CorebridgeMember2018-11-300001889539crbg:LegacyLifeAndRetirementRunOffLinesSegmentMemberMember2022-12-310001889539crbg:LegacyLifeAndRetirementRunOffLinesSegmentMemberMember2021-12-310001889539crbg:FortitudeMembercrbg:LifeAndRetirementSubsidiariesMember2020-04-012020-06-300001889539crbg:CapitalizedSoftwareCostsMember2022-01-012022-12-310001889539us-gaap:BuildingMember2022-01-012022-12-310001889539us-gaap:FurnitureAndFixturesMember2022-01-012022-12-310001889539us-gaap:OfficeEquipmentMember2022-01-012022-12-310001889539us-gaap:AccumulatedOtherComprehensiveIncomeMembersrt:CumulativeEffectPeriodOfAdoptionAdjustmentMembersrt:MinimumMemberus-gaap:AccountingStandardsUpdate201812Member2021-01-010001889539us-gaap:RetainedEarningsMembersrt:CumulativeEffectPeriodOfAdoptionAdjustmentMembersrt:MinimumMemberus-gaap:AccountingStandardsUpdate201812Member2021-01-010001889539crbg:FortitudeReMembersrt:ScenarioPreviouslyReportedMember2021-01-010001889539crbg:FortitudeReMembersrt:RevisionOfPriorPeriodAccountingStandardsUpdateAdjustmentMember2021-01-010001889539crbg:FortitudeReMember2021-01-010001889539srt:ScenarioPreviouslyReportedMember2021-01-010001889539srt:RevisionOfPriorPeriodAccountingStandardsUpdateAdjustmentMember2021-01-0100018895392021-01-010001889539crbg:ExcludingFortitudeMembersrt:ScenarioPreviouslyReportedMember2021-01-010001889539crbg:ExcludingFortitudeMembersrt:RevisionOfPriorPeriodAccountingStandardsUpdateAdjustmentMember2021-01-010001889539crbg:ExcludingFortitudeMember2021-01-010001889539srt:RevisionOfPriorPeriodChangeInAccountingPrincipleAdjustmentMember2021-01-010001889539crbg:FortitudeReMembersrt:CumulativeEffectPeriodOfAdoptionAdjustmentMember2021-01-010001889539srt:CumulativeEffectPeriodOfAdoptionAdjustmentMember2021-01-010001889539crbg:FortitudeReMembersrt:ScenarioPreviouslyReportedMember2022-12-310001889539crbg:FortitudeReMembersrt:RevisionOfPriorPeriodAccountingStandardsUpdateAdjustmentMember2022-12-310001889539srt:ScenarioPreviouslyReportedMember2022-12-310001889539srt:RevisionOfPriorPeriodAccountingStandardsUpdateAdjustmentMember2022-12-310001889539crbg:ExcludingFortitudeMembersrt:ScenarioPreviouslyReportedMember2022-12-310001889539crbg:ExcludingFortitudeMembersrt:RevisionOfPriorPeriodAccountingStandardsUpdateAdjustmentMember2022-12-310001889539srt:RevisionOfPriorPeriodChangeInAccountingPrincipleAdjustmentMember2022-12-310001889539crbg:FortitudeReMembersrt:ScenarioPreviouslyReportedMember2021-12-310001889539crbg:FortitudeReMembersrt:RevisionOfPriorPeriodAccountingStandardsUpdateAdjustmentMember2021-12-310001889539srt:ScenarioPreviouslyReportedMember2021-12-310001889539srt:RevisionOfPriorPeriodAccountingStandardsUpdateAdjustmentMember2021-12-310001889539crbg:ExcludingFortitudeMembersrt:ScenarioPreviouslyReportedMember2021-12-310001889539crbg:ExcludingFortitudeMembersrt:RevisionOfPriorPeriodAccountingStandardsUpdateAdjustmentMember2021-12-310001889539srt:RevisionOfPriorPeriodChangeInAccountingPrincipleAdjustmentMember2021-12-310001889539srt:ScenarioPreviouslyReportedMember2022-01-012022-12-310001889539srt:RevisionOfPriorPeriodAccountingStandardsUpdateAdjustmentMember2022-01-012022-12-310001889539srt:ScenarioPreviouslyReportedMember2021-01-012021-12-310001889539srt:RevisionOfPriorPeriodAccountingStandardsUpdateAdjustmentMember2021-01-012021-12-310001889539us-gaap:CommonClassAMembersrt:ScenarioPreviouslyReportedMember2021-01-012021-12-310001889539us-gaap:CommonClassAMembersrt:RevisionOfPriorPeriodAccountingStandardsUpdateAdjustmentMember2021-01-012021-12-310001889539us-gaap:CommonClassBMembersrt:ScenarioPreviouslyReportedMember2021-01-012021-12-310001889539us-gaap:CommonClassBMembersrt:RevisionOfPriorPeriodAccountingStandardsUpdateAdjustmentMember2021-01-012021-12-31crbg:segment0001889539crbg:IndividualRetirementSegmentMemberus-gaap:OperatingSegmentsMember2022-01-012022-12-310001889539crbg:GroupRetirementSegmentMemberus-gaap:OperatingSegmentsMember2022-01-012022-12-310001889539crbg:LifeInsuranceOperatingSegmentMemberus-gaap:OperatingSegmentsMember2022-01-012022-12-310001889539crbg:InstitutionalMarketsSegmentMemberus-gaap:OperatingSegmentsMember2022-01-012022-12-310001889539us-gaap:CorporateAndOtherMemberus-gaap:OperatingSegmentsMember2022-01-012022-12-310001889539us-gaap:IntersegmentEliminationMember2022-01-012022-12-310001889539crbg:OperatingSegmentsExcludingIntersegmentEliminationMember2022-01-012022-12-310001889539us-gaap:MaterialReconcilingItemsMember2022-01-012022-12-310001889539crbg:IndividualRetirementSegmentMemberus-gaap:OperatingSegmentsMember2021-01-012021-12-310001889539crbg:GroupRetirementSegmentMemberus-gaap:OperatingSegmentsMember2021-01-012021-12-310001889539crbg:LifeInsuranceOperatingSegmentMemberus-gaap:OperatingSegmentsMember2021-01-012021-12-310001889539crbg:InstitutionalMarketsSegmentMemberus-gaap:OperatingSegmentsMember2021-01-012021-12-310001889539us-gaap:CorporateAndOtherMemberus-gaap:OperatingSegmentsMember2021-01-012021-12-310001889539us-gaap:IntersegmentEliminationMember2021-01-012021-12-310001889539crbg:OperatingSegmentsExcludingIntersegmentEliminationMember2021-01-012021-12-310001889539us-gaap:MaterialReconcilingItemsMember2021-01-012021-12-310001889539crbg:FortitudeHoldingsMembercrbg:IndividualRetirementSegmentMemberus-gaap:OperatingSegmentsMember2021-01-012021-12-310001889539crbg:FortitudeHoldingsMembercrbg:GroupRetirementSegmentMemberus-gaap:OperatingSegmentsMember2021-01-012021-12-310001889539crbg:LifeInsuranceOperatingSegmentMembercrbg:FortitudeHoldingsMemberus-gaap:OperatingSegmentsMember2021-01-012021-12-310001889539crbg:FortitudeHoldingsMembercrbg:InstitutionalMarketsSegmentMemberus-gaap:OperatingSegmentsMember2021-01-012021-12-310001889539us-gaap:CorporateAndOtherMembercrbg:FortitudeHoldingsMemberus-gaap:OperatingSegmentsMember2021-01-012021-12-310001889539crbg:FortitudeHoldingsMemberus-gaap:IntersegmentEliminationMember2021-01-012021-12-310001889539crbg:FortitudeHoldingsMembercrbg:OperatingSegmentsExcludingIntersegmentEliminationMember2021-01-012021-12-310001889539crbg:FortitudeHoldingsMemberus-gaap:MaterialReconcilingItemsMember2021-01-012021-12-310001889539crbg:FortitudeHoldingsMember2021-01-012021-12-310001889539crbg:IndividualRetirementSegmentMemberus-gaap:OperatingSegmentsMember2020-01-012020-12-310001889539crbg:GroupRetirementSegmentMemberus-gaap:OperatingSegmentsMember2020-01-012020-12-310001889539crbg:LifeInsuranceOperatingSegmentMemberus-gaap:OperatingSegmentsMember2020-01-012020-12-310001889539crbg:InstitutionalMarketsSegmentMemberus-gaap:OperatingSegmentsMember2020-01-012020-12-310001889539us-gaap:CorporateAndOtherMemberus-gaap:OperatingSegmentsMember2020-01-012020-12-310001889539us-gaap:IntersegmentEliminationMember2020-01-012020-12-310001889539crbg:OperatingSegmentsExcludingIntersegmentEliminationMember2020-01-012020-12-310001889539us-gaap:MaterialReconcilingItemsMember2020-01-012020-12-310001889539crbg:FortitudeHoldingsMembercrbg:IndividualRetirementSegmentMemberus-gaap:OperatingSegmentsMember2020-01-012020-12-310001889539crbg:FortitudeHoldingsMembercrbg:GroupRetirementSegmentMemberus-gaap:OperatingSegmentsMember2020-01-012020-12-310001889539crbg:LifeInsuranceOperatingSegmentMembercrbg:FortitudeHoldingsMemberus-gaap:OperatingSegmentsMember2020-01-012020-12-310001889539crbg:FortitudeHoldingsMembercrbg:InstitutionalMarketsSegmentMemberus-gaap:OperatingSegmentsMember2020-01-012020-12-310001889539us-gaap:CorporateAndOtherMembercrbg:FortitudeHoldingsMemberus-gaap:OperatingSegmentsMember2020-01-012020-12-310001889539crbg:FortitudeHoldingsMemberus-gaap:IntersegmentEliminationMember2020-01-012020-12-310001889539crbg:FortitudeHoldingsMembercrbg:OperatingSegmentsExcludingIntersegmentEliminationMember2020-01-012020-12-310001889539crbg:FortitudeHoldingsMemberus-gaap:MaterialReconcilingItemsMember2020-01-012020-12-310001889539crbg:FortitudeHoldingsMember2020-01-012020-12-310001889539crbg:FortitudeHoldingsMember2022-01-012022-12-310001889539crbg:FortitudeHoldingsMember2021-01-012021-12-310001889539crbg:FortitudeHoldingsMember2020-01-012020-12-310001889539srt:NorthAmericaMember2022-01-012022-12-310001889539srt:NorthAmericaMember2021-01-012021-12-310001889539srt:NorthAmericaMember2020-01-012020-12-310001889539srt:NorthAmericaMember2022-12-310001889539srt:NorthAmericaMember2021-12-310001889539srt:NorthAmericaMember2020-12-310001889539crbg:InternationalMember2022-01-012022-12-310001889539crbg:InternationalMember2021-01-012021-12-310001889539crbg:InternationalMember2020-01-012020-12-310001889539crbg:InternationalMember2022-12-310001889539crbg:InternationalMember2021-12-310001889539crbg:InternationalMember2020-12-310001889539us-gaap:InterestRateSwapMember2022-12-310001889539us-gaap:USTreasuryAndGovernmentMemberus-gaap:FairValueInputsLevel1Memberus-gaap:FairValueMeasurementsRecurringMember2022-12-310001889539us-gaap:USTreasuryAndGovernmentMemberus-gaap:FairValueInputsLevel2Memberus-gaap:FairValueMeasurementsRecurringMember2022-12-310001889539us-gaap:USTreasuryAndGovernmentMemberus-gaap:FairValueInputsLevel3Memberus-gaap:FairValueMeasurementsRecurringMember2022-12-310001889539us-gaap:USTreasuryAndGovernmentMemberus-gaap:FairValueMeasurementsRecurringMember2022-12-310001889539us-gaap:FairValueInputsLevel1Memberus-gaap:FairValueMeasurementsRecurringMemberus-gaap:USStatesAndPoliticalSubdivisionsMember2022-12-310001889539us-gaap:FairValueInputsLevel2Memberus-gaap:FairValueMeasurementsRecurringMemberus-gaap:USStatesAndPoliticalSubdivisionsMember2022-12-310001889539us-gaap:FairValueInputsLevel3Memberus-gaap:FairValueMeasurementsRecurringMemberus-gaap:USStatesAndPoliticalSubdivisionsMember2022-12-310001889539us-gaap:FairValueMeasurementsRecurringMemberus-gaap:USStatesAndPoliticalSubdivisionsMember2022-12-310001889539us-gaap:ForeignGovernmentDebtSecuritiesMemberus-gaap:FairValueInputsLevel1Memberus-gaap:FairValueMeasurementsRecurringMember2022-12-310001889539us-gaap:ForeignGovernmentDebtSecuritiesMemberus-gaap:FairValueInputsLevel2Memberus-gaap:FairValueMeasurementsRecurringMember2022-12-310001889539us-gaap:ForeignGovernmentDebtSecuritiesMemberus-gaap:FairValueInputsLevel3Memberus-gaap:FairValueMeasurementsRecurringMember2022-12-310001889539us-gaap:ForeignGovernmentDebtSecuritiesMemberus-gaap:FairValueMeasurementsRecurringMember2022-12-310001889539us-gaap:CorporateDebtSecuritiesMemberus-gaap:FairValueInputsLevel1Memberus-gaap:FairValueMeasurementsRecurringMember2022-12-310001889539us-gaap:CorporateDebtSecuritiesMemberus-gaap:FairValueInputsLevel2Memberus-gaap:FairValueMeasurementsRecurringMember2022-12-310001889539us-gaap:CorporateDebtSecuritiesMemberus-gaap:FairValueInputsLevel3Memberus-gaap:FairValueMeasurementsRecurringMember2022-12-310001889539us-gaap:CorporateDebtSecuritiesMemberus-gaap:FairValueMeasurementsRecurringMember2022-12-310001889539us-gaap:ResidentialMortgageBackedSecuritiesMemberus-gaap:FairValueInputsLevel1Memberus-gaap:FairValueMeasurementsRecurringMember2022-12-310001889539us-gaap:ResidentialMortgageBackedSecuritiesMemberus-gaap:FairValueInputsLevel2Memberus-gaap:FairValueMeasurementsRecurringMember2022-12-310001889539us-gaap:ResidentialMortgageBackedSecuritiesMemberus-gaap:FairValueInputsLevel3Memberus-gaap:FairValueMeasurementsRecurringMember2022-12-310001889539us-gaap:ResidentialMortgageBackedSecuritiesMemberus-gaap:FairValueMeasurementsRecurringMember2022-12-310001889539us-gaap:FairValueInputsLevel1Memberus-gaap:CommercialMortgageBackedSecuritiesMemberus-gaap:FairValueMeasurementsRecurringMember2022-12-310001889539us-gaap:FairValueInputsLevel2Memberus-gaap:CommercialMortgageBackedSecuritiesMemberus-gaap:FairValueMeasurementsRecurringMember2022-12-310001889539us-gaap:FairValueInputsLevel3Memberus-gaap:CommercialMortgageBackedSecuritiesMemberus-gaap:FairValueMeasurementsRecurringMember2022-12-310001889539us-gaap:CommercialMortgageBackedSecuritiesMemberus-gaap:FairValueMeasurementsRecurringMember2022-12-310001889539us-gaap:FairValueInputsLevel1Memberus-gaap:CollateralizedLoanObligationsMemberus-gaap:FairValueMeasurementsRecurringMember2022-12-310001889539us-gaap:CollateralizedLoanObligationsMemberus-gaap:FairValueInputsLevel2Memberus-gaap:FairValueMeasurementsRecurringMember2022-12-310001889539us-gaap:CollateralizedLoanObligationsMemberus-gaap:FairValueInputsLevel3Memberus-gaap:FairValueMeasurementsRecurringMember2022-12-310001889539us-gaap:CollateralizedLoanObligationsMemberus-gaap:FairValueMeasurementsRecurringMember2022-12-310001889539us-gaap:FairValueInputsLevel1Memberus-gaap:AssetBackedSecuritiesMemberus-gaap:FairValueMeasurementsRecurringMember2022-12-310001889539us-gaap:AssetBackedSecuritiesMemberus-gaap:FairValueInputsLevel2Memberus-gaap:FairValueMeasurementsRecurringMember2022-12-310001889539us-gaap:AssetBackedSecuritiesMemberus-gaap:FairValueInputsLevel3Memberus-gaap:FairValueMeasurementsRecurringMember2022-12-310001889539us-gaap:AssetBackedSecuritiesMemberus-gaap:FairValueMeasurementsRecurringMember2022-12-310001889539us-gaap:FairValueInputsLevel1Memberus-gaap:FairValueMeasurementsRecurringMember2022-12-310001889539us-gaap:FairValueInputsLevel2Memberus-gaap:FairValueMeasurementsRecurringMember2022-12-310001889539us-gaap:InterestRateContractMemberus-gaap:FairValueInputsLevel1Memberus-gaap:FairValueMeasurementsRecurringMember2022-12-310001889539us-gaap:InterestRateContractMemberus-gaap:FairValueInputsLevel2Memberus-gaap:FairValueMeasurementsRecurringMember2022-12-310001889539us-gaap:InterestRateContractMemberus-gaap:FairValueInputsLevel3Memberus-gaap:FairValueMeasurementsRecurringMember2022-12-310001889539us-gaap:InterestRateContractMemberus-gaap:FairValueMeasurementsRecurringMember2022-12-310001889539us-gaap:ForeignExchangeContractMemberus-gaap:FairValueInputsLevel1Memberus-gaap:FairValueMeasurementsRecurringMember2022-12-310001889539us-gaap:ForeignExchangeContractMemberus-gaap:FairValueInputsLevel2Memberus-gaap:FairValueMeasurementsRecurringMember2022-12-310001889539us-gaap:ForeignExchangeContractMemberus-gaap:FairValueInputsLevel3Memberus-gaap:FairValueMeasurementsRecurringMember2022-12-310001889539us-gaap:ForeignExchangeContractMemberus-gaap:FairValueMeasurementsRecurringMember2022-12-310001889539us-gaap:EquityContractMemberus-gaap:FairValueInputsLevel1Memberus-gaap:FairValueMeasurementsRecurringMember2022-12-310001889539us-gaap:EquityContractMemberus-gaap:FairValueInputsLevel2Memberus-gaap:FairValueMeasurementsRecurringMember2022-12-310001889539us-gaap:EquityContractMemberus-gaap:FairValueInputsLevel3Memberus-gaap:FairValueMeasurementsRecurringMember2022-12-310001889539us-gaap:EquityContractMemberus-gaap:FairValueMeasurementsRecurringMember2022-12-310001889539us-gaap:CreditRiskContractMemberus-gaap:FairValueInputsLevel1Memberus-gaap:FairValueMeasurementsRecurringMember2022-12-310001889539us-gaap:CreditRiskContractMemberus-gaap:FairValueInputsLevel2Memberus-gaap:FairValueMeasurementsRecurringMember2022-12-310001889539us-gaap:CreditRiskContractMemberus-gaap:FairValueInputsLevel3Memberus-gaap:FairValueMeasurementsRecurringMember2022-12-310001889539us-gaap:CreditRiskContractMemberus-gaap:FairValueMeasurementsRecurringMember2022-12-310001889539us-gaap:FairValueInputsLevel1Memberus-gaap:OtherContractMemberus-gaap:FairValueMeasurementsRecurringMember2022-12-310001889539us-gaap:FairValueInputsLevel2Memberus-gaap:OtherContractMemberus-gaap:FairValueMeasurementsRecurringMember2022-12-310001889539us-gaap:OtherContractMemberus-gaap:FairValueInputsLevel3Memberus-gaap:FairValueMeasurementsRecurringMember2022-12-310001889539us-gaap:OtherContractMemberus-gaap:FairValueMeasurementsRecurringMember2022-12-310001889539crbg:ConsolidatedInvestmentsIncludingVariableInterestEntitiesPrimaryBeneficiaryMemberus-gaap:FairValueInputsLevel1Memberus-gaap:FairValueMeasurementsRecurringMember2022-12-310001889539crbg:ConsolidatedInvestmentsIncludingVariableInterestEntitiesPrimaryBeneficiaryMemberus-gaap:FairValueInputsLevel2Memberus-gaap:FairValueMeasurementsRecurringMember2022-12-310001889539crbg:ConsolidatedInvestmentsIncludingVariableInterestEntitiesPrimaryBeneficiaryMemberus-gaap:FairValueInputsLevel3Memberus-gaap:FairValueMeasurementsRecurringMember2022-12-310001889539crbg:ConsolidatedInvestmentsIncludingVariableInterestEntitiesPrimaryBeneficiaryMemberus-gaap:FairValueMeasurementsRecurringMember2022-12-310001889539us-gaap:USTreasuryAndGovernmentMemberus-gaap:FairValueInputsLevel1Memberus-gaap:FairValueMeasurementsRecurringMember2021-12-310001889539us-gaap:USTreasuryAndGovernmentMemberus-gaap:FairValueInputsLevel2Memberus-gaap:FairValueMeasurementsRecurringMember2021-12-310001889539us-gaap:USTreasuryAndGovernmentMemberus-gaap:FairValueInputsLevel3Memberus-gaap:FairValueMeasurementsRecurringMember2021-12-310001889539us-gaap:USTreasuryAndGovernmentMemberus-gaap:FairValueMeasurementsRecurringMember2021-12-310001889539us-gaap:FairValueInputsLevel1Memberus-gaap:FairValueMeasurementsRecurringMemberus-gaap:USStatesAndPoliticalSubdivisionsMember2021-12-310001889539us-gaap:FairValueInputsLevel2Memberus-gaap:FairValueMeasurementsRecurringMemberus-gaap:USStatesAndPoliticalSubdivisionsMember2021-12-310001889539us-gaap:FairValueInputsLevel3Memberus-gaap:FairValueMeasurementsRecurringMemberus-gaap:USStatesAndPoliticalSubdivisionsMember2021-12-310001889539us-gaap:FairValueMeasurementsRecurringMemberus-gaap:USStatesAndPoliticalSubdivisionsMember2021-12-310001889539us-gaap:ForeignGovernmentDebtSecuritiesMemberus-gaap:FairValueInputsLevel1Memberus-gaap:FairValueMeasurementsRecurringMember2021-12-310001889539us-gaap:ForeignGovernmentDebtSecuritiesMemberus-gaap:FairValueInputsLevel2Memberus-gaap:FairValueMeasurementsRecurringMember2021-12-310001889539us-gaap:ForeignGovernmentDebtSecuritiesMemberus-gaap:FairValueInputsLevel3Memberus-gaap:FairValueMeasurementsRecurringMember2021-12-310001889539us-gaap:ForeignGovernmentDebtSecuritiesMemberus-gaap:FairValueMeasurementsRecurringMember2021-12-310001889539us-gaap:CorporateDebtSecuritiesMemberus-gaap:FairValueInputsLevel1Memberus-gaap:FairValueMeasurementsRecurringMember2021-12-310001889539us-gaap:CorporateDebtSecuritiesMemberus-gaap:FairValueInputsLevel2Memberus-gaap:FairValueMeasurementsRecurringMember2021-12-310001889539us-gaap:CorporateDebtSecuritiesMemberus-gaap:FairValueInputsLevel3Memberus-gaap:FairValueMeasurementsRecurringMember2021-12-310001889539us-gaap:CorporateDebtSecuritiesMemberus-gaap:FairValueMeasurementsRecurringMember2021-12-310001889539us-gaap:ResidentialMortgageBackedSecuritiesMemberus-gaap:FairValueInputsLevel1Memberus-gaap:FairValueMeasurementsRecurringMember2021-12-310001889539us-gaap:ResidentialMortgageBackedSecuritiesMemberus-gaap:FairValueInputsLevel2Memberus-gaap:FairValueMeasurementsRecurringMember2021-12-310001889539us-gaap:ResidentialMortgageBackedSecuritiesMemberus-gaap:FairValueInputsLevel3Memberus-gaap:FairValueMeasurementsRecurringMember2021-12-310001889539us-gaap:ResidentialMortgageBackedSecuritiesMemberus-gaap:FairValueMeasurementsRecurringMember2021-12-310001889539us-gaap:FairValueInputsLevel1Memberus-gaap:CommercialMortgageBackedSecuritiesMemberus-gaap:FairValueMeasurementsRecurringMember2021-12-310001889539us-gaap:FairValueInputsLevel2Memberus-gaap:CommercialMortgageBackedSecuritiesMemberus-gaap:FairValueMeasurementsRecurringMember2021-12-310001889539us-gaap:FairValueInputsLevel3Memberus-gaap:CommercialMortgageBackedSecuritiesMemberus-gaap:FairValueMeasurementsRecurringMember2021-12-310001889539us-gaap:CommercialMortgageBackedSecuritiesMemberus-gaap:FairValueMeasurementsRecurringMember2021-12-310001889539us-gaap:FairValueInputsLevel1Memberus-gaap:CollateralizedLoanObligationsMemberus-gaap:FairValueMeasurementsRecurringMember2021-12-310001889539us-gaap:CollateralizedLoanObligationsMemberus-gaap:FairValueInputsLevel2Memberus-gaap:FairValueMeasurementsRecurringMember2021-12-310001889539us-gaap:CollateralizedLoanObligationsMemberus-gaap:FairValueInputsLevel3Memberus-gaap:FairValueMeasurementsRecurringMember2021-12-310001889539us-gaap:CollateralizedLoanObligationsMemberus-gaap:FairValueMeasurementsRecurringMember2021-12-310001889539us-gaap:FairValueInputsLevel1Memberus-gaap:AssetBackedSecuritiesMemberus-gaap:FairValueMeasurementsRecurringMember2021-12-310001889539us-gaap:AssetBackedSecuritiesMemberus-gaap:FairValueInputsLevel2Memberus-gaap:FairValueMeasurementsRecurringMember2021-12-310001889539us-gaap:AssetBackedSecuritiesMemberus-gaap:FairValueInputsLevel3Memberus-gaap:FairValueMeasurementsRecurringMember2021-12-310001889539us-gaap:AssetBackedSecuritiesMemberus-gaap:FairValueMeasurementsRecurringMember2021-12-310001889539us-gaap:FairValueInputsLevel1Memberus-gaap:FairValueMeasurementsRecurringMember2021-12-310001889539us-gaap:FairValueInputsLevel2Memberus-gaap:FairValueMeasurementsRecurringMember2021-12-310001889539us-gaap:InterestRateContractMemberus-gaap:FairValueInputsLevel1Memberus-gaap:FairValueMeasurementsRecurringMember2021-12-310001889539us-gaap:InterestRateContractMemberus-gaap:FairValueInputsLevel2Memberus-gaap:FairValueMeasurementsRecurringMember2021-12-310001889539us-gaap:InterestRateContractMemberus-gaap:FairValueInputsLevel3Memberus-gaap:FairValueMeasurementsRecurringMember2021-12-310001889539us-gaap:InterestRateContractMemberus-gaap:FairValueMeasurementsRecurringMember2021-12-310001889539us-gaap:ForeignExchangeContractMemberus-gaap:FairValueInputsLevel1Memberus-gaap:FairValueMeasurementsRecurringMember2021-12-310001889539us-gaap:ForeignExchangeContractMemberus-gaap:FairValueInputsLevel2Memberus-gaap:FairValueMeasurementsRecurringMember2021-12-310001889539us-gaap:ForeignExchangeContractMemberus-gaap:FairValueInputsLevel3Memberus-gaap:FairValueMeasurementsRecurringMember2021-12-310001889539us-gaap:ForeignExchangeContractMemberus-gaap:FairValueMeasurementsRecurringMember2021-12-310001889539us-gaap:EquityContractMemberus-gaap:FairValueInputsLevel1Memberus-gaap:FairValueMeasurementsRecurringMember2021-12-310001889539us-gaap:EquityContractMemberus-gaap:FairValueInputsLevel2Memberus-gaap:FairValueMeasurementsRecurringMember2021-12-310001889539us-gaap:EquityContractMemberus-gaap:FairValueInputsLevel3Memberus-gaap:FairValueMeasurementsRecurringMember2021-12-310001889539us-gaap:EquityContractMemberus-gaap:FairValueMeasurementsRecurringMember2021-12-310001889539us-gaap:CreditRiskContractMemberus-gaap:FairValueInputsLevel1Memberus-gaap:FairValueMeasurementsRecurringMember2021-12-310001889539us-gaap:CreditRiskContractMemberus-gaap:FairValueInputsLevel2Memberus-gaap:FairValueMeasurementsRecurringMember2021-12-310001889539us-gaap:CreditRiskContractMemberus-gaap:FairValueInputsLevel3Memberus-gaap:FairValueMeasurementsRecurringMember2021-12-310001889539us-gaap:CreditRiskContractMemberus-gaap:FairValueMeasurementsRecurringMember2021-12-310001889539us-gaap:FairValueInputsLevel1Memberus-gaap:OtherContractMemberus-gaap:FairValueMeasurementsRecurringMember2021-12-310001889539us-gaap:FairValueInputsLevel2Memberus-gaap:OtherContractMemberus-gaap:FairValueMeasurementsRecurringMember2021-12-310001889539us-gaap:OtherContractMemberus-gaap:FairValueInputsLevel3Memberus-gaap:FairValueMeasurementsRecurringMember2021-12-310001889539us-gaap:OtherContractMemberus-gaap:FairValueMeasurementsRecurringMember2021-12-310001889539us-gaap:ResidentialMortgageBackedSecuritiesMembersrt:AffiliatedEntityMemberus-gaap:FairValueInputsLevel2Memberus-gaap:FairValueMeasurementsRecurringMember2022-12-310001889539us-gaap:ResidentialMortgageBackedSecuritiesMembersrt:AffiliatedEntityMemberus-gaap:FairValueInputsLevel3Memberus-gaap:FairValueMeasurementsRecurringMember2022-12-310001889539us-gaap:ResidentialMortgageBackedSecuritiesMembersrt:AffiliatedEntityMemberus-gaap:FairValueInputsLevel2Memberus-gaap:FairValueMeasurementsRecurringMember2021-12-310001889539us-gaap:ResidentialMortgageBackedSecuritiesMembersrt:AffiliatedEntityMemberus-gaap:FairValueInputsLevel3Memberus-gaap:FairValueMeasurementsRecurringMember2021-12-310001889539srt:AffiliatedEntityMemberus-gaap:CollateralizedLoanObligationsMemberus-gaap:FairValueInputsLevel3Memberus-gaap:FairValueMeasurementsRecurringMember2022-12-310001889539srt:AffiliatedEntityMemberus-gaap:CollateralizedLoanObligationsMemberus-gaap:FairValueInputsLevel3Memberus-gaap:FairValueMeasurementsRecurringMember2021-12-310001889539us-gaap:ResidentialMortgageBackedSecuritiesMembersrt:MaximumMembersrt:AffiliatedEntityMemberus-gaap:FairValueInputsLevel2Memberus-gaap:FairValueMeasurementsRecurringMember2022-12-310001889539us-gaap:ResidentialMortgageBackedSecuritiesMembersrt:MaximumMembersrt:AffiliatedEntityMemberus-gaap:FairValueInputsLevel2Memberus-gaap:FairValueMeasurementsRecurringMember2021-12-310001889539us-gaap:FairValueMeasuredAtNetAssetValuePerShareMember2022-12-310001889539us-gaap:FairValueMeasuredAtNetAssetValuePerShareMember2021-12-310001889539us-gaap:AvailableforsaleSecuritiesMemberus-gaap:USStatesAndPoliticalSubdivisionsMember2021-12-310001889539us-gaap:AvailableforsaleSecuritiesMemberus-gaap:USStatesAndPoliticalSubdivisionsMember2022-01-012022-12-310001889539us-gaap:AvailableforsaleSecuritiesMemberus-gaap:USStatesAndPoliticalSubdivisionsMember2022-12-310001889539us-gaap:CorporateDebtSecuritiesMemberus-gaap:AvailableforsaleSecuritiesMember2021-12-310001889539us-gaap:CorporateDebtSecuritiesMemberus-gaap:AvailableforsaleSecuritiesMember2022-01-012022-12-310001889539us-gaap:CorporateDebtSecuritiesMemberus-gaap:AvailableforsaleSecuritiesMember2022-12-310001889539us-gaap:ResidentialMortgageBackedSecuritiesMemberus-gaap:AvailableforsaleSecuritiesMember2021-12-310001889539us-gaap:ResidentialMortgageBackedSecuritiesMemberus-gaap:AvailableforsaleSecuritiesMember2022-01-012022-12-310001889539us-gaap:ResidentialMortgageBackedSecuritiesMemberus-gaap:AvailableforsaleSecuritiesMember2022-12-310001889539us-gaap:CommercialMortgageBackedSecuritiesMemberus-gaap:AvailableforsaleSecuritiesMember2021-12-310001889539us-gaap:CommercialMortgageBackedSecuritiesMemberus-gaap:AvailableforsaleSecuritiesMember2022-01-012022-12-310001889539us-gaap:CommercialMortgageBackedSecuritiesMemberus-gaap:AvailableforsaleSecuritiesMember2022-12-310001889539us-gaap:CollateralizedLoanObligationsMemberus-gaap:AvailableforsaleSecuritiesMember2021-12-310001889539us-gaap:CollateralizedLoanObligationsMemberus-gaap:AvailableforsaleSecuritiesMember2022-01-012022-12-310001889539us-gaap:AssetBackedSecuritiesMemberus-gaap:AvailableforsaleSecuritiesMember2022-01-012022-12-310001889539us-gaap:CollateralizedLoanObligationsMemberus-gaap:AvailableforsaleSecuritiesMember2022-12-310001889539us-gaap:AssetBackedSecuritiesMemberus-gaap:AvailableforsaleSecuritiesMember2021-12-310001889539us-gaap:AssetBackedSecuritiesMemberus-gaap:AvailableforsaleSecuritiesMember2022-12-310001889539us-gaap:AvailableforsaleSecuritiesMember2021-12-310001889539us-gaap:AvailableforsaleSecuritiesMember2022-01-012022-12-310001889539us-gaap:AvailableforsaleSecuritiesMember2022-12-310001889539crbg:AvailableForSaleDebtSecuritiesOtherMemberus-gaap:CorporateDebtSecuritiesMember2021-12-310001889539crbg:AvailableForSaleDebtSecuritiesOtherMemberus-gaap:CorporateDebtSecuritiesMember2022-01-012022-12-310001889539crbg:AvailableForSaleDebtSecuritiesOtherMemberus-gaap:CorporateDebtSecuritiesMember2022-12-310001889539crbg:AvailableForSaleDebtSecuritiesOtherMemberus-gaap:ResidentialMortgageBackedSecuritiesMember2021-12-310001889539crbg:AvailableForSaleDebtSecuritiesOtherMemberus-gaap:ResidentialMortgageBackedSecuritiesMember2022-01-012022-12-310001889539crbg:AvailableForSaleDebtSecuritiesOtherMemberus-gaap:ResidentialMortgageBackedSecuritiesMember2022-12-310001889539crbg:AvailableForSaleDebtSecuritiesOtherMemberus-gaap:CommercialMortgageBackedSecuritiesMember2021-12-310001889539crbg:AvailableForSaleDebtSecuritiesOtherMemberus-gaap:CommercialMortgageBackedSecuritiesMember2022-01-012022-12-310001889539crbg:AvailableForSaleDebtSecuritiesOtherMemberus-gaap:CommercialMortgageBackedSecuritiesMember2022-12-310001889539crbg:AvailableForSaleDebtSecuritiesOtherMemberus-gaap:CollateralizedLoanObligationsMember2021-12-310001889539crbg:AvailableForSaleDebtSecuritiesOtherMemberus-gaap:CollateralizedLoanObligationsMember2022-01-012022-12-310001889539crbg:AvailableForSaleDebtSecuritiesOtherMemberus-gaap:AssetBackedSecuritiesMember2022-01-012022-12-310001889539crbg:AvailableForSaleDebtSecuritiesOtherMemberus-gaap:CollateralizedLoanObligationsMember2022-12-310001889539crbg:AvailableForSaleDebtSecuritiesOtherMemberus-gaap:AssetBackedSecuritiesMember2021-12-310001889539crbg:AvailableForSaleDebtSecuritiesOtherMemberus-gaap:AssetBackedSecuritiesMember2022-12-310001889539crbg:AvailableForSaleDebtSecuritiesOtherMember2021-12-310001889539crbg:AvailableForSaleDebtSecuritiesOtherMember2022-01-012022-12-310001889539crbg:AvailableForSaleDebtSecuritiesOtherMember2022-12-310001889539us-gaap:EquitySecuritiesMember2021-12-310001889539us-gaap:EquitySecuritiesMember2022-01-012022-12-310001889539us-gaap:EquitySecuritiesMember2022-12-310001889539crbg:OtherInvestedAssetsMember2021-12-310001889539crbg:OtherInvestedAssetsMember2022-01-012022-12-310001889539crbg:OtherInvestedAssetsMember2022-12-310001889539crbg:PolicyholderContractDepositsMember2021-12-310001889539crbg:PolicyholderContractDepositsMember2022-01-012022-12-310001889539crbg:PolicyholderContractDepositsMember2022-12-310001889539us-gaap:InterestRateContractMember2021-12-310001889539us-gaap:InterestRateContractMember2022-01-012022-12-310001889539us-gaap:InterestRateContractMember2022-12-310001889539us-gaap:ForeignExchangeContractMember2021-12-310001889539us-gaap:ForeignExchangeContractMember2022-01-012022-12-310001889539us-gaap:ForeignExchangeContractMember2022-12-310001889539us-gaap:EquityContractMember2021-12-310001889539us-gaap:EquityContractMember2022-01-012022-12-310001889539us-gaap:EquityContractMember2022-12-310001889539us-gaap:CreditRiskContractMember2021-12-310001889539us-gaap:CreditRiskContractMember2022-01-012022-12-310001889539us-gaap:CreditRiskContractMember2022-12-310001889539us-gaap:OtherContractMember2021-12-310001889539us-gaap:OtherContractMember2022-01-012022-12-310001889539us-gaap:OtherContractMember2022-12-310001889539us-gaap:DerivativeFinancialInstrumentsLiabilitiesMember2021-12-310001889539us-gaap:DerivativeFinancialInstrumentsLiabilitiesMember2022-01-012022-12-310001889539us-gaap:DerivativeFinancialInstrumentsLiabilitiesMember2022-12-310001889539crbg:FundsHeldUnderReinsuranceAgreementsLiabilityMember2021-12-310001889539crbg:FundsHeldUnderReinsuranceAgreementsLiabilityMember2022-01-012022-12-310001889539crbg:FundsHeldUnderReinsuranceAgreementsLiabilityMember2022-12-310001889539us-gaap:LongTermDebtMember2021-12-310001889539us-gaap:LongTermDebtMember2022-01-012022-12-310001889539us-gaap:LongTermDebtMember2022-12-310001889539us-gaap:AvailableforsaleSecuritiesMemberus-gaap:USStatesAndPoliticalSubdivisionsMember2020-12-310001889539us-gaap:AvailableforsaleSecuritiesMemberus-gaap:USStatesAndPoliticalSubdivisionsMember2021-01-012021-12-310001889539us-gaap:CorporateDebtSecuritiesMemberus-gaap:AvailableforsaleSecuritiesMember2020-12-310001889539us-gaap:CorporateDebtSecuritiesMemberus-gaap:AvailableforsaleSecuritiesMember2021-01-012021-12-310001889539us-gaap:ResidentialMortgageBackedSecuritiesMemberus-gaap:AvailableforsaleSecuritiesMember2020-12-310001889539us-gaap:ResidentialMortgageBackedSecuritiesMemberus-gaap:AvailableforsaleSecuritiesMember2021-01-012021-12-310001889539us-gaap:CommercialMortgageBackedSecuritiesMemberus-gaap:AvailableforsaleSecuritiesMember2020-12-310001889539us-gaap:CommercialMortgageBackedSecuritiesMemberus-gaap:AvailableforsaleSecuritiesMember2021-01-012021-12-310001889539us-gaap:CollateralizedLoanObligationsMemberus-gaap:AvailableforsaleSecuritiesMember2020-12-310001889539us-gaap:CollateralizedLoanObligationsMemberus-gaap:AvailableforsaleSecuritiesMember2021-01-012021-12-310001889539us-gaap:AssetBackedSecuritiesMemberus-gaap:AvailableforsaleSecuritiesMember2020-12-310001889539us-gaap:AssetBackedSecuritiesMemberus-gaap:AvailableforsaleSecuritiesMember2021-01-012021-12-310001889539us-gaap:AvailableforsaleSecuritiesMember2020-12-310001889539us-gaap:AvailableforsaleSecuritiesMember2021-01-012021-12-310001889539crbg:AvailableForSaleDebtSecuritiesOtherMemberus-gaap:CorporateDebtSecuritiesMember2020-12-310001889539crbg:AvailableForSaleDebtSecuritiesOtherMemberus-gaap:CorporateDebtSecuritiesMember2021-01-012021-12-310001889539crbg:AvailableForSaleDebtSecuritiesOtherMemberus-gaap:ResidentialMortgageBackedSecuritiesMember2020-12-310001889539crbg:AvailableForSaleDebtSecuritiesOtherMemberus-gaap:ResidentialMortgageBackedSecuritiesMember2021-01-012021-12-310001889539crbg:AvailableForSaleDebtSecuritiesOtherMemberus-gaap:CommercialMortgageBackedSecuritiesMember2020-12-310001889539crbg:AvailableForSaleDebtSecuritiesOtherMemberus-gaap:CommercialMortgageBackedSecuritiesMember2021-01-012021-12-310001889539crbg:AvailableForSaleDebtSecuritiesOtherMemberus-gaap:CollateralizedLoanObligationsMember2020-12-310001889539crbg:AvailableForSaleDebtSecuritiesOtherMemberus-gaap:CollateralizedLoanObligationsMember2021-01-012021-12-310001889539crbg:AvailableForSaleDebtSecuritiesOtherMemberus-gaap:AssetBackedSecuritiesMember2020-12-310001889539crbg:AvailableForSaleDebtSecuritiesOtherMemberus-gaap:AssetBackedSecuritiesMember2021-01-012021-12-310001889539crbg:AvailableForSaleDebtSecuritiesOtherMember2020-12-310001889539crbg:AvailableForSaleDebtSecuritiesOtherMember2021-01-012021-12-310001889539us-gaap:EquitySecuritiesMember2020-12-310001889539us-gaap:EquitySecuritiesMember2021-01-012021-12-310001889539crbg:OtherInvestedAssetsMember2020-12-310001889539crbg:OtherInvestedAssetsMember2021-01-012021-12-310001889539crbg:PolicyholderContractDepositsMember2020-12-310001889539crbg:PolicyholderContractDepositsMember2021-01-012021-12-310001889539us-gaap:InterestRateContractMember2020-12-310001889539us-gaap:InterestRateContractMember2021-01-012021-12-310001889539us-gaap:ForeignExchangeContractMember2020-12-310001889539us-gaap:ForeignExchangeContractMember2021-01-012021-12-310001889539us-gaap:EquityContractMember2020-12-310001889539us-gaap:EquityContractMember2021-01-012021-12-310001889539us-gaap:CreditRiskContractMember2020-12-310001889539us-gaap:CreditRiskContractMember2021-01-012021-12-310001889539us-gaap:OtherContractMember2020-12-310001889539us-gaap:OtherContractMember2021-01-012021-12-310001889539us-gaap:DerivativeFinancialInstrumentsLiabilitiesMember2020-12-310001889539us-gaap:DerivativeFinancialInstrumentsLiabilitiesMember2021-01-012021-12-310001889539crbg:FundsHeldUnderReinsuranceAgreementsLiabilityMember2020-12-310001889539crbg:FundsHeldUnderReinsuranceAgreementsLiabilityMember2021-01-012021-12-310001889539us-gaap:LongTermDebtMember2020-12-310001889539us-gaap:LongTermDebtMember2021-01-012021-12-310001889539crbg:PolicyFeesMemberus-gaap:AvailableforsaleSecuritiesMember2022-01-012022-12-310001889539us-gaap:InvestmentIncomeMemberus-gaap:AvailableforsaleSecuritiesMember2022-01-012022-12-310001889539crbg:RealizedInvestmentGainsLossesMemberus-gaap:AvailableforsaleSecuritiesMember2022-01-012022-12-310001889539us-gaap:OtherIncomeMemberus-gaap:AvailableforsaleSecuritiesMember2022-01-012022-12-310001889539crbg:MarketRiskBenefitChangeInFairValueGainLossMemberus-gaap:AvailableforsaleSecuritiesMember2022-01-012022-12-310001889539crbg:AvailableForSaleDebtSecuritiesOtherMembercrbg:PolicyFeesMember2022-01-012022-12-310001889539crbg:AvailableForSaleDebtSecuritiesOtherMemberus-gaap:InvestmentIncomeMember2022-01-012022-12-310001889539crbg:AvailableForSaleDebtSecuritiesOtherMembercrbg:RealizedInvestmentGainsLossesMember2022-01-012022-12-310001889539crbg:AvailableForSaleDebtSecuritiesOtherMemberus-gaap:OtherIncomeMember2022-01-012022-12-310001889539crbg:AvailableForSaleDebtSecuritiesOtherMembercrbg:MarketRiskBenefitChangeInFairValueGainLossMember2022-01-012022-12-310001889539us-gaap:EquitySecuritiesMembercrbg:PolicyFeesMember2022-01-012022-12-310001889539us-gaap:EquitySecuritiesMemberus-gaap:InvestmentIncomeMember2022-01-012022-12-310001889539us-gaap:EquitySecuritiesMembercrbg:RealizedInvestmentGainsLossesMember2022-01-012022-12-310001889539us-gaap:EquitySecuritiesMemberus-gaap:OtherIncomeMember2022-01-012022-12-310001889539crbg:MarketRiskBenefitChangeInFairValueGainLossMemberus-gaap:EquitySecuritiesMember2022-01-012022-12-310001889539crbg:OtherInvestedAssetsMembercrbg:PolicyFeesMember2022-01-012022-12-310001889539crbg:OtherInvestedAssetsMemberus-gaap:InvestmentIncomeMember2022-01-012022-12-310001889539crbg:OtherInvestedAssetsMembercrbg:RealizedInvestmentGainsLossesMember2022-01-012022-12-310001889539crbg:OtherInvestedAssetsMemberus-gaap:OtherIncomeMember2022-01-012022-12-310001889539crbg:MarketRiskBenefitChangeInFairValueGainLossMembercrbg:OtherInvestedAssetsMember2022-01-012022-12-310001889539crbg:PolicyFeesMemberus-gaap:AvailableforsaleSecuritiesMember2021-01-012021-12-310001889539us-gaap:InvestmentIncomeMemberus-gaap:AvailableforsaleSecuritiesMember2021-01-012021-12-310001889539crbg:RealizedInvestmentGainsLossesMemberus-gaap:AvailableforsaleSecuritiesMember2021-01-012021-12-310001889539us-gaap:OtherIncomeMemberus-gaap:AvailableforsaleSecuritiesMember2021-01-012021-12-310001889539crbg:MarketRiskBenefitChangeInFairValueGainLossMemberus-gaap:AvailableforsaleSecuritiesMember2021-01-012021-12-310001889539crbg:AvailableForSaleDebtSecuritiesOtherMembercrbg:PolicyFeesMember2021-01-012021-12-310001889539crbg:AvailableForSaleDebtSecuritiesOtherMemberus-gaap:InvestmentIncomeMember2021-01-012021-12-310001889539crbg:AvailableForSaleDebtSecuritiesOtherMembercrbg:RealizedInvestmentGainsLossesMember2021-01-012021-12-310001889539crbg:AvailableForSaleDebtSecuritiesOtherMemberus-gaap:OtherIncomeMember2021-01-012021-12-310001889539crbg:AvailableForSaleDebtSecuritiesOtherMembercrbg:MarketRiskBenefitChangeInFairValueGainLossMember2021-01-012021-12-310001889539us-gaap:EquitySecuritiesMembercrbg:PolicyFeesMember2021-01-012021-12-310001889539us-gaap:EquitySecuritiesMemberus-gaap:InvestmentIncomeMember2021-01-012021-12-310001889539us-gaap:EquitySecuritiesMembercrbg:RealizedInvestmentGainsLossesMember2021-01-012021-12-310001889539us-gaap:EquitySecuritiesMemberus-gaap:OtherIncomeMember2021-01-012021-12-310001889539crbg:MarketRiskBenefitChangeInFairValueGainLossMemberus-gaap:EquitySecuritiesMember2021-01-012021-12-310001889539crbg:OtherInvestedAssetsMembercrbg:PolicyFeesMember2021-01-012021-12-310001889539crbg:OtherInvestedAssetsMemberus-gaap:InvestmentIncomeMember2021-01-012021-12-310001889539crbg:OtherInvestedAssetsMembercrbg:RealizedInvestmentGainsLossesMember2021-01-012021-12-310001889539crbg:OtherInvestedAssetsMemberus-gaap:OtherIncomeMember2021-01-012021-12-310001889539crbg:MarketRiskBenefitChangeInFairValueGainLossMembercrbg:OtherInvestedAssetsMember2021-01-012021-12-310001889539crbg:PolicyFeesMembercrbg:PolicyholderContractDepositsMember2022-01-012022-12-310001889539crbg:PolicyholderContractDepositsMemberus-gaap:InvestmentIncomeMember2022-01-012022-12-310001889539crbg:PolicyholderContractDepositsMembercrbg:RealizedInvestmentGainsLossesMember2022-01-012022-12-310001889539crbg:PolicyholderContractDepositsMemberus-gaap:OtherIncomeMember2022-01-012022-12-310001889539crbg:MarketRiskBenefitChangeInFairValueGainLossMembercrbg:PolicyholderContractDepositsMember2022-01-012022-12-310001889539crbg:PolicyFeesMemberus-gaap:DerivativeFinancialInstrumentsLiabilitiesMember2022-01-012022-12-310001889539us-gaap:DerivativeFinancialInstrumentsLiabilitiesMemberus-gaap:InvestmentIncomeMember2022-01-012022-12-310001889539us-gaap:DerivativeFinancialInstrumentsLiabilitiesMembercrbg:RealizedInvestmentGainsLossesMember2022-01-012022-12-310001889539us-gaap:DerivativeFinancialInstrumentsLiabilitiesMemberus-gaap:OtherIncomeMember2022-01-012022-12-310001889539crbg:MarketRiskBenefitChangeInFairValueGainLossMemberus-gaap:DerivativeFinancialInstrumentsLiabilitiesMember2022-01-012022-12-310001889539crbg:PolicyFeesMembercrbg:FundsHeldUnderReinsuranceAgreementsLiabilityMember2022-01-012022-12-310001889539crbg:FundsHeldUnderReinsuranceAgreementsLiabilityMemberus-gaap:InvestmentIncomeMember2022-01-012022-12-310001889539crbg:RealizedInvestmentGainsLossesMembercrbg:FundsHeldUnderReinsuranceAgreementsLiabilityMember2022-01-012022-12-310001889539us-gaap:OtherIncomeMembercrbg:FundsHeldUnderReinsuranceAgreementsLiabilityMember2022-01-012022-12-310001889539crbg:MarketRiskBenefitChangeInFairValueGainLossMembercrbg:FundsHeldUnderReinsuranceAgreementsLiabilityMember2022-01-012022-12-310001889539crbg:PolicyFeesMembercrbg:MarketRiskBenefitLiabilitiesMember2022-01-012022-12-310001889539us-gaap:InvestmentIncomeMembercrbg:MarketRiskBenefitLiabilitiesMember2022-01-012022-12-310001889539crbg:RealizedInvestmentGainsLossesMembercrbg:MarketRiskBenefitLiabilitiesMember2022-01-012022-12-310001889539us-gaap:OtherIncomeMembercrbg:MarketRiskBenefitLiabilitiesMember2022-01-012022-12-310001889539crbg:MarketRiskBenefitChangeInFairValueGainLossMembercrbg:MarketRiskBenefitLiabilitiesMember2022-01-012022-12-310001889539crbg:MarketRiskBenefitLiabilitiesMember2022-01-012022-12-310001889539crbg:PolicyFeesMemberus-gaap:LongTermDebtMember2022-01-012022-12-310001889539us-gaap:InvestmentIncomeMemberus-gaap:LongTermDebtMember2022-01-012022-12-310001889539crbg:RealizedInvestmentGainsLossesMemberus-gaap:LongTermDebtMember2022-01-012022-12-310001889539us-gaap:OtherIncomeMemberus-gaap:LongTermDebtMember2022-01-012022-12-310001889539crbg:MarketRiskBenefitChangeInFairValueGainLossMemberus-gaap:LongTermDebtMember2022-01-012022-12-310001889539crbg:PolicyFeesMembercrbg:PolicyholderContractDepositsMember2021-01-012021-12-310001889539crbg:PolicyholderContractDepositsMemberus-gaap:InvestmentIncomeMember2021-01-012021-12-310001889539crbg:PolicyholderContractDepositsMembercrbg:RealizedInvestmentGainsLossesMember2021-01-012021-12-310001889539crbg:PolicyholderContractDepositsMemberus-gaap:OtherIncomeMember2021-01-012021-12-310001889539crbg:MarketRiskBenefitChangeInFairValueGainLossMembercrbg:PolicyholderContractDepositsMember2021-01-012021-12-310001889539crbg:PolicyFeesMemberus-gaap:DerivativeFinancialInstrumentsLiabilitiesMember2021-01-012021-12-310001889539us-gaap:DerivativeFinancialInstrumentsLiabilitiesMemberus-gaap:InvestmentIncomeMember2021-01-012021-12-310001889539us-gaap:DerivativeFinancialInstrumentsLiabilitiesMembercrbg:RealizedInvestmentGainsLossesMember2021-01-012021-12-310001889539us-gaap:DerivativeFinancialInstrumentsLiabilitiesMemberus-gaap:OtherIncomeMember2021-01-012021-12-310001889539crbg:MarketRiskBenefitChangeInFairValueGainLossMemberus-gaap:DerivativeFinancialInstrumentsLiabilitiesMember2021-01-012021-12-310001889539crbg:PolicyFeesMembercrbg:FundsHeldUnderReinsuranceAgreementsLiabilityMember2021-01-012021-12-310001889539crbg:FundsHeldUnderReinsuranceAgreementsLiabilityMemberus-gaap:InvestmentIncomeMember2021-01-012021-12-310001889539crbg:RealizedInvestmentGainsLossesMembercrbg:FundsHeldUnderReinsuranceAgreementsLiabilityMember2021-01-012021-12-310001889539us-gaap:OtherIncomeMembercrbg:FundsHeldUnderReinsuranceAgreementsLiabilityMember2021-01-012021-12-310001889539crbg:MarketRiskBenefitChangeInFairValueGainLossMembercrbg:FundsHeldUnderReinsuranceAgreementsLiabilityMember2021-01-012021-12-310001889539crbg:PolicyFeesMembercrbg:MarketRiskBenefitLiabilitiesMember2021-01-012021-12-310001889539us-gaap:InvestmentIncomeMembercrbg:MarketRiskBenefitLiabilitiesMember2021-01-012021-12-310001889539crbg:RealizedInvestmentGainsLossesMembercrbg:MarketRiskBenefitLiabilitiesMember2021-01-012021-12-310001889539us-gaap:OtherIncomeMembercrbg:MarketRiskBenefitLiabilitiesMember2021-01-012021-12-310001889539crbg:MarketRiskBenefitChangeInFairValueGainLossMembercrbg:MarketRiskBenefitLiabilitiesMember2021-01-012021-12-310001889539crbg:MarketRiskBenefitLiabilitiesMember2021-01-012021-12-310001889539crbg:PolicyFeesMemberus-gaap:LongTermDebtMember2021-01-012021-12-310001889539us-gaap:InvestmentIncomeMemberus-gaap:LongTermDebtMember2021-01-012021-12-310001889539crbg:RealizedInvestmentGainsLossesMemberus-gaap:LongTermDebtMember2021-01-012021-12-310001889539us-gaap:OtherIncomeMemberus-gaap:LongTermDebtMember2021-01-012021-12-310001889539crbg:MarketRiskBenefitChangeInFairValueGainLossMemberus-gaap:LongTermDebtMember2021-01-012021-12-310001889539us-gaap:FairValueInputsLevel3Memberus-gaap:USStatesAndPoliticalSubdivisionsMember2022-12-310001889539crbg:MeasurementInputYieldMembersrt:MinimumMemberus-gaap:USStatesAndPoliticalSubdivisionsMember2022-12-310001889539srt:MaximumMembercrbg:MeasurementInputYieldMemberus-gaap:USStatesAndPoliticalSubdivisionsMember2022-12-310001889539crbg:MeasurementInputYieldMembersrt:WeightedAverageMemberus-gaap:USStatesAndPoliticalSubdivisionsMember2022-12-310001889539us-gaap:CorporateDebtSecuritiesMemberus-gaap:FairValueInputsLevel3Member2022-12-310001889539us-gaap:CorporateDebtSecuritiesMembercrbg:MeasurementInputYieldMembersrt:MinimumMember2022-12-310001889539us-gaap:CorporateDebtSecuritiesMembersrt:MaximumMembercrbg:MeasurementInputYieldMember2022-12-310001889539us-gaap:CorporateDebtSecuritiesMembercrbg:MeasurementInputYieldMembersrt:WeightedAverageMember2022-12-310001889539us-gaap:ResidentialMortgageBackedSecuritiesMemberus-gaap:FairValueInputsLevel3Member2022-12-310001889539us-gaap:ResidentialMortgageBackedSecuritiesMembersrt:MinimumMemberus-gaap:MeasurementInputConstantPrepaymentRateMember2022-12-310001889539us-gaap:ResidentialMortgageBackedSecuritiesMembersrt:MaximumMemberus-gaap:MeasurementInputConstantPrepaymentRateMember2022-12-310001889539us-gaap:ResidentialMortgageBackedSecuritiesMemberus-gaap:MeasurementInputConstantPrepaymentRateMembersrt:WeightedAverageMember2022-12-310001889539us-gaap:ResidentialMortgageBackedSecuritiesMembersrt:MinimumMemberus-gaap:MeasurementInputLossSeverityMember2022-12-310001889539us-gaap:ResidentialMortgageBackedSecuritiesMembersrt:MaximumMemberus-gaap:MeasurementInputLossSeverityMember2022-12-310001889539us-gaap:ResidentialMortgageBackedSecuritiesMemberus-gaap:MeasurementInputLossSeverityMembersrt:WeightedAverageMember2022-12-310001889539us-gaap:ResidentialMortgageBackedSecuritiesMembersrt:MinimumMemberus-gaap:MeasurementInputDefaultRateMember2022-12-310001889539us-gaap:ResidentialMortgageBackedSecuritiesMembersrt:MaximumMemberus-gaap:MeasurementInputDefaultRateMember2022-12-310001889539us-gaap:ResidentialMortgageBackedSecuritiesMemberus-gaap:MeasurementInputDefaultRateMembersrt:WeightedAverageMember2022-12-310001889539us-gaap:ResidentialMortgageBackedSecuritiesMembercrbg:MeasurementInputYieldMembersrt:MinimumMember2022-12-310001889539us-gaap:ResidentialMortgageBackedSecuritiesMembersrt:MaximumMembercrbg:MeasurementInputYieldMember2022-12-310001889539us-gaap:ResidentialMortgageBackedSecuritiesMembercrbg:MeasurementInputYieldMembersrt:WeightedAverageMember2022-12-310001889539us-gaap:FairValueInputsLevel3Membercrbg:CollateralizedLoanObligationMember2022-12-310001889539crbg:MeasurementInputYieldMembersrt:MinimumMembercrbg:CollateralizedLoanObligationMember2022-12-310001889539srt:MaximumMembercrbg:MeasurementInputYieldMembercrbg:CollateralizedLoanObligationMember2022-12-310001889539crbg:MeasurementInputYieldMembersrt:WeightedAverageMembercrbg:CollateralizedLoanObligationMember2022-12-310001889539us-gaap:AssetBackedSecuritiesSecuritizedLoansAndReceivablesMemberus-gaap:FairValueInputsLevel3Member2022-12-310001889539us-gaap:AssetBackedSecuritiesSecuritizedLoansAndReceivablesMembercrbg:MeasurementInputYieldMembersrt:MinimumMember2022-12-310001889539us-gaap:AssetBackedSecuritiesSecuritizedLoansAndReceivablesMembersrt:MaximumMembercrbg:MeasurementInputYieldMember2022-12-310001889539us-gaap:AssetBackedSecuritiesSecuritizedLoansAndReceivablesMembercrbg:MeasurementInputYieldMembersrt:WeightedAverageMember2022-12-310001889539us-gaap:CommercialMortgageBackedSecuritiesMemberus-gaap:FairValueInputsLevel3Member2022-12-310001889539crbg:MeasurementInputYieldMembersrt:MinimumMemberus-gaap:CommercialMortgageBackedSecuritiesMember2022-12-310001889539srt:MaximumMembercrbg:MeasurementInputYieldMemberus-gaap:CommercialMortgageBackedSecuritiesMember2022-12-310001889539crbg:MeasurementInputYieldMemberus-gaap:CommercialMortgageBackedSecuritiesMembersrt:WeightedAverageMember2022-12-310001889539crbg:MarketRiskBenefitAssetsMemberus-gaap:FairValueInputsLevel3Member2022-12-310001889539us-gaap:MeasurementInputPriceVolatilityMembersrt:MinimumMembercrbg:MarketRiskBenefitAssetsMember2022-12-310001889539srt:MaximumMemberus-gaap:MeasurementInputPriceVolatilityMembercrbg:MarketRiskBenefitAssetsMember2022-12-310001889539us-gaap:MeasurementInputLapseRateMembersrt:MinimumMembercrbg:MarketRiskBenefitAssetsMember2022-12-310001889539srt:MaximumMemberus-gaap:MeasurementInputLapseRateMembercrbg:MarketRiskBenefitAssetsMember2022-12-310001889539srt:MinimumMembercrbg:MarketRiskBenefitAssetsMembercrbg:MeasurementInputDynamicLapseMultiplierMember2022-12-310001889539srt:MaximumMembercrbg:MarketRiskBenefitAssetsMembercrbg:MeasurementInputDynamicLapseMultiplierMember2022-12-310001889539crbg:MeasurementInputMortalityMultiplierMembersrt:MinimumMembercrbg:MarketRiskBenefitAssetsMember2022-12-310001889539srt:MaximumMembercrbg:MeasurementInputMortalityMultiplierMembercrbg:MarketRiskBenefitAssetsMember2022-12-310001889539us-gaap:MeasurementInputUtilizationRateMembersrt:MinimumMembercrbg:MarketRiskBenefitAssetsMember2022-12-310001889539srt:MaximumMemberus-gaap:MeasurementInputUtilizationRateMembercrbg:MarketRiskBenefitAssetsMember2022-12-310001889539crbg:MeasurementInputEquityInterestRateCorrelationMembersrt:MinimumMembercrbg:MarketRiskBenefitAssetsMember2022-12-310001889539crbg:MeasurementInputEquityInterestRateCorrelationMembersrt:MaximumMembercrbg:MarketRiskBenefitAssetsMember2022-12-310001889539srt:MinimumMembercrbg:MarketRiskBenefitAssetsMemberus-gaap:MeasurementInputCounterpartyCreditRiskMember2022-12-310001889539srt:MaximumMembercrbg:MarketRiskBenefitAssetsMemberus-gaap:MeasurementInputCounterpartyCreditRiskMember2022-12-310001889539us-gaap:GuaranteedMinimumWithdrawalBenefitMemberus-gaap:FairValueInputsLevel3Member2022-12-310001889539us-gaap:GuaranteedMinimumWithdrawalBenefitMemberus-gaap:MeasurementInputPriceVolatilityMembersrt:MinimumMember2022-12-310001889539srt:MaximumMemberus-gaap:GuaranteedMinimumWithdrawalBenefitMemberus-gaap:MeasurementInputPriceVolatilityMember2022-12-310001889539us-gaap:GuaranteedMinimumWithdrawalBenefitMemberus-gaap:MeasurementInputLapseRateMembersrt:MinimumMember2022-12-310001889539srt:MaximumMemberus-gaap:GuaranteedMinimumWithdrawalBenefitMemberus-gaap:MeasurementInputLapseRateMember2022-12-310001889539us-gaap:GuaranteedMinimumWithdrawalBenefitMembersrt:MinimumMembercrbg:MeasurementInputDynamicLapseMultiplierMember2022-12-310001889539srt:MaximumMemberus-gaap:GuaranteedMinimumWithdrawalBenefitMembercrbg:MeasurementInputDynamicLapseMultiplierMember2022-12-310001889539crbg:MeasurementInputMortalityMultiplierMemberus-gaap:GuaranteedMinimumWithdrawalBenefitMembersrt:MinimumMember2022-12-310001889539srt:MaximumMembercrbg:MeasurementInputMortalityMultiplierMemberus-gaap:GuaranteedMinimumWithdrawalBenefitMember2022-12-310001889539us-gaap:MeasurementInputUtilizationRateMemberus-gaap:GuaranteedMinimumWithdrawalBenefitMembersrt:MinimumMember2022-12-310001889539srt:MaximumMemberus-gaap:MeasurementInputUtilizationRateMemberus-gaap:GuaranteedMinimumWithdrawalBenefitMember2022-12-310001889539crbg:MeasurementInputEquityInterestRateCorrelationMemberus-gaap:GuaranteedMinimumWithdrawalBenefitMembersrt:MinimumMember2022-12-310001889539crbg:MeasurementInputEquityInterestRateCorrelationMembersrt:MaximumMemberus-gaap:GuaranteedMinimumWithdrawalBenefitMember2022-12-310001889539us-gaap:GuaranteedMinimumWithdrawalBenefitMembersrt:MinimumMemberus-gaap:MeasurementInputCounterpartyCreditRiskMember2022-12-310001889539srt:MaximumMemberus-gaap:GuaranteedMinimumWithdrawalBenefitMemberus-gaap:MeasurementInputCounterpartyCreditRiskMember2022-12-310001889539crbg:AnnuitiesIncludingCertainGuaranteedMinimumWithdrawalBenefitsMemberus-gaap:FairValueInputsLevel3Member2022-12-310001889539crbg:AnnuitiesIncludingCertainGuaranteedMinimumWithdrawalBenefitsMemberus-gaap:MeasurementInputLapseRateMembersrt:MinimumMember2022-12-310001889539srt:MaximumMembercrbg:AnnuitiesIncludingCertainGuaranteedMinimumWithdrawalBenefitsMemberus-gaap:MeasurementInputLapseRateMember2022-12-310001889539crbg:AnnuitiesIncludingCertainGuaranteedMinimumWithdrawalBenefitsMembersrt:MinimumMembercrbg:MeasurementInputDynamicLapseMultiplierMember2022-12-310001889539srt:MaximumMembercrbg:AnnuitiesIncludingCertainGuaranteedMinimumWithdrawalBenefitsMembercrbg:MeasurementInputDynamicLapseMultiplierMember2022-12-310001889539crbg:MeasurementInputMortalityMultiplierMembercrbg:AnnuitiesIncludingCertainGuaranteedMinimumWithdrawalBenefitsMembersrt:MinimumMember2022-12-310001889539srt:MaximumMembercrbg:MeasurementInputMortalityMultiplierMembercrbg:AnnuitiesIncludingCertainGuaranteedMinimumWithdrawalBenefitsMember2022-12-310001889539crbg:AnnuitiesIncludingCertainGuaranteedMinimumWithdrawalBenefitsMemberus-gaap:MeasurementInputUtilizationRateMembersrt:MinimumMember2022-12-310001889539srt:MaximumMembercrbg:AnnuitiesIncludingCertainGuaranteedMinimumWithdrawalBenefitsMemberus-gaap:MeasurementInputUtilizationRateMember2022-12-310001889539crbg:AnnuitiesIncludingCertainGuaranteedMinimumWithdrawalBenefitsMembersrt:MinimumMemberus-gaap:MeasurementInputCounterpartyCreditRiskMember2022-12-310001889539srt:MaximumMembercrbg:AnnuitiesIncludingCertainGuaranteedMinimumWithdrawalBenefitsMemberus-gaap:MeasurementInputCounterpartyCreditRiskMember2022-12-310001889539crbg:IndexAnnuitiesIncludingCertainGuaranteedMinimumWithdrawalBenefitsMemberus-gaap:FairValueInputsLevel3Member2022-12-310001889539crbg:IndexAnnuitiesIncludingCertainGuaranteedMinimumWithdrawalBenefitsMemberus-gaap:MeasurementInputPriceVolatilityMembersrt:MinimumMember2022-12-310001889539crbg:IndexAnnuitiesIncludingCertainGuaranteedMinimumWithdrawalBenefitsMembersrt:MaximumMemberus-gaap:MeasurementInputPriceVolatilityMember2022-12-310001889539crbg:IndexAnnuitiesIncludingCertainGuaranteedMinimumWithdrawalBenefitsMemberus-gaap:MeasurementInputLapseRateMembersrt:MinimumMember2022-12-310001889539crbg:IndexAnnuitiesIncludingCertainGuaranteedMinimumWithdrawalBenefitsMembersrt:MaximumMemberus-gaap:MeasurementInputLapseRateMember2022-12-310001889539crbg:IndexAnnuitiesIncludingCertainGuaranteedMinimumWithdrawalBenefitsMembersrt:MinimumMembercrbg:MeasurementInputDynamicLapseMultiplierMember2022-12-310001889539crbg:IndexAnnuitiesIncludingCertainGuaranteedMinimumWithdrawalBenefitsMembersrt:MaximumMembercrbg:MeasurementInputDynamicLapseMultiplierMember2022-12-310001889539crbg:IndexAnnuitiesIncludingCertainGuaranteedMinimumWithdrawalBenefitsMembercrbg:MeasurementInputMortalityMultiplierMembersrt:MinimumMember2022-12-310001889539crbg:IndexAnnuitiesIncludingCertainGuaranteedMinimumWithdrawalBenefitsMembersrt:MaximumMembercrbg:MeasurementInputMortalityMultiplierMember2022-12-310001889539crbg:IndexAnnuitiesIncludingCertainGuaranteedMinimumWithdrawalBenefitsMembercrbg:MeasurementInputOptionBudgetMembersrt:MinimumMember2022-12-310001889539crbg:IndexAnnuitiesIncludingCertainGuaranteedMinimumWithdrawalBenefitsMembersrt:MaximumMembercrbg:MeasurementInputOptionBudgetMember2022-12-310001889539crbg:IndexAnnuitiesIncludingCertainGuaranteedMinimumWithdrawalBenefitsMemberus-gaap:MeasurementInputUtilizationRateMembersrt:MinimumMember2022-12-310001889539crbg:IndexAnnuitiesIncludingCertainGuaranteedMinimumWithdrawalBenefitsMembersrt:MaximumMemberus-gaap:MeasurementInputUtilizationRateMember2022-12-310001889539crbg:IndexAnnuitiesIncludingCertainGuaranteedMinimumWithdrawalBenefitsMembercrbg:MeasurementInputEquityInterestRateCorrelationMembersrt:MinimumMember2022-12-310001889539crbg:IndexAnnuitiesIncludingCertainGuaranteedMinimumWithdrawalBenefitsMembercrbg:MeasurementInputEquityInterestRateCorrelationMembersrt:MaximumMember2022-12-310001889539crbg:IndexAnnuitiesIncludingCertainGuaranteedMinimumWithdrawalBenefitsMembersrt:MinimumMemberus-gaap:MeasurementInputCounterpartyCreditRiskMember2022-12-310001889539crbg:IndexAnnuitiesIncludingCertainGuaranteedMinimumWithdrawalBenefitsMembersrt:MaximumMemberus-gaap:MeasurementInputCounterpartyCreditRiskMember2022-12-310001889539crbg:IndexCreditsOnFixedIndexAnnuitiesMemberus-gaap:FairValueInputsLevel3Member2022-12-310001889539crbg:IndexCreditsOnFixedIndexAnnuitiesMemberus-gaap:MeasurementInputPriceVolatilityMembersrt:MinimumMember2022-12-310001889539crbg:IndexCreditsOnFixedIndexAnnuitiesMembersrt:MaximumMemberus-gaap:MeasurementInputPriceVolatilityMember2022-12-310001889539crbg:IndexCreditsOnFixedIndexAnnuitiesMemberus-gaap:MeasurementInputLapseRateMembersrt:MinimumMember2022-12-310001889539crbg:IndexCreditsOnFixedIndexAnnuitiesMembersrt:MaximumMemberus-gaap:MeasurementInputLapseRateMember2022-12-310001889539crbg:IndexCreditsOnFixedIndexAnnuitiesMembersrt:MinimumMembercrbg:MeasurementInputDynamicLapseMultiplierMember2022-12-310001889539crbg:IndexCreditsOnFixedIndexAnnuitiesMembersrt:MaximumMembercrbg:MeasurementInputDynamicLapseMultiplierMember2022-12-310001889539crbg:IndexCreditsOnFixedIndexAnnuitiesMembercrbg:MeasurementInputMortalityMultiplierMembersrt:MinimumMember2022-12-310001889539crbg:IndexCreditsOnFixedIndexAnnuitiesMembersrt:MaximumMembercrbg:MeasurementInputMortalityMultiplierMember2022-12-310001889539crbg:IndexCreditsOnFixedIndexAnnuitiesMemberus-gaap:MeasurementInputUtilizationRateMembersrt:MinimumMember2022-12-310001889539crbg:IndexCreditsOnFixedIndexAnnuitiesMembersrt:MaximumMemberus-gaap:MeasurementInputUtilizationRateMember2022-12-310001889539crbg:IndexCreditsOnFixedIndexAnnuitiesMembercrbg:MeasurementInputOptionBudgetMembersrt:MinimumMember2022-12-310001889539crbg:IndexCreditsOnFixedIndexAnnuitiesMembersrt:MaximumMembercrbg:MeasurementInputOptionBudgetMember2022-12-310001889539crbg:IndexCreditsOnFixedIndexAnnuitiesMembercrbg:MeasurementInputEquityInterestRateCorrelationMembersrt:MinimumMember2022-12-310001889539crbg:IndexCreditsOnFixedIndexAnnuitiesMembercrbg:MeasurementInputEquityInterestRateCorrelationMembersrt:MaximumMember2022-12-310001889539crbg:IndexCreditsOnFixedIndexAnnuitiesMembersrt:MinimumMemberus-gaap:MeasurementInputCounterpartyCreditRiskMember2022-12-310001889539crbg:IndexCreditsOnFixedIndexAnnuitiesMembersrt:MaximumMemberus-gaap:MeasurementInputCounterpartyCreditRiskMember2022-12-310001889539crbg:IndexLifeMemberus-gaap:FairValueInputsLevel3Member2022-12-310001889539crbg:IndexLifeMemberus-gaap:MeasurementInputLapseRateMembersrt:MinimumMember2022-12-310001889539srt:MaximumMembercrbg:IndexLifeMemberus-gaap:MeasurementInputLapseRateMember2022-12-310001889539crbg:IndexLifeMembersrt:MinimumMemberus-gaap:MeasurementInputMortalityRateMember2022-12-310001889539srt:MaximumMembercrbg:IndexLifeMemberus-gaap:MeasurementInputMortalityRateMember2022-12-310001889539crbg:IndexLifeMemberus-gaap:MeasurementInputPriceVolatilityMembersrt:MinimumMember2022-12-310001889539srt:MaximumMembercrbg:IndexLifeMemberus-gaap:MeasurementInputPriceVolatilityMember2022-12-310001889539crbg:IndexLifeMembersrt:MinimumMemberus-gaap:MeasurementInputCounterpartyCreditRiskMember2022-12-310001889539srt:MaximumMembercrbg:IndexLifeMemberus-gaap:MeasurementInputCounterpartyCreditRiskMember2022-12-310001889539us-gaap:FairValueInputsLevel3Memberus-gaap:USStatesAndPoliticalSubdivisionsMember2021-12-310001889539crbg:MeasurementInputYieldMembersrt:MinimumMemberus-gaap:USStatesAndPoliticalSubdivisionsMember2021-12-310001889539srt:MaximumMembercrbg:MeasurementInputYieldMemberus-gaap:USStatesAndPoliticalSubdivisionsMember2021-12-310001889539crbg:MeasurementInputYieldMembersrt:WeightedAverageMemberus-gaap:USStatesAndPoliticalSubdivisionsMember2021-12-310001889539us-gaap:CorporateDebtSecuritiesMemberus-gaap:FairValueInputsLevel3Member2021-12-310001889539us-gaap:CorporateDebtSecuritiesMembercrbg:MeasurementInputYieldMembersrt:MinimumMember2021-12-310001889539us-gaap:CorporateDebtSecuritiesMembersrt:MaximumMembercrbg:MeasurementInputYieldMember2021-12-310001889539us-gaap:CorporateDebtSecuritiesMembercrbg:MeasurementInputYieldMembersrt:WeightedAverageMember2021-12-310001889539us-gaap:ResidentialMortgageBackedSecuritiesMemberus-gaap:FairValueInputsLevel3Member2021-12-310001889539us-gaap:ResidentialMortgageBackedSecuritiesMembersrt:MinimumMemberus-gaap:MeasurementInputConstantPrepaymentRateMember2021-12-310001889539us-gaap:ResidentialMortgageBackedSecuritiesMembersrt:MaximumMemberus-gaap:MeasurementInputConstantPrepaymentRateMember2021-12-310001889539us-gaap:ResidentialMortgageBackedSecuritiesMemberus-gaap:MeasurementInputConstantPrepaymentRateMembersrt:WeightedAverageMember2021-12-310001889539us-gaap:ResidentialMortgageBackedSecuritiesMembersrt:MinimumMemberus-gaap:MeasurementInputLossSeverityMember2021-12-310001889539us-gaap:ResidentialMortgageBackedSecuritiesMembersrt:MaximumMemberus-gaap:MeasurementInputLossSeverityMember2021-12-310001889539us-gaap:ResidentialMortgageBackedSecuritiesMemberus-gaap:MeasurementInputLossSeverityMembersrt:WeightedAverageMember2021-12-310001889539us-gaap:ResidentialMortgageBackedSecuritiesMembersrt:MinimumMemberus-gaap:MeasurementInputDefaultRateMember2021-12-310001889539us-gaap:ResidentialMortgageBackedSecuritiesMembersrt:MaximumMemberus-gaap:MeasurementInputDefaultRateMember2021-12-310001889539us-gaap:ResidentialMortgageBackedSecuritiesMemberus-gaap:MeasurementInputDefaultRateMembersrt:WeightedAverageMember2021-12-310001889539us-gaap:ResidentialMortgageBackedSecuritiesMembercrbg:MeasurementInputYieldMembersrt:MinimumMember2021-12-310001889539us-gaap:ResidentialMortgageBackedSecuritiesMembersrt:MaximumMembercrbg:MeasurementInputYieldMember2021-12-310001889539us-gaap:ResidentialMortgageBackedSecuritiesMembercrbg:MeasurementInputYieldMembersrt:WeightedAverageMember2021-12-310001889539us-gaap:FairValueInputsLevel3Membercrbg:CollateralizedLoanObligationMember2021-12-310001889539crbg:MeasurementInputYieldMembersrt:MinimumMembercrbg:CollateralizedLoanObligationMember2021-12-310001889539srt:MaximumMembercrbg:MeasurementInputYieldMembercrbg:CollateralizedLoanObligationMember2021-12-310001889539crbg:MeasurementInputYieldMembersrt:WeightedAverageMembercrbg:CollateralizedLoanObligationMember2021-12-310001889539us-gaap:AssetBackedSecuritiesSecuritizedLoansAndReceivablesMemberus-gaap:FairValueInputsLevel3Member2021-12-310001889539us-gaap:AssetBackedSecuritiesSecuritizedLoansAndReceivablesMembercrbg:MeasurementInputYieldMembersrt:MinimumMember2021-12-310001889539us-gaap:AssetBackedSecuritiesSecuritizedLoansAndReceivablesMembersrt:MaximumMembercrbg:MeasurementInputYieldMember2021-12-310001889539us-gaap:AssetBackedSecuritiesSecuritizedLoansAndReceivablesMembercrbg:MeasurementInputYieldMembersrt:WeightedAverageMember2021-12-310001889539us-gaap:CommercialMortgageBackedSecuritiesMemberus-gaap:FairValueInputsLevel3Member2021-12-310001889539crbg:MeasurementInputYieldMembersrt:MinimumMemberus-gaap:CommercialMortgageBackedSecuritiesMember2021-12-310001889539srt:MaximumMembercrbg:MeasurementInputYieldMemberus-gaap:CommercialMortgageBackedSecuritiesMember2021-12-310001889539crbg:MeasurementInputYieldMemberus-gaap:CommercialMortgageBackedSecuritiesMembersrt:WeightedAverageMember2021-12-310001889539crbg:MarketRiskBenefitAssetsMemberus-gaap:FairValueInputsLevel3Member2021-12-310001889539us-gaap:MeasurementInputPriceVolatilityMembersrt:MinimumMembercrbg:MarketRiskBenefitAssetsMember2021-12-310001889539srt:MaximumMemberus-gaap:MeasurementInputPriceVolatilityMembercrbg:MarketRiskBenefitAssetsMember2021-12-310001889539us-gaap:MeasurementInputLapseRateMembersrt:MinimumMembercrbg:MarketRiskBenefitAssetsMember2021-12-310001889539srt:MaximumMemberus-gaap:MeasurementInputLapseRateMembercrbg:MarketRiskBenefitAssetsMember2021-12-310001889539srt:MinimumMembercrbg:MarketRiskBenefitAssetsMembercrbg:MeasurementInputDynamicLapseMultiplierMember2021-12-310001889539srt:MaximumMembercrbg:MarketRiskBenefitAssetsMembercrbg:MeasurementInputDynamicLapseMultiplierMember2021-12-310001889539crbg:MeasurementInputMortalityMultiplierMembersrt:MinimumMembercrbg:MarketRiskBenefitAssetsMember2021-12-310001889539srt:MaximumMembercrbg:MeasurementInputMortalityMultiplierMembercrbg:MarketRiskBenefitAssetsMember2021-12-310001889539us-gaap:MeasurementInputUtilizationRateMembersrt:MinimumMembercrbg:MarketRiskBenefitAssetsMember2021-12-310001889539srt:MaximumMemberus-gaap:MeasurementInputUtilizationRateMembercrbg:MarketRiskBenefitAssetsMember2021-12-310001889539crbg:MeasurementInputEquityInterestRateCorrelationMembersrt:MinimumMembercrbg:MarketRiskBenefitAssetsMember2021-12-310001889539crbg:MeasurementInputEquityInterestRateCorrelationMembersrt:MaximumMembercrbg:MarketRiskBenefitAssetsMember2021-12-310001889539srt:MinimumMembercrbg:MarketRiskBenefitAssetsMemberus-gaap:MeasurementInputCounterpartyCreditRiskMember2021-12-310001889539srt:MaximumMembercrbg:MarketRiskBenefitAssetsMemberus-gaap:MeasurementInputCounterpartyCreditRiskMember2021-12-310001889539us-gaap:GuaranteedMinimumWithdrawalBenefitMemberus-gaap:FairValueInputsLevel3Member2021-12-310001889539us-gaap:GuaranteedMinimumWithdrawalBenefitMemberus-gaap:MeasurementInputPriceVolatilityMembersrt:MinimumMember2021-12-310001889539srt:MaximumMemberus-gaap:GuaranteedMinimumWithdrawalBenefitMemberus-gaap:MeasurementInputPriceVolatilityMember2021-12-310001889539us-gaap:GuaranteedMinimumWithdrawalBenefitMemberus-gaap:MeasurementInputLapseRateMembersrt:MinimumMember2021-12-310001889539srt:MaximumMemberus-gaap:GuaranteedMinimumWithdrawalBenefitMemberus-gaap:MeasurementInputLapseRateMember2021-12-310001889539us-gaap:GuaranteedMinimumWithdrawalBenefitMembersrt:MinimumMembercrbg:MeasurementInputDynamicLapseMultiplierMember2021-12-310001889539srt:MaximumMemberus-gaap:GuaranteedMinimumWithdrawalBenefitMembercrbg:MeasurementInputDynamicLapseMultiplierMember2021-12-310001889539crbg:MeasurementInputMortalityMultiplierMemberus-gaap:GuaranteedMinimumWithdrawalBenefitMembersrt:MinimumMember2021-12-310001889539srt:MaximumMembercrbg:MeasurementInputMortalityMultiplierMemberus-gaap:GuaranteedMinimumWithdrawalBenefitMember2021-12-310001889539us-gaap:MeasurementInputUtilizationRateMemberus-gaap:GuaranteedMinimumWithdrawalBenefitMembersrt:MinimumMember2021-12-310001889539srt:MaximumMemberus-gaap:MeasurementInputUtilizationRateMemberus-gaap:GuaranteedMinimumWithdrawalBenefitMember2021-12-310001889539crbg:MeasurementInputEquityInterestRateCorrelationMemberus-gaap:GuaranteedMinimumWithdrawalBenefitMembersrt:MinimumMember2021-12-310001889539crbg:MeasurementInputEquityInterestRateCorrelationMembersrt:MaximumMemberus-gaap:GuaranteedMinimumWithdrawalBenefitMember2021-12-310001889539us-gaap:GuaranteedMinimumWithdrawalBenefitMembersrt:MinimumMemberus-gaap:MeasurementInputCounterpartyCreditRiskMember2021-12-310001889539srt:MaximumMemberus-gaap:GuaranteedMinimumWithdrawalBenefitMemberus-gaap:MeasurementInputCounterpartyCreditRiskMember2021-12-310001889539crbg:AnnuitiesIncludingCertainGuaranteedMinimumWithdrawalBenefitsMemberus-gaap:FairValueInputsLevel3Member2021-12-310001889539crbg:AnnuitiesIncludingCertainGuaranteedMinimumWithdrawalBenefitsMemberus-gaap:MeasurementInputLapseRateMembersrt:MinimumMember2021-12-310001889539srt:MaximumMembercrbg:AnnuitiesIncludingCertainGuaranteedMinimumWithdrawalBenefitsMemberus-gaap:MeasurementInputLapseRateMember2021-12-310001889539crbg:AnnuitiesIncludingCertainGuaranteedMinimumWithdrawalBenefitsMembersrt:MinimumMembercrbg:MeasurementInputDynamicLapseMultiplierMember2021-12-310001889539srt:MaximumMembercrbg:AnnuitiesIncludingCertainGuaranteedMinimumWithdrawalBenefitsMembercrbg:MeasurementInputDynamicLapseMultiplierMember2021-12-310001889539crbg:MeasurementInputMortalityMultiplierMembercrbg:AnnuitiesIncludingCertainGuaranteedMinimumWithdrawalBenefitsMembersrt:MinimumMember2021-12-310001889539srt:MaximumMembercrbg:MeasurementInputMortalityMultiplierMembercrbg:AnnuitiesIncludingCertainGuaranteedMinimumWithdrawalBenefitsMember2021-12-310001889539crbg:AnnuitiesIncludingCertainGuaranteedMinimumWithdrawalBenefitsMemberus-gaap:MeasurementInputUtilizationRateMembersrt:MinimumMember2021-12-310001889539srt:MaximumMembercrbg:AnnuitiesIncludingCertainGuaranteedMinimumWithdrawalBenefitsMemberus-gaap:MeasurementInputUtilizationRateMember2021-12-310001889539crbg:AnnuitiesIncludingCertainGuaranteedMinimumWithdrawalBenefitsMembersrt:MinimumMemberus-gaap:MeasurementInputCounterpartyCreditRiskMember2021-12-310001889539srt:MaximumMembercrbg:AnnuitiesIncludingCertainGuaranteedMinimumWithdrawalBenefitsMemberus-gaap:MeasurementInputCounterpartyCreditRiskMember2021-12-310001889539crbg:IndexAnnuitiesIncludingCertainGuaranteedMinimumWithdrawalBenefitsMemberus-gaap:FairValueInputsLevel3Member2021-12-310001889539crbg:IndexAnnuitiesIncludingCertainGuaranteedMinimumWithdrawalBenefitsMemberus-gaap:MeasurementInputUtilizationRateMembersrt:MinimumMember2021-12-310001889539crbg:IndexAnnuitiesIncludingCertainGuaranteedMinimumWithdrawalBenefitsMembersrt:MaximumMemberus-gaap:MeasurementInputUtilizationRateMember2021-12-310001889539crbg:IndexAnnuitiesIncludingCertainGuaranteedMinimumWithdrawalBenefitsMemberus-gaap:MeasurementInputPriceVolatilityMembersrt:MinimumMember2021-12-310001889539crbg:IndexAnnuitiesIncludingCertainGuaranteedMinimumWithdrawalBenefitsMembersrt:MaximumMemberus-gaap:MeasurementInputPriceVolatilityMember2021-12-310001889539crbg:IndexAnnuitiesIncludingCertainGuaranteedMinimumWithdrawalBenefitsMemberus-gaap:MeasurementInputLapseRateMembersrt:MinimumMember2021-12-310001889539crbg:IndexAnnuitiesIncludingCertainGuaranteedMinimumWithdrawalBenefitsMembersrt:MaximumMemberus-gaap:MeasurementInputLapseRateMember2021-12-310001889539crbg:IndexAnnuitiesIncludingCertainGuaranteedMinimumWithdrawalBenefitsMembersrt:MinimumMembercrbg:MeasurementInputDynamicLapseMultiplierMember2021-12-310001889539crbg:IndexAnnuitiesIncludingCertainGuaranteedMinimumWithdrawalBenefitsMembersrt:MaximumMembercrbg:MeasurementInputDynamicLapseMultiplierMember2021-12-310001889539crbg:IndexAnnuitiesIncludingCertainGuaranteedMinimumWithdrawalBenefitsMembercrbg:MeasurementInputMortalityMultiplierMembersrt:MinimumMember2021-12-310001889539crbg:IndexAnnuitiesIncludingCertainGuaranteedMinimumWithdrawalBenefitsMembersrt:MaximumMembercrbg:MeasurementInputMortalityMultiplierMember2021-12-310001889539crbg:IndexAnnuitiesIncludingCertainGuaranteedMinimumWithdrawalBenefitsMembercrbg:MeasurementInputOptionBudgetMembersrt:MinimumMember2021-12-310001889539crbg:IndexAnnuitiesIncludingCertainGuaranteedMinimumWithdrawalBenefitsMembersrt:MaximumMembercrbg:MeasurementInputOptionBudgetMember2021-12-310001889539crbg:IndexAnnuitiesIncludingCertainGuaranteedMinimumWithdrawalBenefitsMembercrbg:MeasurementInputEquityInterestRateCorrelationMembersrt:MinimumMember2021-12-310001889539crbg:IndexAnnuitiesIncludingCertainGuaranteedMinimumWithdrawalBenefitsMembercrbg:MeasurementInputEquityInterestRateCorrelationMembersrt:MaximumMember2021-12-310001889539crbg:IndexAnnuitiesIncludingCertainGuaranteedMinimumWithdrawalBenefitsMembersrt:MinimumMemberus-gaap:MeasurementInputCounterpartyCreditRiskMember2021-12-310001889539crbg:IndexAnnuitiesIncludingCertainGuaranteedMinimumWithdrawalBenefitsMembersrt:MaximumMemberus-gaap:MeasurementInputCounterpartyCreditRiskMember2021-12-310001889539crbg:IndexCreditsOnFixedIndexAnnuitiesMemberus-gaap:FairValueInputsLevel3Member2021-12-310001889539crbg:IndexCreditsOnFixedIndexAnnuitiesMemberus-gaap:MeasurementInputPriceVolatilityMembersrt:MinimumMember2021-12-310001889539crbg:IndexCreditsOnFixedIndexAnnuitiesMembersrt:MaximumMemberus-gaap:MeasurementInputPriceVolatilityMember2021-12-310001889539crbg:IndexCreditsOnFixedIndexAnnuitiesMemberus-gaap:MeasurementInputLapseRateMembersrt:MinimumMember2021-12-310001889539crbg:IndexCreditsOnFixedIndexAnnuitiesMembersrt:MaximumMemberus-gaap:MeasurementInputLapseRateMember2021-12-310001889539crbg:IndexCreditsOnFixedIndexAnnuitiesMembersrt:MinimumMembercrbg:MeasurementInputDynamicLapseMultiplierMember2021-12-310001889539crbg:IndexCreditsOnFixedIndexAnnuitiesMembersrt:MaximumMembercrbg:MeasurementInputDynamicLapseMultiplierMember2021-12-310001889539crbg:IndexCreditsOnFixedIndexAnnuitiesMembercrbg:MeasurementInputMortalityMultiplierMembersrt:MinimumMember2021-12-310001889539crbg:IndexCreditsOnFixedIndexAnnuitiesMembersrt:MaximumMembercrbg:MeasurementInputMortalityMultiplierMember2021-12-310001889539crbg:IndexCreditsOnFixedIndexAnnuitiesMemberus-gaap:MeasurementInputUtilizationRateMembersrt:MinimumMember2021-12-310001889539crbg:IndexCreditsOnFixedIndexAnnuitiesMembersrt:MaximumMemberus-gaap:MeasurementInputUtilizationRateMember2021-12-310001889539crbg:IndexCreditsOnFixedIndexAnnuitiesMembercrbg:MeasurementInputOptionBudgetMembersrt:MinimumMember2021-12-310001889539crbg:IndexCreditsOnFixedIndexAnnuitiesMembersrt:MaximumMembercrbg:MeasurementInputOptionBudgetMember2021-12-310001889539crbg:IndexCreditsOnFixedIndexAnnuitiesMembercrbg:MeasurementInputEquityInterestRateCorrelationMembersrt:MinimumMember2021-12-310001889539crbg:IndexCreditsOnFixedIndexAnnuitiesMembercrbg:MeasurementInputEquityInterestRateCorrelationMembersrt:MaximumMember2021-12-310001889539crbg:IndexCreditsOnFixedIndexAnnuitiesMembersrt:MinimumMemberus-gaap:MeasurementInputCounterpartyCreditRiskMember2021-12-310001889539crbg:IndexCreditsOnFixedIndexAnnuitiesMembersrt:MaximumMemberus-gaap:MeasurementInputCounterpartyCreditRiskMember2021-12-310001889539crbg:IndexLifeMemberus-gaap:FairValueInputsLevel3Member2021-12-310001889539crbg:IndexLifeMemberus-gaap:MeasurementInputLapseRateMembersrt:MinimumMember2021-12-310001889539srt:MaximumMembercrbg:IndexLifeMemberus-gaap:MeasurementInputLapseRateMember2021-12-310001889539crbg:IndexLifeMembersrt:MinimumMemberus-gaap:MeasurementInputMortalityRateMember2021-12-310001889539srt:MaximumMembercrbg:IndexLifeMemberus-gaap:MeasurementInputMortalityRateMember2021-12-310001889539crbg:IndexLifeMemberus-gaap:MeasurementInputPriceVolatilityMembersrt:MinimumMember2021-12-310001889539srt:MaximumMembercrbg:IndexLifeMemberus-gaap:MeasurementInputPriceVolatilityMember2021-12-310001889539crbg:IndexLifeMembersrt:MinimumMemberus-gaap:MeasurementInputCounterpartyCreditRiskMember2021-12-310001889539srt:MaximumMembercrbg:IndexLifeMemberus-gaap:MeasurementInputCounterpartyCreditRiskMember2021-12-310001889539us-gaap:FairValueInputsLevel3Member2022-12-310001889539us-gaap:FairValueInputsLevel3Member2021-12-310001889539crbg:LeveragedBuyoutMember2022-12-310001889539crbg:LeveragedBuyoutMember2021-12-310001889539crbg:RealEstateAndInfrastructurePrivateEquityFundsMember2022-12-310001889539crbg:RealEstateAndInfrastructurePrivateEquityFundsMember2021-12-310001889539us-gaap:VentureCapitalFundsMember2022-12-310001889539us-gaap:VentureCapitalFundsMember2021-12-310001889539crbg:GrowthEquityMember2022-12-310001889539crbg:GrowthEquityMember2021-12-310001889539crbg:MezzanineTranchesMember2022-12-310001889539crbg:MezzanineTranchesMember2021-12-310001889539crbg:OtherPrivateEquityFundsMember2022-12-310001889539crbg:OtherPrivateEquityFundsMember2021-12-310001889539us-gaap:PrivateEquityFundsMember2022-12-310001889539us-gaap:PrivateEquityFundsMember2021-12-310001889539us-gaap:HedgeFundsEventDrivenMember2022-12-310001889539us-gaap:HedgeFundsEventDrivenMember2021-12-310001889539us-gaap:HedgeFundsEquityLongShortMember2022-12-310001889539us-gaap:HedgeFundsEquityLongShortMember2021-12-310001889539crbg:HedgeFundsMacroValueMember2022-12-310001889539crbg:HedgeFundsMacroValueMember2021-12-310001889539crbg:OtherHedgeFundsMember2022-12-310001889539crbg:OtherHedgeFundsMember2021-12-310001889539us-gaap:HedgeFundsMember2022-12-310001889539us-gaap:HedgeFundsMember2021-12-310001889539crbg:PrivateEquityFundsAndHedgeFundsMember2022-12-310001889539crbg:PrivateEquityFundsAndHedgeFundsMember2021-12-310001889539us-gaap:PrivateEquityFundsMember2022-01-012022-12-310001889539us-gaap:PrivateEquityFundsMembersrt:MinimumMember2022-01-012022-12-310001889539us-gaap:PrivateEquityFundsMembersrt:MaximumMember2022-01-012022-12-310001889539us-gaap:BondsMember2022-01-012022-12-310001889539us-gaap:BondsMember2021-01-012021-12-310001889539us-gaap:BondsMember2020-01-012020-12-310001889539crbg:AlternativeInvestmentsMember2022-01-012022-12-310001889539crbg:AlternativeInvestmentsMember2021-01-012021-12-310001889539crbg:AlternativeInvestmentsMember2020-01-012020-12-310001889539us-gaap:AssetsMember2022-01-012022-12-310001889539us-gaap:AssetsMember2021-01-012021-12-310001889539us-gaap:AssetsMember2020-01-012020-12-310001889539crbg:PolicyholderContractDepositsMember2020-01-012020-12-310001889539us-gaap:LongTermDebtMember2020-01-012020-12-310001889539us-gaap:LiabilityMember2022-01-012022-12-310001889539us-gaap:LiabilityMember2021-01-012021-12-310001889539us-gaap:LiabilityMember2020-01-012020-12-310001889539crbg:AlternativeInvestmentsMember2022-12-310001889539crbg:AlternativeInvestmentsMember2021-12-310001889539us-gaap:FairValueInputsLevel1Memberus-gaap:FairValueMeasurementsNonrecurringMember2022-12-310001889539us-gaap:FairValueInputsLevel2Memberus-gaap:FairValueMeasurementsNonrecurringMember2022-12-310001889539us-gaap:FairValueInputsLevel3Memberus-gaap:FairValueMeasurementsNonrecurringMember2022-12-310001889539us-gaap:FairValueMeasurementsNonrecurringMember2022-12-310001889539us-gaap:OtherInvestmentsMemberus-gaap:FairValueMeasurementsNonrecurringMember2022-01-012022-12-310001889539us-gaap:OtherInvestmentsMemberus-gaap:FairValueMeasurementsNonrecurringMember2021-01-012021-12-310001889539us-gaap:OtherInvestmentsMemberus-gaap:FairValueMeasurementsNonrecurringMember2020-01-012020-12-310001889539crbg:OtherInvestedAssetsMemberus-gaap:FairValueMeasurementsNonrecurringMember2022-01-012022-12-310001889539crbg:OtherInvestedAssetsMemberus-gaap:FairValueMeasurementsNonrecurringMember2021-01-012021-12-310001889539crbg:OtherInvestedAssetsMemberus-gaap:FairValueMeasurementsNonrecurringMember2020-01-012020-12-310001889539us-gaap:FairValueMeasurementsNonrecurringMember2022-01-012022-12-310001889539us-gaap:FairValueMeasurementsNonrecurringMember2021-01-012021-12-310001889539us-gaap:FairValueMeasurementsNonrecurringMember2020-01-012020-12-310001889539us-gaap:FairValueInputsLevel1Memberus-gaap:FairValueMeasurementsNonrecurringMember2021-12-310001889539us-gaap:FairValueInputsLevel2Memberus-gaap:FairValueMeasurementsNonrecurringMember2021-12-310001889539us-gaap:FairValueInputsLevel3Memberus-gaap:FairValueMeasurementsNonrecurringMember2021-12-310001889539us-gaap:FairValueMeasurementsNonrecurringMember2021-12-310001889539crbg:AssetClassToLoansHeldForSaleMemberus-gaap:FairValueMeasurementsNonrecurringMember2022-12-310001889539us-gaap:FairValueInputsLevel1Memberus-gaap:PortionAtOtherThanFairValueFairValueDisclosureMember2022-12-310001889539us-gaap:FairValueInputsLevel2Memberus-gaap:PortionAtOtherThanFairValueFairValueDisclosureMember2022-12-310001889539us-gaap:FairValueInputsLevel3Memberus-gaap:PortionAtOtherThanFairValueFairValueDisclosureMember2022-12-310001889539us-gaap:PortionAtOtherThanFairValueFairValueDisclosureMember2022-12-310001889539us-gaap:CarryingReportedAmountFairValueDisclosureMember2022-12-310001889539us-gaap:FairValueInputsLevel1Memberus-gaap:VariableInterestEntityPrimaryBeneficiaryMemberus-gaap:PortionAtOtherThanFairValueFairValueDisclosureMember2022-12-310001889539us-gaap:FairValueInputsLevel2Memberus-gaap:VariableInterestEntityPrimaryBeneficiaryMemberus-gaap:PortionAtOtherThanFairValueFairValueDisclosureMember2022-12-310001889539us-gaap:VariableInterestEntityPrimaryBeneficiaryMemberus-gaap:FairValueInputsLevel3Memberus-gaap:PortionAtOtherThanFairValueFairValueDisclosureMember2022-12-310001889539us-gaap:VariableInterestEntityPrimaryBeneficiaryMemberus-gaap:PortionAtOtherThanFairValueFairValueDisclosureMember2022-12-310001889539us-gaap:CarryingReportedAmountFairValueDisclosureMemberus-gaap:VariableInterestEntityPrimaryBeneficiaryMember2022-12-310001889539us-gaap:FairValueInputsLevel1Memberus-gaap:PortionAtOtherThanFairValueFairValueDisclosureMember2021-12-310001889539us-gaap:FairValueInputsLevel2Memberus-gaap:PortionAtOtherThanFairValueFairValueDisclosureMember2021-12-310001889539us-gaap:FairValueInputsLevel3Memberus-gaap:PortionAtOtherThanFairValueFairValueDisclosureMember2021-12-310001889539us-gaap:PortionAtOtherThanFairValueFairValueDisclosureMember2021-12-310001889539us-gaap:CarryingReportedAmountFairValueDisclosureMember2021-12-310001889539us-gaap:FairValueInputsLevel1Memberus-gaap:VariableInterestEntityPrimaryBeneficiaryMemberus-gaap:PortionAtOtherThanFairValueFairValueDisclosureMember2021-12-310001889539us-gaap:FairValueInputsLevel2Memberus-gaap:VariableInterestEntityPrimaryBeneficiaryMemberus-gaap:PortionAtOtherThanFairValueFairValueDisclosureMember2021-12-310001889539us-gaap:VariableInterestEntityPrimaryBeneficiaryMemberus-gaap:FairValueInputsLevel3Memberus-gaap:PortionAtOtherThanFairValueFairValueDisclosureMember2021-12-310001889539us-gaap:VariableInterestEntityPrimaryBeneficiaryMemberus-gaap:PortionAtOtherThanFairValueFairValueDisclosureMember2021-12-310001889539us-gaap:CarryingReportedAmountFairValueDisclosureMemberus-gaap:VariableInterestEntityPrimaryBeneficiaryMember2021-12-310001889539us-gaap:USTreasuryAndGovernmentMember2022-12-310001889539us-gaap:USStatesAndPoliticalSubdivisionsMember2022-12-310001889539us-gaap:ForeignGovernmentDebtSecuritiesMember2022-12-310001889539us-gaap:CorporateDebtSecuritiesMember2022-12-310001889539us-gaap:ResidentialMortgageBackedSecuritiesMember2022-12-310001889539us-gaap:CommercialMortgageBackedSecuritiesMember2022-12-310001889539us-gaap:CollateralizedLoanObligationsMember2022-12-310001889539us-gaap:AssetBackedSecuritiesMember2022-12-310001889539us-gaap:MortgageBackedSecuritiesMember2022-12-310001889539us-gaap:USTreasuryAndGovernmentMember2021-12-310001889539us-gaap:USStatesAndPoliticalSubdivisionsMember2021-12-310001889539us-gaap:ForeignGovernmentDebtSecuritiesMember2021-12-310001889539us-gaap:CorporateDebtSecuritiesMember2021-12-310001889539us-gaap:ResidentialMortgageBackedSecuritiesMember2021-12-310001889539us-gaap:CommercialMortgageBackedSecuritiesMember2021-12-310001889539us-gaap:CollateralizedLoanObligationsMember2021-12-310001889539us-gaap:AssetBackedSecuritiesMember2021-12-310001889539us-gaap:MortgageBackedSecuritiesMember2021-12-310001889539us-gaap:ResidentialMortgageBackedSecuritiesMembersrt:AffiliatedEntityMember2022-12-310001889539us-gaap:ResidentialMortgageBackedSecuritiesMembersrt:AffiliatedEntityMember2021-12-310001889539srt:AffiliatedEntityMemberus-gaap:CollateralizedLoanObligationsMember2021-12-310001889539us-gaap:InternalNoninvestmentGradeMember2022-12-310001889539us-gaap:InternalNoninvestmentGradeMember2021-12-31crbg:security0001889539crbg:FortitudeREFundsWithheldAssetsMember2022-01-012022-12-310001889539crbg:FortitudeREFundsWithheldAssetsMember2021-01-012021-12-310001889539crbg:FortitudeREFundsWithheldAssetsMember2020-01-012020-12-310001889539us-gaap:FixedMaturitiesMemberus-gaap:USStatesAndPoliticalSubdivisionsMember2022-12-310001889539us-gaap:FixedMaturitiesMemberus-gaap:InvestmentsMembercrbg:InvestmentConcentrationRiskMemberus-gaap:USStatesAndPoliticalSubdivisionsMember2022-01-012022-12-310001889539us-gaap:FixedMaturitiesMemberus-gaap:USStatesAndPoliticalSubdivisionsMember2021-12-310001889539us-gaap:FixedMaturitiesMemberus-gaap:InvestmentsMembercrbg:InvestmentConcentrationRiskMemberus-gaap:USStatesAndPoliticalSubdivisionsMember2021-01-012021-12-310001889539us-gaap:ForeignGovernmentDebtSecuritiesMemberus-gaap:FixedMaturitiesMember2022-12-310001889539us-gaap:ForeignGovernmentDebtSecuritiesMemberus-gaap:FixedMaturitiesMemberus-gaap:InvestmentsMembercrbg:InvestmentConcentrationRiskMember2022-01-012022-12-310001889539us-gaap:ForeignGovernmentDebtSecuritiesMemberus-gaap:FixedMaturitiesMember2021-12-310001889539us-gaap:ForeignGovernmentDebtSecuritiesMemberus-gaap:FixedMaturitiesMemberus-gaap:InvestmentsMembercrbg:InvestmentConcentrationRiskMember2021-01-012021-12-310001889539us-gaap:CorporateDebtSecuritiesMemberus-gaap:FixedMaturitiesMember2022-12-310001889539us-gaap:CorporateDebtSecuritiesMemberus-gaap:FixedMaturitiesMemberus-gaap:InvestmentsMembercrbg:InvestmentConcentrationRiskMember2022-01-012022-12-310001889539us-gaap:CorporateDebtSecuritiesMemberus-gaap:FixedMaturitiesMember2021-12-310001889539us-gaap:CorporateDebtSecuritiesMemberus-gaap:FixedMaturitiesMemberus-gaap:InvestmentsMembercrbg:InvestmentConcentrationRiskMember2021-01-012021-12-310001889539us-gaap:ResidentialMortgageBackedSecuritiesMemberus-gaap:FixedMaturitiesMember2022-12-310001889539us-gaap:ResidentialMortgageBackedSecuritiesMemberus-gaap:FixedMaturitiesMemberus-gaap:InvestmentsMembercrbg:InvestmentConcentrationRiskMember2022-01-012022-12-310001889539us-gaap:ResidentialMortgageBackedSecuritiesMemberus-gaap:FixedMaturitiesMember2021-12-310001889539us-gaap:ResidentialMortgageBackedSecuritiesMemberus-gaap:FixedMaturitiesMemberus-gaap:InvestmentsMembercrbg:InvestmentConcentrationRiskMember2021-01-012021-12-310001889539us-gaap:FixedMaturitiesMemberus-gaap:CommercialMortgageBackedSecuritiesMember2022-12-310001889539us-gaap:FixedMaturitiesMemberus-gaap:InvestmentsMembercrbg:InvestmentConcentrationRiskMemberus-gaap:CommercialMortgageBackedSecuritiesMember2022-01-012022-12-310001889539us-gaap:FixedMaturitiesMemberus-gaap:CommercialMortgageBackedSecuritiesMember2021-12-310001889539us-gaap:FixedMaturitiesMemberus-gaap:InvestmentsMembercrbg:InvestmentConcentrationRiskMemberus-gaap:CommercialMortgageBackedSecuritiesMember2021-01-012021-12-310001889539us-gaap:FixedMaturitiesMemberus-gaap:CollateralizedLoanObligationsMember2022-12-310001889539us-gaap:FixedMaturitiesMemberus-gaap:CollateralizedLoanObligationsMemberus-gaap:InvestmentsMembercrbg:InvestmentConcentrationRiskMember2022-01-012022-12-310001889539us-gaap:FixedMaturitiesMemberus-gaap:CollateralizedLoanObligationsMember2021-12-310001889539us-gaap:FixedMaturitiesMemberus-gaap:CollateralizedLoanObligationsMemberus-gaap:InvestmentsMembercrbg:InvestmentConcentrationRiskMember2021-01-012021-12-310001889539us-gaap:FixedMaturitiesMemberus-gaap:AssetBackedSecuritiesMember2022-12-310001889539us-gaap:FixedMaturitiesMemberus-gaap:AssetBackedSecuritiesMemberus-gaap:InvestmentsMembercrbg:InvestmentConcentrationRiskMember2022-01-012022-12-310001889539us-gaap:FixedMaturitiesMemberus-gaap:AssetBackedSecuritiesMember2021-12-310001889539us-gaap:FixedMaturitiesMemberus-gaap:AssetBackedSecuritiesMemberus-gaap:InvestmentsMembercrbg:InvestmentConcentrationRiskMember2021-01-012021-12-310001889539us-gaap:FixedMaturitiesMemberus-gaap:MortgageBackedSecuritiesMember2022-12-310001889539us-gaap:FixedMaturitiesMemberus-gaap:InvestmentsMembercrbg:InvestmentConcentrationRiskMemberus-gaap:MortgageBackedSecuritiesMember2022-01-012022-12-310001889539us-gaap:FixedMaturitiesMemberus-gaap:MortgageBackedSecuritiesMember2021-12-310001889539us-gaap:FixedMaturitiesMemberus-gaap:InvestmentsMembercrbg:InvestmentConcentrationRiskMemberus-gaap:MortgageBackedSecuritiesMember2021-01-012021-12-310001889539us-gaap:FixedMaturitiesMember2022-12-310001889539us-gaap:FixedMaturitiesMemberus-gaap:InvestmentsMembercrbg:InvestmentConcentrationRiskMember2022-01-012022-12-310001889539us-gaap:FixedMaturitiesMember2021-12-310001889539us-gaap:FixedMaturitiesMemberus-gaap:InvestmentsMembercrbg:InvestmentConcentrationRiskMember2021-01-012021-12-310001889539us-gaap:EquitySecuritiesMember2022-12-310001889539us-gaap:InvestmentsMembercrbg:InvestmentConcentrationRiskMemberus-gaap:EquitySecuritiesMember2022-01-012022-12-310001889539us-gaap:EquitySecuritiesMember2021-12-310001889539us-gaap:InvestmentsMembercrbg:InvestmentConcentrationRiskMemberus-gaap:EquitySecuritiesMember2021-01-012021-12-310001889539us-gaap:InvestmentsMembercrbg:InvestmentConcentrationRiskMember2022-01-012022-12-310001889539us-gaap:InvestmentsMembercrbg:InvestmentConcentrationRiskMember2021-01-012021-12-310001889539crbg:HedgeFundsAndPrivateEquityFundsMember2022-12-310001889539crbg:HedgeFundsAndPrivateEquityFundsMember2021-12-310001889539us-gaap:HedgeFundsEquityMember2022-12-310001889539us-gaap:HedgeFundsEquityMember2021-12-310001889539crbg:AffordableHousingPartnershipsMember2022-12-310001889539crbg:AffordableHousingPartnershipsMember2021-12-310001889539crbg:FortitudeMember2022-12-310001889539crbg:FortitudeMember2021-12-310001889539srt:AffiliatedEntityMember2022-12-310001889539srt:AffiliatedEntityMember2021-12-310001889539us-gaap:EquityMethodInvesteeMember2022-01-012022-12-310001889539us-gaap:EquityMethodInvesteeMember2021-01-012021-12-310001889539us-gaap:EquityMethodInvesteeMember2020-01-012020-12-310001889539us-gaap:EquityMethodInvesteeMember2022-12-310001889539us-gaap:EquityMethodInvesteeMember2021-12-310001889539us-gaap:FixedMaturitiesMembercrbg:ExcludingFortitudeReFundWithheldAssetsMember2022-01-012022-12-310001889539crbg:FortitudeMemberus-gaap:FixedMaturitiesMember2022-01-012022-12-310001889539us-gaap:FixedMaturitiesMember2022-01-012022-12-310001889539us-gaap:FixedMaturitiesMembercrbg:ExcludingFortitudeReFundWithheldAssetsMember2021-01-012021-12-310001889539crbg:FortitudeMemberus-gaap:FixedMaturitiesMember2021-01-012021-12-310001889539us-gaap:FixedMaturitiesMember2021-01-012021-12-310001889539us-gaap:FixedMaturitiesMembercrbg:ExcludingFortitudeReFundWithheldAssetsMember2020-01-012020-12-310001889539crbg:FortitudeMemberus-gaap:FixedMaturitiesMember2020-01-012020-12-310001889539us-gaap:FixedMaturitiesMember2020-01-012020-12-310001889539crbg:OtherBondSecuritiesMembercrbg:ExcludingFortitudeReFundWithheldAssetsMember2022-01-012022-12-310001889539crbg:FortitudeMembercrbg:OtherBondSecuritiesMember2022-01-012022-12-310001889539crbg:OtherBondSecuritiesMember2022-01-012022-12-310001889539crbg:OtherBondSecuritiesMembercrbg:ExcludingFortitudeReFundWithheldAssetsMember2021-01-012021-12-310001889539crbg:FortitudeMembercrbg:OtherBondSecuritiesMember2021-01-012021-12-310001889539crbg:OtherBondSecuritiesMember2021-01-012021-12-310001889539crbg:OtherBondSecuritiesMembercrbg:ExcludingFortitudeReFundWithheldAssetsMember2020-01-012020-12-310001889539crbg:FortitudeMembercrbg:OtherBondSecuritiesMember2020-01-012020-12-310001889539crbg:OtherBondSecuritiesMember2020-01-012020-12-310001889539crbg:ExcludingFortitudeReFundWithheldAssetsMemberus-gaap:EquitySecuritiesMember2022-01-012022-12-310001889539crbg:FortitudeMemberus-gaap:EquitySecuritiesMember2022-01-012022-12-310001889539us-gaap:EquitySecuritiesMember2022-01-012022-12-310001889539crbg:ExcludingFortitudeReFundWithheldAssetsMemberus-gaap:EquitySecuritiesMember2021-01-012021-12-310001889539crbg:FortitudeMemberus-gaap:EquitySecuritiesMember2021-01-012021-12-310001889539us-gaap:EquitySecuritiesMember2021-01-012021-12-310001889539crbg:ExcludingFortitudeReFundWithheldAssetsMemberus-gaap:EquitySecuritiesMember2020-01-012020-12-310001889539crbg:FortitudeMemberus-gaap:EquitySecuritiesMember2020-01-012020-12-310001889539us-gaap:EquitySecuritiesMember2020-01-012020-12-310001889539crbg:ExcludingFortitudeReFundWithheldAssetsMemberus-gaap:FinanceReceivablesMember2022-01-012022-12-310001889539crbg:FortitudeMemberus-gaap:FinanceReceivablesMember2022-01-012022-12-310001889539us-gaap:FinanceReceivablesMember2022-01-012022-12-310001889539crbg:ExcludingFortitudeReFundWithheldAssetsMemberus-gaap:FinanceReceivablesMember2021-01-012021-12-310001889539crbg:FortitudeMemberus-gaap:FinanceReceivablesMember2021-01-012021-12-310001889539us-gaap:FinanceReceivablesMember2021-01-012021-12-310001889539crbg:ExcludingFortitudeReFundWithheldAssetsMemberus-gaap:FinanceReceivablesMember2020-01-012020-12-310001889539crbg:FortitudeMemberus-gaap:FinanceReceivablesMember2020-01-012020-12-310001889539us-gaap:FinanceReceivablesMember2020-01-012020-12-310001889539crbg:AlternativeInvestmentsMembercrbg:ExcludingFortitudeReFundWithheldAssetsMember2022-01-012022-12-310001889539crbg:FortitudeMembercrbg:AlternativeInvestmentsMember2022-01-012022-12-310001889539crbg:AlternativeInvestmentsMember2022-01-012022-12-310001889539crbg:AlternativeInvestmentsMembercrbg:ExcludingFortitudeReFundWithheldAssetsMember2021-01-012021-12-310001889539crbg:FortitudeMembercrbg:AlternativeInvestmentsMember2021-01-012021-12-310001889539crbg:AlternativeInvestmentsMember2021-01-012021-12-310001889539crbg:AlternativeInvestmentsMembercrbg:ExcludingFortitudeReFundWithheldAssetsMember2020-01-012020-12-310001889539crbg:FortitudeMembercrbg:AlternativeInvestmentsMember2020-01-012020-12-310001889539crbg:AlternativeInvestmentsMember2020-01-012020-12-310001889539crbg:ExcludingFortitudeReFundWithheldAssetsMemberus-gaap:RealEstateInvestmentMember2022-01-012022-12-310001889539crbg:FortitudeMemberus-gaap:RealEstateInvestmentMember2022-01-012022-12-310001889539us-gaap:RealEstateInvestmentMember2022-01-012022-12-310001889539crbg:ExcludingFortitudeReFundWithheldAssetsMemberus-gaap:RealEstateInvestmentMember2021-01-012021-12-310001889539crbg:FortitudeMemberus-gaap:RealEstateInvestmentMember2021-01-012021-12-310001889539us-gaap:RealEstateInvestmentMember2021-01-012021-12-310001889539crbg:ExcludingFortitudeReFundWithheldAssetsMemberus-gaap:RealEstateInvestmentMember2020-01-012020-12-310001889539crbg:FortitudeMemberus-gaap:RealEstateInvestmentMember2020-01-012020-12-310001889539us-gaap:RealEstateInvestmentMember2020-01-012020-12-310001889539us-gaap:OtherInvestmentsMembercrbg:ExcludingFortitudeReFundWithheldAssetsMember2022-01-012022-12-310001889539crbg:FortitudeMemberus-gaap:OtherInvestmentsMember2022-01-012022-12-310001889539us-gaap:OtherInvestmentsMember2022-01-012022-12-310001889539us-gaap:OtherInvestmentsMembercrbg:ExcludingFortitudeReFundWithheldAssetsMember2021-01-012021-12-310001889539crbg:FortitudeMemberus-gaap:OtherInvestmentsMember2021-01-012021-12-310001889539us-gaap:OtherInvestmentsMember2021-01-012021-12-310001889539us-gaap:OtherInvestmentsMembercrbg:ExcludingFortitudeReFundWithheldAssetsMember2020-01-012020-12-310001889539crbg:FortitudeMemberus-gaap:OtherInvestmentsMember2020-01-012020-12-310001889539us-gaap:OtherInvestmentsMember2020-01-012020-12-310001889539crbg:ExcludingFortitudeReFundWithheldAssetsMember2022-01-012022-12-310001889539crbg:FortitudeMember2022-01-012022-12-310001889539crbg:ExcludingFortitudeReFundWithheldAssetsMember2021-01-012021-12-310001889539crbg:FortitudeMember2021-01-012021-12-310001889539crbg:ExcludingFortitudeReFundWithheldAssetsMember2020-01-012020-12-310001889539crbg:FortitudeMember2020-01-012020-12-310001889539crbg:InvestmentsExcludingModifiedCoinsuranceAndFundsWithheldAssetsMembercrbg:ExcludingModifiedCoinsuranceAndFundsWithheldEmbeddedDerivativeMember2022-01-012022-12-310001889539crbg:FortitudeMembercrbg:ExcludingModifiedCoinsuranceAndFundsWithheldEmbeddedDerivativeMember2022-01-012022-12-310001889539crbg:ExcludingModifiedCoinsuranceAndFundsWithheldEmbeddedDerivativeMember2022-01-012022-12-310001889539crbg:InvestmentsExcludingModifiedCoinsuranceAndFundsWithheldAssetsMembercrbg:ExcludingModifiedCoinsuranceAndFundsWithheldEmbeddedDerivativeMember2021-01-012021-12-310001889539crbg:FortitudeMembercrbg:ExcludingModifiedCoinsuranceAndFundsWithheldEmbeddedDerivativeMember2021-01-012021-12-310001889539crbg:ExcludingModifiedCoinsuranceAndFundsWithheldEmbeddedDerivativeMember2021-01-012021-12-310001889539crbg:InvestmentsExcludingModifiedCoinsuranceAndFundsWithheldAssetsMembercrbg:ExcludingModifiedCoinsuranceAndFundsWithheldEmbeddedDerivativeMember2020-01-012020-12-310001889539crbg:FortitudeMembercrbg:ExcludingModifiedCoinsuranceAndFundsWithheldEmbeddedDerivativeMember2020-01-012020-12-310001889539crbg:ExcludingModifiedCoinsuranceAndFundsWithheldEmbeddedDerivativeMember2020-01-012020-12-310001889539crbg:InvestmentsExcludingModifiedCoinsuranceAndFundsWithheldAssetsMemberus-gaap:LoansReceivableMembercrbg:ExcludingModifiedCoinsuranceAndFundsWithheldEmbeddedDerivativeMember2022-01-012022-12-310001889539crbg:FortitudeMemberus-gaap:LoansReceivableMembercrbg:ExcludingModifiedCoinsuranceAndFundsWithheldEmbeddedDerivativeMember2022-01-012022-12-310001889539us-gaap:LoansReceivableMembercrbg:ExcludingModifiedCoinsuranceAndFundsWithheldEmbeddedDerivativeMember2022-01-012022-12-310001889539crbg:InvestmentsExcludingModifiedCoinsuranceAndFundsWithheldAssetsMemberus-gaap:LoansReceivableMembercrbg:ExcludingModifiedCoinsuranceAndFundsWithheldEmbeddedDerivativeMember2021-01-012021-12-310001889539crbg:FortitudeMemberus-gaap:LoansReceivableMembercrbg:ExcludingModifiedCoinsuranceAndFundsWithheldEmbeddedDerivativeMember2021-01-012021-12-310001889539us-gaap:LoansReceivableMembercrbg:ExcludingModifiedCoinsuranceAndFundsWithheldEmbeddedDerivativeMember2021-01-012021-12-310001889539crbg:InvestmentsExcludingModifiedCoinsuranceAndFundsWithheldAssetsMemberus-gaap:LoansReceivableMembercrbg:ExcludingModifiedCoinsuranceAndFundsWithheldEmbeddedDerivativeMember2020-01-012020-12-310001889539crbg:FortitudeMemberus-gaap:LoansReceivableMembercrbg:ExcludingModifiedCoinsuranceAndFundsWithheldEmbeddedDerivativeMember2020-01-012020-12-310001889539us-gaap:LoansReceivableMembercrbg:ExcludingModifiedCoinsuranceAndFundsWithheldEmbeddedDerivativeMember2020-01-012020-12-310001889539crbg:VariableAnnuityEmbeddedDerivativesMembercrbg:InvestmentsExcludingModifiedCoinsuranceAndFundsWithheldAssetsMembercrbg:ExcludingModifiedCoinsuranceAndFundsWithheldEmbeddedDerivativeMember2022-01-012022-12-310001889539crbg:VariableAnnuityEmbeddedDerivativesMembercrbg:FortitudeMembercrbg:ExcludingModifiedCoinsuranceAndFundsWithheldEmbeddedDerivativeMember2022-01-012022-12-310001889539crbg:VariableAnnuityEmbeddedDerivativesMembercrbg:ExcludingModifiedCoinsuranceAndFundsWithheldEmbeddedDerivativeMember2022-01-012022-12-310001889539crbg:VariableAnnuityEmbeddedDerivativesMembercrbg:InvestmentsExcludingModifiedCoinsuranceAndFundsWithheldAssetsMembercrbg:ExcludingModifiedCoinsuranceAndFundsWithheldEmbeddedDerivativeMember2021-01-012021-12-310001889539crbg:VariableAnnuityEmbeddedDerivativesMembercrbg:FortitudeMembercrbg:ExcludingModifiedCoinsuranceAndFundsWithheldEmbeddedDerivativeMember2021-01-012021-12-310001889539crbg:VariableAnnuityEmbeddedDerivativesMembercrbg:ExcludingModifiedCoinsuranceAndFundsWithheldEmbeddedDerivativeMember2021-01-012021-12-310001889539crbg:VariableAnnuityEmbeddedDerivativesMembercrbg:InvestmentsExcludingModifiedCoinsuranceAndFundsWithheldAssetsMembercrbg:ExcludingModifiedCoinsuranceAndFundsWithheldEmbeddedDerivativeMember2020-01-012020-12-310001889539crbg:VariableAnnuityEmbeddedDerivativesMembercrbg:FortitudeMembercrbg:ExcludingModifiedCoinsuranceAndFundsWithheldEmbeddedDerivativeMember2020-01-012020-12-310001889539crbg:VariableAnnuityEmbeddedDerivativesMembercrbg:ExcludingModifiedCoinsuranceAndFundsWithheldEmbeddedDerivativeMember2020-01-012020-12-310001889539crbg:FixedAnnuityAndIndexedLifeEmbeddedDerivativesMembercrbg:InvestmentsExcludingModifiedCoinsuranceAndFundsWithheldAssetsMembercrbg:ExcludingModifiedCoinsuranceAndFundsWithheldEmbeddedDerivativeMember2022-01-012022-12-310001889539crbg:FortitudeMembercrbg:FixedAnnuityAndIndexedLifeEmbeddedDerivativesMembercrbg:ExcludingModifiedCoinsuranceAndFundsWithheldEmbeddedDerivativeMember2022-01-012022-12-310001889539crbg:FixedAnnuityAndIndexedLifeEmbeddedDerivativesMembercrbg:ExcludingModifiedCoinsuranceAndFundsWithheldEmbeddedDerivativeMember2022-01-012022-12-310001889539crbg:FixedAnnuityAndIndexedLifeEmbeddedDerivativesMembercrbg:InvestmentsExcludingModifiedCoinsuranceAndFundsWithheldAssetsMembercrbg:ExcludingModifiedCoinsuranceAndFundsWithheldEmbeddedDerivativeMember2021-01-012021-12-310001889539crbg:FortitudeMembercrbg:FixedAnnuityAndIndexedLifeEmbeddedDerivativesMembercrbg:ExcludingModifiedCoinsuranceAndFundsWithheldEmbeddedDerivativeMember2021-01-012021-12-310001889539crbg:FixedAnnuityAndIndexedLifeEmbeddedDerivativesMembercrbg:ExcludingModifiedCoinsuranceAndFundsWithheldEmbeddedDerivativeMember2021-01-012021-12-310001889539crbg:FixedAnnuityAndIndexedLifeEmbeddedDerivativesMembercrbg:InvestmentsExcludingModifiedCoinsuranceAndFundsWithheldAssetsMembercrbg:ExcludingModifiedCoinsuranceAndFundsWithheldEmbeddedDerivativeMember2020-01-012020-12-310001889539crbg:FortitudeMembercrbg:FixedAnnuityAndIndexedLifeEmbeddedDerivativesMembercrbg:ExcludingModifiedCoinsuranceAndFundsWithheldEmbeddedDerivativeMember2020-01-012020-12-310001889539crbg:FixedAnnuityAndIndexedLifeEmbeddedDerivativesMembercrbg:ExcludingModifiedCoinsuranceAndFundsWithheldEmbeddedDerivativeMember2020-01-012020-12-310001889539crbg:ModifiedCoinsuranceAndFundsWithheldEmbeddedDerivativesMembercrbg:InvestmentsExcludingModifiedCoinsuranceAndFundsWithheldAssetsMember2022-01-012022-12-310001889539crbg:FortitudeMembercrbg:ModifiedCoinsuranceAndFundsWithheldEmbeddedDerivativesMember2022-01-012022-12-310001889539crbg:ModifiedCoinsuranceAndFundsWithheldEmbeddedDerivativesMembercrbg:InvestmentsExcludingModifiedCoinsuranceAndFundsWithheldAssetsMember2021-01-012021-12-310001889539crbg:FortitudeMembercrbg:ModifiedCoinsuranceAndFundsWithheldEmbeddedDerivativesMember2021-01-012021-12-310001889539crbg:ModifiedCoinsuranceAndFundsWithheldEmbeddedDerivativesMembercrbg:InvestmentsExcludingModifiedCoinsuranceAndFundsWithheldAssetsMember2020-01-012020-12-310001889539crbg:FortitudeMembercrbg:ModifiedCoinsuranceAndFundsWithheldEmbeddedDerivativesMember2020-01-012020-12-310001889539crbg:InvestmentsExcludingModifiedCoinsuranceAndFundsWithheldAssetsMember2022-01-012022-12-310001889539crbg:InvestmentsExcludingModifiedCoinsuranceAndFundsWithheldAssetsMember2021-01-012021-12-310001889539crbg:InvestmentsExcludingModifiedCoinsuranceAndFundsWithheldAssetsMember2020-01-012020-12-310001889539crbg:OtherInvestedAssetsMember2022-01-012022-12-310001889539crbg:OtherInvestedAssetsMember2021-01-012021-12-310001889539crbg:StructuredInvestmentMember2021-12-310001889539crbg:NonStructuredInvestmentMember2021-12-310001889539crbg:StructuredInvestmentMember2020-12-310001889539crbg:NonStructuredInvestmentMember2020-12-310001889539crbg:StructuredInvestmentMember2019-12-310001889539crbg:NonStructuredInvestmentMember2019-12-310001889539crbg:StructuredInvestmentMember2022-01-012022-12-310001889539crbg:NonStructuredInvestmentMember2022-01-012022-12-310001889539crbg:StructuredInvestmentMember2021-01-012021-12-310001889539crbg:NonStructuredInvestmentMember2021-01-012021-12-310001889539crbg:StructuredInvestmentMember2020-01-012020-12-310001889539crbg:NonStructuredInvestmentMember2020-01-012020-12-310001889539crbg:StructuredInvestmentMember2022-12-310001889539crbg:NonStructuredInvestmentMember2022-12-310001889539us-gaap:MaturityOvernightAndOnDemandMemberus-gaap:AvailableforsaleSecuritiesMemberus-gaap:ForeignGovernmentDebtSecuritiesMember2022-12-310001889539us-gaap:AvailableforsaleSecuritiesMemberus-gaap:ForeignGovernmentDebtSecuritiesMemberus-gaap:MaturityUpTo30DaysMember2022-12-310001889539crbg:Maturity31To90DaysMemberus-gaap:AvailableforsaleSecuritiesMemberus-gaap:ForeignGovernmentDebtSecuritiesMember2022-12-310001889539crbg:Maturity91To364DaysMemberus-gaap:AvailableforsaleSecuritiesMemberus-gaap:ForeignGovernmentDebtSecuritiesMember2022-12-310001889539crbg:Maturity365DaysOrGreaterMemberus-gaap:AvailableforsaleSecuritiesMemberus-gaap:ForeignGovernmentDebtSecuritiesMember2022-12-310001889539us-gaap:AvailableforsaleSecuritiesMemberus-gaap:ForeignGovernmentDebtSecuritiesMember2022-12-310001889539us-gaap:MaturityOvernightAndOnDemandMemberus-gaap:CorporateDebtSecuritiesMemberus-gaap:AvailableforsaleSecuritiesMember2022-12-310001889539us-gaap:CorporateDebtSecuritiesMemberus-gaap:AvailableforsaleSecuritiesMemberus-gaap:MaturityUpTo30DaysMember2022-12-310001889539crbg:Maturity31To90DaysMemberus-gaap:CorporateDebtSecuritiesMemberus-gaap:AvailableforsaleSecuritiesMember2022-12-310001889539crbg:Maturity91To364DaysMemberus-gaap:CorporateDebtSecuritiesMemberus-gaap:AvailableforsaleSecuritiesMember2022-12-310001889539crbg:Maturity365DaysOrGreaterMemberus-gaap:CorporateDebtSecuritiesMemberus-gaap:AvailableforsaleSecuritiesMember2022-12-310001889539us-gaap:CorporateDebtSecuritiesMemberus-gaap:AvailableforsaleSecuritiesMember2022-12-310001889539us-gaap:MaturityOvernightAndOnDemandMember2022-12-310001889539us-gaap:MaturityUpTo30DaysMember2022-12-310001889539crbg:Maturity31To90DaysMember2022-12-310001889539crbg:Maturity91To364DaysMember2022-12-310001889539crbg:Maturity365DaysOrGreaterMember2022-12-310001889539us-gaap:MaturityOvernightAndOnDemandMemberus-gaap:AvailableforsaleSecuritiesMemberus-gaap:ForeignGovernmentDebtSecuritiesMember2021-12-310001889539us-gaap:AvailableforsaleSecuritiesMemberus-gaap:ForeignGovernmentDebtSecuritiesMemberus-gaap:MaturityUpTo30DaysMember2021-12-310001889539crbg:Maturity31To90DaysMemberus-gaap:AvailableforsaleSecuritiesMemberus-gaap:ForeignGovernmentDebtSecuritiesMember2021-12-310001889539crbg:Maturity91To364DaysMemberus-gaap:AvailableforsaleSecuritiesMemberus-gaap:ForeignGovernmentDebtSecuritiesMember2021-12-310001889539crbg:Maturity365DaysOrGreaterMemberus-gaap:AvailableforsaleSecuritiesMemberus-gaap:ForeignGovernmentDebtSecuritiesMember2021-12-310001889539us-gaap:AvailableforsaleSecuritiesMemberus-gaap:ForeignGovernmentDebtSecuritiesMember2021-12-310001889539us-gaap:MaturityOvernightAndOnDemandMemberus-gaap:CorporateDebtSecuritiesMemberus-gaap:AvailableforsaleSecuritiesMember2021-12-310001889539us-gaap:CorporateDebtSecuritiesMemberus-gaap:AvailableforsaleSecuritiesMemberus-gaap:MaturityUpTo30DaysMember2021-12-310001889539crbg:Maturity31To90DaysMemberus-gaap:CorporateDebtSecuritiesMemberus-gaap:AvailableforsaleSecuritiesMember2021-12-310001889539crbg:Maturity91To364DaysMemberus-gaap:CorporateDebtSecuritiesMemberus-gaap:AvailableforsaleSecuritiesMember2021-12-310001889539crbg:Maturity365DaysOrGreaterMemberus-gaap:CorporateDebtSecuritiesMemberus-gaap:AvailableforsaleSecuritiesMember2021-12-310001889539us-gaap:CorporateDebtSecuritiesMemberus-gaap:AvailableforsaleSecuritiesMember2021-12-310001889539us-gaap:MaturityOvernightAndOnDemandMember2021-12-310001889539us-gaap:MaturityUpTo30DaysMember2021-12-310001889539crbg:Maturity31To90DaysMember2021-12-310001889539crbg:Maturity91To364DaysMember2021-12-310001889539crbg:Maturity365DaysOrGreaterMember2021-12-310001889539us-gaap:MaturityOvernightAndOnDemandMemberus-gaap:AvailableforsaleSecuritiesMemberus-gaap:USStatesAndPoliticalSubdivisionsMember2021-12-310001889539us-gaap:AvailableforsaleSecuritiesMemberus-gaap:MaturityUpTo30DaysMemberus-gaap:USStatesAndPoliticalSubdivisionsMember2021-12-310001889539crbg:Maturity31To90DaysMemberus-gaap:AvailableforsaleSecuritiesMemberus-gaap:USStatesAndPoliticalSubdivisionsMember2021-12-310001889539crbg:Maturity91To364DaysMemberus-gaap:AvailableforsaleSecuritiesMemberus-gaap:USStatesAndPoliticalSubdivisionsMember2021-12-310001889539crbg:Maturity365DaysOrGreaterMemberus-gaap:AvailableforsaleSecuritiesMemberus-gaap:USStatesAndPoliticalSubdivisionsMember2021-12-310001889539us-gaap:AvailableforsaleSecuritiesMemberus-gaap:USStatesAndPoliticalSubdivisionsMember2021-12-310001889539us-gaap:FederalHomeLoanBankCertificatesAndObligationsFHLBMember2022-12-310001889539us-gaap:FederalHomeLoanBankCertificatesAndObligationsFHLBMember2021-12-310001889539us-gaap:FederalHomeLoanBankAdvancesMemberus-gaap:AssetPledgedAsCollateralMember2022-12-310001889539us-gaap:FederalHomeLoanBankAdvancesMemberus-gaap:AssetPledgedAsCollateralMember2021-12-310001889539us-gaap:GuaranteedInvestmentContractMember2022-12-310001889539us-gaap:GuaranteedInvestmentContractMember2021-12-310001889539us-gaap:DepositsMemberus-gaap:AssetPledgedAsCollateralMember2022-12-310001889539us-gaap:DepositsMemberus-gaap:AssetPledgedAsCollateralMember2021-12-310001889539crbg:CollateralizedReinsuranceTransactionsMemberus-gaap:AssetPledgedAsCollateralMember2022-12-310001889539crbg:CollateralizedReinsuranceTransactionsMemberus-gaap:AssetPledgedAsCollateralMember2021-12-310001889539us-gaap:CommercialPortfolioSegmentMember2022-12-310001889539us-gaap:CommercialPortfolioSegmentMember2021-12-310001889539us-gaap:ResidentialPortfolioSegmentMember2022-12-310001889539us-gaap:ResidentialPortfolioSegmentMember2021-12-310001889539crbg:LifeInsurancePolicyPortfolioSegmentMember2022-12-310001889539crbg:LifeInsurancePolicyPortfolioSegmentMember2021-12-310001889539crbg:CommercialOtherAndNotesPortfolioSegmentMember2022-12-310001889539crbg:CommercialOtherAndNotesPortfolioSegmentMember2021-12-310001889539us-gaap:FinanceReceivablesMemberstpr:NYus-gaap:GeographicConcentrationRiskMemberus-gaap:CommercialPortfolioSegmentMember2022-01-012022-12-310001889539us-gaap:FinanceReceivablesMemberstpr:CAus-gaap:GeographicConcentrationRiskMemberus-gaap:CommercialPortfolioSegmentMember2022-01-012022-12-310001889539us-gaap:FinanceReceivablesMemberstpr:NYus-gaap:GeographicConcentrationRiskMemberus-gaap:CommercialPortfolioSegmentMember2021-01-012021-12-310001889539us-gaap:FinanceReceivablesMemberstpr:CAus-gaap:GeographicConcentrationRiskMemberus-gaap:CommercialPortfolioSegmentMember2021-01-012021-12-310001889539stpr:NYus-gaap:CommercialPortfolioSegmentMember2022-12-310001889539stpr:CAus-gaap:CommercialPortfolioSegmentMember2022-12-310001889539stpr:NYus-gaap:CommercialPortfolioSegmentMember2021-12-310001889539stpr:CAus-gaap:CommercialPortfolioSegmentMember2021-12-310001889539crbg:DebtServiceCoverageRatioRangeOneMemberus-gaap:CommercialPortfolioSegmentMember2022-12-310001889539us-gaap:CommercialPortfolioSegmentMembercrbg:DebtServiceCoverageRatioRangeTwoMember2022-12-310001889539crbg:DebtServiceCoverageRatioRangeThreeMemberus-gaap:CommercialPortfolioSegmentMember2022-12-310001889539crbg:DebtServiceCoverageRatioRangeOneMemberus-gaap:CommercialPortfolioSegmentMember2021-12-310001889539us-gaap:CommercialPortfolioSegmentMembercrbg:DebtServiceCoverageRatioRangeTwoMember2021-12-310001889539crbg:DebtServiceCoverageRatioRangeThreeMemberus-gaap:CommercialPortfolioSegmentMember2021-12-310001889539crbg:DebtToValueRatioLessThan65PercentMemberus-gaap:CommercialPortfolioSegmentMember2022-12-310001889539crbg:DebtToValueRatioBetween65And75PercentMemberus-gaap:CommercialPortfolioSegmentMember2022-12-310001889539crbg:DebtToValueRatioBetween76And80PercentMemberus-gaap:CommercialPortfolioSegmentMember2022-12-310001889539us-gaap:Ltv80To100PercentMemberus-gaap:CommercialPortfolioSegmentMember2022-12-310001889539crbg:DebtToValueRatioLessThan65PercentMemberus-gaap:CommercialPortfolioSegmentMember2021-12-310001889539crbg:DebtToValueRatioBetween65And75PercentMemberus-gaap:CommercialPortfolioSegmentMember2021-12-310001889539crbg:DebtToValueRatioBetween76And80PercentMemberus-gaap:CommercialPortfolioSegmentMember2021-12-310001889539us-gaap:Ltv80To100PercentMemberus-gaap:CommercialPortfolioSegmentMember2021-12-310001889539us-gaap:CommercialPortfolioSegmentMemberus-gaap:FinancialAssetNotPastDueMember2022-12-31crbg:loan0001889539srt:ApartmentBuildingMemberus-gaap:CommercialPortfolioSegmentMemberus-gaap:FinancialAssetNotPastDueMember2022-12-310001889539us-gaap:CommercialPortfolioSegmentMemberus-gaap:FinancialAssetNotPastDueMembersrt:OfficeBuildingMember2022-12-310001889539us-gaap:CommercialPortfolioSegmentMemberus-gaap:RetailMemberus-gaap:FinancialAssetNotPastDueMember2022-12-310001889539us-gaap:CommercialPortfolioSegmentMembersrt:IndustrialPropertyMemberus-gaap:FinancialAssetNotPastDueMember2022-12-310001889539srt:HotelMemberus-gaap:CommercialPortfolioSegmentMemberus-gaap:FinancialAssetNotPastDueMember2022-12-310001889539crbg:OtherFinancingReceivableMemberus-gaap:CommercialPortfolioSegmentMemberus-gaap:FinancialAssetNotPastDueMember2022-12-310001889539us-gaap:CommercialPortfolioSegmentMembercrbg:FinancialAssetRestructuredNotPastDueMember2022-12-310001889539srt:ApartmentBuildingMemberus-gaap:CommercialPortfolioSegmentMembercrbg:FinancialAssetRestructuredNotPastDueMember2022-12-310001889539us-gaap:CommercialPortfolioSegmentMembersrt:OfficeBuildingMembercrbg:FinancialAssetRestructuredNotPastDueMember2022-12-310001889539us-gaap:CommercialPortfolioSegmentMemberus-gaap:RetailMembercrbg:FinancialAssetRestructuredNotPastDueMember2022-12-310001889539us-gaap:CommercialPortfolioSegmentMembersrt:IndustrialPropertyMembercrbg:FinancialAssetRestructuredNotPastDueMember2022-12-310001889539srt:HotelMemberus-gaap:CommercialPortfolioSegmentMembercrbg:FinancialAssetRestructuredNotPastDueMember2022-12-310001889539crbg:OtherFinancingReceivableMemberus-gaap:CommercialPortfolioSegmentMembercrbg:FinancialAssetRestructuredNotPastDueMember2022-12-310001889539crbg:FinancialAsset90DaysOrLessPastDueMemberus-gaap:CommercialPortfolioSegmentMember2022-12-310001889539crbg:FinancialAsset90DaysOrLessPastDueMembersrt:ApartmentBuildingMemberus-gaap:CommercialPortfolioSegmentMember2022-12-310001889539crbg:FinancialAsset90DaysOrLessPastDueMemberus-gaap:CommercialPortfolioSegmentMembersrt:OfficeBuildingMember2022-12-310001889539crbg:FinancialAsset90DaysOrLessPastDueMemberus-gaap:CommercialPortfolioSegmentMemberus-gaap:RetailMember2022-12-310001889539crbg:FinancialAsset90DaysOrLessPastDueMemberus-gaap:CommercialPortfolioSegmentMembersrt:IndustrialPropertyMember2022-12-310001889539crbg:FinancialAsset90DaysOrLessPastDueMembersrt:HotelMemberus-gaap:CommercialPortfolioSegmentMember2022-12-310001889539crbg:FinancialAsset90DaysOrLessPastDueMembercrbg:OtherFinancingReceivableMemberus-gaap:CommercialPortfolioSegmentMember2022-12-310001889539crbg:FinancialAssetGreaterThan90DaysPastDueMemberus-gaap:CommercialPortfolioSegmentMember2022-12-310001889539crbg:FinancialAssetGreaterThan90DaysPastDueMembersrt:ApartmentBuildingMemberus-gaap:CommercialPortfolioSegmentMember2022-12-310001889539crbg:FinancialAssetGreaterThan90DaysPastDueMemberus-gaap:CommercialPortfolioSegmentMembersrt:OfficeBuildingMember2022-12-310001889539crbg:FinancialAssetGreaterThan90DaysPastDueMemberus-gaap:CommercialPortfolioSegmentMemberus-gaap:RetailMember2022-12-310001889539crbg:FinancialAssetGreaterThan90DaysPastDueMemberus-gaap:CommercialPortfolioSegmentMembersrt:IndustrialPropertyMember2022-12-310001889539crbg:FinancialAssetGreaterThan90DaysPastDueMembersrt:HotelMemberus-gaap:CommercialPortfolioSegmentMember2022-12-310001889539crbg:OtherFinancingReceivableMembercrbg:FinancialAssetGreaterThan90DaysPastDueMemberus-gaap:CommercialPortfolioSegmentMember2022-12-310001889539srt:ApartmentBuildingMemberus-gaap:CommercialPortfolioSegmentMember2022-12-310001889539us-gaap:CommercialPortfolioSegmentMembersrt:OfficeBuildingMember2022-12-310001889539us-gaap:CommercialPortfolioSegmentMemberus-gaap:RetailMember2022-12-310001889539us-gaap:CommercialPortfolioSegmentMembersrt:IndustrialPropertyMember2022-12-310001889539srt:HotelMemberus-gaap:CommercialPortfolioSegmentMember2022-12-310001889539crbg:OtherFinancingReceivableMemberus-gaap:CommercialPortfolioSegmentMember2022-12-310001889539us-gaap:CommercialPortfolioSegmentMemberus-gaap:FinancialAssetNotPastDueMember2021-12-310001889539srt:ApartmentBuildingMemberus-gaap:CommercialPortfolioSegmentMemberus-gaap:FinancialAssetNotPastDueMember2021-12-310001889539us-gaap:CommercialPortfolioSegmentMemberus-gaap:FinancialAssetNotPastDueMembersrt:OfficeBuildingMember2021-12-310001889539us-gaap:CommercialPortfolioSegmentMemberus-gaap:RetailMemberus-gaap:FinancialAssetNotPastDueMember2021-12-310001889539us-gaap:CommercialPortfolioSegmentMembersrt:IndustrialPropertyMemberus-gaap:FinancialAssetNotPastDueMember2021-12-310001889539srt:HotelMemberus-gaap:CommercialPortfolioSegmentMemberus-gaap:FinancialAssetNotPastDueMember2021-12-310001889539crbg:OtherFinancingReceivableMemberus-gaap:CommercialPortfolioSegmentMemberus-gaap:FinancialAssetNotPastDueMember2021-12-310001889539us-gaap:CommercialPortfolioSegmentMembercrbg:FinancialAssetRestructuredNotPastDueMember2021-12-310001889539srt:ApartmentBuildingMemberus-gaap:CommercialPortfolioSegmentMembercrbg:FinancialAssetRestructuredNotPastDueMember2021-12-310001889539us-gaap:CommercialPortfolioSegmentMembersrt:OfficeBuildingMembercrbg:FinancialAssetRestructuredNotPastDueMember2021-12-310001889539us-gaap:CommercialPortfolioSegmentMemberus-gaap:RetailMembercrbg:FinancialAssetRestructuredNotPastDueMember2021-12-310001889539us-gaap:CommercialPortfolioSegmentMembersrt:IndustrialPropertyMembercrbg:FinancialAssetRestructuredNotPastDueMember2021-12-310001889539srt:HotelMemberus-gaap:CommercialPortfolioSegmentMembercrbg:FinancialAssetRestructuredNotPastDueMember2021-12-310001889539crbg:OtherFinancingReceivableMemberus-gaap:CommercialPortfolioSegmentMembercrbg:FinancialAssetRestructuredNotPastDueMember2021-12-310001889539crbg:FinancialAsset90DaysOrLessPastDueMemberus-gaap:CommercialPortfolioSegmentMember2021-12-310001889539crbg:FinancialAsset90DaysOrLessPastDueMembersrt:ApartmentBuildingMemberus-gaap:CommercialPortfolioSegmentMember2021-12-310001889539crbg:FinancialAsset90DaysOrLessPastDueMemberus-gaap:CommercialPortfolioSegmentMembersrt:OfficeBuildingMember2021-12-310001889539crbg:FinancialAsset90DaysOrLessPastDueMemberus-gaap:CommercialPortfolioSegmentMemberus-gaap:RetailMember2021-12-310001889539crbg:FinancialAsset90DaysOrLessPastDueMemberus-gaap:CommercialPortfolioSegmentMembersrt:IndustrialPropertyMember2021-12-310001889539crbg:FinancialAsset90DaysOrLessPastDueMembersrt:HotelMemberus-gaap:CommercialPortfolioSegmentMember2021-12-310001889539crbg:FinancialAsset90DaysOrLessPastDueMembercrbg:OtherFinancingReceivableMemberus-gaap:CommercialPortfolioSegmentMember2021-12-310001889539crbg:FinancialAssetGreaterThan90DaysPastDueMemberus-gaap:CommercialPortfolioSegmentMember2021-12-310001889539crbg:FinancialAssetGreaterThan90DaysPastDueMembersrt:ApartmentBuildingMemberus-gaap:CommercialPortfolioSegmentMember2021-12-310001889539crbg:FinancialAssetGreaterThan90DaysPastDueMemberus-gaap:CommercialPortfolioSegmentMembersrt:OfficeBuildingMember2021-12-310001889539crbg:FinancialAssetGreaterThan90DaysPastDueMemberus-gaap:CommercialPortfolioSegmentMemberus-gaap:RetailMember2021-12-310001889539crbg:FinancialAssetGreaterThan90DaysPastDueMemberus-gaap:CommercialPortfolioSegmentMembersrt:IndustrialPropertyMember2021-12-310001889539crbg:FinancialAssetGreaterThan90DaysPastDueMembersrt:HotelMemberus-gaap:CommercialPortfolioSegmentMember2021-12-310001889539crbg:OtherFinancingReceivableMembercrbg:FinancialAssetGreaterThan90DaysPastDueMemberus-gaap:CommercialPortfolioSegmentMember2021-12-310001889539srt:ApartmentBuildingMemberus-gaap:CommercialPortfolioSegmentMember2021-12-310001889539us-gaap:CommercialPortfolioSegmentMembersrt:OfficeBuildingMember2021-12-310001889539us-gaap:CommercialPortfolioSegmentMemberus-gaap:RetailMember2021-12-310001889539us-gaap:CommercialPortfolioSegmentMembersrt:IndustrialPropertyMember2021-12-310001889539srt:HotelMemberus-gaap:CommercialPortfolioSegmentMember2021-12-310001889539crbg:OtherFinancingReceivableMemberus-gaap:CommercialPortfolioSegmentMember2021-12-310001889539us-gaap:ResidentialPortfolioSegmentMembercrbg:FICOScore780AndGreaterMember2022-12-310001889539us-gaap:ResidentialPortfolioSegmentMembercrbg:FICOScoreBetween720And779Member2022-12-310001889539us-gaap:ResidentialPortfolioSegmentMembercrbg:FICOScoreBetween660And719Member2022-12-310001889539crbg:FICOScoreBetween600And659Memberus-gaap:ResidentialPortfolioSegmentMember2022-12-310001889539us-gaap:ResidentialPortfolioSegmentMembercrbg:FICOScoreLessThan600Member2022-12-310001889539us-gaap:ResidentialPortfolioSegmentMembercrbg:FICOScore780AndGreaterMember2021-12-310001889539us-gaap:ResidentialPortfolioSegmentMembercrbg:FICOScoreBetween720And779Member2021-12-310001889539us-gaap:ResidentialPortfolioSegmentMembercrbg:FICOScoreBetween660And719Member2021-12-310001889539crbg:FICOScoreBetween600And659Memberus-gaap:ResidentialPortfolioSegmentMember2021-12-310001889539us-gaap:ResidentialPortfolioSegmentMembercrbg:FICOScoreLessThan600Member2021-12-310001889539crbg:OtherPortfolioSegmentMember2021-12-310001889539us-gaap:CommercialPortfolioSegmentMember2020-12-310001889539crbg:OtherPortfolioSegmentMember2020-12-310001889539us-gaap:CommercialPortfolioSegmentMember2019-12-310001889539crbg:OtherPortfolioSegmentMember2019-12-310001889539srt:CumulativeEffectPeriodOfAdoptionAdjustmentMemberus-gaap:CommercialPortfolioSegmentMember2021-12-310001889539crbg:OtherPortfolioSegmentMembersrt:CumulativeEffectPeriodOfAdoptionAdjustmentMember2021-12-310001889539srt:CumulativeEffectPeriodOfAdoptionAdjustmentMember2021-12-310001889539srt:CumulativeEffectPeriodOfAdoptionAdjustmentMemberus-gaap:CommercialPortfolioSegmentMember2020-12-310001889539crbg:OtherPortfolioSegmentMembersrt:CumulativeEffectPeriodOfAdoptionAdjustmentMember2020-12-310001889539srt:CumulativeEffectPeriodOfAdoptionAdjustmentMemberus-gaap:CommercialPortfolioSegmentMember2019-12-310001889539crbg:OtherPortfolioSegmentMembersrt:CumulativeEffectPeriodOfAdoptionAdjustmentMember2019-12-310001889539us-gaap:CommercialPortfolioSegmentMember2022-01-012022-12-310001889539crbg:OtherPortfolioSegmentMember2022-01-012022-12-310001889539us-gaap:CommercialPortfolioSegmentMember2021-01-012021-12-310001889539crbg:OtherPortfolioSegmentMember2021-01-012021-12-310001889539us-gaap:CommercialPortfolioSegmentMember2020-01-012020-12-310001889539crbg:OtherPortfolioSegmentMember2020-01-012020-12-310001889539crbg:OtherPortfolioSegmentMember2022-12-310001889539crbg:IndividualRetirementSegmentMembersrt:ScenarioPreviouslyReportedMember2020-12-310001889539crbg:LifeInsuranceOperatingSegmentMembersrt:ScenarioPreviouslyReportedMember2020-12-310001889539srt:ScenarioPreviouslyReportedMembercrbg:InstitutionalMarketsMember2020-12-310001889539srt:ScenarioPreviouslyReportedMember2020-12-310001889539crbg:IndividualRetirementSegmentMembercrbg:EffectOfApplicationOfAccountingStandardsUpdate201812ReclassificationToCostOfReinsuranceMember2020-12-310001889539crbg:LifeInsuranceOperatingSegmentMembercrbg:EffectOfApplicationOfAccountingStandardsUpdate201812ReclassificationToCostOfReinsuranceMember2020-12-310001889539crbg:InstitutionalMarketsMembercrbg:EffectOfApplicationOfAccountingStandardsUpdate201812ReclassificationToCostOfReinsuranceMember2020-12-310001889539crbg:EffectOfApplicationOfAccountingStandardsUpdate201812ReclassificationToCostOfReinsuranceMember2020-12-310001889539crbg:IndividualRetirementSegmentMembercrbg:EffectOfApplicationOfAccountingStandardsUpdate201812ReclassificationToMarketRiskBenefitsMember2020-12-310001889539crbg:LifeInsuranceOperatingSegmentMembercrbg:EffectOfApplicationOfAccountingStandardsUpdate201812ReclassificationToMarketRiskBenefitsMember2020-12-310001889539crbg:InstitutionalMarketsMembercrbg:EffectOfApplicationOfAccountingStandardsUpdate201812ReclassificationToMarketRiskBenefitsMember2020-12-310001889539crbg:EffectOfApplicationOfAccountingStandardsUpdate201812ReclassificationToMarketRiskBenefitsMember2020-12-310001889539crbg:IndividualRetirementSegmentMembercrbg:EffectOfApplicationOfAccountingStandardsUpdate201812AdjustmentsForNetPremiumReserveMember2020-12-310001889539crbg:LifeInsuranceOperatingSegmentMembercrbg:EffectOfApplicationOfAccountingStandardsUpdate201812AdjustmentsForNetPremiumReserveMember2020-12-310001889539crbg:InstitutionalMarketsMembercrbg:EffectOfApplicationOfAccountingStandardsUpdate201812AdjustmentsForNetPremiumReserveMember2020-12-310001889539crbg:EffectOfApplicationOfAccountingStandardsUpdate201812AdjustmentsForNetPremiumReserveMember2020-12-310001889539crbg:EffectOfApplicationOfAccountingStandardsUpdate201812AdjustmentsForChangeDueToTheCurrentUpperMediumGradeDiscountRateMembercrbg:IndividualRetirementSegmentMember2020-12-310001889539crbg:LifeInsuranceOperatingSegmentMembercrbg:EffectOfApplicationOfAccountingStandardsUpdate201812AdjustmentsForChangeDueToTheCurrentUpperMediumGradeDiscountRateMember2020-12-310001889539crbg:EffectOfApplicationOfAccountingStandardsUpdate201812AdjustmentsForChangeDueToTheCurrentUpperMediumGradeDiscountRateMembercrbg:InstitutionalMarketsMember2020-12-310001889539crbg:EffectOfApplicationOfAccountingStandardsUpdate201812AdjustmentsForChangeDueToTheCurrentUpperMediumGradeDiscountRateMember2020-12-310001889539crbg:IndividualRetirementSegmentMembercrbg:FortitudeReMember2020-12-310001889539crbg:LifeInsuranceOperatingSegmentMember2020-12-310001889539crbg:InstitutionalMarketsMember2020-12-310001889539crbg:FortitudeReMember2020-12-310001889539us-gaap:CorporateAndOtherMembercrbg:FortitudeReMembersrt:ScenarioPreviouslyReportedMember2020-12-310001889539us-gaap:CorporateAndOtherMembercrbg:FortitudeReMembercrbg:EffectOfApplicationOfAccountingStandardsUpdate201812AdjustmentsForNetPremiumReserveMember2020-12-310001889539us-gaap:CorporateAndOtherMembercrbg:EffectOfApplicationOfAccountingStandardsUpdate201812AdjustmentsForChangeDueToTheCurrentUpperMediumGradeDiscountRateMembercrbg:FortitudeReMember2020-12-310001889539us-gaap:CorporateAndOtherMembercrbg:FortitudeReMember2020-12-310001889539us-gaap:OtherLongdurationInsuranceProductLineMember2022-01-012022-12-310001889539us-gaap:OtherLongdurationInsuranceProductLineMember2021-01-012021-12-310001889539us-gaap:OtherLongdurationInsuranceProductLineMember2020-01-012020-12-310001889539crbg:FortitudeHoldingsMemberus-gaap:CarryingReportedAmountFairValueDisclosureMember2022-12-310001889539crbg:FortitudeHoldingsMemberus-gaap:EstimateOfFairValueFairValueDisclosureMember2022-12-310001889539crbg:FortitudeHoldingsMemberus-gaap:CarryingReportedAmountFairValueDisclosureMember2021-12-310001889539crbg:FortitudeHoldingsMemberus-gaap:EstimateOfFairValueFairValueDisclosureMember2021-12-310001889539crbg:FortitudeHoldingsMemberus-gaap:CarryingReportedAmountFairValueDisclosureMemberus-gaap:CommercialPortfolioSegmentMember2022-12-310001889539crbg:FortitudeHoldingsMemberus-gaap:EstimateOfFairValueFairValueDisclosureMemberus-gaap:CommercialPortfolioSegmentMember2022-12-310001889539crbg:FortitudeHoldingsMemberus-gaap:CarryingReportedAmountFairValueDisclosureMemberus-gaap:CommercialPortfolioSegmentMember2021-12-310001889539crbg:FortitudeHoldingsMemberus-gaap:EstimateOfFairValueFairValueDisclosureMemberus-gaap:CommercialPortfolioSegmentMember2021-12-310001889539crbg:FortitudeHoldingsMemberus-gaap:CarryingReportedAmountFairValueDisclosureMembercrbg:HedgeFundsAndPrivateEquityFundsMember2022-12-310001889539crbg:FortitudeHoldingsMembercrbg:HedgeFundsAndPrivateEquityFundsMemberus-gaap:EstimateOfFairValueFairValueDisclosureMember2022-12-310001889539crbg:FortitudeHoldingsMemberus-gaap:CarryingReportedAmountFairValueDisclosureMembercrbg:HedgeFundsAndPrivateEquityFundsMember2021-12-310001889539crbg:FortitudeHoldingsMembercrbg:HedgeFundsAndPrivateEquityFundsMemberus-gaap:EstimateOfFairValueFairValueDisclosureMember2021-12-310001889539crbg:FortitudeHoldingsMembercrbg:LifeInsurancePolicyPortfolioSegmentMemberus-gaap:CarryingReportedAmountFairValueDisclosureMember2022-12-310001889539crbg:FortitudeHoldingsMembercrbg:LifeInsurancePolicyPortfolioSegmentMemberus-gaap:EstimateOfFairValueFairValueDisclosureMember2022-12-310001889539crbg:FortitudeHoldingsMembercrbg:LifeInsurancePolicyPortfolioSegmentMemberus-gaap:CarryingReportedAmountFairValueDisclosureMember2021-12-310001889539crbg:FortitudeHoldingsMembercrbg:LifeInsurancePolicyPortfolioSegmentMemberus-gaap:EstimateOfFairValueFairValueDisclosureMember2021-12-310001889539crbg:FortitudeHoldingsMember2022-12-310001889539crbg:FortitudeHoldingsMember2021-12-310001889539crbg:FortitudeHoldingsMembercrbg:ModifiedCoinsuranceAndFundsWithheldAssetsMember2022-01-012022-12-310001889539crbg:FortitudeHoldingsMembercrbg:ModifiedCoinsuranceAndFundsWithheldAssetsMember2021-01-012021-12-310001889539crbg:FortitudeHoldingsMembercrbg:ModifiedCoinsuranceAndFundsWithheldAssetsMember2020-01-012020-12-310001889539crbg:FortitudeHoldingsMemberus-gaap:EmbeddedDerivativeFinancialInstrumentsMembercrbg:ModifiedCoinsuranceAndFundsWithheldAssetsMember2022-01-012022-12-310001889539crbg:FortitudeHoldingsMemberus-gaap:EmbeddedDerivativeFinancialInstrumentsMembercrbg:ModifiedCoinsuranceAndFundsWithheldAssetsMember2021-01-012021-12-310001889539crbg:FortitudeHoldingsMemberus-gaap:EmbeddedDerivativeFinancialInstrumentsMembercrbg:ModifiedCoinsuranceAndFundsWithheldAssetsMember2020-01-012020-12-310001889539crbg:FortitudeHoldingsMemberus-gaap:OtherInvestmentsMember2022-01-012022-12-310001889539crbg:FortitudeHoldingsMemberus-gaap:OtherInvestmentsMember2021-01-012021-12-310001889539crbg:FortitudeHoldingsMemberus-gaap:OtherInvestmentsMember2020-01-012020-12-310001889539crbg:CorebridgeMembercrbg:LegacyLifeAndRetirementRunOffLinesSegmentMemberMember2022-12-310001889539crbg:CorebridgeMembercrbg:LegacyLifeAndRetirementRunOffLinesSegmentMemberMember2021-12-310001889539crbg:CorebridgeMembercrbg:LifeAndUniversalSegmentMember2022-12-310001889539crbg:CorebridgeMember2022-12-31crbg:Agreement0001889539crbg:LongDurationInsuranceContractsMembercrbg:IndividualRetirementSegmentMembersrt:ScenarioPreviouslyReportedMember2020-12-310001889539crbg:LongDurationInsuranceContractsMembersrt:ScenarioPreviouslyReportedMembercrbg:GroupRetirementSegmentMember2020-12-310001889539crbg:LongDurationInsuranceContractsMembercrbg:LifeInsuranceOperatingSegmentMembersrt:ScenarioPreviouslyReportedMember2020-12-310001889539crbg:LongDurationInsuranceContractsMembercrbg:InstitutionalMarketsMembersrt:ScenarioPreviouslyReportedMember2020-12-310001889539crbg:LongDurationInsuranceContractsMembersrt:ScenarioPreviouslyReportedMember2020-12-310001889539crbg:LongDurationInsuranceContractsMembercrbg:IndividualRetirementSegmentMembersrt:RevisionOfPriorPeriodAccountingStandardsUpdateAdjustmentMember2020-12-310001889539crbg:LongDurationInsuranceContractsMembersrt:RevisionOfPriorPeriodAccountingStandardsUpdateAdjustmentMembercrbg:GroupRetirementSegmentMember2020-12-310001889539crbg:LongDurationInsuranceContractsMembercrbg:LifeInsuranceOperatingSegmentMembersrt:RevisionOfPriorPeriodAccountingStandardsUpdateAdjustmentMember2020-12-310001889539crbg:LongDurationInsuranceContractsMembercrbg:InstitutionalMarketsMembersrt:RevisionOfPriorPeriodAccountingStandardsUpdateAdjustmentMember2020-12-310001889539crbg:LongDurationInsuranceContractsMembersrt:RevisionOfPriorPeriodAccountingStandardsUpdateAdjustmentMember2020-12-310001889539crbg:LongDurationInsuranceContractsMembercrbg:IndividualRetirementSegmentMember2020-12-310001889539crbg:LongDurationInsuranceContractsMembercrbg:GroupRetirementSegmentMember2020-12-310001889539crbg:LongDurationInsuranceContractsMembercrbg:LifeInsuranceOperatingSegmentMember2020-12-310001889539crbg:LongDurationInsuranceContractsMembercrbg:InstitutionalMarketsMember2020-12-310001889539crbg:LongDurationInsuranceContractsMember2020-12-310001889539crbg:ValueOfBusinessAcquiredMembercrbg:IndividualRetirementSegmentMembersrt:ScenarioPreviouslyReportedMember2020-12-310001889539crbg:ValueOfBusinessAcquiredMembersrt:ScenarioPreviouslyReportedMembercrbg:GroupRetirementSegmentMember2020-12-310001889539crbg:ValueOfBusinessAcquiredMembercrbg:LifeInsuranceOperatingSegmentMembersrt:ScenarioPreviouslyReportedMember2020-12-310001889539crbg:ValueOfBusinessAcquiredMembercrbg:InstitutionalMarketsMembersrt:ScenarioPreviouslyReportedMember2020-12-310001889539crbg:ValueOfBusinessAcquiredMembercrbg:IndividualRetirementSegmentMembersrt:RevisionOfPriorPeriodAccountingStandardsUpdateAdjustmentMember2020-12-310001889539crbg:ValueOfBusinessAcquiredMembersrt:RevisionOfPriorPeriodAccountingStandardsUpdateAdjustmentMembercrbg:GroupRetirementSegmentMember2020-12-310001889539crbg:ValueOfBusinessAcquiredMembercrbg:LifeInsuranceOperatingSegmentMembersrt:RevisionOfPriorPeriodAccountingStandardsUpdateAdjustmentMember2020-12-310001889539crbg:ValueOfBusinessAcquiredMembercrbg:InstitutionalMarketsMembersrt:RevisionOfPriorPeriodAccountingStandardsUpdateAdjustmentMember2020-12-310001889539crbg:ValueOfBusinessAcquiredMembercrbg:IndividualRetirementSegmentMember2020-12-310001889539crbg:ValueOfBusinessAcquiredMembercrbg:GroupRetirementSegmentMember2020-12-310001889539crbg:ValueOfBusinessAcquiredMembercrbg:LifeInsuranceOperatingSegmentMember2020-12-310001889539crbg:ValueOfBusinessAcquiredMembercrbg:InstitutionalMarketsMember2020-12-310001889539crbg:LongDurationInsuranceContractsMembercrbg:IndividualRetirementSegmentMember2021-12-310001889539crbg:LongDurationInsuranceContractsMembercrbg:GroupRetirementSegmentMember2021-12-310001889539crbg:LongDurationInsuranceContractsMembercrbg:LifeInsuranceOperatingSegmentMember2021-12-310001889539crbg:LongDurationInsuranceContractsMembercrbg:InstitutionalMarketsMember2021-12-310001889539crbg:LongDurationInsuranceContractsMember2021-12-310001889539crbg:LongDurationInsuranceContractsMembercrbg:IndividualRetirementSegmentMember2022-01-012022-12-310001889539crbg:LongDurationInsuranceContractsMembercrbg:GroupRetirementSegmentMember2022-01-012022-12-310001889539crbg:LongDurationInsuranceContractsMembercrbg:LifeInsuranceOperatingSegmentMember2022-01-012022-12-310001889539crbg:LongDurationInsuranceContractsMembercrbg:InstitutionalMarketsMember2022-01-012022-12-310001889539crbg:LongDurationInsuranceContractsMember2022-01-012022-12-310001889539crbg:LongDurationInsuranceContractsMembercrbg:IndividualRetirementSegmentMember2022-12-310001889539crbg:LongDurationInsuranceContractsMembercrbg:GroupRetirementSegmentMember2022-12-310001889539crbg:LongDurationInsuranceContractsMembercrbg:LifeInsuranceOperatingSegmentMember2022-12-310001889539crbg:LongDurationInsuranceContractsMembercrbg:InstitutionalMarketsMember2022-12-310001889539crbg:LongDurationInsuranceContractsMember2022-12-310001889539crbg:ValueOfBusinessAcquiredMembercrbg:IndividualRetirementSegmentMember2022-12-310001889539crbg:ValueOfBusinessAcquiredMembercrbg:GroupRetirementSegmentMember2022-12-310001889539crbg:ValueOfBusinessAcquiredMembercrbg:LifeInsuranceOperatingSegmentMember2022-12-310001889539crbg:ValueOfBusinessAcquiredMembercrbg:InstitutionalMarketsMember2022-12-310001889539crbg:ValueOfBusinessAcquiredMember2022-12-310001889539crbg:LongDurationInsuranceContractsMembercrbg:IndividualRetirementSegmentMember2021-01-012021-12-310001889539crbg:LongDurationInsuranceContractsMembercrbg:GroupRetirementSegmentMember2021-01-012021-12-310001889539crbg:LongDurationInsuranceContractsMembercrbg:LifeInsuranceOperatingSegmentMember2021-01-012021-12-310001889539crbg:LongDurationInsuranceContractsMembercrbg:InstitutionalMarketsMember2021-01-012021-12-310001889539crbg:LongDurationInsuranceContractsMember2021-01-012021-12-310001889539crbg:ValueOfBusinessAcquiredMembercrbg:IndividualRetirementSegmentMember2021-12-310001889539crbg:ValueOfBusinessAcquiredMembercrbg:GroupRetirementSegmentMember2021-12-310001889539crbg:ValueOfBusinessAcquiredMembercrbg:LifeInsuranceOperatingSegmentMember2021-12-310001889539crbg:ValueOfBusinessAcquiredMembercrbg:InstitutionalMarketsMember2021-12-310001889539crbg:ValueOfBusinessAcquiredMember2021-12-310001889539crbg:LongDurationInsuranceContractsMember2019-12-310001889539crbg:LongDurationInsuranceContractsMember2020-01-012020-12-310001889539crbg:ValueOfBusinessAcquiredMembercrbg:IndividualRetirementSegmentMember2022-01-012022-12-310001889539crbg:ValueOfBusinessAcquiredMembercrbg:GroupRetirementSegmentMember2022-01-012022-12-310001889539crbg:ValueOfBusinessAcquiredMembercrbg:LifeInsuranceOperatingSegmentMember2022-01-012022-12-310001889539crbg:ValueOfBusinessAcquiredMember2022-01-012022-12-310001889539crbg:ValueOfBusinessAcquiredMembercrbg:IndividualRetirementSegmentMembersrt:CumulativeEffectPeriodOfAdoptionAdjustedBalanceMember2020-12-310001889539crbg:ValueOfBusinessAcquiredMembersrt:CumulativeEffectPeriodOfAdoptionAdjustedBalanceMembercrbg:GroupRetirementSegmentMember2020-12-310001889539crbg:ValueOfBusinessAcquiredMembercrbg:LifeInsuranceOperatingSegmentMembersrt:CumulativeEffectPeriodOfAdoptionAdjustedBalanceMember2020-12-310001889539crbg:ValueOfBusinessAcquiredMember2020-12-310001889539crbg:ValueOfBusinessAcquiredMembercrbg:IndividualRetirementSegmentMember2021-01-012021-12-310001889539crbg:ValueOfBusinessAcquiredMembercrbg:GroupRetirementSegmentMember2021-01-012021-12-310001889539crbg:ValueOfBusinessAcquiredMembercrbg:LifeInsuranceOperatingSegmentMember2021-01-012021-12-310001889539crbg:ValueOfBusinessAcquiredMember2021-01-012021-12-310001889539crbg:ValueOfBusinessAcquiredMembersrt:ScenarioPreviouslyReportedMember2019-12-310001889539crbg:ValueOfBusinessAcquiredMembersrt:ScenarioPreviouslyReportedMember2020-01-012020-12-310001889539crbg:ValueOfBusinessAcquiredMembersrt:ScenarioPreviouslyReportedMember2020-12-310001889539crbg:IndividualRetirementSegmentMembersrt:ScenarioPreviouslyReportedMember2019-12-310001889539srt:ScenarioPreviouslyReportedMembercrbg:GroupRetirementSegmentMember2019-12-310001889539srt:ScenarioPreviouslyReportedMember2019-12-310001889539crbg:IndividualRetirementSegmentMembersrt:RevisionOfPriorPeriodAccountingStandardsUpdateAdjustmentMember2019-12-310001889539srt:RevisionOfPriorPeriodAccountingStandardsUpdateAdjustmentMembercrbg:GroupRetirementSegmentMember2019-12-310001889539srt:RevisionOfPriorPeriodAccountingStandardsUpdateAdjustmentMember2019-12-310001889539crbg:IndividualRetirementSegmentMember2019-12-310001889539crbg:GroupRetirementSegmentMember2019-12-310001889539crbg:IndividualRetirementSegmentMembercrbg:DeferredSaleInducementsMember2021-12-310001889539crbg:GroupRetirementSegmentMembercrbg:DeferredSaleInducementsMember2021-12-310001889539crbg:DeferredSaleInducementsMember2021-12-310001889539crbg:IndividualRetirementSegmentMembercrbg:DeferredSaleInducementsMember2022-01-012022-12-310001889539crbg:GroupRetirementSegmentMembercrbg:DeferredSaleInducementsMember2022-01-012022-12-310001889539crbg:DeferredSaleInducementsMember2022-01-012022-12-310001889539crbg:IndividualRetirementSegmentMembercrbg:DeferredSaleInducementsMember2022-12-310001889539crbg:GroupRetirementSegmentMembercrbg:DeferredSaleInducementsMember2022-12-310001889539crbg:DeferredSaleInducementsMember2022-12-310001889539crbg:IndividualRetirementSegmentMembercrbg:DeferredSaleInducementsMember2020-12-310001889539crbg:GroupRetirementSegmentMembercrbg:DeferredSaleInducementsMember2020-12-310001889539crbg:DeferredSaleInducementsMember2020-12-310001889539crbg:IndividualRetirementSegmentMembercrbg:DeferredSaleInducementsMember2021-01-012021-12-310001889539crbg:GroupRetirementSegmentMembercrbg:DeferredSaleInducementsMember2021-01-012021-12-310001889539crbg:DeferredSaleInducementsMember2021-01-012021-12-310001889539srt:ScenarioPreviouslyReportedMembercrbg:DeferredSaleInducementsMember2019-12-310001889539srt:ScenarioPreviouslyReportedMembercrbg:DeferredSaleInducementsMember2020-01-012020-12-310001889539srt:ScenarioPreviouslyReportedMembercrbg:DeferredSaleInducementsMember2020-12-310001889539crbg:RealEstateAndInvestmentFundsMemberus-gaap:VariableInterestEntityPrimaryBeneficiaryMember2022-12-310001889539crbg:SecuritizationVehiclesMemberus-gaap:VariableInterestEntityPrimaryBeneficiaryMember2022-12-310001889539us-gaap:VariableInterestEntityPrimaryBeneficiaryMember2022-12-310001889539crbg:RealEstateAndInvestmentFundsMemberus-gaap:VariableInterestEntityPrimaryBeneficiaryMember2021-12-310001889539crbg:SecuritizationVehiclesMemberus-gaap:VariableInterestEntityPrimaryBeneficiaryMember2021-12-310001889539us-gaap:VariableInterestEntityPrimaryBeneficiaryMember2021-12-310001889539crbg:InternalPartiesMembercrbg:RealEstateAndInvestmentFundsMember2022-12-310001889539crbg:InternalPartiesMembercrbg:RealEstateAndInvestmentFundsMember2021-12-310001889539crbg:RealEstateAndInvestmentFundsMembercrbg:ExternalEntitiesMember2022-12-310001889539crbg:RealEstateAndInvestmentFundsMembercrbg:ExternalEntitiesMember2021-12-310001889539crbg:InternalPartiesMembercrbg:RealEstateAndInvestmentFundsMembercrbg:CorebridgeEntitiesMember2022-12-310001889539crbg:InternalPartiesMembercrbg:RealEstateAndInvestmentFundsMembercrbg:AIGAffiliatesMember2022-12-310001889539crbg:InternalPartiesMembercrbg:RealEstateAndInvestmentFundsMembercrbg:CorebridgeEntitiesMember2021-12-310001889539crbg:InternalPartiesMembercrbg:RealEstateAndInvestmentFundsMembercrbg:AIGAffiliatesMember2021-12-310001889539us-gaap:VariableInterestEntityPrimaryBeneficiaryMembercrbg:RealEstateAndInvestmentFundsMember2022-01-012022-12-310001889539us-gaap:VariableInterestEntityPrimaryBeneficiaryMembercrbg:SecuritizationAndRepackagingAndVehiclesMember2022-01-012022-12-310001889539crbg:AffordableHousingPartnershipsMemberus-gaap:VariableInterestEntityPrimaryBeneficiaryMember2022-01-012022-12-310001889539us-gaap:VariableInterestEntityPrimaryBeneficiaryMembercrbg:RealEstateAndInvestmentFundsMember2021-01-012021-12-310001889539us-gaap:VariableInterestEntityPrimaryBeneficiaryMembercrbg:SecuritizationAndRepackagingAndVehiclesMember2021-01-012021-12-310001889539crbg:AffordableHousingPartnershipsMemberus-gaap:VariableInterestEntityPrimaryBeneficiaryMember2021-01-012021-12-310001889539us-gaap:VariableInterestEntityPrimaryBeneficiaryMembercrbg:RealEstateAndInvestmentFundsMember2020-01-012020-12-310001889539us-gaap:VariableInterestEntityPrimaryBeneficiaryMembercrbg:SecuritizationAndRepackagingAndVehiclesMember2020-01-012020-12-310001889539crbg:AffordableHousingPartnershipsMemberus-gaap:VariableInterestEntityPrimaryBeneficiaryMember2020-01-012020-12-310001889539us-gaap:VariableInterestEntityNotPrimaryBeneficiaryMembercrbg:RealEstateAndInvestmentFundsMember2022-12-310001889539us-gaap:VariableInterestEntityNotPrimaryBeneficiaryMember2022-12-310001889539us-gaap:VariableInterestEntityNotPrimaryBeneficiaryMembercrbg:RealEstateAndInvestmentFundsMember2021-12-310001889539us-gaap:VariableInterestEntityNotPrimaryBeneficiaryMember2021-12-310001889539us-gaap:VariableInterestEntityNotPrimaryBeneficiaryMemberus-gaap:OtherInvestmentCompaniesMember2022-12-310001889539us-gaap:VariableInterestEntityNotPrimaryBeneficiaryMemberus-gaap:OtherInvestmentCompaniesMember2021-12-310001889539us-gaap:InterestRateContractMemberus-gaap:DesignatedAsHedgingInstrumentMember2022-12-310001889539us-gaap:InterestRateContractMemberus-gaap:DesignatedAsHedgingInstrumentMember2021-12-310001889539us-gaap:DesignatedAsHedgingInstrumentMemberus-gaap:ForeignExchangeContractMember2022-12-310001889539us-gaap:DesignatedAsHedgingInstrumentMemberus-gaap:ForeignExchangeContractMember2021-12-310001889539us-gaap:InterestRateContractMemberus-gaap:NondesignatedMember2022-12-310001889539us-gaap:InterestRateContractMemberus-gaap:NondesignatedMember2021-12-310001889539us-gaap:NondesignatedMemberus-gaap:ForeignExchangeContractMember2022-12-310001889539us-gaap:NondesignatedMemberus-gaap:ForeignExchangeContractMember2021-12-310001889539us-gaap:NondesignatedMemberus-gaap:EquityContractMember2022-12-310001889539us-gaap:NondesignatedMemberus-gaap:EquityContractMember2021-12-310001889539us-gaap:CreditRiskContractMemberus-gaap:NondesignatedMember2022-12-310001889539us-gaap:CreditRiskContractMemberus-gaap:NondesignatedMember2021-12-310001889539us-gaap:NondesignatedMemberus-gaap:OtherContractMember2022-12-310001889539us-gaap:NondesignatedMemberus-gaap:OtherContractMember2021-12-310001889539crbg:ThirdPartiesMember2022-12-310001889539crbg:ThirdPartiesMember2021-12-310001889539us-gaap:FixedMaturitiesMember2022-12-310001889539us-gaap:FixedMaturitiesMembersrt:CumulativeEffectPeriodOfAdoptionAdjustmentMember2022-12-310001889539us-gaap:FixedMaturitiesMember2021-12-310001889539us-gaap:FixedMaturitiesMembersrt:CumulativeEffectPeriodOfAdoptionAdjustmentMember2021-12-310001889539us-gaap:CommercialMortgageBackedSecuritiesMember2022-12-310001889539us-gaap:CommercialMortgageBackedSecuritiesMembersrt:CumulativeEffectPeriodOfAdoptionAdjustmentMember2022-12-310001889539us-gaap:CommercialMortgageBackedSecuritiesMember2021-12-310001889539us-gaap:CommercialMortgageBackedSecuritiesMembersrt:CumulativeEffectPeriodOfAdoptionAdjustmentMember2021-12-310001889539crbg:PolicyholderContractDepositsMember2022-12-310001889539crbg:PolicyholderContractDepositsMembersrt:CumulativeEffectPeriodOfAdoptionAdjustmentMember2022-12-310001889539crbg:PolicyholderContractDepositsMember2021-12-310001889539crbg:PolicyholderContractDepositsMembersrt:CumulativeEffectPeriodOfAdoptionAdjustmentMember2021-12-310001889539crbg:UnaffiliatedEntityMember2022-12-310001889539crbg:UnaffiliatedEntityMember2021-12-310001889539us-gaap:CurrencySwapMember2022-01-012022-12-310001889539us-gaap:CurrencySwapMember2021-01-012021-12-310001889539us-gaap:CurrencySwapMember2020-01-012020-12-310001889539us-gaap:InterestRateContractMemberus-gaap:DesignatedAsHedgingInstrumentMembercrbg:RealizedInvestmentGainsLossesMemberus-gaap:FairValueHedgingMember2022-01-012022-12-310001889539us-gaap:InterestRateContractMembercrbg:PolicyholderAccountBalanceInterestExpenseMemberus-gaap:DesignatedAsHedgingInstrumentMemberus-gaap:FairValueHedgingMember2022-01-012022-12-310001889539us-gaap:InterestRateContractMemberus-gaap:DesignatedAsHedgingInstrumentMemberus-gaap:InvestmentIncomeMemberus-gaap:FairValueHedgingMember2022-01-012022-12-310001889539us-gaap:DesignatedAsHedgingInstrumentMemberus-gaap:ForeignExchangeContractMemberus-gaap:FairValueHedgingMember2022-01-012022-12-310001889539us-gaap:InterestRateContractMemberus-gaap:DesignatedAsHedgingInstrumentMembercrbg:RealizedInvestmentGainsLossesMemberus-gaap:FairValueHedgingMember2021-01-012021-12-310001889539us-gaap:InterestRateContractMembercrbg:PolicyholderAccountBalanceInterestExpenseMemberus-gaap:DesignatedAsHedgingInstrumentMemberus-gaap:FairValueHedgingMember2021-01-012021-12-310001889539us-gaap:InterestRateContractMemberus-gaap:DesignatedAsHedgingInstrumentMemberus-gaap:InvestmentIncomeMemberus-gaap:FairValueHedgingMember2021-01-012021-12-310001889539us-gaap:DesignatedAsHedgingInstrumentMemberus-gaap:ForeignExchangeContractMemberus-gaap:FairValueHedgingMember2021-01-012021-12-310001889539us-gaap:InterestRateContractMemberus-gaap:DesignatedAsHedgingInstrumentMembercrbg:RealizedInvestmentGainsLossesMemberus-gaap:FairValueHedgingMember2020-01-012020-12-310001889539us-gaap:InterestRateContractMembercrbg:PolicyholderAccountBalanceInterestExpenseMemberus-gaap:DesignatedAsHedgingInstrumentMemberus-gaap:FairValueHedgingMember2020-01-012020-12-310001889539us-gaap:InterestRateContractMemberus-gaap:DesignatedAsHedgingInstrumentMemberus-gaap:InvestmentIncomeMemberus-gaap:FairValueHedgingMember2020-01-012020-12-310001889539us-gaap:DesignatedAsHedgingInstrumentMemberus-gaap:ForeignExchangeContractMemberus-gaap:FairValueHedgingMember2020-01-012020-12-310001889539us-gaap:InterestRateContractMemberus-gaap:NondesignatedMember2022-01-012022-12-310001889539us-gaap:InterestRateContractMemberus-gaap:NondesignatedMember2021-01-012021-12-310001889539us-gaap:InterestRateContractMemberus-gaap:NondesignatedMember2020-01-012020-12-310001889539us-gaap:NondesignatedMemberus-gaap:ForeignExchangeContractMember2022-01-012022-12-310001889539us-gaap:NondesignatedMemberus-gaap:ForeignExchangeContractMember2021-01-012021-12-310001889539us-gaap:NondesignatedMemberus-gaap:ForeignExchangeContractMember2020-01-012020-12-310001889539us-gaap:NondesignatedMemberus-gaap:EquityContractMember2022-01-012022-12-310001889539us-gaap:NondesignatedMemberus-gaap:EquityContractMember2021-01-012021-12-310001889539us-gaap:NondesignatedMemberus-gaap:EquityContractMember2020-01-012020-12-310001889539us-gaap:CreditRiskContractMemberus-gaap:NondesignatedMember2022-01-012022-12-310001889539us-gaap:CreditRiskContractMemberus-gaap:NondesignatedMember2021-01-012021-12-310001889539us-gaap:CreditRiskContractMemberus-gaap:NondesignatedMember2020-01-012020-12-310001889539us-gaap:NondesignatedMemberus-gaap:OtherContractMember2022-01-012022-12-310001889539us-gaap:NondesignatedMemberus-gaap:OtherContractMember2021-01-012021-12-310001889539us-gaap:NondesignatedMemberus-gaap:OtherContractMember2020-01-012020-12-310001889539us-gaap:EmbeddedDerivativeFinancialInstrumentsMemberus-gaap:NondesignatedMember2022-01-012022-12-310001889539us-gaap:EmbeddedDerivativeFinancialInstrumentsMemberus-gaap:NondesignatedMember2021-01-012021-12-310001889539us-gaap:EmbeddedDerivativeFinancialInstrumentsMemberus-gaap:NondesignatedMember2020-01-012020-12-310001889539us-gaap:EmbeddedDerivativeFinancialInstrumentsMemberus-gaap:NondesignatedMembercrbg:ExcludingFortitudeReFundsWithheldEmbeddedDerivativeMembercrbg:FortitudeReMember2022-01-012022-12-310001889539us-gaap:EmbeddedDerivativeFinancialInstrumentsMemberus-gaap:NondesignatedMembercrbg:ExcludingFortitudeReFundsWithheldEmbeddedDerivativeMembercrbg:FortitudeReMember2021-01-012021-12-310001889539us-gaap:EmbeddedDerivativeFinancialInstrumentsMemberus-gaap:NondesignatedMembercrbg:ExcludingFortitudeReFundsWithheldEmbeddedDerivativeMembercrbg:FortitudeReMember2020-01-012020-12-310001889539us-gaap:NondesignatedMember2022-01-012022-12-310001889539us-gaap:NondesignatedMember2021-01-012021-12-310001889539us-gaap:NondesignatedMember2020-01-012020-12-310001889539us-gaap:NondesignatedMembercrbg:InsuranceCommissionsAndFeesMember2022-01-012022-12-310001889539us-gaap:NondesignatedMembercrbg:InsuranceCommissionsAndFeesMember2021-01-012021-12-310001889539us-gaap:NondesignatedMembercrbg:InsuranceCommissionsAndFeesMember2020-01-012020-12-310001889539us-gaap:NondesignatedMemberus-gaap:InvestmentIncomeMember2022-01-012022-12-310001889539us-gaap:NondesignatedMemberus-gaap:InvestmentIncomeMember2021-01-012021-12-310001889539us-gaap:NondesignatedMemberus-gaap:InvestmentIncomeMember2020-01-012020-12-310001889539us-gaap:NondesignatedMembercrbg:InvestmentsExcludingModifiedCoinsuranceAndFundsWithheldAssetsMember2022-01-012022-12-310001889539us-gaap:NondesignatedMembercrbg:InvestmentsExcludingModifiedCoinsuranceAndFundsWithheldAssetsMember2021-01-012021-12-310001889539us-gaap:NondesignatedMembercrbg:InvestmentsExcludingModifiedCoinsuranceAndFundsWithheldAssetsMember2020-01-012020-12-310001889539crbg:ExcludingFortitudeReFundsWithheldEmbeddedDerivativeMember2022-01-012022-12-310001889539crbg:ExcludingFortitudeReFundsWithheldEmbeddedDerivativeMember2021-01-012021-12-310001889539crbg:ExcludingFortitudeReFundsWithheldEmbeddedDerivativeMember2020-01-012020-12-310001889539us-gaap:NondesignatedMembercrbg:PolicyholderBenefitsAndClaimsIncurredNetMember2022-01-012022-12-310001889539us-gaap:NondesignatedMembercrbg:PolicyholderBenefitsAndClaimsIncurredNetMember2021-01-012021-12-310001889539us-gaap:NondesignatedMembercrbg:PolicyholderBenefitsAndClaimsIncurredNetMember2020-01-012020-12-310001889539crbg:MarketRiskBenefitChangeInFairValueGainLossMemberus-gaap:NondesignatedMember2022-01-012022-12-310001889539crbg:MarketRiskBenefitChangeInFairValueGainLossMemberus-gaap:NondesignatedMember2021-01-012021-12-310001889539crbg:MarketRiskBenefitChangeInFairValueGainLossMemberus-gaap:NondesignatedMember2020-01-012020-12-310001889539us-gaap:NondesignatedMembercrbg:AIGMember2022-01-012022-12-310001889539us-gaap:NondesignatedMembercrbg:AIGMember2021-01-012021-12-310001889539us-gaap:NondesignatedMembercrbg:AIGMember2020-01-012020-12-310001889539crbg:LifeInsuranceSegment1Member2019-12-310001889539us-gaap:CorporateAndOtherMember2019-12-310001889539crbg:LifeInsuranceSegment1Member2020-01-012020-12-310001889539us-gaap:CorporateAndOtherMember2020-01-012020-12-310001889539crbg:LifeInsuranceSegment1Member2020-12-310001889539us-gaap:CorporateAndOtherMember2020-12-310001889539crbg:LifeInsuranceSegment1Member2021-01-012021-12-310001889539us-gaap:CorporateAndOtherMember2021-01-012021-12-310001889539crbg:LifeInsuranceSegment1Member2021-12-310001889539us-gaap:CorporateAndOtherMember2021-12-310001889539crbg:LifeInsuranceSegment1Member2022-01-012022-12-310001889539us-gaap:CorporateAndOtherMember2022-01-012022-12-310001889539crbg:LifeInsuranceSegment1Member2022-12-310001889539us-gaap:CorporateAndOtherMember2022-12-310001889539srt:ScenarioPreviouslyReportedMembercrbg:GroupRetirementSegmentMember2020-12-310001889539us-gaap:CorporateAndOtherMembersrt:ScenarioPreviouslyReportedMember2020-12-310001889539crbg:IndividualRetirementSegmentMembercrbg:EffectOfApplicationOfAccountingStandardsUpdate201812EffectOfChangeInDeferredProfitLiabilityMember2020-12-310001889539crbg:EffectOfApplicationOfAccountingStandardsUpdate201812EffectOfChangeInDeferredProfitLiabilityMembercrbg:GroupRetirementSegmentMember2020-12-310001889539crbg:LifeInsuranceOperatingSegmentMembercrbg:EffectOfApplicationOfAccountingStandardsUpdate201812EffectOfChangeInDeferredProfitLiabilityMember2020-12-310001889539crbg:InstitutionalMarketsMembercrbg:EffectOfApplicationOfAccountingStandardsUpdate201812EffectOfChangeInDeferredProfitLiabilityMember2020-12-310001889539us-gaap:CorporateAndOtherMembercrbg:EffectOfApplicationOfAccountingStandardsUpdate201812EffectOfChangeInDeferredProfitLiabilityMember2020-12-310001889539crbg:EffectOfApplicationOfAccountingStandardsUpdate201812EffectOfChangeInDeferredProfitLiabilityMember2020-12-310001889539crbg:IndividualRetirementSegmentMembercrbg:EffectOfApplicationOfAccountingStandardsUpdate201812AdjustmentsForLossContractsUnderModifiedRetrospectiveApproachMember2020-12-310001889539crbg:EffectOfApplicationOfAccountingStandardsUpdate201812AdjustmentsForLossContractsUnderModifiedRetrospectiveApproachMembercrbg:GroupRetirementSegmentMember2020-12-310001889539crbg:LifeInsuranceOperatingSegmentMembercrbg:EffectOfApplicationOfAccountingStandardsUpdate201812AdjustmentsForLossContractsUnderModifiedRetrospectiveApproachMember2020-12-310001889539crbg:EffectOfApplicationOfAccountingStandardsUpdate201812AdjustmentsForLossContractsUnderModifiedRetrospectiveApproachMembercrbg:InstitutionalMarketsMember2020-12-310001889539us-gaap:CorporateAndOtherMembercrbg:EffectOfApplicationOfAccountingStandardsUpdate201812AdjustmentsForLossContractsUnderModifiedRetrospectiveApproachMember2020-12-310001889539crbg:EffectOfApplicationOfAccountingStandardsUpdate201812AdjustmentsForLossContractsUnderModifiedRetrospectiveApproachMember2020-12-310001889539crbg:EffectOfApplicationOfAccountingStandardsUpdate201812EffectOfRemeasurementOfLiabilityAtCurrentSingleARateMembercrbg:IndividualRetirementSegmentMember2020-12-310001889539crbg:EffectOfApplicationOfAccountingStandardsUpdate201812EffectOfRemeasurementOfLiabilityAtCurrentSingleARateMembercrbg:GroupRetirementSegmentMember2020-12-310001889539crbg:EffectOfApplicationOfAccountingStandardsUpdate201812EffectOfRemeasurementOfLiabilityAtCurrentSingleARateMembercrbg:LifeInsuranceOperatingSegmentMember2020-12-310001889539crbg:EffectOfApplicationOfAccountingStandardsUpdate201812EffectOfRemeasurementOfLiabilityAtCurrentSingleARateMembercrbg:InstitutionalMarketsMember2020-12-310001889539crbg:EffectOfApplicationOfAccountingStandardsUpdate201812EffectOfRemeasurementOfLiabilityAtCurrentSingleARateMemberus-gaap:CorporateAndOtherMember2020-12-310001889539crbg:EffectOfApplicationOfAccountingStandardsUpdate201812EffectOfRemeasurementOfLiabilityAtCurrentSingleARateMember2020-12-310001889539crbg:IndividualRetirementSegmentMembercrbg:EffectOfApplicationOfAccountingStandardsUpdate201812EffectOfAdjustmentsToTheRemovalOfLossRecognitionBalancesRelatedToSecuritiesMember2020-12-310001889539crbg:GroupRetirementSegmentMembercrbg:EffectOfApplicationOfAccountingStandardsUpdate201812EffectOfAdjustmentsToTheRemovalOfLossRecognitionBalancesRelatedToSecuritiesMember2020-12-310001889539crbg:LifeInsuranceOperatingSegmentMembercrbg:EffectOfApplicationOfAccountingStandardsUpdate201812EffectOfAdjustmentsToTheRemovalOfLossRecognitionBalancesRelatedToSecuritiesMember2020-12-310001889539crbg:InstitutionalMarketsMembercrbg:EffectOfApplicationOfAccountingStandardsUpdate201812EffectOfAdjustmentsToTheRemovalOfLossRecognitionBalancesRelatedToSecuritiesMember2020-12-310001889539us-gaap:CorporateAndOtherMembercrbg:EffectOfApplicationOfAccountingStandardsUpdate201812EffectOfAdjustmentsToTheRemovalOfLossRecognitionBalancesRelatedToSecuritiesMember2020-12-310001889539crbg:EffectOfApplicationOfAccountingStandardsUpdate201812EffectOfAdjustmentsToTheRemovalOfLossRecognitionBalancesRelatedToSecuritiesMember2020-12-310001889539crbg:IndividualRetirementSegmentMember2020-12-310001889539crbg:GroupRetirementSegmentMember2020-12-310001889539crbg:IndividualRetirementSegmentMember2021-12-310001889539crbg:GroupRetirementSegmentMember2021-12-310001889539crbg:LifeInsuranceOperatingSegmentMember2021-12-310001889539crbg:InstitutionalMarketsMember2021-12-310001889539crbg:IndividualRetirementSegmentMember2022-01-012022-12-310001889539crbg:GroupRetirementSegmentMember2022-01-012022-12-310001889539crbg:LifeInsuranceOperatingSegmentMember2022-01-012022-12-310001889539crbg:InstitutionalMarketsMember2022-01-012022-12-310001889539crbg:IndividualRetirementSegmentMember2022-12-310001889539crbg:GroupRetirementSegmentMember2022-12-310001889539crbg:LifeInsuranceOperatingSegmentMember2022-12-310001889539crbg:InstitutionalMarketsMember2022-12-310001889539crbg:IndividualRetirementSegmentMember2021-01-012021-12-310001889539crbg:GroupRetirementSegmentMember2021-01-012021-12-310001889539crbg:LifeInsuranceOperatingSegmentMember2021-01-012021-12-310001889539crbg:InstitutionalMarketsMember2021-01-012021-12-310001889539us-gaap:TermLifeInsuranceMember2022-01-012022-12-310001889539us-gaap:TermLifeInsuranceMember2021-01-012021-12-310001889539crbg:InstitutionalMarketsSegmentMember2022-12-310001889539crbg:InstitutionalMarketsSegmentMember2021-12-310001889539crbg:InstitutionalMarketsSegmentMember2022-01-012022-12-310001889539crbg:InstitutionalMarketsSegmentMember2021-01-012021-12-310001889539crbg:IndividualRetirementSegmentMembersrt:ScenarioPreviouslyReportedMembercrbg:LongDurationInsuranceContractsMember2020-12-310001889539srt:ScenarioPreviouslyReportedMembercrbg:GroupRetirementSegmentMembercrbg:LongDurationInsuranceContractsMember2020-12-310001889539crbg:LifeInsuranceOperatingSegmentMembersrt:ScenarioPreviouslyReportedMembercrbg:LongDurationInsuranceContractsMember2020-12-310001889539crbg:InstitutionalMarketsMembersrt:ScenarioPreviouslyReportedMembercrbg:LongDurationInsuranceContractsMember2020-12-310001889539us-gaap:CorporateAndOtherMembersrt:ScenarioPreviouslyReportedMembercrbg:LongDurationInsuranceContractsMember2020-12-310001889539srt:ScenarioPreviouslyReportedMembercrbg:LongDurationInsuranceContractsMember2020-12-310001889539crbg:IndividualRetirementSegmentMembercrbg:LongDurationInsuranceContractsMember2020-12-310001889539crbg:GroupRetirementSegmentMembercrbg:LongDurationInsuranceContractsMember2020-12-310001889539crbg:LifeInsuranceOperatingSegmentMembercrbg:LongDurationInsuranceContractsMember2020-12-310001889539crbg:InstitutionalMarketsMembercrbg:LongDurationInsuranceContractsMember2020-12-310001889539us-gaap:CorporateAndOtherMembercrbg:LongDurationInsuranceContractsMember2020-12-310001889539crbg:LongDurationInsuranceContractsMember2020-12-310001889539crbg:IndividualRetirementSegmentMembersrt:ScenarioPreviouslyReportedMemberus-gaap:UniversalLifeMember2020-12-310001889539srt:ScenarioPreviouslyReportedMembercrbg:GroupRetirementSegmentMemberus-gaap:UniversalLifeMember2020-12-310001889539crbg:LifeInsuranceOperatingSegmentMembersrt:ScenarioPreviouslyReportedMemberus-gaap:UniversalLifeMember2020-12-310001889539us-gaap:CorporateAndOtherMembersrt:ScenarioPreviouslyReportedMemberus-gaap:UniversalLifeMember2020-12-310001889539srt:ScenarioPreviouslyReportedMemberus-gaap:UniversalLifeMember2020-12-310001889539crbg:IndividualRetirementSegmentMembercrbg:EffectOfApplicationOfAccountingStandardsUpdate201812AdjustmentsToMarketRiskBenefitsMemberus-gaap:UniversalLifeMember2020-12-310001889539crbg:EffectOfApplicationOfAccountingStandardsUpdate201812AdjustmentsToMarketRiskBenefitsMembercrbg:GroupRetirementSegmentMemberus-gaap:UniversalLifeMember2020-12-310001889539crbg:LifeInsuranceOperatingSegmentMembercrbg:EffectOfApplicationOfAccountingStandardsUpdate201812AdjustmentsToMarketRiskBenefitsMemberus-gaap:UniversalLifeMember2020-12-310001889539us-gaap:CorporateAndOtherMembercrbg:EffectOfApplicationOfAccountingStandardsUpdate201812AdjustmentsToMarketRiskBenefitsMemberus-gaap:UniversalLifeMember2020-12-310001889539crbg:EffectOfApplicationOfAccountingStandardsUpdate201812AdjustmentsToMarketRiskBenefitsMemberus-gaap:UniversalLifeMember2020-12-310001889539crbg:IndividualRetirementSegmentMemberus-gaap:UniversalLifeMembercrbg:EffectOfApplicationOfAccountingStandardsUpdate201812AdjustmentsToReclassURGLImpactsToMarketRiskBenefitsMember2020-12-310001889539crbg:GroupRetirementSegmentMemberus-gaap:UniversalLifeMembercrbg:EffectOfApplicationOfAccountingStandardsUpdate201812AdjustmentsToReclassURGLImpactsToMarketRiskBenefitsMember2020-12-310001889539crbg:LifeInsuranceOperatingSegmentMemberus-gaap:UniversalLifeMembercrbg:EffectOfApplicationOfAccountingStandardsUpdate201812AdjustmentsToReclassURGLImpactsToMarketRiskBenefitsMember2020-12-310001889539us-gaap:CorporateAndOtherMemberus-gaap:UniversalLifeMembercrbg:EffectOfApplicationOfAccountingStandardsUpdate201812AdjustmentsToReclassURGLImpactsToMarketRiskBenefitsMember2020-12-310001889539us-gaap:UniversalLifeMembercrbg:EffectOfApplicationOfAccountingStandardsUpdate201812AdjustmentsToReclassURGLImpactsToMarketRiskBenefitsMember2020-12-310001889539crbg:IndividualRetirementSegmentMemberus-gaap:UniversalLifeMember2020-12-310001889539us-gaap:UniversalLifeMembercrbg:GroupRetirementSegmentMember2020-12-310001889539crbg:LifeInsuranceOperatingSegmentMemberus-gaap:UniversalLifeMember2020-12-310001889539us-gaap:CorporateAndOtherMemberus-gaap:UniversalLifeMember2020-12-310001889539us-gaap:UniversalLifeMember2020-12-310001889539crbg:LifeInsuranceOperatingSegmentMemberus-gaap:UniversalLifeMember2021-12-310001889539us-gaap:CorporateAndOtherMemberus-gaap:UniversalLifeMember2021-12-310001889539us-gaap:UniversalLifeMember2021-12-310001889539crbg:LifeInsuranceOperatingSegmentMemberus-gaap:UniversalLifeMember2022-01-012022-12-310001889539us-gaap:CorporateAndOtherMemberus-gaap:UniversalLifeMember2022-01-012022-12-310001889539us-gaap:UniversalLifeMember2022-01-012022-12-310001889539crbg:LifeInsuranceOperatingSegmentMemberus-gaap:UniversalLifeMember2021-01-012021-12-310001889539us-gaap:CorporateAndOtherMemberus-gaap:UniversalLifeMember2021-01-012021-12-310001889539us-gaap:UniversalLifeMember2021-01-012021-12-310001889539crbg:LifeInsuranceOperatingSegmentMemberus-gaap:UniversalLifeMember2022-12-310001889539us-gaap:CorporateAndOtherMemberus-gaap:UniversalLifeMember2022-12-310001889539us-gaap:UniversalLifeMember2022-12-310001889539srt:MinimumMember2022-12-310001889539srt:MaximumMember2022-12-310001889539srt:ScenarioPreviouslyReportedMembercrbg:InstitutionalMarketsSegmentMember2020-12-310001889539crbg:IndividualRetirementSegmentMembercrbg:EffectOfApplicationOfAccountingStandardsUpdate201812AdjustmentsToReclassificationOfEmbeddedDerivativeLiabilityMember2020-12-310001889539crbg:EffectOfApplicationOfAccountingStandardsUpdate201812AdjustmentsToReclassificationOfEmbeddedDerivativeLiabilityMembercrbg:GroupRetirementSegmentMember2020-12-310001889539crbg:LifeInsuranceOperatingSegmentMembercrbg:EffectOfApplicationOfAccountingStandardsUpdate201812AdjustmentsToReclassificationOfEmbeddedDerivativeLiabilityMember2020-12-310001889539crbg:EffectOfApplicationOfAccountingStandardsUpdate201812AdjustmentsToReclassificationOfEmbeddedDerivativeLiabilityMembercrbg:InstitutionalMarketsSegmentMember2020-12-310001889539us-gaap:CorporateAndOtherMembercrbg:EffectOfApplicationOfAccountingStandardsUpdate201812AdjustmentsToReclassificationOfEmbeddedDerivativeLiabilityMember2020-12-310001889539crbg:EffectOfApplicationOfAccountingStandardsUpdate201812AdjustmentsToReclassificationOfEmbeddedDerivativeLiabilityMember2020-12-310001889539crbg:InstitutionalMarketsSegmentMember2020-12-310001889539crbg:IndividualRetirementSegmentMembercrbg:PolicyholderAccountBalanceGuaranteedMinimumCreditingRateRangeLessThan0100Memberus-gaap:PolicyholderAccountBalanceAtGuaranteedMinimumCreditingRateMember2022-12-310001889539crbg:IndividualRetirementSegmentMembercrbg:PolicyholderAccountBalanceGuaranteedMinimumCreditingRateRangeLessThan0100Memberus-gaap:PolicyholderAccountBalanceAboveGuaranteedMinimumCreditingRateRangeFrom0001To0050Member2022-12-310001889539crbg:IndividualRetirementSegmentMembercrbg:PolicyholderAccountBalanceAboveGuaranteedMinimumCreditingRateRangeFrom0050AndGreaterMembercrbg:PolicyholderAccountBalanceGuaranteedMinimumCreditingRateRangeLessThan0100Member2022-12-310001889539crbg:IndividualRetirementSegmentMembercrbg:PolicyholderAccountBalanceGuaranteedMinimumCreditingRateRangeLessThan0100Member2022-12-310001889539crbg:PolicyholderAccountBalanceGuaranteedMinimumCreditingRateRangeFrom0100To0200Membercrbg:IndividualRetirementSegmentMemberus-gaap:PolicyholderAccountBalanceAtGuaranteedMinimumCreditingRateMember2022-12-310001889539crbg:PolicyholderAccountBalanceGuaranteedMinimumCreditingRateRangeFrom0100To0200Membercrbg:IndividualRetirementSegmentMemberus-gaap:PolicyholderAccountBalanceAboveGuaranteedMinimumCreditingRateRangeFrom0001To0050Member2022-12-310001889539crbg:PolicyholderAccountBalanceGuaranteedMinimumCreditingRateRangeFrom0100To0200Membercrbg:IndividualRetirementSegmentMembercrbg:PolicyholderAccountBalanceAboveGuaranteedMinimumCreditingRateRangeFrom0050AndGreaterMember2022-12-310001889539crbg:PolicyholderAccountBalanceGuaranteedMinimumCreditingRateRangeFrom0100To0200Membercrbg:IndividualRetirementSegmentMember2022-12-310001889539crbg:IndividualRetirementSegmentMemberus-gaap:PolicyholderAccountBalanceAtGuaranteedMinimumCreditingRateMembercrbg:PolicyholderAccountBalanceGuaranteedMinimumCreditingRateRangeFrom0200To0300Member2022-12-310001889539crbg:IndividualRetirementSegmentMembercrbg:PolicyholderAccountBalanceGuaranteedMinimumCreditingRateRangeFrom0200To0300Memberus-gaap:PolicyholderAccountBalanceAboveGuaranteedMinimumCreditingRateRangeFrom0001To0050Member2022-12-310001889539crbg:IndividualRetirementSegmentMembercrbg:PolicyholderAccountBalanceAboveGuaranteedMinimumCreditingRateRangeFrom0050AndGreaterMembercrbg:PolicyholderAccountBalanceGuaranteedMinimumCreditingRateRangeFrom0200To0300Member2022-12-310001889539crbg:IndividualRetirementSegmentMembercrbg:PolicyholderAccountBalanceGuaranteedMinimumCreditingRateRangeFrom0200To0300Member2022-12-310001889539crbg:IndividualRetirementSegmentMemberus-gaap:PolicyholderAccountBalanceAtGuaranteedMinimumCreditingRateMembercrbg:PolicyholderAccountBalanceGuaranteedMinimumCreditingRateRangeFrom0300To0400Member2022-12-310001889539crbg:IndividualRetirementSegmentMemberus-gaap:PolicyholderAccountBalanceAboveGuaranteedMinimumCreditingRateRangeFrom0001To0050Membercrbg:PolicyholderAccountBalanceGuaranteedMinimumCreditingRateRangeFrom0300To0400Member2022-12-310001889539crbg:IndividualRetirementSegmentMembercrbg:PolicyholderAccountBalanceAboveGuaranteedMinimumCreditingRateRangeFrom0050AndGreaterMembercrbg:PolicyholderAccountBalanceGuaranteedMinimumCreditingRateRangeFrom0300To0400Member2022-12-310001889539crbg:IndividualRetirementSegmentMembercrbg:PolicyholderAccountBalanceGuaranteedMinimumCreditingRateRangeFrom0300To0400Member2022-12-310001889539crbg:PolicyholderAccountBalanceGuaranteedMinimumCreditingRateRangeFrom0400To0500Membercrbg:IndividualRetirementSegmentMemberus-gaap:PolicyholderAccountBalanceAtGuaranteedMinimumCreditingRateMember2022-12-310001889539crbg:PolicyholderAccountBalanceGuaranteedMinimumCreditingRateRangeFrom0400To0500Membercrbg:IndividualRetirementSegmentMemberus-gaap:PolicyholderAccountBalanceAboveGuaranteedMinimumCreditingRateRangeFrom0001To0050Member2022-12-310001889539crbg:PolicyholderAccountBalanceGuaranteedMinimumCreditingRateRangeFrom0400To0500Membercrbg:IndividualRetirementSegmentMembercrbg:PolicyholderAccountBalanceAboveGuaranteedMinimumCreditingRateRangeFrom0050AndGreaterMember2022-12-310001889539crbg:PolicyholderAccountBalanceGuaranteedMinimumCreditingRateRangeFrom0400To0500Membercrbg:IndividualRetirementSegmentMember2022-12-310001889539crbg:PolicyholderAccountBalanceGuaranteedMinimumCreditingRateRangeFrom0500To0550Membercrbg:IndividualRetirementSegmentMemberus-gaap:PolicyholderAccountBalanceAtGuaranteedMinimumCreditingRateMember2022-12-310001889539crbg:PolicyholderAccountBalanceGuaranteedMinimumCreditingRateRangeFrom0500To0550Membercrbg:IndividualRetirementSegmentMemberus-gaap:PolicyholderAccountBalanceAboveGuaranteedMinimumCreditingRateRangeFrom0001To0050Member2022-12-310001889539crbg:PolicyholderAccountBalanceGuaranteedMinimumCreditingRateRangeFrom0500To0550Membercrbg:IndividualRetirementSegmentMembercrbg:PolicyholderAccountBalanceAboveGuaranteedMinimumCreditingRateRangeFrom0050AndGreaterMember2022-12-310001889539crbg:PolicyholderAccountBalanceGuaranteedMinimumCreditingRateRangeFrom0500To0550Membercrbg:IndividualRetirementSegmentMember2022-12-310001889539crbg:IndividualRetirementSegmentMemberus-gaap:PolicyholderAccountBalanceAtGuaranteedMinimumCreditingRateMember2022-12-310001889539crbg:IndividualRetirementSegmentMemberus-gaap:PolicyholderAccountBalanceAboveGuaranteedMinimumCreditingRateRangeFrom0001To0050Member2022-12-310001889539crbg:IndividualRetirementSegmentMembercrbg:PolicyholderAccountBalanceAboveGuaranteedMinimumCreditingRateRangeFrom0050AndGreaterMember2022-12-310001889539crbg:PolicyholderAccountBalanceGuaranteedMinimumCreditingRateRangeLessThan0100Memberus-gaap:PolicyholderAccountBalanceAtGuaranteedMinimumCreditingRateMembercrbg:GroupRetirementSegmentMember2022-12-310001889539crbg:PolicyholderAccountBalanceGuaranteedMinimumCreditingRateRangeLessThan0100Memberus-gaap:PolicyholderAccountBalanceAboveGuaranteedMinimumCreditingRateRangeFrom0001To0050Membercrbg:GroupRetirementSegmentMember2022-12-310001889539crbg:PolicyholderAccountBalanceAboveGuaranteedMinimumCreditingRateRangeFrom0050AndGreaterMembercrbg:PolicyholderAccountBalanceGuaranteedMinimumCreditingRateRangeLessThan0100Membercrbg:GroupRetirementSegmentMember2022-12-310001889539crbg:PolicyholderAccountBalanceGuaranteedMinimumCreditingRateRangeLessThan0100Membercrbg:GroupRetirementSegmentMember2022-12-310001889539crbg:PolicyholderAccountBalanceGuaranteedMinimumCreditingRateRangeFrom0100To0200Memberus-gaap:PolicyholderAccountBalanceAtGuaranteedMinimumCreditingRateMembercrbg:GroupRetirementSegmentMember2022-12-310001889539crbg:PolicyholderAccountBalanceGuaranteedMinimumCreditingRateRangeFrom0100To0200Memberus-gaap:PolicyholderAccountBalanceAboveGuaranteedMinimumCreditingRateRangeFrom0001To0050Membercrbg:GroupRetirementSegmentMember2022-12-310001889539crbg:PolicyholderAccountBalanceGuaranteedMinimumCreditingRateRangeFrom0100To0200Membercrbg:PolicyholderAccountBalanceAboveGuaranteedMinimumCreditingRateRangeFrom0050AndGreaterMembercrbg:GroupRetirementSegmentMember2022-12-310001889539crbg:PolicyholderAccountBalanceGuaranteedMinimumCreditingRateRangeFrom0100To0200Membercrbg:GroupRetirementSegmentMember2022-12-310001889539us-gaap:PolicyholderAccountBalanceAtGuaranteedMinimumCreditingRateMembercrbg:PolicyholderAccountBalanceGuaranteedMinimumCreditingRateRangeFrom0200To0300Membercrbg:GroupRetirementSegmentMember2022-12-310001889539crbg:PolicyholderAccountBalanceGuaranteedMinimumCreditingRateRangeFrom0200To0300Memberus-gaap:PolicyholderAccountBalanceAboveGuaranteedMinimumCreditingRateRangeFrom0001To0050Membercrbg:GroupRetirementSegmentMember2022-12-310001889539crbg:PolicyholderAccountBalanceAboveGuaranteedMinimumCreditingRateRangeFrom0050AndGreaterMembercrbg:PolicyholderAccountBalanceGuaranteedMinimumCreditingRateRangeFrom0200To0300Membercrbg:GroupRetirementSegmentMember2022-12-310001889539crbg:PolicyholderAccountBalanceGuaranteedMinimumCreditingRateRangeFrom0200To0300Membercrbg:GroupRetirementSegmentMember2022-12-310001889539us-gaap:PolicyholderAccountBalanceAtGuaranteedMinimumCreditingRateMembercrbg:GroupRetirementSegmentMembercrbg:PolicyholderAccountBalanceGuaranteedMinimumCreditingRateRangeFrom0300To0400Member2022-12-310001889539us-gaap:PolicyholderAccountBalanceAboveGuaranteedMinimumCreditingRateRangeFrom0001To0050Membercrbg:GroupRetirementSegmentMembercrbg:PolicyholderAccountBalanceGuaranteedMinimumCreditingRateRangeFrom0300To0400Member2022-12-310001889539crbg:PolicyholderAccountBalanceAboveGuaranteedMinimumCreditingRateRangeFrom0050AndGreaterMembercrbg:GroupRetirementSegmentMembercrbg:PolicyholderAccountBalanceGuaranteedMinimumCreditingRateRangeFrom0300To0400Member2022-12-310001889539crbg:GroupRetirementSegmentMembercrbg:PolicyholderAccountBalanceGuaranteedMinimumCreditingRateRangeFrom0300To0400Member2022-12-310001889539crbg:PolicyholderAccountBalanceGuaranteedMinimumCreditingRateRangeFrom0400To0500Memberus-gaap:PolicyholderAccountBalanceAtGuaranteedMinimumCreditingRateMembercrbg:GroupRetirementSegmentMember2022-12-310001889539crbg:PolicyholderAccountBalanceGuaranteedMinimumCreditingRateRangeFrom0400To0500Memberus-gaap:PolicyholderAccountBalanceAboveGuaranteedMinimumCreditingRateRangeFrom0001To0050Membercrbg:GroupRetirementSegmentMember2022-12-310001889539crbg:PolicyholderAccountBalanceGuaranteedMinimumCreditingRateRangeFrom0400To0500Membercrbg:PolicyholderAccountBalanceAboveGuaranteedMinimumCreditingRateRangeFrom0050AndGreaterMembercrbg:GroupRetirementSegmentMember2022-12-310001889539crbg:PolicyholderAccountBalanceGuaranteedMinimumCreditingRateRangeFrom0400To0500Membercrbg:GroupRetirementSegmentMember2022-12-310001889539crbg:PolicyholderAccountBalanceGuaranteedMinimumCreditingRateRangeFrom0500To0550Memberus-gaap:PolicyholderAccountBalanceAtGuaranteedMinimumCreditingRateMembercrbg:GroupRetirementSegmentMember2022-12-310001889539crbg:PolicyholderAccountBalanceGuaranteedMinimumCreditingRateRangeFrom0500To0550Memberus-gaap:PolicyholderAccountBalanceAboveGuaranteedMinimumCreditingRateRangeFrom0001To0050Membercrbg:GroupRetirementSegmentMember2022-12-310001889539crbg:PolicyholderAccountBalanceGuaranteedMinimumCreditingRateRangeFrom0500To0550Membercrbg:PolicyholderAccountBalanceAboveGuaranteedMinimumCreditingRateRangeFrom0050AndGreaterMembercrbg:GroupRetirementSegmentMember2022-12-310001889539crbg:PolicyholderAccountBalanceGuaranteedMinimumCreditingRateRangeFrom0500To0550Membercrbg:GroupRetirementSegmentMember2022-12-310001889539us-gaap:PolicyholderAccountBalanceAtGuaranteedMinimumCreditingRateMembercrbg:GroupRetirementSegmentMember2022-12-310001889539us-gaap:PolicyholderAccountBalanceAboveGuaranteedMinimumCreditingRateRangeFrom0001To0050Membercrbg:GroupRetirementSegmentMember2022-12-310001889539crbg:PolicyholderAccountBalanceAboveGuaranteedMinimumCreditingRateRangeFrom0050AndGreaterMembercrbg:GroupRetirementSegmentMember2022-12-310001889539crbg:LifeInsuranceOperatingSegmentMembercrbg:PolicyholderAccountBalanceGuaranteedMinimumCreditingRateRangeLessThan0100Memberus-gaap:PolicyholderAccountBalanceAtGuaranteedMinimumCreditingRateMember2022-12-310001889539crbg:LifeInsuranceOperatingSegmentMembercrbg:PolicyholderAccountBalanceGuaranteedMinimumCreditingRateRangeLessThan0100Memberus-gaap:PolicyholderAccountBalanceAboveGuaranteedMinimumCreditingRateRangeFrom0001To0050Member2022-12-310001889539crbg:LifeInsuranceOperatingSegmentMembercrbg:PolicyholderAccountBalanceAboveGuaranteedMinimumCreditingRateRangeFrom0050AndGreaterMembercrbg:PolicyholderAccountBalanceGuaranteedMinimumCreditingRateRangeLessThan0100Member2022-12-310001889539crbg:LifeInsuranceOperatingSegmentMembercrbg:PolicyholderAccountBalanceGuaranteedMinimumCreditingRateRangeLessThan0100Member2022-12-310001889539crbg:LifeInsuranceOperatingSegmentMembercrbg:PolicyholderAccountBalanceGuaranteedMinimumCreditingRateRangeFrom0100To0200Memberus-gaap:PolicyholderAccountBalanceAtGuaranteedMinimumCreditingRateMember2022-12-310001889539crbg:LifeInsuranceOperatingSegmentMembercrbg:PolicyholderAccountBalanceGuaranteedMinimumCreditingRateRangeFrom0100To0200Memberus-gaap:PolicyholderAccountBalanceAboveGuaranteedMinimumCreditingRateRangeFrom0001To0050Member2022-12-310001889539crbg:LifeInsuranceOperatingSegmentMembercrbg:PolicyholderAccountBalanceGuaranteedMinimumCreditingRateRangeFrom0100To0200Membercrbg:PolicyholderAccountBalanceAboveGuaranteedMinimumCreditingRateRangeFrom0050AndGreaterMember2022-12-310001889539crbg:LifeInsuranceOperatingSegmentMembercrbg:PolicyholderAccountBalanceGuaranteedMinimumCreditingRateRangeFrom0100To0200Member2022-12-310001889539crbg:LifeInsuranceOperatingSegmentMemberus-gaap:PolicyholderAccountBalanceAtGuaranteedMinimumCreditingRateMembercrbg:PolicyholderAccountBalanceGuaranteedMinimumCreditingRateRangeFrom0200To0300Member2022-12-310001889539crbg:LifeInsuranceOperatingSegmentMembercrbg:PolicyholderAccountBalanceGuaranteedMinimumCreditingRateRangeFrom0200To0300Memberus-gaap:PolicyholderAccountBalanceAboveGuaranteedMinimumCreditingRateRangeFrom0001To0050Member2022-12-310001889539crbg:LifeInsuranceOperatingSegmentMembercrbg:PolicyholderAccountBalanceAboveGuaranteedMinimumCreditingRateRangeFrom0050AndGreaterMembercrbg:PolicyholderAccountBalanceGuaranteedMinimumCreditingRateRangeFrom0200To0300Member2022-12-310001889539crbg:LifeInsuranceOperatingSegmentMembercrbg:PolicyholderAccountBalanceGuaranteedMinimumCreditingRateRangeFrom0200To0300Member2022-12-310001889539crbg:LifeInsuranceOperatingSegmentMemberus-gaap:PolicyholderAccountBalanceAtGuaranteedMinimumCreditingRateMembercrbg:PolicyholderAccountBalanceGuaranteedMinimumCreditingRateRangeFrom0300To0400Member2022-12-310001889539crbg:LifeInsuranceOperatingSegmentMemberus-gaap:PolicyholderAccountBalanceAboveGuaranteedMinimumCreditingRateRangeFrom0001To0050Membercrbg:PolicyholderAccountBalanceGuaranteedMinimumCreditingRateRangeFrom0300To0400Member2022-12-310001889539crbg:LifeInsuranceOperatingSegmentMembercrbg:PolicyholderAccountBalanceAboveGuaranteedMinimumCreditingRateRangeFrom0050AndGreaterMembercrbg:PolicyholderAccountBalanceGuaranteedMinimumCreditingRateRangeFrom0300To0400Member2022-12-310001889539crbg:LifeInsuranceOperatingSegmentMembercrbg:PolicyholderAccountBalanceGuaranteedMinimumCreditingRateRangeFrom0300To0400Member2022-12-310001889539crbg:PolicyholderAccountBalanceGuaranteedMinimumCreditingRateRangeFrom0400To0500Membercrbg:LifeInsuranceOperatingSegmentMemberus-gaap:PolicyholderAccountBalanceAtGuaranteedMinimumCreditingRateMember2022-12-310001889539crbg:PolicyholderAccountBalanceGuaranteedMinimumCreditingRateRangeFrom0400To0500Membercrbg:LifeInsuranceOperatingSegmentMemberus-gaap:PolicyholderAccountBalanceAboveGuaranteedMinimumCreditingRateRangeFrom0001To0050Member2022-12-310001889539crbg:PolicyholderAccountBalanceGuaranteedMinimumCreditingRateRangeFrom0400To0500Membercrbg:LifeInsuranceOperatingSegmentMembercrbg:PolicyholderAccountBalanceAboveGuaranteedMinimumCreditingRateRangeFrom0050AndGreaterMember2022-12-310001889539crbg:PolicyholderAccountBalanceGuaranteedMinimumCreditingRateRangeFrom0400To0500Membercrbg:LifeInsuranceOperatingSegmentMember2022-12-310001889539crbg:PolicyholderAccountBalanceGuaranteedMinimumCreditingRateRangeFrom0500To0550Membercrbg:LifeInsuranceOperatingSegmentMemberus-gaap:PolicyholderAccountBalanceAtGuaranteedMinimumCreditingRateMember2022-12-310001889539crbg:PolicyholderAccountBalanceGuaranteedMinimumCreditingRateRangeFrom0500To0550Membercrbg:LifeInsuranceOperatingSegmentMemberus-gaap:PolicyholderAccountBalanceAboveGuaranteedMinimumCreditingRateRangeFrom0001To0050Member2022-12-310001889539crbg:PolicyholderAccountBalanceGuaranteedMinimumCreditingRateRangeFrom0500To0550Membercrbg:LifeInsuranceOperatingSegmentMembercrbg:PolicyholderAccountBalanceAboveGuaranteedMinimumCreditingRateRangeFrom0050AndGreaterMember2022-12-310001889539crbg:PolicyholderAccountBalanceGuaranteedMinimumCreditingRateRangeFrom0500To0550Membercrbg:LifeInsuranceOperatingSegmentMember2022-12-310001889539crbg:LifeInsuranceOperatingSegmentMemberus-gaap:PolicyholderAccountBalanceAtGuaranteedMinimumCreditingRateMember2022-12-310001889539crbg:LifeInsuranceOperatingSegmentMemberus-gaap:PolicyholderAccountBalanceAboveGuaranteedMinimumCreditingRateRangeFrom0001To0050Member2022-12-310001889539crbg:LifeInsuranceOperatingSegmentMembercrbg:PolicyholderAccountBalanceAboveGuaranteedMinimumCreditingRateRangeFrom0050AndGreaterMember2022-12-310001889539us-gaap:PolicyholderAccountBalanceAtGuaranteedMinimumCreditingRateMember2022-12-310001889539us-gaap:PolicyholderAccountBalanceAboveGuaranteedMinimumCreditingRateRangeFrom0001To0050Member2022-12-310001889539crbg:PolicyholderAccountBalanceAboveGuaranteedMinimumCreditingRateRangeFrom0050AndGreaterMember2022-12-310001889539crbg:IndividualRetirementSegmentMembercrbg:PolicyholderAccountBalanceGuaranteedMinimumCreditingRateRangeLessThan0100Memberus-gaap:PolicyholderAccountBalanceAtGuaranteedMinimumCreditingRateMember2021-12-310001889539crbg:IndividualRetirementSegmentMembercrbg:PolicyholderAccountBalanceGuaranteedMinimumCreditingRateRangeLessThan0100Memberus-gaap:PolicyholderAccountBalanceAboveGuaranteedMinimumCreditingRateRangeFrom0001To0050Member2021-12-310001889539crbg:IndividualRetirementSegmentMembercrbg:PolicyholderAccountBalanceAboveGuaranteedMinimumCreditingRateRangeFrom0050AndGreaterMembercrbg:PolicyholderAccountBalanceGuaranteedMinimumCreditingRateRangeLessThan0100Member2021-12-310001889539crbg:IndividualRetirementSegmentMembercrbg:PolicyholderAccountBalanceGuaranteedMinimumCreditingRateRangeLessThan0100Member2021-12-310001889539crbg:PolicyholderAccountBalanceGuaranteedMinimumCreditingRateRangeFrom0100To0200Membercrbg:IndividualRetirementSegmentMemberus-gaap:PolicyholderAccountBalanceAtGuaranteedMinimumCreditingRateMember2021-12-310001889539crbg:PolicyholderAccountBalanceGuaranteedMinimumCreditingRateRangeFrom0100To0200Membercrbg:IndividualRetirementSegmentMemberus-gaap:PolicyholderAccountBalanceAboveGuaranteedMinimumCreditingRateRangeFrom0001To0050Member2021-12-310001889539crbg:PolicyholderAccountBalanceGuaranteedMinimumCreditingRateRangeFrom0100To0200Membercrbg:IndividualRetirementSegmentMembercrbg:PolicyholderAccountBalanceAboveGuaranteedMinimumCreditingRateRangeFrom0050AndGreaterMember2021-12-310001889539crbg:PolicyholderAccountBalanceGuaranteedMinimumCreditingRateRangeFrom0100To0200Membercrbg:IndividualRetirementSegmentMember2021-12-310001889539crbg:IndividualRetirementSegmentMemberus-gaap:PolicyholderAccountBalanceAtGuaranteedMinimumCreditingRateMembercrbg:PolicyholderAccountBalanceGuaranteedMinimumCreditingRateRangeFrom0200To0300Member2021-12-310001889539crbg:IndividualRetirementSegmentMembercrbg:PolicyholderAccountBalanceGuaranteedMinimumCreditingRateRangeFrom0200To0300Memberus-gaap:PolicyholderAccountBalanceAboveGuaranteedMinimumCreditingRateRangeFrom0001To0050Member2021-12-310001889539crbg:IndividualRetirementSegmentMembercrbg:PolicyholderAccountBalanceAboveGuaranteedMinimumCreditingRateRangeFrom0050AndGreaterMembercrbg:PolicyholderAccountBalanceGuaranteedMinimumCreditingRateRangeFrom0200To0300Member2021-12-310001889539crbg:IndividualRetirementSegmentMembercrbg:PolicyholderAccountBalanceGuaranteedMinimumCreditingRateRangeFrom0200To0300Member2021-12-310001889539crbg:IndividualRetirementSegmentMemberus-gaap:PolicyholderAccountBalanceAtGuaranteedMinimumCreditingRateMembercrbg:PolicyholderAccountBalanceGuaranteedMinimumCreditingRateRangeFrom0300To0400Member2021-12-310001889539crbg:IndividualRetirementSegmentMemberus-gaap:PolicyholderAccountBalanceAboveGuaranteedMinimumCreditingRateRangeFrom0001To0050Membercrbg:PolicyholderAccountBalanceGuaranteedMinimumCreditingRateRangeFrom0300To0400Member2021-12-310001889539crbg:IndividualRetirementSegmentMembercrbg:PolicyholderAccountBalanceAboveGuaranteedMinimumCreditingRateRangeFrom0050AndGreaterMembercrbg:PolicyholderAccountBalanceGuaranteedMinimumCreditingRateRangeFrom0300To0400Member2021-12-310001889539crbg:IndividualRetirementSegmentMembercrbg:PolicyholderAccountBalanceGuaranteedMinimumCreditingRateRangeFrom0300To0400Member2021-12-310001889539crbg:PolicyholderAccountBalanceGuaranteedMinimumCreditingRateRangeFrom0400To0500Membercrbg:IndividualRetirementSegmentMemberus-gaap:PolicyholderAccountBalanceAtGuaranteedMinimumCreditingRateMember2021-12-310001889539crbg:PolicyholderAccountBalanceGuaranteedMinimumCreditingRateRangeFrom0400To0500Membercrbg:IndividualRetirementSegmentMemberus-gaap:PolicyholderAccountBalanceAboveGuaranteedMinimumCreditingRateRangeFrom0001To0050Member2021-12-310001889539crbg:PolicyholderAccountBalanceGuaranteedMinimumCreditingRateRangeFrom0400To0500Membercrbg:IndividualRetirementSegmentMembercrbg:PolicyholderAccountBalanceAboveGuaranteedMinimumCreditingRateRangeFrom0050AndGreaterMember2021-12-310001889539crbg:PolicyholderAccountBalanceGuaranteedMinimumCreditingRateRangeFrom0400To0500Membercrbg:IndividualRetirementSegmentMember2021-12-310001889539crbg:PolicyholderAccountBalanceGuaranteedMinimumCreditingRateRangeFrom0500To0550Membercrbg:IndividualRetirementSegmentMemberus-gaap:PolicyholderAccountBalanceAtGuaranteedMinimumCreditingRateMember2021-12-310001889539crbg:PolicyholderAccountBalanceGuaranteedMinimumCreditingRateRangeFrom0500To0550Membercrbg:IndividualRetirementSegmentMemberus-gaap:PolicyholderAccountBalanceAboveGuaranteedMinimumCreditingRateRangeFrom0001To0050Member2021-12-310001889539crbg:PolicyholderAccountBalanceGuaranteedMinimumCreditingRateRangeFrom0500To0550Membercrbg:IndividualRetirementSegmentMembercrbg:PolicyholderAccountBalanceAboveGuaranteedMinimumCreditingRateRangeFrom0050AndGreaterMember2021-12-310001889539crbg:PolicyholderAccountBalanceGuaranteedMinimumCreditingRateRangeFrom0500To0550Membercrbg:IndividualRetirementSegmentMember2021-12-310001889539crbg:IndividualRetirementSegmentMemberus-gaap:PolicyholderAccountBalanceAtGuaranteedMinimumCreditingRateMember2021-12-310001889539crbg:IndividualRetirementSegmentMemberus-gaap:PolicyholderAccountBalanceAboveGuaranteedMinimumCreditingRateRangeFrom0001To0050Member2021-12-310001889539crbg:IndividualRetirementSegmentMembercrbg:PolicyholderAccountBalanceAboveGuaranteedMinimumCreditingRateRangeFrom0050AndGreaterMember2021-12-310001889539crbg:PolicyholderAccountBalanceGuaranteedMinimumCreditingRateRangeLessThan0100Memberus-gaap:PolicyholderAccountBalanceAtGuaranteedMinimumCreditingRateMembercrbg:GroupRetirementSegmentMember2021-12-310001889539crbg:PolicyholderAccountBalanceGuaranteedMinimumCreditingRateRangeLessThan0100Memberus-gaap:PolicyholderAccountBalanceAboveGuaranteedMinimumCreditingRateRangeFrom0001To0050Membercrbg:GroupRetirementSegmentMember2021-12-310001889539crbg:PolicyholderAccountBalanceAboveGuaranteedMinimumCreditingRateRangeFrom0050AndGreaterMembercrbg:PolicyholderAccountBalanceGuaranteedMinimumCreditingRateRangeLessThan0100Membercrbg:GroupRetirementSegmentMember2021-12-310001889539crbg:PolicyholderAccountBalanceGuaranteedMinimumCreditingRateRangeLessThan0100Membercrbg:GroupRetirementSegmentMember2021-12-310001889539crbg:PolicyholderAccountBalanceGuaranteedMinimumCreditingRateRangeFrom0100To0200Memberus-gaap:PolicyholderAccountBalanceAtGuaranteedMinimumCreditingRateMembercrbg:GroupRetirementSegmentMember2021-12-310001889539crbg:PolicyholderAccountBalanceGuaranteedMinimumCreditingRateRangeFrom0100To0200Memberus-gaap:PolicyholderAccountBalanceAboveGuaranteedMinimumCreditingRateRangeFrom0001To0050Membercrbg:GroupRetirementSegmentMember2021-12-310001889539crbg:PolicyholderAccountBalanceGuaranteedMinimumCreditingRateRangeFrom0100To0200Membercrbg:PolicyholderAccountBalanceAboveGuaranteedMinimumCreditingRateRangeFrom0050AndGreaterMembercrbg:GroupRetirementSegmentMember2021-12-310001889539crbg:PolicyholderAccountBalanceGuaranteedMinimumCreditingRateRangeFrom0100To0200Membercrbg:GroupRetirementSegmentMember2021-12-310001889539us-gaap:PolicyholderAccountBalanceAtGuaranteedMinimumCreditingRateMembercrbg:PolicyholderAccountBalanceGuaranteedMinimumCreditingRateRangeFrom0200To0300Membercrbg:GroupRetirementSegmentMember2021-12-310001889539crbg:PolicyholderAccountBalanceGuaranteedMinimumCreditingRateRangeFrom0200To0300Memberus-gaap:PolicyholderAccountBalanceAboveGuaranteedMinimumCreditingRateRangeFrom0001To0050Membercrbg:GroupRetirementSegmentMember2021-12-310001889539crbg:PolicyholderAccountBalanceAboveGuaranteedMinimumCreditingRateRangeFrom0050AndGreaterMembercrbg:PolicyholderAccountBalanceGuaranteedMinimumCreditingRateRangeFrom0200To0300Membercrbg:GroupRetirementSegmentMember2021-12-310001889539crbg:PolicyholderAccountBalanceGuaranteedMinimumCreditingRateRangeFrom0200To0300Membercrbg:GroupRetirementSegmentMember2021-12-310001889539us-gaap:PolicyholderAccountBalanceAtGuaranteedMinimumCreditingRateMembercrbg:GroupRetirementSegmentMembercrbg:PolicyholderAccountBalanceGuaranteedMinimumCreditingRateRangeFrom0300To0400Member2021-12-310001889539us-gaap:PolicyholderAccountBalanceAboveGuaranteedMinimumCreditingRateRangeFrom0001To0050Membercrbg:GroupRetirementSegmentMembercrbg:PolicyholderAccountBalanceGuaranteedMinimumCreditingRateRangeFrom0300To0400Member2021-12-310001889539crbg:PolicyholderAccountBalanceAboveGuaranteedMinimumCreditingRateRangeFrom0050AndGreaterMembercrbg:GroupRetirementSegmentMembercrbg:PolicyholderAccountBalanceGuaranteedMinimumCreditingRateRangeFrom0300To0400Member2021-12-310001889539crbg:GroupRetirementSegmentMembercrbg:PolicyholderAccountBalanceGuaranteedMinimumCreditingRateRangeFrom0300To0400Member2021-12-310001889539crbg:PolicyholderAccountBalanceGuaranteedMinimumCreditingRateRangeFrom0400To0500Memberus-gaap:PolicyholderAccountBalanceAtGuaranteedMinimumCreditingRateMembercrbg:GroupRetirementSegmentMember2021-12-310001889539crbg:PolicyholderAccountBalanceGuaranteedMinimumCreditingRateRangeFrom0400To0500Memberus-gaap:PolicyholderAccountBalanceAboveGuaranteedMinimumCreditingRateRangeFrom0001To0050Membercrbg:GroupRetirementSegmentMember2021-12-310001889539crbg:PolicyholderAccountBalanceGuaranteedMinimumCreditingRateRangeFrom0400To0500Membercrbg:PolicyholderAccountBalanceAboveGuaranteedMinimumCreditingRateRangeFrom0050AndGreaterMembercrbg:GroupRetirementSegmentMember2021-12-310001889539crbg:PolicyholderAccountBalanceGuaranteedMinimumCreditingRateRangeFrom0400To0500Membercrbg:GroupRetirementSegmentMember2021-12-310001889539crbg:PolicyholderAccountBalanceGuaranteedMinimumCreditingRateRangeFrom0500To0550Memberus-gaap:PolicyholderAccountBalanceAtGuaranteedMinimumCreditingRateMembercrbg:GroupRetirementSegmentMember2021-12-310001889539crbg:PolicyholderAccountBalanceGuaranteedMinimumCreditingRateRangeFrom0500To0550Memberus-gaap:PolicyholderAccountBalanceAboveGuaranteedMinimumCreditingRateRangeFrom0001To0050Membercrbg:GroupRetirementSegmentMember2021-12-310001889539crbg:PolicyholderAccountBalanceGuaranteedMinimumCreditingRateRangeFrom0500To0550Membercrbg:PolicyholderAccountBalanceAboveGuaranteedMinimumCreditingRateRangeFrom0050AndGreaterMembercrbg:GroupRetirementSegmentMember2021-12-310001889539crbg:PolicyholderAccountBalanceGuaranteedMinimumCreditingRateRangeFrom0500To0550Membercrbg:GroupRetirementSegmentMember2021-12-310001889539us-gaap:PolicyholderAccountBalanceAtGuaranteedMinimumCreditingRateMembercrbg:GroupRetirementSegmentMember2021-12-310001889539us-gaap:PolicyholderAccountBalanceAboveGuaranteedMinimumCreditingRateRangeFrom0001To0050Membercrbg:GroupRetirementSegmentMember2021-12-310001889539crbg:PolicyholderAccountBalanceAboveGuaranteedMinimumCreditingRateRangeFrom0050AndGreaterMembercrbg:GroupRetirementSegmentMember2021-12-310001889539crbg:LifeInsuranceOperatingSegmentMembercrbg:PolicyholderAccountBalanceGuaranteedMinimumCreditingRateRangeLessThan0100Memberus-gaap:PolicyholderAccountBalanceAtGuaranteedMinimumCreditingRateMember2021-12-310001889539crbg:LifeInsuranceOperatingSegmentMembercrbg:PolicyholderAccountBalanceGuaranteedMinimumCreditingRateRangeLessThan0100Memberus-gaap:PolicyholderAccountBalanceAboveGuaranteedMinimumCreditingRateRangeFrom0001To0050Member2021-12-310001889539crbg:LifeInsuranceOperatingSegmentMembercrbg:PolicyholderAccountBalanceAboveGuaranteedMinimumCreditingRateRangeFrom0050AndGreaterMembercrbg:PolicyholderAccountBalanceGuaranteedMinimumCreditingRateRangeLessThan0100Member2021-12-310001889539crbg:LifeInsuranceOperatingSegmentMembercrbg:PolicyholderAccountBalanceGuaranteedMinimumCreditingRateRangeLessThan0100Member2021-12-310001889539crbg:LifeInsuranceOperatingSegmentMembercrbg:PolicyholderAccountBalanceGuaranteedMinimumCreditingRateRangeFrom0100To0200Memberus-gaap:PolicyholderAccountBalanceAtGuaranteedMinimumCreditingRateMember2021-12-310001889539crbg:LifeInsuranceOperatingSegmentMembercrbg:PolicyholderAccountBalanceGuaranteedMinimumCreditingRateRangeFrom0100To0200Memberus-gaap:PolicyholderAccountBalanceAboveGuaranteedMinimumCreditingRateRangeFrom0001To0050Member2021-12-310001889539crbg:LifeInsuranceOperatingSegmentMembercrbg:PolicyholderAccountBalanceGuaranteedMinimumCreditingRateRangeFrom0100To0200Membercrbg:PolicyholderAccountBalanceAboveGuaranteedMinimumCreditingRateRangeFrom0050AndGreaterMember2021-12-310001889539crbg:LifeInsuranceOperatingSegmentMembercrbg:PolicyholderAccountBalanceGuaranteedMinimumCreditingRateRangeFrom0100To0200Member2021-12-310001889539crbg:LifeInsuranceOperatingSegmentMemberus-gaap:PolicyholderAccountBalanceAtGuaranteedMinimumCreditingRateMembercrbg:PolicyholderAccountBalanceGuaranteedMinimumCreditingRateRangeFrom0200To0300Member2021-12-310001889539crbg:LifeInsuranceOperatingSegmentMembercrbg:PolicyholderAccountBalanceGuaranteedMinimumCreditingRateRangeFrom0200To0300Memberus-gaap:PolicyholderAccountBalanceAboveGuaranteedMinimumCreditingRateRangeFrom0001To0050Member2021-12-310001889539crbg:LifeInsuranceOperatingSegmentMembercrbg:PolicyholderAccountBalanceAboveGuaranteedMinimumCreditingRateRangeFrom0050AndGreaterMembercrbg:PolicyholderAccountBalanceGuaranteedMinimumCreditingRateRangeFrom0200To0300Member2021-12-310001889539crbg:LifeInsuranceOperatingSegmentMembercrbg:PolicyholderAccountBalanceGuaranteedMinimumCreditingRateRangeFrom0200To0300Member2021-12-310001889539crbg:LifeInsuranceOperatingSegmentMemberus-gaap:PolicyholderAccountBalanceAtGuaranteedMinimumCreditingRateMembercrbg:PolicyholderAccountBalanceGuaranteedMinimumCreditingRateRangeFrom0300To0400Member2021-12-310001889539crbg:LifeInsuranceOperatingSegmentMemberus-gaap:PolicyholderAccountBalanceAboveGuaranteedMinimumCreditingRateRangeFrom0001To0050Membercrbg:PolicyholderAccountBalanceGuaranteedMinimumCreditingRateRangeFrom0300To0400Member2021-12-310001889539crbg:LifeInsuranceOperatingSegmentMembercrbg:PolicyholderAccountBalanceAboveGuaranteedMinimumCreditingRateRangeFrom0050AndGreaterMembercrbg:PolicyholderAccountBalanceGuaranteedMinimumCreditingRateRangeFrom0300To0400Member2021-12-310001889539crbg:LifeInsuranceOperatingSegmentMembercrbg:PolicyholderAccountBalanceGuaranteedMinimumCreditingRateRangeFrom0300To0400Member2021-12-310001889539crbg:PolicyholderAccountBalanceGuaranteedMinimumCreditingRateRangeFrom0400To0500Membercrbg:LifeInsuranceOperatingSegmentMemberus-gaap:PolicyholderAccountBalanceAtGuaranteedMinimumCreditingRateMember2021-12-310001889539crbg:PolicyholderAccountBalanceGuaranteedMinimumCreditingRateRangeFrom0400To0500Membercrbg:LifeInsuranceOperatingSegmentMemberus-gaap:PolicyholderAccountBalanceAboveGuaranteedMinimumCreditingRateRangeFrom0001To0050Member2021-12-310001889539crbg:PolicyholderAccountBalanceGuaranteedMinimumCreditingRateRangeFrom0400To0500Membercrbg:LifeInsuranceOperatingSegmentMembercrbg:PolicyholderAccountBalanceAboveGuaranteedMinimumCreditingRateRangeFrom0050AndGreaterMember2021-12-310001889539crbg:PolicyholderAccountBalanceGuaranteedMinimumCreditingRateRangeFrom0400To0500Membercrbg:LifeInsuranceOperatingSegmentMember2021-12-310001889539crbg:PolicyholderAccountBalanceGuaranteedMinimumCreditingRateRangeFrom0500To0550Membercrbg:LifeInsuranceOperatingSegmentMemberus-gaap:PolicyholderAccountBalanceAtGuaranteedMinimumCreditingRateMember2021-12-310001889539crbg:PolicyholderAccountBalanceGuaranteedMinimumCreditingRateRangeFrom0500To0550Membercrbg:LifeInsuranceOperatingSegmentMemberus-gaap:PolicyholderAccountBalanceAboveGuaranteedMinimumCreditingRateRangeFrom0001To0050Member2021-12-310001889539crbg:PolicyholderAccountBalanceGuaranteedMinimumCreditingRateRangeFrom0500To0550Membercrbg:LifeInsuranceOperatingSegmentMembercrbg:PolicyholderAccountBalanceAboveGuaranteedMinimumCreditingRateRangeFrom0050AndGreaterMember2021-12-310001889539crbg:PolicyholderAccountBalanceGuaranteedMinimumCreditingRateRangeFrom0500To0550Membercrbg:LifeInsuranceOperatingSegmentMember2021-12-310001889539crbg:LifeInsuranceOperatingSegmentMemberus-gaap:PolicyholderAccountBalanceAtGuaranteedMinimumCreditingRateMember2021-12-310001889539crbg:LifeInsuranceOperatingSegmentMemberus-gaap:PolicyholderAccountBalanceAboveGuaranteedMinimumCreditingRateRangeFrom0001To0050Member2021-12-310001889539crbg:LifeInsuranceOperatingSegmentMembercrbg:PolicyholderAccountBalanceAboveGuaranteedMinimumCreditingRateRangeFrom0050AndGreaterMember2021-12-310001889539us-gaap:PolicyholderAccountBalanceAtGuaranteedMinimumCreditingRateMember2021-12-310001889539us-gaap:PolicyholderAccountBalanceAboveGuaranteedMinimumCreditingRateRangeFrom0001To0050Member2021-12-310001889539crbg:PolicyholderAccountBalanceAboveGuaranteedMinimumCreditingRateRangeFrom0050AndGreaterMember2021-12-310001889539crbg:FederalHomeLoanBankOfDallasAndNewYorkMember2022-12-310001889539srt:FederalHomeLoanBankOfDallasMembercrbg:DNAAuction22To30BpsMember2022-12-310001889539srt:FederalHomeLoanBankOfDallasMembercrbg:FHLBDallas353PercentMember2022-12-310001889539srt:FederalHomeLoanBankOfNewYorkMember2022-12-310001889539srt:FederalHomeLoanBankOfDallasMembercrbg:FHLBDallas353PercentMembersrt:MinimumMember2022-12-310001889539srt:FederalHomeLoanBankOfDallasMembersrt:MaximumMembercrbg:FHLBDallas353PercentMember2022-12-310001889539us-gaap:LifeInsuranceSegmentMember2022-12-310001889539crbg:LifeInsuranceOperatingSegmentMembercrbg:UnexpiredRiskReserveMembersrt:ScenarioPreviouslyReportedMember2020-12-310001889539crbg:UnexpiredRiskReserveMembercrbg:InstitutionalMarketsMembersrt:ScenarioPreviouslyReportedMember2020-12-310001889539us-gaap:CorporateAndOtherMembercrbg:UnexpiredRiskReserveMembersrt:ScenarioPreviouslyReportedMember2020-12-310001889539crbg:UnexpiredRiskReserveMembersrt:ScenarioPreviouslyReportedMember2020-12-310001889539crbg:LifeInsuranceOperatingSegmentMembercrbg:UnexpiredRiskReserveMember2020-12-310001889539crbg:UnexpiredRiskReserveMembercrbg:InstitutionalMarketsMember2020-12-310001889539us-gaap:CorporateAndOtherMembercrbg:UnexpiredRiskReserveMember2020-12-310001889539crbg:UnexpiredRiskReserveMember2020-12-310001889539crbg:EffectOfApplicationOfAccountingStandardsUpdate201812ReclassificationOfEmbeddedDerivativeLiabilityFromPolicyholderContractDepositsMembercrbg:IndividualRetirementSegmentMember2020-12-310001889539crbg:EffectOfApplicationOfAccountingStandardsUpdate201812ReclassificationOfEmbeddedDerivativeLiabilityFromPolicyholderContractDepositsMembercrbg:GroupRetirementSegmentMember2020-12-310001889539crbg:EffectOfApplicationOfAccountingStandardsUpdate201812ReclassificationOfEmbeddedDerivativeLiabilityFromPolicyholderContractDepositsMember2020-12-310001889539crbg:EffectOfApplicationOfAccountingStandardsUpdate201812ReclassificationOfFuturePolicyBenefitsMembercrbg:IndividualRetirementSegmentMember2020-12-310001889539crbg:EffectOfApplicationOfAccountingStandardsUpdate201812ReclassificationOfFuturePolicyBenefitsMembercrbg:GroupRetirementSegmentMember2020-12-310001889539crbg:EffectOfApplicationOfAccountingStandardsUpdate201812ReclassificationOfFuturePolicyBenefitsMember2020-12-310001889539crbg:IndividualRetirementSegmentMembercrbg:EffectOfApplicationOfAccountingStandardsUpdate201812CumulativeEffectOfChangesInInstrumentSpecificCreditRiskMember2020-12-310001889539crbg:EffectOfApplicationOfAccountingStandardsUpdate201812CumulativeEffectOfChangesInInstrumentSpecificCreditRiskMembercrbg:GroupRetirementSegmentMember2020-12-310001889539crbg:EffectOfApplicationOfAccountingStandardsUpdate201812CumulativeEffectOfChangesInInstrumentSpecificCreditRiskMember2020-12-310001889539crbg:IndividualRetirementSegmentMembercrbg:EffectOfApplicationOfAccountingStandardsUpdate201812AdjustmentsForTheRemovalOfShadowAdjustmentsMember2020-12-310001889539crbg:GroupRetirementSegmentMembercrbg:EffectOfApplicationOfAccountingStandardsUpdate201812AdjustmentsForTheRemovalOfShadowAdjustmentsMember2020-12-310001889539crbg:EffectOfApplicationOfAccountingStandardsUpdate201812AdjustmentsForTheRemovalOfShadowAdjustmentsMember2020-12-310001889539crbg:EffectOfApplicationOfAccountingStandardsUpdate201812AdjustmentsForRemainingDifferenceBetweenCarryingAmountAndFairValueForMRBMembercrbg:IndividualRetirementSegmentMember2020-12-310001889539crbg:EffectOfApplicationOfAccountingStandardsUpdate201812AdjustmentsForRemainingDifferenceBetweenCarryingAmountAndFairValueForMRBMembercrbg:GroupRetirementSegmentMember2020-12-310001889539crbg:EffectOfApplicationOfAccountingStandardsUpdate201812AdjustmentsForRemainingDifferenceBetweenCarryingAmountAndFairValueForMRBMember2020-12-310001889539crbg:IndividualRetirementSegmentMember2021-01-010001889539crbg:GroupRetirementSegmentMember2021-01-010001889539crbg:IndividualRetirementSegmentMemberus-gaap:GuaranteedMinimumDeathBenefitMember2022-12-310001889539us-gaap:GuaranteedMinimumDeathBenefitMembercrbg:GroupRetirementSegmentMember2022-12-310001889539us-gaap:GuaranteedMinimumDeathBenefitMember2022-12-310001889539us-gaap:GuaranteedMinimumWithdrawalBenefitMembercrbg:IndividualRetirementSegmentMember2022-12-310001889539us-gaap:GuaranteedMinimumWithdrawalBenefitMembercrbg:GroupRetirementSegmentMember2022-12-310001889539us-gaap:GuaranteedMinimumWithdrawalBenefitMember2022-12-310001889539crbg:GuaranteedMinimumDeathBenefitAndGuaranteedMinimumWithdrawalBenefitMembercrbg:IndividualRetirementSegmentMember2022-12-310001889539crbg:GuaranteedMinimumDeathBenefitAndGuaranteedMinimumWithdrawalBenefitMembercrbg:GroupRetirementSegmentMember2022-12-310001889539crbg:GuaranteedMinimumDeathBenefitAndGuaranteedMinimumWithdrawalBenefitMember2022-12-310001889539crbg:IndividualRetirementSegmentMemberus-gaap:GuaranteedMinimumDeathBenefitMember2021-12-310001889539us-gaap:GuaranteedMinimumDeathBenefitMembercrbg:GroupRetirementSegmentMember2021-12-310001889539us-gaap:GuaranteedMinimumDeathBenefitMember2021-12-310001889539us-gaap:GuaranteedMinimumWithdrawalBenefitMembercrbg:IndividualRetirementSegmentMember2021-12-310001889539us-gaap:GuaranteedMinimumWithdrawalBenefitMembercrbg:GroupRetirementSegmentMember2021-12-310001889539us-gaap:GuaranteedMinimumWithdrawalBenefitMember2021-12-310001889539crbg:GuaranteedMinimumDeathBenefitAndGuaranteedMinimumWithdrawalBenefitMembercrbg:IndividualRetirementSegmentMember2021-12-310001889539crbg:GuaranteedMinimumDeathBenefitAndGuaranteedMinimumWithdrawalBenefitMembercrbg:GroupRetirementSegmentMember2021-12-310001889539crbg:GuaranteedMinimumDeathBenefitAndGuaranteedMinimumWithdrawalBenefitMember2021-12-310001889539us-gaap:SeparateAccountEquitySecurityMembercrbg:IndividualRetirementSegmentMember2022-12-310001889539us-gaap:SeparateAccountEquitySecurityMembercrbg:GroupRetirementSegmentMember2022-12-310001889539us-gaap:SeparateAccountEquitySecurityMembercrbg:LifeInsuranceSegment1Member2022-12-310001889539us-gaap:SeparateAccountEquitySecurityMembercrbg:InstitutionalMarketsSegmentMember2022-12-310001889539us-gaap:SeparateAccountEquitySecurityMember2022-12-310001889539crbg:IndividualRetirementSegmentMemberus-gaap:SeparateAccountDebtSecurityMember2022-12-310001889539us-gaap:SeparateAccountDebtSecurityMembercrbg:GroupRetirementSegmentMember2022-12-310001889539crbg:LifeInsuranceSegment1Memberus-gaap:SeparateAccountDebtSecurityMember2022-12-310001889539us-gaap:SeparateAccountDebtSecurityMembercrbg:InstitutionalMarketsSegmentMember2022-12-310001889539us-gaap:SeparateAccountDebtSecurityMember2022-12-310001889539crbg:IndividualRetirementSegmentMembercrbg:SeparateAccountBalancedFundsMember2022-12-310001889539crbg:SeparateAccountBalancedFundsMembercrbg:GroupRetirementSegmentMember2022-12-310001889539crbg:LifeInsuranceSegment1Membercrbg:SeparateAccountBalancedFundsMember2022-12-310001889539crbg:SeparateAccountBalancedFundsMembercrbg:InstitutionalMarketsSegmentMember2022-12-310001889539crbg:SeparateAccountBalancedFundsMember2022-12-310001889539crbg:SeparateAccountMoneyMarketFundsMembercrbg:IndividualRetirementSegmentMember2022-12-310001889539crbg:SeparateAccountMoneyMarketFundsMembercrbg:GroupRetirementSegmentMember2022-12-310001889539crbg:SeparateAccountMoneyMarketFundsMembercrbg:LifeInsuranceSegment1Member2022-12-310001889539crbg:SeparateAccountMoneyMarketFundsMembercrbg:InstitutionalMarketsSegmentMember2022-12-310001889539crbg:SeparateAccountMoneyMarketFundsMember2022-12-310001889539us-gaap:SeparateAccountEquitySecurityMembercrbg:IndividualRetirementSegmentMember2021-12-310001889539us-gaap:SeparateAccountEquitySecurityMembercrbg:GroupRetirementSegmentMember2021-12-310001889539us-gaap:SeparateAccountEquitySecurityMembercrbg:LifeInsuranceSegment1Member2021-12-310001889539us-gaap:SeparateAccountEquitySecurityMembercrbg:InstitutionalMarketsSegmentMember2021-12-310001889539us-gaap:SeparateAccountEquitySecurityMember2021-12-310001889539crbg:IndividualRetirementSegmentMemberus-gaap:SeparateAccountDebtSecurityMember2021-12-310001889539us-gaap:SeparateAccountDebtSecurityMembercrbg:GroupRetirementSegmentMember2021-12-310001889539crbg:LifeInsuranceSegment1Memberus-gaap:SeparateAccountDebtSecurityMember2021-12-310001889539us-gaap:SeparateAccountDebtSecurityMembercrbg:InstitutionalMarketsSegmentMember2021-12-310001889539us-gaap:SeparateAccountDebtSecurityMember2021-12-310001889539crbg:IndividualRetirementSegmentMembercrbg:SeparateAccountBalancedFundsMember2021-12-310001889539crbg:SeparateAccountBalancedFundsMembercrbg:GroupRetirementSegmentMember2021-12-310001889539crbg:LifeInsuranceSegment1Membercrbg:SeparateAccountBalancedFundsMember2021-12-310001889539crbg:SeparateAccountBalancedFundsMembercrbg:InstitutionalMarketsSegmentMember2021-12-310001889539crbg:SeparateAccountBalancedFundsMember2021-12-310001889539crbg:SeparateAccountMoneyMarketFundsMembercrbg:IndividualRetirementSegmentMember2021-12-310001889539crbg:SeparateAccountMoneyMarketFundsMembercrbg:GroupRetirementSegmentMember2021-12-310001889539crbg:SeparateAccountMoneyMarketFundsMembercrbg:LifeInsuranceSegment1Member2021-12-310001889539crbg:SeparateAccountMoneyMarketFundsMembercrbg:InstitutionalMarketsSegmentMember2021-12-310001889539crbg:SeparateAccountMoneyMarketFundsMember2021-12-310001889539us-gaap:LondonInterbankOfferedRateLIBORMembersrt:ParentCompanyMembercrbg:AffiliatedSeniorPromissoryNoteMaturing2022Memberus-gaap:SeniorNotesMember2021-11-300001889539srt:ParentCompanyMembercrbg:AffiliatedSeniorPromissoryNoteMaturing2022Memberus-gaap:SeniorNotesMember2022-12-310001889539srt:ParentCompanyMembercrbg:AffiliatedSeniorPromissoryNoteMaturing2022Memberus-gaap:SeniorNotesMember2021-12-310001889539srt:ParentCompanyMemberus-gaap:UnsecuredDebtMemberus-gaap:LineOfCreditMembercrbg:Corebridge3YearDdtlFacilityMember2022-02-252022-02-250001889539srt:ParentCompanyMemberus-gaap:UnsecuredDebtMemberus-gaap:LineOfCreditMembercrbg:ThreeYearDDTLFacilityMember2022-12-310001889539srt:ParentCompanyMemberus-gaap:UnsecuredDebtMemberus-gaap:LineOfCreditMembercrbg:ThreeYearDDTLFacilityMember2021-12-310001889539srt:ParentCompanyMemberus-gaap:LineOfCreditMembersrt:MinimumMemberus-gaap:UnsecuredDebtMember2022-12-310001889539srt:ParentCompanyMembersrt:MaximumMemberus-gaap:LineOfCreditMemberus-gaap:UnsecuredDebtMember2022-12-310001889539srt:ParentCompanyMemberus-gaap:LineOfCreditMemberus-gaap:UnsecuredDebtMember2022-12-310001889539srt:ParentCompanyMemberus-gaap:LineOfCreditMemberus-gaap:UnsecuredDebtMember2021-12-310001889539us-gaap:NotesPayableOtherPayablesMembersrt:ParentCompanyMembercrbg:HybridJuniorSubordinatedNotesMember2022-12-310001889539us-gaap:NotesPayableOtherPayablesMembersrt:ParentCompanyMembercrbg:HybridJuniorSubordinatedNotesMember2021-12-310001889539us-gaap:NotesPayableOtherPayablesMembercrbg:AIGLHNotesAndBondsPayableMembersrt:MinimumMember2022-12-310001889539us-gaap:NotesPayableOtherPayablesMembercrbg:AIGLHNotesAndBondsPayableMembersrt:MaximumMember2022-12-310001889539us-gaap:NotesPayableOtherPayablesMembercrbg:AIGLHNotesAndBondsPayableMember2022-12-310001889539us-gaap:NotesPayableOtherPayablesMembercrbg:AIGLHNotesAndBondsPayableMember2021-12-310001889539us-gaap:JuniorSubordinatedDebtMembersrt:MinimumMembercrbg:AIGLHJuniorSubordinatedDebtMember2022-12-310001889539srt:MaximumMemberus-gaap:JuniorSubordinatedDebtMembercrbg:AIGLHJuniorSubordinatedDebtMember2022-12-310001889539us-gaap:JuniorSubordinatedDebtMembercrbg:AIGLHJuniorSubordinatedDebtMember2022-12-310001889539us-gaap:JuniorSubordinatedDebtMembercrbg:AIGLHJuniorSubordinatedDebtMember2021-12-310001889539crbg:ConsolidatedInvestmentsIncludingVariableInterestEntitiesPrimaryBeneficiaryMembersrt:MinimumMember2022-12-310001889539srt:MaximumMembercrbg:ConsolidatedInvestmentsIncludingVariableInterestEntitiesPrimaryBeneficiaryMember2022-12-310001889539us-gaap:UnsecuredDebtMemberus-gaap:LineOfCreditMembercrbg:ThreeYearDDTLFacilityMember2022-12-310001889539us-gaap:LineOfCreditMemberus-gaap:UnsecuredDebtMember2022-12-310001889539us-gaap:NotesPayableOtherPayablesMembercrbg:HybridJuniorSubordinatedNotesMember2022-12-310001889539crbg:CorebridgeDebtMember2022-12-310001889539us-gaap:UnsecuredDebtMemberus-gaap:LineOfCreditMembercrbg:Corebridge18MonthDdtlFacilityMember2022-01-012022-03-310001889539us-gaap:UnsecuredDebtMemberus-gaap:LineOfCreditMembercrbg:Corebridge18MonthDdtlFacilityMember2022-02-250001889539us-gaap:UnsecuredDebtMemberus-gaap:LineOfCreditMembercrbg:Corebridge3YearDdtlFacilityMember2022-02-250001889539us-gaap:LineOfCreditMemberus-gaap:UnsecuredDebtMemberus-gaap:LineOfCreditMemberus-gaap:UnsecuredDebtMember2022-04-050001889539us-gaap:UnsecuredDebtMemberus-gaap:LineOfCreditMemberus-gaap:SeniorNotesMembercrbg:SeniorNotesDue2025Member2022-04-050001889539us-gaap:UnsecuredDebtMemberus-gaap:LineOfCreditMemberus-gaap:SeniorNotesMembercrbg:SeniorNotesDue2027Member2022-04-050001889539us-gaap:UnsecuredDebtMemberus-gaap:LineOfCreditMemberus-gaap:SeniorNotesMembercrbg:SeniorNotesDue2029Member2022-04-050001889539us-gaap:UnsecuredDebtMemberus-gaap:LineOfCreditMembercrbg:SeniorNotesDue2032Memberus-gaap:SeniorNotesMember2022-04-050001889539crbg:SeniorNotesDue2042Memberus-gaap:UnsecuredDebtMemberus-gaap:LineOfCreditMemberus-gaap:SeniorNotesMember2022-04-050001889539crbg:SeniorNotesDue2052Memberus-gaap:UnsecuredDebtMemberus-gaap:LineOfCreditMemberus-gaap:SeniorNotesMember2022-04-050001889539us-gaap:UnsecuredDebtMemberus-gaap:LineOfCreditMembercrbg:Corebridge3YearDdtlFacilityMember2022-04-060001889539srt:ParentCompanyMemberus-gaap:UnsecuredDebtMemberus-gaap:LineOfCreditMembercrbg:Corebridge3YearDdtlFacilityMember2022-09-150001889539us-gaap:NotesPayableOtherPayablesMembercrbg:HybridJuniorSubordinatedNotesMember2022-08-230001889539us-gaap:NotesPayableOtherPayablesMembercrbg:HybridJuniorSubordinatedNotesMember2022-08-232022-08-230001889539crbg:AffiliatedSeniorPromissoryNoteMaturing2022Memberus-gaap:SeniorNotesMember2021-11-300001889539us-gaap:NotesPayableOtherPayablesMembercrbg:LexingtonNoteMember2019-12-310001889539us-gaap:NotesPayableOtherPayablesMembercrbg:LexingtonNoteMember2021-01-012021-12-310001889539us-gaap:NotesPayableOtherPayablesMembercrbg:LexingtonNoteMember2020-01-012020-12-310001889539us-gaap:NotesPayableOtherPayablesMembercrbg:LexingtonNoteMember2021-02-122021-02-120001889539crbg:AIGLifeNoteMember2022-06-232022-06-23iso4217:GIP0001889539us-gaap:NotesPayableOtherPayablesMembercrbg:AIGEuropeSANoteMember2013-12-310001889539us-gaap:NotesPayableOtherPayablesMembercrbg:AIGEuropeSANoteMember2020-12-310001889539us-gaap:NotesPayableOtherPayablesMembercrbg:AIGEuropeSANoteMember2021-01-012021-12-310001889539us-gaap:NotesPayableOtherPayablesMembercrbg:AIGEuropeSANoteMember2020-01-012020-12-310001889539us-gaap:NotesPayableOtherPayablesMembercrbg:AIGEuropeSANoteMember2019-01-012019-12-310001889539us-gaap:NotesPayableOtherPayablesMembercrbg:AIGEuropeSANoteMember2021-10-012021-10-010001889539us-gaap:NotesPayableOtherPayablesMembercrbg:ConsolidatedEntitiesExcludingConsolidatedInvestmentsMember2022-12-310001889539us-gaap:NotesPayableOtherPayablesMembercrbg:AIGLHJuniorSubordinatedDebtDueJuly2030Member2022-12-310001889539crbg:AIGLHJuniorSubordinatedDebtDueMarch2046Memberus-gaap:NotesPayableOtherPayablesMember2022-12-310001889539us-gaap:NotesPayableOtherPayablesMembercrbg:AIGLHJuniorSubordinatedDebtDueDecember2045Member2022-12-310001889539us-gaap:JuniorSubordinatedDebtMember2021-01-012021-12-310001889539us-gaap:LineOfCreditMembercrbg:CreditAgreementMemberus-gaap:RevolvingCreditFacilityMember2022-05-122022-05-120001889539us-gaap:LineOfCreditMembercrbg:CreditAgreementMemberus-gaap:RevolvingCreditFacilityMember2022-05-120001889539srt:MaximumMemberus-gaap:LineOfCreditMembercrbg:CreditAgreementMemberus-gaap:RevolvingCreditFacilityMember2022-05-120001889539us-gaap:LineOfCreditMembercrbg:NewYorkFederalReserveBankRateMembercrbg:CreditAgreementMemberus-gaap:RevolvingCreditFacilityMember2022-05-122022-05-120001889539us-gaap:LineOfCreditMembersrt:MinimumMembercrbg:CreditAgreementMemberus-gaap:RevolvingCreditFacilityMemberus-gaap:PrimeRateMember2022-05-122022-05-120001889539srt:MaximumMemberus-gaap:LineOfCreditMembercrbg:CreditAgreementMemberus-gaap:RevolvingCreditFacilityMemberus-gaap:PrimeRateMember2022-05-122022-05-120001889539crbg:AIGLifeLetterOfCreditMemberus-gaap:LineOfCreditMemberus-gaap:LetterOfCreditMember2022-07-28crbg:lineOfCredit0001889539us-gaap:LineOfCreditMembercrbg:AIGBermudaMemberus-gaap:LetterOfCreditMember2022-07-280001889539us-gaap:LineOfCreditMembercrbg:AIGBermudaMemberus-gaap:LetterOfCreditMember2022-05-090001889539us-gaap:LineOfCreditMembercrbg:AIGBermudaMemberus-gaap:LetterOfCreditMember2022-05-120001889539us-gaap:LineOfCreditMembercrbg:ConsolidatedInvestmentEntitiesCreditFacilitiesMemberus-gaap:RevolvingCreditFacilityMember2022-12-310001889539us-gaap:LineOfCreditMembercrbg:ConsolidatedInvestmentEntitiesCreditFacilitiesMemberus-gaap:RevolvingCreditFacilityMember2021-12-310001889539us-gaap:LineOfCreditMembersrt:MinimumMembercrbg:ConsolidatedInvestmentEntitiesCreditFacilitiesMemberus-gaap:RevolvingCreditFacilityMember2022-01-012022-12-310001889539srt:MaximumMemberus-gaap:LineOfCreditMembercrbg:ConsolidatedInvestmentEntitiesCreditFacilitiesMemberus-gaap:RevolvingCreditFacilityMember2022-01-012022-12-310001889539us-gaap:LineOfCreditMemberus-gaap:RevolvingCreditFacilityMembercrbg:ConsolidatedInvestmentEntitiesCreditFacilitiesRealEstateAssetsMember2022-12-310001889539us-gaap:LineOfCreditMemberus-gaap:RevolvingCreditFacilityMembercrbg:ConsolidatedInvestmentEntitiesCreditFacilitiesRealEstateAssetsMember2021-12-310001889539us-gaap:LineOfCreditMembersrt:MinimumMemberus-gaap:RevolvingCreditFacilityMembercrbg:ConsolidatedInvestmentEntitiesCreditFacilitiesRealEstateAssetsMember2022-01-012022-12-310001889539crbg:PromissoryNotesMember2022-12-3100018895392022-12-302022-12-3000018895392022-10-202022-10-2000018895392023-02-162023-02-160001889539crbg:AIGShareholdersMember2021-01-012021-12-310001889539crbg:AIGShareholdersMember2020-01-012020-12-310001889539crbg:CapCorpMembercrbg:AIGShareholdersMember2021-01-012021-12-310001889539crbg:CapCorpMembercrbg:AIGShareholdersMember2020-01-012020-12-310001889539crbg:FortitudeHoldingsMembercrbg:CorebridgeMember2022-01-012022-12-310001889539crbg:FortitudeHoldingsMembercrbg:CorebridgeMember2021-12-310001889539crbg:FortitudeHoldingsMembercrbg:CorebridgeMember2022-12-310001889539us-gaap:AociGainLossDebtSecuritiesAvailableForSaleWithAllowanceForCreditLossParentMember2019-12-310001889539us-gaap:AccumulatedNetUnrealizedInvestmentGainLossMember2019-12-310001889539crbg:ChangeInFairValueOfMarketRiskBenefitsAttributableToChangesInTheInstrumentSpecificRiskParentMember2019-12-310001889539crbg:AOCIMarketRiskBenefitChangeInDiscountRatesParentMember2019-12-310001889539us-gaap:AccumulatedTranslationAdjustmentMember2019-12-310001889539us-gaap:AccumulatedDefinedBenefitPlansAdjustmentMember2019-12-310001889539us-gaap:AociGainLossDebtSecuritiesAvailableForSaleWithAllowanceForCreditLossIncludingNoncontrollingInterestMember2020-01-012020-12-310001889539us-gaap:AccumulatedNetInvestmentGainLossIncludingPortionAttributableToNoncontrollingInterestMember2020-01-012020-12-310001889539us-gaap:AccumulatedForeignCurrencyAdjustmentIncludingPortionAttributableToNoncontrollingInterestMember2020-01-012020-12-310001889539us-gaap:AccumulatedDefinedBenefitPlansAdjustmentIncludingPortionAttributableToNoncontrollingInterestMember2020-01-012020-12-310001889539us-gaap:AociGainLossDebtSecuritiesAvailableForSaleWithAllowanceForCreditLossParentMember2020-01-012020-12-310001889539us-gaap:AccumulatedNetUnrealizedInvestmentGainLossMember2020-01-012020-12-310001889539us-gaap:AccumulatedTranslationAdjustmentMember2020-01-012020-12-310001889539us-gaap:AccumulatedDefinedBenefitPlansAdjustmentMember2020-01-012020-12-310001889539us-gaap:AccumulatedForeignCurrencyAdjustmentAttributableToNoncontrollingInterestMember2020-01-012020-12-310001889539us-gaap:AociAttributableToNoncontrollingInterestMember2020-01-012020-12-310001889539us-gaap:AociGainLossDebtSecuritiesAvailableForSaleWithAllowanceForCreditLossParentMember2020-12-310001889539us-gaap:AccumulatedNetUnrealizedInvestmentGainLossMember2020-12-310001889539us-gaap:AccumulatedTranslationAdjustmentMember2020-12-310001889539us-gaap:AccumulatedDefinedBenefitPlansAdjustmentMember2020-12-310001889539us-gaap:AociGainLossDebtSecuritiesAvailableForSaleWithAllowanceForCreditLossParentMembersrt:CumulativeEffectPeriodOfAdoptionAdjustmentMember2020-12-310001889539srt:CumulativeEffectPeriodOfAdoptionAdjustmentMemberus-gaap:AccumulatedNetUnrealizedInvestmentGainLossMember2020-12-310001889539crbg:AOCIMarketRiskBenefitInstrumentSpecificCreditRiskPortionAttributableToNoncontrollingInterestMembersrt:CumulativeEffectPeriodOfAdoptionAdjustmentMember2020-12-310001889539crbg:AOCIMarketRiskBenefitChangeInDiscountRatesIncludingNoncontrollingInterestMembersrt:CumulativeEffectPeriodOfAdoptionAdjustmentMember2020-12-310001889539us-gaap:AccumulatedTranslationAdjustmentMembersrt:CumulativeEffectPeriodOfAdoptionAdjustmentMember2020-12-310001889539us-gaap:AccumulatedDefinedBenefitPlansAdjustmentMembersrt:CumulativeEffectPeriodOfAdoptionAdjustmentMember2020-12-310001889539us-gaap:AociGainLossDebtSecuritiesAvailableForSaleWithAllowanceForCreditLossIncludingNoncontrollingInterestMember2021-01-012021-12-310001889539us-gaap:AccumulatedNetInvestmentGainLossIncludingPortionAttributableToNoncontrollingInterestMember2021-01-012021-12-310001889539crbg:AOCIMarketRiskBenefitInstrumentSpecificCreditRiskPortionAttributableToNoncontrollingInterestMember2021-01-012021-12-310001889539crbg:AOCIMarketRiskBenefitChangeInDiscountRatesIncludingNoncontrollingInterestMember2021-01-012021-12-310001889539us-gaap:AccumulatedForeignCurrencyAdjustmentIncludingPortionAttributableToNoncontrollingInterestMember2021-01-012021-12-310001889539us-gaap:AccumulatedDefinedBenefitPlansAdjustmentIncludingPortionAttributableToNoncontrollingInterestMember2021-01-012021-12-310001889539us-gaap:AociGainLossDebtSecuritiesAvailableForSaleWithAllowanceForCreditLossParentMember2021-01-012021-12-310001889539us-gaap:AccumulatedNetUnrealizedInvestmentGainLossMember2021-01-012021-12-310001889539crbg:ChangeInFairValueOfMarketRiskBenefitsAttributableToChangesInTheInstrumentSpecificRiskParentMember2021-01-012021-12-310001889539crbg:AOCIMarketRiskBenefitChangeInDiscountRatesParentMember2021-01-012021-12-310001889539us-gaap:AccumulatedTranslationAdjustmentMember2021-01-012021-12-310001889539us-gaap:AccumulatedDefinedBenefitPlansAdjustmentMember2021-01-012021-12-310001889539us-gaap:AccumulatedForeignCurrencyAdjustmentAttributableToNoncontrollingInterestMember2021-01-012021-12-310001889539us-gaap:AociAttributableToNoncontrollingInterestMember2021-01-012021-12-310001889539us-gaap:AociGainLossDebtSecuritiesAvailableForSaleWithAllowanceForCreditLossParentMember2021-12-310001889539us-gaap:AccumulatedNetUnrealizedInvestmentGainLossMember2021-12-310001889539crbg:ChangeInFairValueOfMarketRiskBenefitsAttributableToChangesInTheInstrumentSpecificRiskParentMember2021-12-310001889539crbg:AOCIMarketRiskBenefitChangeInDiscountRatesParentMember2021-12-310001889539us-gaap:AccumulatedTranslationAdjustmentMember2021-12-310001889539us-gaap:AccumulatedDefinedBenefitPlansAdjustmentMember2021-12-310001889539us-gaap:AociGainLossDebtSecuritiesAvailableForSaleWithAllowanceForCreditLossIncludingNoncontrollingInterestMember2022-01-012022-12-310001889539us-gaap:AccumulatedNetInvestmentGainLossIncludingPortionAttributableToNoncontrollingInterestMember2022-01-012022-12-310001889539crbg:AOCIMarketRiskBenefitInstrumentSpecificCreditRiskPortionAttributableToNoncontrollingInterestMember2022-01-012022-12-310001889539crbg:AOCIMarketRiskBenefitChangeInDiscountRatesIncludingNoncontrollingInterestMember2022-01-012022-12-310001889539us-gaap:AccumulatedGainLossCashFlowHedgeIncludingNoncontrollingInterestMember2022-01-012022-12-310001889539us-gaap:AccumulatedForeignCurrencyAdjustmentIncludingPortionAttributableToNoncontrollingInterestMember2022-01-012022-12-310001889539us-gaap:AccumulatedDefinedBenefitPlansAdjustmentIncludingPortionAttributableToNoncontrollingInterestMember2022-01-012022-12-310001889539us-gaap:AociGainLossDebtSecuritiesAvailableForSaleWithAllowanceForCreditLossParentMember2022-01-012022-12-310001889539us-gaap:AccumulatedNetUnrealizedInvestmentGainLossMember2022-01-012022-12-310001889539crbg:ChangeInFairValueOfMarketRiskBenefitsAttributableToChangesInTheInstrumentSpecificRiskParentMember2022-01-012022-12-310001889539crbg:AOCIMarketRiskBenefitChangeInDiscountRatesParentMember2022-01-012022-12-310001889539us-gaap:AccumulatedGainLossNetCashFlowHedgeParentMember2022-01-012022-12-310001889539us-gaap:AccumulatedTranslationAdjustmentMember2022-01-012022-12-310001889539us-gaap:AccumulatedDefinedBenefitPlansAdjustmentMember2022-01-012022-12-310001889539us-gaap:AccumulatedForeignCurrencyAdjustmentAttributableToNoncontrollingInterestMember2022-01-012022-12-310001889539us-gaap:AociAttributableToNoncontrollingInterestMember2022-01-012022-12-310001889539us-gaap:AociGainLossDebtSecuritiesAvailableForSaleWithAllowanceForCreditLossParentMember2022-12-310001889539us-gaap:AccumulatedNetUnrealizedInvestmentGainLossMember2022-12-310001889539crbg:ChangeInFairValueOfMarketRiskBenefitsAttributableToChangesInTheInstrumentSpecificRiskParentMember2022-12-310001889539crbg:AOCIMarketRiskBenefitChangeInDiscountRatesParentMember2022-12-310001889539us-gaap:AccumulatedGainLossNetCashFlowHedgeParentMember2022-12-310001889539us-gaap:AccumulatedTranslationAdjustmentMember2022-12-310001889539us-gaap:AccumulatedDefinedBenefitPlansAdjustmentMember2022-12-310001889539us-gaap:AociGainLossDebtSecuritiesAvailableForSaleWithoutAllowanceForCreditLossIncludingNoncontrollingInterestMember2022-01-012022-12-310001889539us-gaap:AociGainLossDebtSecuritiesAvailableForSaleWithoutAllowanceForCreditLossIncludingNoncontrollingInterestMember2021-01-012021-12-310001889539crbg:AOCIMarketRiskBenefitInstrumentSpecificCreditRiskPortionAttributableToNoncontrollingInterestMember2020-01-012020-12-310001889539crbg:AOCIMarketRiskBenefitChangeInDiscountRatesIncludingNoncontrollingInterestMember2020-01-012020-12-310001889539us-gaap:AociGainLossDebtSecuritiesAvailableForSaleWithoutAllowanceForCreditLossIncludingNoncontrollingInterestMember2020-01-012020-12-310001889539us-gaap:AociGainLossDebtSecuritiesAvailableForSaleWithAllowanceForCreditLossParentMemberus-gaap:ReclassificationOutOfAccumulatedOtherComprehensiveIncomeMember2022-01-012022-12-310001889539us-gaap:AociGainLossDebtSecuritiesAvailableForSaleWithAllowanceForCreditLossParentMemberus-gaap:ReclassificationOutOfAccumulatedOtherComprehensiveIncomeMember2021-01-012021-12-310001889539us-gaap:AociGainLossDebtSecuritiesAvailableForSaleWithAllowanceForCreditLossParentMemberus-gaap:ReclassificationOutOfAccumulatedOtherComprehensiveIncomeMember2020-01-012020-12-310001889539us-gaap:ReclassificationOutOfAccumulatedOtherComprehensiveIncomeMemberus-gaap:AccumulatedNetUnrealizedInvestmentGainLossMember2022-01-012022-12-310001889539us-gaap:ReclassificationOutOfAccumulatedOtherComprehensiveIncomeMemberus-gaap:AccumulatedNetUnrealizedInvestmentGainLossMember2021-01-012021-12-310001889539us-gaap:ReclassificationOutOfAccumulatedOtherComprehensiveIncomeMemberus-gaap:AccumulatedNetUnrealizedInvestmentGainLossMember2020-01-012020-12-310001889539us-gaap:ReclassificationOutOfAccumulatedOtherComprehensiveIncomeMember2022-01-012022-12-310001889539us-gaap:ReclassificationOutOfAccumulatedOtherComprehensiveIncomeMember2021-01-012021-12-310001889539us-gaap:ReclassificationOutOfAccumulatedOtherComprehensiveIncomeMember2020-01-012020-12-310001889539crbg:NonRedeemableNoncontrollingInterestMemberus-gaap:NoncontrollingInterestMember2021-12-310001889539crbg:NonRedeemableNoncontrollingInterestMemberus-gaap:NoncontrollingInterestMember2020-12-310001889539crbg:NonRedeemableNoncontrollingInterestMemberus-gaap:NoncontrollingInterestMember2019-12-310001889539crbg:NonRedeemableNoncontrollingInterestMemberus-gaap:NoncontrollingInterestMember2022-01-012022-12-310001889539crbg:NonRedeemableNoncontrollingInterestMemberus-gaap:NoncontrollingInterestMember2021-01-012021-12-310001889539crbg:NonRedeemableNoncontrollingInterestMemberus-gaap:NoncontrollingInterestMember2020-01-012020-12-310001889539crbg:NonRedeemableNoncontrollingInterestMemberus-gaap:NoncontrollingInterestMember2022-12-310001889539crbg:RedeemableNoncontrollingInterestMember2021-12-310001889539crbg:RedeemableNoncontrollingInterestMember2020-12-310001889539crbg:RedeemableNoncontrollingInterestMember2019-12-310001889539crbg:RedeemableNoncontrollingInterestMember2022-01-012022-12-310001889539crbg:RedeemableNoncontrollingInterestMember2021-01-012021-12-310001889539crbg:RedeemableNoncontrollingInterestMember2020-01-012020-12-310001889539crbg:RedeemableNoncontrollingInterestMember2022-12-3100018895392022-09-062022-09-060001889539us-gaap:CommonClassAMember2022-09-062022-09-060001889539us-gaap:CommonClassBMember2022-09-062022-09-0600018895392022-09-072022-09-300001889539crbg:BlackstoneMembercrbg:CorebridgeFinancialMember2021-11-020001889539crbg:BlackstoneMemberus-gaap:CommonClassBMembercrbg:CorebridgeFinancialMember2021-11-020001889539crbg:DomesticMember2022-01-012022-12-310001889539crbg:DomesticMember2021-01-012021-12-310001889539crbg:DomesticMember2020-01-012020-12-310001889539crbg:ForeignMember2022-01-012022-12-310001889539crbg:ForeignMember2021-01-012021-12-310001889539crbg:ForeignMember2020-01-012020-12-310001889539crbg:DomesticMember2022-12-310001889539crbg:DomesticMember2021-12-310001889539crbg:ForeignMember2022-12-310001889539crbg:ForeignMember2021-12-310001889539crbg:LifeInsuranceCompaniesMember2022-01-012022-12-310001889539crbg:LifeInsuranceCompaniesMember2021-01-012021-12-310001889539crbg:AGLMember2022-01-012022-12-310001889539crbg:CorebridgeMember2022-01-012022-12-310001889539crbg:AIG2013LongTermIncentivePlanMembercrbg:Awarded2018To2020Member2020-01-012020-12-310001889539crbg:AIG2013LongTermIncentivePlanMembersrt:MinimumMembercrbg:Awarded2018To2020Member2021-01-012021-12-310001889539crbg:AIG2013LongTermIncentivePlanMembersrt:MinimumMembercrbg:Awarded2018To2020Member2022-01-012022-12-310001889539crbg:AIG2013LongTermIncentivePlanMembersrt:MinimumMembercrbg:Awarded2018To2020Member2020-01-012020-12-310001889539crbg:AIG2013LongTermIncentivePlanMembersrt:MaximumMembercrbg:Awarded2018To2020Member2020-01-012020-12-310001889539crbg:AIG2013LongTermIncentivePlanMembersrt:MaximumMembercrbg:Awarded2018To2020Member2022-01-012022-12-310001889539crbg:AIG2013LongTermIncentivePlanMembersrt:MaximumMembercrbg:Awarded2018To2020Member2021-01-012021-12-3100018895392022-09-140001889539crbg:InitialPublicOfferingMember2022-09-140001889539us-gaap:RestrictedStockUnitsRSUMember2021-12-310001889539us-gaap:RestrictedStockUnitsRSUMember2022-01-012022-12-310001889539us-gaap:RestrictedStockUnitsRSUMember2022-12-310001889539us-gaap:RestrictedStockUnitsRSUMembersrt:MinimumMember2022-01-012022-12-310001889539us-gaap:RestrictedStockUnitsRSUMembersrt:MaximumMember2022-01-012022-12-310001889539us-gaap:PensionPlansDefinedBenefitMember2022-01-012022-12-310001889539us-gaap:PensionPlansDefinedBenefitMember2021-01-012021-12-310001889539us-gaap:PensionPlansDefinedBenefitMember2020-01-012020-12-310001889539us-gaap:PensionPlansDefinedBenefitMember2022-12-310001889539us-gaap:PensionPlansDefinedBenefitMember2021-12-310001889539us-gaap:OtherPostretirementBenefitPlansDefinedBenefitMember2022-01-012022-12-310001889539us-gaap:OtherPostretirementBenefitPlansDefinedBenefitMember2021-01-012021-12-310001889539us-gaap:OtherPostretirementBenefitPlansDefinedBenefitMember2020-01-012020-12-310001889539us-gaap:OtherPostretirementBenefitPlansDefinedBenefitMember2022-12-310001889539us-gaap:OtherPostretirementBenefitPlansDefinedBenefitMembercountry:US2022-01-012022-12-310001889539us-gaap:DefinedBenefitPostretirementHealthCoverageMembercountry:US2022-01-012022-12-310001889539us-gaap:DefinedBenefitPostretirementHealthCoverageMembercountry:US2021-01-012021-12-310001889539us-gaap:DefinedBenefitPostretirementHealthCoverageMembercountry:US2020-01-012020-12-310001889539us-gaap:DefinedBenefitPostretirementHealthCoverageMembercrbg:NonUSMember2022-01-012022-12-310001889539us-gaap:DefinedBenefitPostretirementHealthCoverageMembercrbg:NonUSMember2021-01-012021-12-310001889539us-gaap:DefinedBenefitPostretirementHealthCoverageMembercrbg:NonUSMember2020-01-012020-12-310001889539srt:MaximumMembercrbg:CorebridgeFinancialIncMember2022-12-310001889539crbg:TaxDeconsolidationMember2022-01-012022-12-310001889539crbg:TaxCreditCarryforwardMember2021-01-012021-12-310001889539crbg:InitialPublicOfferingMember2022-01-012022-12-310001889539crbg:USLifeInsuranceCompaniesMember2022-01-012022-12-310001889539crbg:CorebridgeMember2021-01-012021-12-310001889539srt:AffiliatedEntityMember2022-01-012022-12-310001889539srt:AffiliatedEntityMember2021-01-012021-12-310001889539srt:AffiliatedEntityMember2020-01-012020-12-310001889539crbg:ExcludingFortitudeReFundWithheldAssetsMembersrt:AffiliatedEntityMember2022-01-012022-12-310001889539crbg:ExcludingFortitudeReFundWithheldAssetsMembersrt:AffiliatedEntityMember2021-01-012021-12-310001889539crbg:ExcludingFortitudeReFundWithheldAssetsMembersrt:AffiliatedEntityMember2020-01-012020-12-310001889539crbg:AIGMembersrt:AffiliatedEntityMembercrbg:AIGBermudaMember2021-10-010001889539crbg:CorebridgeEntitiesMembersrt:AffiliatedEntityMembercrbg:AIGBermudaMember2021-10-010001889539crbg:ExcludingFortitudeReFundWithheldAssetsMembersrt:AffiliatedEntityMembercrbg:AIGMember2022-01-012022-12-310001889539crbg:ExcludingFortitudeReFundWithheldAssetsMembersrt:AffiliatedEntityMembercrbg:AIGMember2021-01-012021-12-310001889539crbg:ExcludingFortitudeReFundWithheldAssetsMembersrt:AffiliatedEntityMembercrbg:AIGMember2020-01-012020-12-310001889539crbg:UnsecuredDerivativeTransactionsMembersrt:AffiliatedEntityMember2022-12-310001889539crbg:UnsecuredDerivativeTransactionsMembersrt:AffiliatedEntityMember2021-12-310001889539crbg:GeneralServicesAgreementMembersrt:AffiliatedEntityMember2022-12-310001889539crbg:GeneralServicesAgreementMembersrt:AffiliatedEntityMember2021-12-310001889539crbg:GeneralServicesAgreementMembersrt:AffiliatedEntityMember2022-01-012022-12-310001889539crbg:GeneralServicesAgreementMembersrt:AffiliatedEntityMember2021-01-012021-12-310001889539crbg:GeneralServicesAgreementMembersrt:AffiliatedEntityMember2020-01-012020-12-310001889539srt:AffiliatedEntityMembercrbg:ReinsuranceTransactionsMember2022-12-310001889539srt:AffiliatedEntityMembercrbg:ReinsuranceTransactionsMember2021-12-310001889539srt:AffiliatedEntityMembercrbg:ReinsuranceTransactionsMember2022-01-012022-12-310001889539srt:AffiliatedEntityMembercrbg:ReinsuranceTransactionsMember2021-01-012021-12-310001889539srt:AffiliatedEntityMembercrbg:ReinsuranceTransactionsMember2020-01-012020-12-310001889539srt:AffiliatedEntityMembercrbg:CreditFacilitiesAndFundingArrangementsMember2022-12-310001889539srt:AffiliatedEntityMembercrbg:CreditFacilitiesAndFundingArrangementsMember2021-12-310001889539crbg:ExcludingFortitudeReFundWithheldAssetsMembersrt:AffiliatedEntityMembercrbg:CreditFacilitiesAndFundingArrangementsMember2022-01-012022-12-310001889539crbg:ExcludingFortitudeReFundWithheldAssetsMembersrt:AffiliatedEntityMembercrbg:CreditFacilitiesAndFundingArrangementsMember2021-01-012021-12-310001889539crbg:ExcludingFortitudeReFundWithheldAssetsMembersrt:AffiliatedEntityMembercrbg:CreditFacilitiesAndFundingArrangementsMember2020-01-012020-12-310001889539srt:AffiliatedEntityMembercrbg:PromissoryNotesMember2020-01-012020-03-310001889539srt:AffiliatedEntityMembercrbg:PromissoryNotesMember2021-11-300001889539crbg:PromissoryNotesMember2022-01-012022-12-310001889539crbg:AIGSpecialPurposesEntitiesMembercrbg:CorebridgeMemberus-gaap:CollateralizedDebtObligationsMembersrt:AffiliatedEntityMember2022-09-090001889539crbg:AIGSpecialPurposesEntitiesMembercrbg:CorebridgeMemberus-gaap:CollateralizedDebtObligationsMembersrt:AffiliatedEntityMember2022-09-092022-09-090001889539crbg:TaxSharingArrangementsMembercrbg:CorebridgeMembersrt:AffiliatedEntityMember2022-01-012022-12-310001889539crbg:TaxSharingArrangementsMembercrbg:CorebridgeMembersrt:AffiliatedEntityMember2021-01-012021-12-310001889539crbg:TaxSharingArrangementsMembercrbg:CorebridgeMembersrt:AffiliatedEntityMember2020-01-012020-12-310001889539crbg:TaxSharingArrangementsMembercrbg:SAFGCapitalLLCMembersrt:AffiliatedEntityMember2022-01-012022-12-310001889539crbg:TaxSharingArrangementsMembercrbg:SAFGCapitalLLCMembersrt:AffiliatedEntityMember2021-01-012021-12-310001889539crbg:TaxSharingArrangementsMembercrbg:SAFGCapitalLLCMembersrt:AffiliatedEntityMember2020-01-012020-12-310001889539crbg:TaxSharingArrangementsMembersrt:AffiliatedEntityMember2022-01-012022-12-310001889539crbg:TaxSharingArrangementsMembersrt:AffiliatedEntityMember2021-01-012021-12-310001889539crbg:TaxSharingArrangementsMembersrt:AffiliatedEntityMember2020-01-012020-12-310001889539us-gaap:TrustForBenefitOfEmployeesMember2022-12-310001889539us-gaap:TrustForBenefitOfEmployeesMember2021-12-310001889539srt:AffiliatedEntityMemberus-gaap:VariableInterestEntityPrimaryBeneficiaryMember2022-12-310001889539srt:AffiliatedEntityMemberus-gaap:VariableInterestEntityPrimaryBeneficiaryMember2021-12-310001889539srt:AffiliatedEntityMemberus-gaap:VariableInterestEntityPrimaryBeneficiaryMember2022-01-012022-12-310001889539srt:AffiliatedEntityMemberus-gaap:VariableInterestEntityPrimaryBeneficiaryMember2021-01-012021-12-310001889539srt:AffiliatedEntityMemberus-gaap:VariableInterestEntityPrimaryBeneficiaryMember2020-01-012020-12-31crbg:variableInterestEntity0001889539us-gaap:USTreasuryAndGovernmentMember2022-12-310001889539us-gaap:USStatesAndPoliticalSubdivisionsMember2022-12-310001889539us-gaap:ForeignGovernmentDebtMember2022-12-310001889539us-gaap:PublicUtilityBondsMember2022-12-310001889539us-gaap:AllOtherCorporateBondsMember2022-12-310001889539us-gaap:AssetBackedSecuritiesMember2022-12-310001889539us-gaap:PublicUtilitiesMember2022-12-310001889539us-gaap:BanksTrustAndInsuranceEquitiesMember2022-12-310001889539us-gaap:IndustrialMiscellaneousAndAllOthersMember2022-12-310001889539us-gaap:CommonStockMember2022-12-310001889539us-gaap:PreferredStockMember2022-12-310001889539us-gaap:MoneyMarketFundsMember2022-12-310001889539crbg:EquitySecuritiesAndMutualFundsMember2022-12-310001889539crbg:CommercialMortgagesMember2022-12-310001889539crbg:ResidentialMortgagesMember2022-12-310001889539crbg:LifeInsurancePolicyLoansMember2022-12-310001889539crbg:CommercialLoansOtherLoansAndNotesReceivableMember2022-12-310001889539crbg:MortgageAndOtherLoansReceivableMember2022-12-310001889539crbg:MortgageAndOtherLoansReceivableAllowanceMember2022-12-310001889539crbg:MortgageAndOtherLoansReceivableNetOfAllowanceMember2022-12-310001889539crbg:OtherInvestedAssetsMember2022-12-310001889539us-gaap:ShortTermInvestmentsMember2022-12-310001889539us-gaap:DerivativeMember2022-12-310001889539us-gaap:ResidentialMortgageBackedSecuritiesMember2022-12-310001889539crbg:OtherInvestedAssetsMembersrt:AffiliatedEntityMember2022-12-310001889539srt:AffiliatedEntityMemberus-gaap:DerivativeFinancialInstrumentsAssetsMember2022-12-310001889539us-gaap:DerivativeFinancialInstrumentsLiabilitiesMembersrt:AffiliatedEntityMember2022-12-310001889539srt:ParentCompanyMember2022-12-310001889539srt:ParentCompanyMember2021-12-310001889539srt:ParentCompanyMemberus-gaap:CommonClassAMember2021-12-310001889539srt:ParentCompanyMemberus-gaap:CommonClassBMember2021-12-310001889539srt:ParentCompanyMember2022-01-012022-12-310001889539srt:ParentCompanyMember2021-01-012021-12-310001889539srt:ParentCompanyMember2020-01-012020-12-310001889539srt:ParentCompanyMember2020-12-310001889539srt:ParentCompanyMember2019-12-310001889539crbg:AIGLifeLetterOfCreditMemberus-gaap:LineOfCreditMemberus-gaap:RevolvingCreditFacilityMember2022-12-310001889539crbg:IndividualRetirementSegmentMember2020-01-012020-12-310001889539crbg:GroupRetirementSegmentMember2020-01-012020-12-310001889539crbg:LifeInsuranceOperatingSegmentMember2020-01-012020-12-310001889539crbg:InstitutionalMarketsSegmentMember2020-01-012020-12-310001889539crbg:LongDurationInsuranceMember2022-01-012022-12-310001889539crbg:LifeInsuranceAndAnnuitiesMemberus-gaap:OperatingSegmentsMember2022-01-012022-12-310001889539crbg:AccidentAndHealthMemberus-gaap:OperatingSegmentsMember2022-01-012022-12-310001889539us-gaap:OperatingSegmentsMember2022-01-012022-12-310001889539crbg:LongDurationInsuranceMember2021-01-012021-12-310001889539crbg:LifeInsuranceAndAnnuitiesMemberus-gaap:OperatingSegmentsMember2021-01-012021-12-310001889539crbg:AccidentAndHealthMemberus-gaap:OperatingSegmentsMember2021-01-012021-12-310001889539us-gaap:OperatingSegmentsMember2021-01-012021-12-310001889539crbg:LongDurationInsuranceMember2020-01-012020-12-310001889539crbg:LifeInsuranceAndAnnuitiesMemberus-gaap:OperatingSegmentsMember2020-01-012020-12-310001889539crbg:AccidentAndHealthMemberus-gaap:OperatingSegmentsMember2020-01-012020-12-310001889539us-gaap:OperatingSegmentsMember2020-01-012020-12-3100018895392023-06-052023-06-05
Exhibit 99.1
Introductory note
Corebridge Financial, Inc. (“Corebridge Parent”) adopted targeted improvements to the accounting for long-duration contracts (the “standard” or “LDTI”) on January 1, 2023, with a transition date of January 1, 2021. The terms “Corebridge,” “we,” “us,” “our” or the “Company” mean Corebridge Parent and its consolidated or combined subsidiaries, unless the context refers to Corebridge Parent only.
Corebridge has recast certain information contained in its Annual Report on Form 10-K for the year ended December 31, 2022, originally filed with the Securities and Exchange Commission (the "SEC") on February 24, 2023 (“2022 Form 10-K”), as described in Item 8.01 of this Current Report on Form 8-K, to reflect the adoption of LDTI.
The sections of the 2022 Form 10-K that have been recast in their entirety are as follows:
a.Part I, Item 1. Business;
b.Part II, Item 7. Management’s Discussion and Analysis of Financial Condition and Results of Operations;
c.Part II, Item 7A. Quantitative and Qualitative Disclosures about Market Risk; and
d.Part II, Item 8. Financial Statements and Supplementary Data and Reference to Financial Statements and Schedules;
Those sections of the 2022 Form 10-K which have not been recast as set forth herein are not materially impacted by the Company’s adoption of LDTI described in this Current Report on Form 8-K. Accordingly, the recast information set forth in this Current Report on Form 8-K should be read in conjunction with the 2022 Form 10-K.
This Current Report on Form 8-K does not reflect events occurring after the February 24, 2023 filing date of the 2022 Form 10-K and does not modify or update the disclosures therein except to reflect the impacts of LDTI. For developments since the filing of the fiscal year 2022 Form 10-K, refer to Corebridge’s Quarterly Report on Form 10-Q for the quarter ended March 31, 2023, and its Current Reports on Form 8-K filed subsequent to the fiscal year 2022 Form 10-K.
Cautionary Statement Regarding Forward-Looking Information
This exhibit 99.1 to the Form 8-K (the "Recast 2022 Form 10-K") may include statements, which, to the extent they are not statements of historical or present fact, constitute “forward looking statements” within the meaning of the U.S. Private Securities Litigation Reform Act of 1995. Forward-looking statements can be identified by the use of terms such as “believes,” “expects,” “may,” “will,” “shall,” “should,” “would,” “could,” “seeks,” “aims,” “projects,” “is optimistic,” “intends,” “targets,” “plans,” “estimates,” “anticipates” or other comparable terms. Forward-looking statements include, without limitation, all matters that are not historical facts. They appear in a number of places throughout this Recast 2022 Form 10-K and include, without limitation, statements regarding our intentions, beliefs, assumptions or current plans and expectations concerning, among other things, financial position and future financial condition; results of operations; expected operating and non-operating relationships; ability to meet debt service obligations and financing plans; product sales; distribution channels; retention of business; investment yields and spreads; investment portfolio and ability to manage asset-liability cash flows; financial goals and targets; prospects; growth strategies or expectations; laws and regulations; customer retention; the outcome (by judgment or settlement) and costs of legal, administrative or regulatory proceedings, investigations or inspections, including, without limitation, collective, representative or class action litigation; the impact of our separation from AIG; the impact of the ongoing COVID-19 pandemic; geopolitical events, including the ongoing conflict in Ukraine; and the impact of prevailing capital markets and economic conditions.
Forward-looking statements are subject to known and unknown risks and uncertainties, many of which may be beyond our control. We caution you that forward-looking statements are not guarantees of future performance or outcomes and that actual performance and outcomes, including, without limitation, our actual results of operations, financial condition, liquidity and cash flows, and the development of the markets in which we operate, may differ materially from those made in or suggested by the forward-looking statements contained in this Recast 2022 Form 10-K. In addition, even if our results of operations, financial condition, liquidity and cash flows, and the development of the markets in which we operate, are consistent with the forward-looking statements contained in this Recast 2022 Form 10-K, those results or developments may not be indicative of results or developments in subsequent periods. A number of important factors, including, without limitation, the risks and uncertainties discussed in “Risk Factors” in our 2022 Form 10-K, for the year ended December 31, 2022 the (“2022 Form 10-K”) and “Management’s Discussion and Analysis of Financial Condition and Results of Operations” in this Recast 2022 Form 10-K could cause actual results and outcomes to differ materially from those reflected in the forward-looking statements. Factors that could cause actual results and outcomes to differ from those reflected in forward-looking statements include, without limitation:
•changes in interest rates and changes to credit spreads,
•the deterioration of economic conditions, the likelihood of a recession, changes in market conditions, weakening in capital markets, volatility in equity markets, the rise of inflation, pressures on the commercial real estate market, recent stress in the banking sector, uncertainty regarding the U.S. federal government’s debt limit and geopolitical tensions, including the continued armed conflict between Ukraine and Russia;
•uncertainty related to the impact of COVID-19;
•the unpredictability of the amount and timing of insurance liability claims;
•unavailable, uneconomical or inadequate reinsurance or recaptures of reinsured liabilities;
•uncertainty and unpredictability related to our reinsurance agreements with Fortitude Re and its performance of its obligations under these agreements;
•our limited ability to access funds from our subsidiaries;
•our potential inability to refinance all or a portion of our indebtedness or to obtain additional financing;
•our inability to generate cash to meet our needs due to the illiquidity of some of our investments;
•the inaccuracy of the methodologies, estimations and assumptions underlying our valuation of investments and derivatives;
•a downgrade in our Insurer Financial Strength (“IFS”) ratings or credit ratings;
•potential adverse impact to liquidity and other risks due to our participation in a securities lending program and a repurchase program;
•exposure to credit risk due to non-performance or defaults by our counterparties or our use of derivative instruments to hedge market risks associated with our liabilities;
•our ability to adequately assess risks and estimate losses related to the pricing of our products;
•the failure of third parties that we rely upon to provide and adequately perform certain business, operations, investment advisory, functional support and administrative services on our behalf;
•our inability to maintain the availability of critical technology systems and the confidentiality of our data;
•the ineffectiveness of our risk management policies and procedures;
•significant legal, governmental or regulatory proceedings;
•the ineffectiveness of our business strategy in accomplishing our objectives;
•the intense competition we face in each of our business lines and the technological changes that may present new and intensified challenges to our business;
•catastrophes, including those associated with climate change and pandemics;
•material changes to, or termination of, our investment advisory arrangements with AIG and Fortitude Re;
•changes in accounting principles and financial reporting requirements;
•our foreign operations, which may expose us to risks that may affect our operations;
•business or asset acquisitions and dispositions that may expose us to certain risks;
•our ability to compete effectively in a heavily regulated industry in light of new domestic or international laws and regulations or new interpretations of current laws and regulations;
•challenges associated with a variety of privacy and information security laws;
•impact on sales of our products and taxation of our operations due to changes in U.S. federal income or other tax laws or the interpretation of tax laws;
•our potential to be deemed an “investment company” under the Investment Company Act;
•differences between actual experience and the estimates used in the preparation of financial statements and modeled results used in various areas of our business;
•the ineffectiveness of our productivity improvement initiatives in yielding our expected expense reductions and improvements in operational and organizational efficiency;
•recognition of an impairment of our goodwill or the establishment of an additional valuation allowance against our deferred income tax assets as a result of our business lines underperforming or their estimated fair values declining;
•our inability to attract and retain key employees and highly skilled people needed to support our business;
•the impact of risks associated with our arrangements with Blackstone IM including risks related to limitations on our ability to terminate the Blackstone IM arrangements and related to our exclusive arrangements with Blackstone IM in relation to certain asset classes;
•the historical performance of AMG, Blackstone IM, BlackRock or any other external asset manager we retain not being indicative of the future results of our investment portfolio;
•challenges related to management of our investment portfolio due to increased regulation or scrutiny of investment advisers;
•our failure to replicate or replace functions, systems and infrastructure provided by AIG (including through shared service contracts) or our loss of benefits from AIG’s global contracts, and AIG’s failure to perform the services provided for in the Transition Services Agreement;
•the significant influence that AIG has over us and conflicts of interests arising due to such relationship;
•potentially higher U.S. federal income taxes due to our inability to file a single U.S. consolidated federal income tax return for five years following the IPO and our separation from AIG causing an “ownership change” for U.S. federal income tax purposes;
•risks associated with the Tax Matters Agreement with AIG and our potential liability for U.S. income taxes of the entire AIG Consolidated Tax Group for all taxable years or portions thereof in which we (or our subsidiaries) were members of such group;
•certain provisions in our Organizational Documents;
•volatility in or declines in the market price of our common stock; and
•applicable insurance laws, which could make it difficult to effect a change of control of our company.
Other risks, uncertainties and factors, including those discussed in “Risk Factors” in the 2022 Form 10-K, could cause our actual results to differ materially from those projected in any forward-looking statements we make. You should read carefully the factors described in “Risk Factors” to better understand the risks and uncertainties inherent in our business and underlying any forward-looking statements.
You should read this Recast 2022 Form 10-K completely and with the understanding that actual future results may be materially different from expectations. All forward-looking statements made in this Recast 2022 Form 10-K are qualified by these cautionary statements. These forward-looking statements are made only as of the date of this Recast 2022 Form 10-K, and we do not undertake any obligation to update or revise any forward-looking statements to reflect the occurrence of events, unanticipated or otherwise, other than as may be required by law.
COREBRIDGE FINANCIAL, INC.
TABLE OF CONTENTS
| | | | | | | | | | | |
| Item Number | Description | Page |
|
| | |
| | |
| | |
| | |
| | |
| | |
| | |
| | |
| | | |
| | | |
| | | |
| | | |
| | | |
| | | |
| | | |
| | | |
| | | |
| | | |
| | | |
| | | |
| | | |
| | | |
| | | |
| | | |
| | |
| | |
| | |
| | |
| | |
| | |
| | |
| | |
| | |
| | |
| | |
| | |
| | |
| | |
| | |
|
| | |
| | |
| | |
| | |
| | |
| |
| | | |
| Part I |
| Business | |
| | |
| | |
| | |
| | |
| | |
| | |
| | |
| | |
| | |
| | |
| | |
| | |
| | |
| | |
| | |
| | |
| | |
| Part II |
| | |
| | |
| Management’s Discussion and Analysis of Financial Condition and Results of Operations | |
| •Executive Summary | |
| •Use of Non-GAAP Measures | |
| •Key Operating Metrics | |
| •Consolidated Results of Operations | |
| •Business Segment Operations | |
| •Investments | |
| •Future Policy Benefits, Policyholder Contract Deposits and Market Risk Benefits | |
| •Liquidity and Capital Resources | |
| •Accounting Policies and Pronouncements | |
| •Glossary | |
| •Certain Important Terms | |
| •Acronyms | |
| Quantitative and Qualitative Disclosures About Market Risk | |
| Financial Statements and Supplementary Data | |
| Reference to Financial Statements and Schedules | |
| | |
| | |
| | |
| | |
|
| | |
| | |
| | |
| | |
| | |
|
| | |
| | |
| |
Part I
Item 1. | Business
Index to Business
Our Company
OVERVIEW
We are one of the largest providers of retirement solutions and insurance products in the United States, committed to helping individuals plan, save for and achieve secure financial futures. Our addressable markets are large, with powerful, long-term secular trends given an aging U.S. population and a growing need for retirement solutions. We offer a broad set of products and services through our market leading Individual Retirement, Group Retirement, Life Insurance and Institutional Markets businesses, each of which features capabilities and industry experience we believe are difficult to replicate. These four businesses collectively seek to enhance stockholder returns while maintaining our attractive risk profile, which has historically resulted in consistent and strong cash flow generation.
Our strong competitive position is supported by:
•our scaled platform and position as a leading life and annuity company across a broad range of products, managing or administering $357.2 billion in client assets as of December 31, 2022;
•our four businesses, which provide a diversified and attractive mix of spread income, fee income and underwriting margin;
•our broad distribution platform, which gives us access to end customers, consultants, retirement plan sponsors, banks, broker-dealers, general agencies, independent marketing organizations and independent insurance agents;
•our proven expertise in product design, which positions us to optimize risk-adjusted returns as we grow our business;
•our strategic partnership with Blackstone, which we believe will allow us to further grow both our retail and institutional product lines, and enhance risk-adjusted returns;
•our high-quality liability profile, supported by our strong balance sheet and disciplined approach to risk management, which has limited our exposure to product features and portfolios with less attractive risk-adjusted returns;
•our ability to deliver consistent cash flows and an attractive return for our stockholders; and
•our strong and experienced senior management team.
Operating four established, at-scale businesses positions us to optimize risk-adjusted returns when writing new business across our broad suite of market-leading products. According to LIMRA, we are the only company to rank in the top two in U.S. annuity sales in each of the last ten years through the twelve months ended September 30, 2022, with leading positions across each of the fixed, fixed index and variable annuity categories. Our Group Retirement business is recognized as a pioneer and has long held a leading position in the attractive 403(b) retirement plan market through our Corebridge Financial Retirement Services brand. We ranked eighth in U.S. term life insurance sales for the twelve months ended September 30, 2022. Our Institutional Markets business provides sophisticated and bespoke risk management solutions to both financial and non-financial institutions.
We believe we have an attractive business mix that balances spread-based income, fee income and underwriting margin sources and is diversified across our broad product suite. For the year ended December 31, 2022, our businesses generated spread income of $3.2 billion, fee income of $2.0 billion and underwriting margin of $1.6 billion, resulting in a balanced mix of 47%, 29% and 24%, respectively, among these income sources. We are well-diversified across our operating businesses with our Individual Retirement, Group Retirement, Life Insurance and Institutional Markets businesses representing 30%, 15%, 27% and 23% of total adjusted revenue, respectively, for the year ended December 31, 2022.
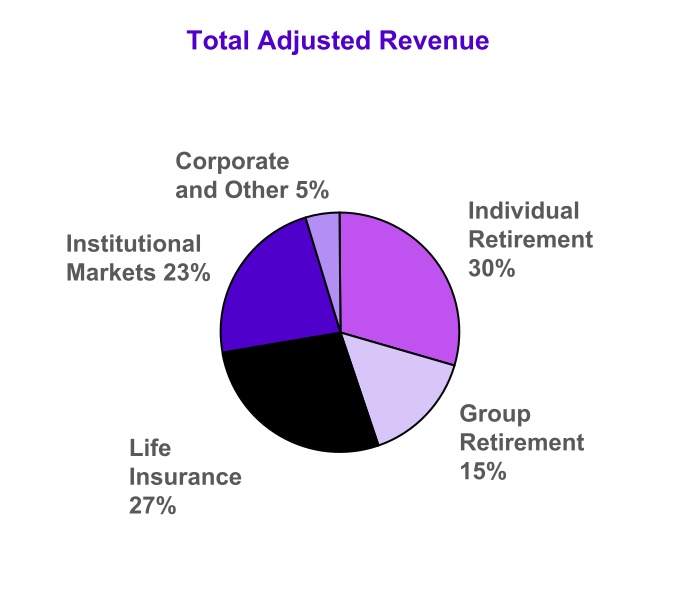
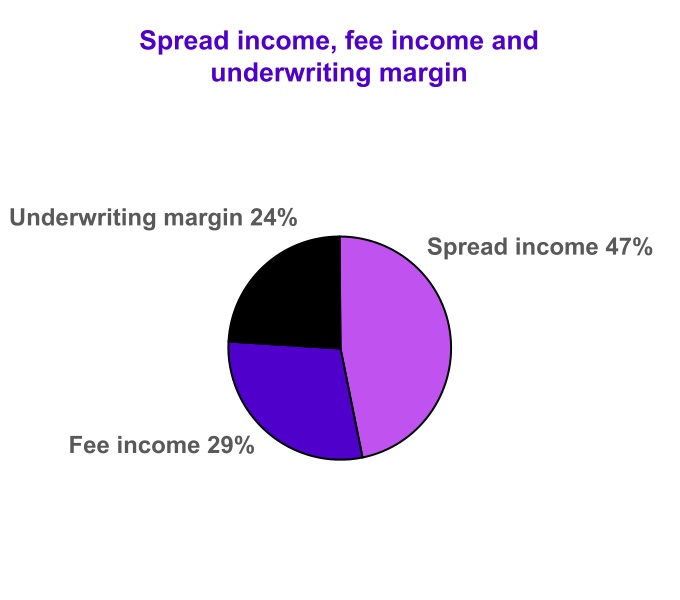
Our diversified business model is enabled by our long-standing distribution relationships that are distinguished through both their breadth and depth. We have a large distribution platform in the U.S. life and retirement market, with a wide range of relationships with financial advisors, insurance agents and plan sponsors, as well as our own employee financial advisors and direct-to-consumer platform. Corebridge Financial Distributors (“Corebridge FD”), our sales platform, serves as a valuable partner to our third-party distributors, including banks, broker-dealers, general agencies, independent marketing organizations and independent insurance agents. Many of our partners have sold our products for multiple decades, and for the twelve months ended June 30, 2022, our top 25 partners generated approximately 13% of their total sales volume through our products. We also provide customized products and services to help meet consumer needs. As of December 31, 2022, our Group Retirement business subsidiary, broker-dealer VALIC Financial Advisors, has approximately 1,300 registered professionals, of which approximately 1,100 are employee financial advisors that provide us with the opportunity, as permitted by employer guidelines, to work with approximately 1.7 million individuals in employer-defined contribution plans (“in-plan”) and over 300,000 individuals outside of the traditional employer-sponsored pension plans (“out-of-plan”), approximately 100,000 of whom also retain assets in-plan. Our financial advisors are positioned to guide and educate individuals as they invest through employer programs, and to build relationships resulting in the continued provision of advice and guidance over the course of their savings and retirement journey. The strength of our model and these relationships is illustrated by our strong client retention rate of approximately 93% for the year ended December 31, 2022.
A disciplined approach to investment management is at the core of our business. We believe our strategic partnership with Blackstone will allow us to leverage Blackstone’s ability to originate attractive and privately sourced fixed-income oriented assets that we believe are well suited for liability-driven investing within an insurance company framework. Additionally, we believe BlackRock's scale and fee structure make BlackRock an excellent outsourcing partner for certain asset classes and will allow us to further optimize our investment management operating model while improving overall performance.
We believe we have a strong balance sheet that has resulted from disciplined growth and effective and prudent risk management practices. We have employed a consistent, disciplined approach to product design and risk selection, resulting in a high-quality liability profile. Our broad retail and institutional product suite allows us to be selective in liability origination, and our ability to quickly refine our offerings in response to market dynamics allows us to be opportunistic when we identify areas of attractive risk-adjusted returns. We have a well-managed annuity liability portfolio, with product structures and hedging strategies designed to manage our exposure to guaranteed benefits. The majority of our individual fixed and fixed index annuities, which represent approximately 60% of our Individual Retirement assets under management and administration (“AUMA”) as of December 31, 2022, have no exposure to optional living or death benefits. Our individual variable annuities with living benefits, which represent approximately 31% of our Individual Retirement AUMA as of December 31, 2022, were predominantly originated after the 2008 financial crisis. As of December 31, 2022, 96% of our Group Retirement variable annuities have no living benefits. We have also fully reinsured our limited exposure to long-term care (“LTC”) policies. As of December 31, 2022, the net universal life policies with secondary guarantees (“ULSG”) liability of $2.9 billion represents approximately 1% of net insurance liabilities. We employ an efficient hedging program, asset-liability matching practices and the use of reinsurance to manage our balance sheet and risk exposure. We believe our strong risk management framework will continue to help us manage market volatility, optimize our capital and produce attractive stockholder returns.
We believe that our strong competitive position and our enhanced focus on growth as a stand-alone company position us well to capitalize on compelling structural changes in the life and retirement market. We expect our target market of individuals planning for
retirement to continue to grow, with the size of the U.S. population age 65 and over expected to increase by approximately 30% by 2030 from 2020. In addition, we believe that reduced employer-paid retirement benefits will drive an increasing need for our individual retirement solutions. Further, consumers in the United States continue to prefer purchasing life insurance and retirement products through an agent or advisor, which positions us favorably given our broad distribution platform and in-house advice capabilities. We continue to see opportunities to develop new products and adapt our existing products to the growing needs of individuals to plan, save for and achieve secure financial futures. In addition, our presence in the growing pension risk transfer (“PRT”) market, both in the United States and internationally, provides us with opportunities to assist employers that choose to close and transfer obligations under their defined benefit plans.
OUR BUSINESSES
Our businesses share common commitments to customer value and disciplined pricing, and each business benefits from enterprise-wide risk management infrastructure, investment management capabilities, hedging strategies and administrative platforms. We have four operating businesses:
•Individual Retirement — Through the twelve months ended September 30, 2022, we are a leading provider in the over $286.2 billion individual annuity market across a range of product types, including fixed, fixed index and variable annuities, with $15.1 billion in premiums and deposits for the year ended December 31, 2022. We offer a variety of optional benefits within these products, including lifetime income guarantees and death benefits. Our broad and scaled product offerings and operating platform have allowed our company to rank in the top two in total individual annuity sales in each of the last ten years through the twelve months ended September 30, 2022 and we are the only top 10 annuity provider with a balanced mix of products across all major annuity categories according to LIMRA. Our strong distribution relationships and broad multi-product offerings allow us to quickly adapt to respond to shifting customer needs and economic and competitive dynamics, targeting areas where we see the greatest opportunity for risk-adjusted returns. We are well-positioned for growth due to demographic trends in the U.S. retirement market, supported by our strong platform. Our Individual Retirement business is the largest contributor to our earnings, historically generating consistent spread and fee income.
•Group Retirement — Known in the market as Retirement Services, we are a leading provider of retirement plans and services to employees of tax-exempt and public sector organizations within the K-12, higher education, healthcare, government and other tax-exempt markets, having ranked third in K-12 schools, fourth in higher education institutions, fifth in healthcare institutions and fifth in government institutions by total assets as of September 30, 2022. According to Cerulli Associates Inc. (“Cerulli Associates”), the size of the not-for-profit defined contribution retirement plan market, excluding the Federal Thrift Savings Plan, was $2.0 trillion at the end of 2021. As of December 31, 2022, we work with approximately 1.7 million individuals through our in-plan products and services and over 300,000 individuals through our out-of-plan products and services approximately 100,000 of whom also retain assets in-plan. Our out-of-plan solutions and capabilities include proprietary and limited non-proprietary annuities, financial planning, brokerage and advisory services. We offer financial planning advice to employees participating in retirement plans through our employee financial advisors. These advisors allow us to develop long-term relationships with our clients by engaging with them early in their careers and providing customized solutions, education and support. Approximately 27% of our individual customers have been customers of our Group Retirement business for more than 20 years and the average length of our relationships with plan sponsors is nearly 28 years. Our Group Retirement business generates a combination of spread and fee income. While the revenue mix remains balanced, we have grown our advisory and brokerage fee revenue over the last several years, which provides a less capital-intensive stream of cash flows.
•Life Insurance — We offer a range of life insurance and protection solutions in the approximately $206 billion U.S. life insurance market (based on last twelve-months direct premiums) as of September 30, 2022, according to the S&P Global Inc., with a growing international presence in the UK and Ireland. We are a key player in the term, index universal life and smaller face whole life markets, ranking as a top 25 seller of term, universal and whole life products for the twelve months ended September 30, 2022. Our competitive and flexible product suite is designed to meet the needs of our customers, and we actively participate in product lines that we believe have attractive growth and margin prospects. Further, we have strong third-party distribution relationships and a long history in the direct-to-consumer market, providing us with access to a broad range of customers from the middle market to high net worth. We have also been working to automate certain underwriting reviews so as to make decisions on applications without human intervention, and we reached a decision on approximately 57% of all underwriting applications in 2022 on an automated basis. As of December 31, 2022, we had approximately 4.4 million in-force life insurance policies in the United States, net of those ceded to Fortitude Re. Our Life Insurance product portfolio generates returns through underwriting margin.
•Institutional Markets — We serve the institutional life and retirement insurance market with an array of products that include PRT, corporate-owned life insurance (“COLI”) and bank-owned life insurance (“BOLI”), stable value wraps and structured settlements. We also offer guaranteed investment contracts (“GICs”), including our funding agreement-backed
note (“FABN”) program. We provide sophisticated, bespoke risk management solutions to both financial and non-financial institutions. Historically, a small number of incremental transactions have enabled us to generate significant new business volumes, providing a meaningful contribution to earnings, while maintaining a small and efficient operational footprint. Our Institutional Markets products generate earnings primarily through net investment spread, with a smaller portion of fee-based income and underwriting margin.
The following table summarizes our total net insurance liabilities for our four operating businesses as of December 31, 2022:
| | | | | | | | | | | | | | | | | |
| ($ in billions) | Individual
Retirement | Group
Retirement | Life | Institutional
Markets | Total |
| Fixed Annuities | $ | 50.2 | | $ | — | | $ | — | | $ | — | | $ | 50.2 | |
| Fixed Index Annuities | 33.2 | | — | | — | | — | | 33.2 | |
| Variable Annuities | 54.6 | | — | | — | | — | | 54.6 | |
In-plan(a) | — | | 51.0 | | — | | — | | 51.0 | |
| Out-of-plan Variable Annuities | — | | 18.3 | | — | | — | | 18.3 | |
| Out-of-plan Fixed and Fixed Index Annuities | — | | 8.8 | | — | | — | | 8.8 | |
| Traditional Life | — | | — | | 9.0 | | — | | 9.0 | |
| Universal Life | — | | — | | 14.0 | | — | | 14.0 | |
| International Life | — | | — | | 0.2 | | — | | 0.2 | |
| Pension Risk Transfer | — | | — | | — | | 11.4 | | 11.4 | |
| Structured Settlements | — | | — | | — | | 3.5 | | 3.5 | |
| Guaranteed Investment Contracts | — | | — | | — | | 8.0 | | 8.0 | |
Other(b) | — | | — | | — | | 7.2 | | 7.2 | |
| Total | $ | 138.0 | | $ | 78.1 | | $ | 23.2 | | $ | 30.1 | | $ | 269.4 | |
(a) Includes in-plan fixed deferred annuities and in-plan variable annuities.
(b) Includes Corporate Markets products, including corporate- and bank-owned life insurance (“COLI-BOLI”), private placement variable universal life insurance and private placement variable annuity products.
OUR DISTRIBUTION PLATFORM
We have built a leading distribution platform through a range of partnerships. Our distribution platform includes banks, broker-dealers, general agencies, independent marketing organizations and independent insurance agents, as well as our employee financial advisors, plan consultants, employers, specialized agents and a direct-to-consumer platform. We believe our distribution relationships are difficult to replicate and are strengthened by the breadth of our product offerings and long history of partnership. This platform includes:
•Corebridge FD — As of December 31, 2022, we have a specialized team of approximately 450 sales professionals who partner with and grow our non-affiliated distribution on our broad platform, which includes banks, broker-dealers, general agencies, independent marketing organizations and independent insurance agents.
•AIG Direct — Our life direct-to-consumer platform primarily markets to middle market consumers through a variety of direct channels, including several types of digital channels, such as search advertising, display advertising and email, as well as direct mail.
•Group Retirement — We have a broad team of relationship managers, business development professionals and distribution leaders that focus on acquiring, serving and retaining retirement plans. Our subsidiary broker-dealer, VALIC Financial Advisors, has approximately 1,300 registered professionals, of which approximately 1,100 are employee financial advisors as of December 31, 2022.These registered professionals and employee financial advisors support our Group Retirement business by focusing on enrollments, education and providing financial guidance to individuals in-plan and offering wealth management advice and solutions to individuals that have investments out-of-plan.
•Institutional Relationships — We have strong relationships with insurance brokers, bankers, asset managers, pension consultants and specialized agents who serve as intermediaries in our institutional business.
The following chart presents our sales by distribution channel for the year ended December 31, 2022, including premiums, deposits and other consideration for Individual Retirement and Group Retirement and sales on a periodic basis for Life Insurance*, excluding contributions from retail mutual funds, and AIG Direct:
* Life Insurance sales, excluding contributions from AIG Direct totaled $251 million through the independent agents channel for the year ended December 31, 2022.
OUR STRATEGIC PARTNERSHIP WITH BLACKSTONE
In November 2021, we entered into a strategic partnership with Blackstone that we believe has the potential to yield significant economic and strategic benefits over time. We believe that Blackstone’s ability to originate attractive and privately sourced, fixed-income oriented assets, will be accretive to our businesses and provide us with an enhanced competitive advantage.
Pursuant to the partnership, we initially transferred management of $50 billion of our existing investment portfolio. Beginning in the fourth quarter of 2022, we transferred an additional $2.1 billion to Blackstone. The amount managed by Blackstone will increase to $92.5 billion by the third quarter of 2027.
As of December 31, 2022, the book value of the assets managed by Blackstone was approximately $48.9 billion. We expect Blackstone to invest these assets primarily in Blackstone-originated investments across a range of asset classes, including private and structured credit, and commercial and residential real estate securitized and whole loans. Blackstone’s preferred credit and lending strategy is to seek to control all significant components of the underwriting and pricing processes with the goal of facilitating bespoke opportunities with historically strong credit protection and attractive risk-adjusted returns. Blackstone seeks to capture enhanced economics to those available in the traditional fixed income markets by going directly to the lending source.
As part of our partnership, Blackstone acquired a 9.9% position in our common stock, aligning its economic interests with our stockholders. This $2.2 billion investment represented the largest corporate investment in Blackstone’s firm history.
OUR INVESTMENT MANAGEMENT AGREEMENTS WITH BLACKROCK
Under the investment management agreements with BlackRock (collectively referred to herein as the “BlackRock Agreements”, we have completed the transfer of the management of approximately $82.4 billion in book value of liquid fixed income and certain private placement assets in the aggregate to BlackRock as of December 31, 2022. In addition, liquid fixed income assets associated with Fortitude Re portfolio were separately transferred to BlackRock. The BlackRock Agreements provide us with access to market-leading capabilities, including portfolio management, research and tactical strategies in addition to a larger pool of investment professionals. We believe BlackRock’s scale and fee structure make BlackRock an excellent outsourcing partner for certain asset classes and will allow us to further optimize our investment management operating model while improving overall performance. See “Investment Management—Our Investment Management Agreements with BlackRock.”
OUR HISTORICAL RESULTS AND CAPITAL MANAGEMENT
Our diversified businesses have historically provided a source of capital generation through a combination of spread income, fee income and underwriting margin and have historically provided stability through market cycles. Our statutory capital position has been strengthened by our consistent capital generation, and our Life Fleet RBC ratio, although not yet filed is, expected to be above our minimum target Life Fleet RBC ratio of 400% as of December 31, 2022. We intend to allocate excess capital opportunistically to invest in our business and return capital to stockholders while maintaining a strong ratings profile. The adoption of LDTI does not impact our statutory capital position.
We believe that several market dynamics will drive significant demand for our products and services. These dynamics include the aging of the U.S. population and the resulting generational wealth transfer, the strong consumer preference for financial planning advice, the continued reduction of corporate defined benefit plans and the significant life insurance protection gap for consumers. We believe our businesses are well-positioned to capitalize on the opportunities presented by these long-term trends.
LARGE AND GROWING RETIREMENT-AGED POPULATION IN THE U.S.
According to the U.S. Census Bureau, there were approximately 56 million Americans age 65 and older in 2020, representing 17% of the U.S. population. By 2030, this segment of the population is expected to increase by 17 million, or 30%, to approximately 73 million Americans, representing 21% of the U.S. population. Technological advances and improvements in healthcare are projected (notwithstanding near-term COVID-19 impacts) to continue to contribute to increasing average life expectancy. Accordingly, aging individuals must be prepared to fund retirement periods that will last longer than those of previous generations. We believe these longer retirement periods will result in increased demand for our retirement products. Further, Cerulli Associates estimates that by the end of 2045, $84.4 trillion will change hands from aging households passing on their wealth, providing a significant opportunity for our annuities, life insurance and investment products.
Source: U.S. Census Bureau
STRONG CONSUMER PREFERENCE FOR FINANCIAL PLANNING ADVICE
According to LIMRA, U.S. consumers continue to favor purchasing life insurance in person through an agent or advisor compared to another channel, with 96.4% of annuities being purchased through financial professionals for the twelve months ended September 30, 2022, despite the impact of the COVID-19 pandemic. According to Cerulli Associates, 26% of U.S. retirees prefer to seek retirement advice from financial professionals, the most popular avenue for retirement advice in this demographic, and 16% of active 401(k) participants prefer to engage financial professionals for retirement planning. Also, according to Cerulli Associates, financial professionals are the most popular option for retirement planning services for those participants with $250,000 or more in assets, and more than 30% of those participants with $500,000 or more in assets prefer to receive retirement advice from a financial professional. Due to the complexity of financial planning, we believe that many consumers will continue to seek advice in connection with the purchase of our products, providing a competitive advantage to our broad distribution platforms and in-house advice capabilities.
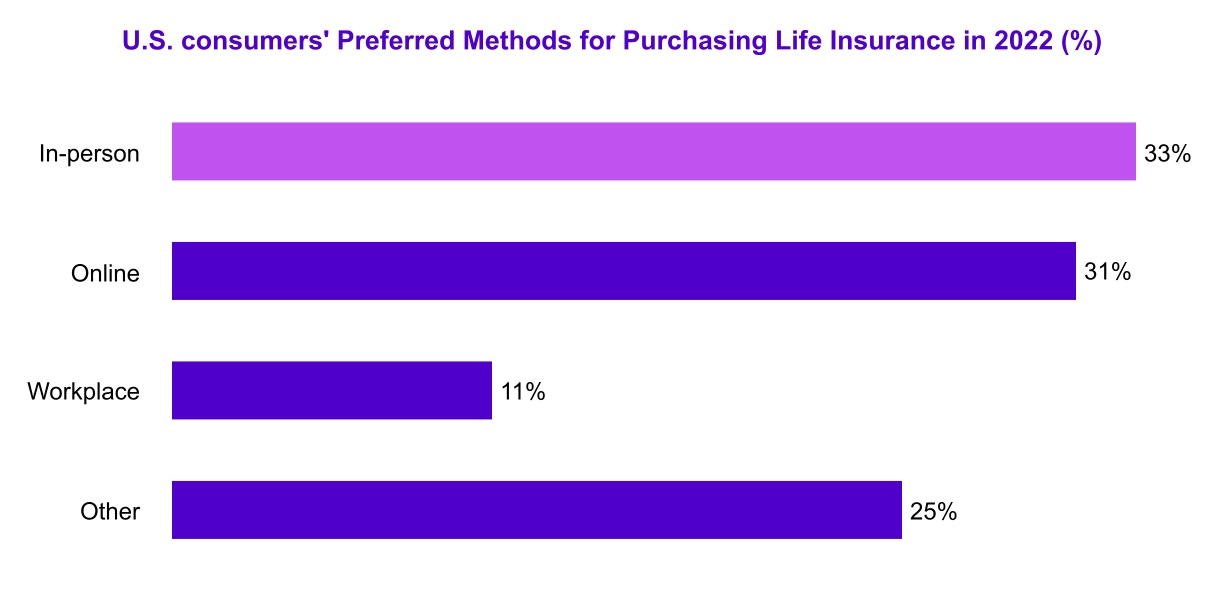
Source: LIMRA
REDUCED CORPORATE SAFETY NET
According to the Employee Benefits Research Institute, the percentage of private-sector wage and salary workers participating in only a defined benefit pension plan decreased from 28% in 1979 to just 1% in 2019. By contrast, the percentage participating in only defined contribution pension plans jumped from 7% to 41%. These statistics demonstrate the increasing need for individuals to seek private solutions to retirement planning and lifetime income. We believe that the dramatic and continuous shift of private-sector worker plan coverage will drive continued demand for our products and expertise. In addition, as more employers look to transfer some or all of their obligations to pay retirement benefits related to defined benefit plans, the domestic PRT market has grown from $3.8 billion in premiums in 2013 to $56.6 billion in the twelve months ended September 30, 2022, according to LIMRA, a trend that we expect to continue.
Source: U.S. Department of Labor Form 5500 Summaries through 1999. EBRI estimates 2000-2019 using Bureau of Labor Statistics, Current Population Survey, and U.S. Department of Labor data.
GROWING LIFE INSURANCE PROTECTION GAP AND INCREASED AWARENESS OF LIFE INSURANCE NEED DUE TO THE COVID-19 PANDEMIC
According to LIMRA, 50% of American adults surveyed in 2022 did not own any form of life insurance, an increase of two percentage points from 2021 and 10 percentage points from 2016. Further, 68% of respondents said they need life insurance, representing an 18% “life insurance protection gap,” equal to twice the amount recorded in 2019. Against this trend, almost one-third of Americans (31%) say they are more likely to purchase coverage because of the pandemic, according to LIMRA. We believe the COVID-19 pandemic has highlighted the importance of our protection products.
Our Competitive Strengths SCALED PLATFORM WITH LEADING POSITIONS ACROSS A BROAD SUITE OF PRODUCT
Our scaled businesses collectively manage $357.2 billion of AUMA as of December 31, 2022, and we generated $31.6 billion of premiums and deposits and $2.0 billion in fee income for the year ended December 31, 2022. We had approximately $11.7 billion of statutory capital and surplus as of September 30, 2022, which makes us the seventh largest life and annuity company in the United States among reporting companies. We have $23.4 billion of Adjusted Book Value as of December 31, 2022. We believe our scale provides us with significant operating and competitive advantages, including our importance to our distribution partners and our ability to utilize investments in technological and operational efficiencies to benefit customers.
We maintain leading positions across multiple products and we have in many cases held these leading positions for decades. According to LIMRA, we ranked first and second in total annuity sales for the twelve months ended September 30, 2022 and year ended December 31, 2021, respectively, while ranking fourth, third and seventh across fixed, fixed index and variable annuities, respectively, for the twelve months ended September 30, 2022. We hold top five market positions in K-12 education, higher education, healthcare institutions and government group retirement assets as of September 30, 2022. In recent years, we have also experienced significant growth in advisory-based assets across both in-plan and out-of-plan products. In addition, for the twelve months ended September 30, 2022 we ranked eighth in U.S. term life insurance sales.
Our breadth of products allows us to manage our businesses to prioritize value over volume. We have the flexibility to allocate resources towards areas that we believe present the highest available risk-adjusted returns across our portfolio. We manage sales of our portfolio of products and services based on consumer demand and our view of profitability and risk across the markets in which we compete. We believe that this approach allows us to deliver consistent performance over time through a wide range of economic conditions and market environments.
DIVERSIFIED AND ATTRACTIVE BUSINESS MIX
Our business mix is well-balanced by both product type and revenue source. For the year ended December 31, 2022, we generated $5.1 billion in premiums, $2.9 billion in policy fees and $8.7 billion in net investment income excluding Fortitude Re funds withheld assets, contributing to a total of $24.7 billion in total revenue, including Fortitude Re. Our adjusted revenue is spread across our four operating businesses with Individual Retirement, Group Retirement, Life Insurance and Institutional Markets accounting for 30%, 15%, 27% and 23%, respectively, for the year ended December 31, 2022.
Our diversified business model generates earnings through a combination of spread income, fee income and underwriting margin. For the year ended December 31, 2022, our spread-based income totaled $3.2 billion, our fee-based income totaled $2.0 billion and our underwriting margin was $1.6 billion, providing a balanced mix of 47% spread-based income, 29% fee-based income and 24% underwriting margin, in each case as a percentage of the total of these income sources. For further discussion regarding our earnings, see “Management’s Discussion and Analysis of Financial Condition and Results of Operations—Use of Non-GAAP Financial Measures and Key Operating Metrics—Key Operating Metrics—Fee and Spread Income and Underwriting Margin.”
BROAD DISTRIBUTION PLATFORM GIVING US ACCESS TO CUSTOMERS AND FINANCIAL INTERMEDIARIES
We have a leading distribution platform with a range of partnerships and capabilities across the value chain and a culture of focus on the customer. We believe our distribution relationships are strengthened by the breadth of our product offerings and our high-touch client services. Our distribution capabilities include:
•Corebridge FD had approximately 450 specialized sales professionals as of December 31, 2022 that leverage our strategic account relationships and other partnerships to address multiple client needs. This platform is primarily focused on our non-affiliated distribution through banks, broker-dealers and independent marketing organizations, and specializes in aligning our robust product offering of over 160 life and annuity products with individual partner preferences, reaching independent advisors, agencies and other firms. Corebridge FD primarily facilitates distribution for our Individual Retirement and Life Insurance businesses, including providing certain partners a unified coverage model that allows for distribution of both our life insurance and annuity products.
•Individual Retirement maintains a growing multi-channel distribution footprint built on long-term relationships. As of December 31, 2022, our footprint included over 23,000 advisors and agents actively selling our annuities in the prior twelve months, accessed through long-term relationships with approximately 630 firms distributing our annuity products. These advisors and agents included approximately 9,700 new producers who sold our annuity products for the first time in 2022.
•Life Insurance has a well-balanced distribution footprint that reaches approximately 33,000 independent agents as of December 31, 2022, who actively sell our life insurance solutions, through diverse independent channels as well as a direct-to-consumer model. We had access to approximately 950 MGAs and BGAs as of December 31, 2022. In addition to our non-affiliated distribution, our life insurance policies are sold through AIG Direct, our direct-to-consumer brand with approximately 130 active agents as of December 31, 2022, which represented approximately 11% of our life insurance sales for the year ended December 31, 2022.
•Group Retirement known in the marketplace as Retirement Services, is supported by a broad team of relationship managers, business development professionals and distribution leaders that focus on acquiring, serving and retaining retirement plans with over 22,000 plan sponsor relationships as of December 31, 2022. Our sales force of approximately 1,300 registered professionals, as of December 31, 2022, comprises experienced field and phone-based financial professionals, retirement plan consultants and experienced financial planners with an average of nearly 10 years of tenure with VALIC Financial Advisors. These financial professionals provide education, financial planning and retirement advice to individuals participating in their employer-sponsored plan. Due to the relationships built with individuals and employers, our financial professionals can, as permitted by employer guidelines, build broad relationships to provide financial planning, advisory and retirement solutions to approximately 1.7 million individuals through our in-plan products and services and over 300,000 individuals through our out-of-plan products and services (approximately 100,000 of whom also retain assets in one of our Group Retirement plans), as of December 31, 2022.
•Institutional Markets largely writes bespoke transactions and works with a broad range of consultants and brokers, maintaining relationships with insurance brokers, bankers, asset managers and specialized agents who serve as intermediaries.
We focus on maintaining strong and longstanding relationships with our partners and seek to grow our volumes with intermediaries. For the twelve months ended June 30, 2022, we represented approximately 13% on average of the total sales volume of our top 25 third-party distribution partners for our annuities. These partners have been with our platform for an average of approximately 25 years, with 9 of them for 30 years or more as of December 31, 2022. Each of our distribution platforms has a different strategy. For example, our wholesale operations, through Corebridge FD, provide high-touch customer service to our intermediaries and seek to help them grow in tandem with our business, while our VALIC Financial Advisors allow us to develop deep and trust-centered relationships directly with individuals to support their broader retirement, investment and insurance needs.
PROVEN ABILITY TO DESIGN INNOVATIVE PRODUCTS AND SERVICES
Our ability to innovate has contributed to our ability to maintain leading market positions and capitalize on profitable growth opportunities while carefully managing risk, including interest rate and equity risk within our products. The culture of innovation is deeply ingrained in our business and goes back decades. For example, our business issued the first 403(b) annuity contract in a K-12 school system over 50 years ago, to a client that continues to be one of our largest in the Group Retirement business. More recently, we accelerated the growth of our fixed index annuity platform, growing from small operations in 2012 to the third-largest player by sales for the twelve months ended September 30, 2022. This growth was supported by regular product innovation, including exclusive products provided to select distributors with innovative living benefits and customized indices. Fixed index annuities are now our largest Individual Retirement product category by premiums and deposits. We also launched the first fixed index annuity with a living benefit for sale in New York State. We introduced novel risk management features in our variable annuity products with living benefits, including VIX-indexed fee structures and a required fixed account allocation, each of which are now present in 88% of our in-force variable annuity products with living benefits as of December 31, 2022 and present in all of our new variable annuity sales for the year ended December 31, 2022. Within our PRT business, we have developed new product offerings and solutions to participate in complex plan terminations, and are developing longevity swap products to enhance our deal execution capabilities.
OUR STRATEGIC PARTNERSHIP WITH BLACKSTONE
Blackstone is expected to originate and significantly enhance our ability to originate attractive and privately sourced, fixed-income oriented assets that are well-suited for liability-driven investing within an insurance company framework. We believe these expanded investment capabilities will improve our investment returns, accelerate our product innovation and enhance the competitiveness of our products. When scaled across our businesses, we believe these expanded capabilities can provide a significant catalyst for future growth.
HIGH-QUALITY LIABILITY PROFILE SUPPORTED BY A STRONG BALANCE SHEET AND DISCIPLINED APPROACH TO RISK MANAGEMENT
We believe our diverse product portfolio and history of disciplined execution have produced a strong balance sheet that is expected to generate significant cash flows over time. First, our disciplined risk selection has resulted in a high-quality liability profile with limited-to-no exposure to “challenged” product portfolios. We have minimal gross exposure, and no net exposure, to LTC policies, which we have fully reinsured to Fortitude Re. As of December 31, 2022, the net ULSG liability of $2.9 billion represents approximately 1% of our net insurance liabilities. Additionally, we have well-managed and limited exposure to optional guarantees within our individual annuity portfolio. As of December 31, 2022, individual annuities with living benefits represented less than 16% of total AUMA, with approximately 4.2% of these related to guarantees on fixed and fixed index annuities. Our historically profitable variable annuity portfolio has benefited from disciplined risk selection and product design with, as of December 31, 2022, approximately 61.8% of the portfolio having no guaranteed living benefits and 5% of variable annuity liabilities attributable to living benefit business written prior to 2009. In our Institutional Markets business, we offer certain products, such as SVWs, without significant mortality or longevity exposure. Furthermore, the breadth of our Institutional Markets offerings allows us to be selective in our liability generation and allocate capital towards the areas where we see attractive risk-adjusted returns.
Our balance sheet is supported by our strong capital position and high-quality investment portfolio. We manage our AGL, USL and VALIC (“Life Fleet”) RBC ratio to a minimum target of 400% and expect to be at or above this target as of December 31, 2022. We intend to manage our financial leverage appropriately with a target financial leverage ratio of 25% to 30%. See “Glossary” for the definition of financial leverage ratio. Our insurance operating company investment portfolio is primarily invested in fixed income securities, 94% of which are designated investment grade by the NAIC as of December 31, 2022.
We also have an active hedging program for our living benefit guarantees, which is informed by our view of the economic liability of the business and is intended to provide protection against adverse market scenarios that could cause the value of the associated liability to increase. In addition, we have an ALM program that seeks to closely match the characteristics of our asset portfolio with the characteristics of our liabilities.
ABILITY TO DELIVER CONSISTENT CASH FLOWS AND ATTRACTIVE RETURNS FOR STOCKHOLDERS
Through our scaled and diverse businesses, underpinned by our strong balance sheet and disciplined approach to risk management, we have historically delivered consistent earnings and cash flows to our parent company. We have historically been able to deliver an attractive return on equity even at times when we have faced challenging macroeconomic conditions, such as the low interest rate environment and the COVID-19 pandemic in recent years.
EXPERIENCED MANAGEMENT TEAM
We have a strong and experienced senior management team with a range of backgrounds across insurance, financial services and other areas of expertise. Our senior management team has an average of over 25 years of experience in the financial services industry.
LEVERAGE OUR PLATFORM TO DELIVER INCREASED EARNINGS
There are significant trends supporting the growth of each of our four businesses, and we believe that we are positioned to take advantage of these trends to achieve targeted growth opportunities.
•We believe we can leverage our broad platform to benefit from changing Individual Retirement market dynamics. We intend to maintain and expand our products to provide income and accumulation benefits to our customers. For example, we recently broadened our product portfolio to include a fee-based fixed index annuity to meet the needs of our investment advisor distribution partners. Through our customized wholesaling model, we plan to capitalize on this opportunity by leveraging both external and proprietary data to identify the highest value opportunities at both the distribution partner and financial professional level.
•We believe our high-touch model is well-tailored for many employers in the not-for-profit retirement plan market and enables us to help middle market and mass affluent individuals achieve retirement security. Specifically, our employee financial advisors provide education and advice to plan participants while accumulating assets in-plan and can seek to serve more of the participant’s financial needs during their lifetime beyond the in-plan relationship, as permitted by employer guidelines. As of December 31, 2022, we have a large extended customer base of approximately 1.7 million plan participants to whom we have access through our in-plan Group Retirement offerings and 300,000 individuals we serve through our out-of-plan wealth management offerings, approximately 100,000 of whom also retain assets in one of our Group Retirement plans. With in-plan income solutions beginning to emerge, we are well-positioned to benefit from market needs. Moreover, by continuing to offer investment advisory services, we expect to capture additional fee-based revenue while providing our clients attractive financial solutions outside of the scope of our own product suite.
•Our Life Insurance business has an opportunity to help close the current protection gap in the United States and offer value to our customers internationally. Our long history in the direct-to-consumer market through a variety of direct-to-consumer channels provides valuable insights and experience for these opportunities.
•Our Institutional Markets business has developed relationships with brokers, consultants and other distribution partners to drive increased earnings for its products. We expect to continue to achieve attractive risk-adjusted returns through PRT deals by focusing on the larger end of the full plan termination market where we can leverage our differentiated capabilities around managing market risks, asset-in-kind portfolios and deferred participant longevity. Additionally, we plan to grow our GIC portfolio by expanding our FABN program. We believe that our Blackstone partnership will differentiate our competitive position by providing assets with a duration, liquidity and return profile that are well-suited to our Institutional Markets offerings, allowing us to grow our transaction volume.
LEVERAGE OUR STRATEGIC PARTNERSHIP WITH BLACKSTONE TO CREATE DIFFERENTIATED PRICING AND LIABILITY SOURCING
Blackstone is a market-leading alternative investment manager with significant direct asset origination capabilities, representing additional opportunities for us to source the fixed-income oriented assets needed to back our liabilities and enhance risk-adjusted returns. We intend to use our collective asset origination and investment management capabilities to help drive value and growth for all of our businesses.
DRIVE FURTHER COST REDUCTION AND PRODUCTIVITY IMPROVEMENT ACROSS THE ORGANIZATION
We have identified opportunities to improve profitability across our businesses through operating expense reductions, without impacting our ability to serve our existing clients, and in many cases enhancing our service capabilities, to enable growth in our businesses. As part of Corebridge Forward, we aim to achieve an annual run rate expense reduction of approximately $400 million on a pre-tax basis within two to three years of our initial public offering (the “IPO”) and have acted upon or contracted approximately $232 million of exit run rate savings for the year ended December 31, 2022 and expect the majority of the reduction to be achieved within 24 months of the IPO. To achieve this goal, Corebridge Forward is expected to have a one-time expense of approximately $300 million on a pre-tax basis and as of December 31, 2022 the cost to achieve has been approximately $84 million. In particular, we plan to:
•simplify our customer service model and modernize our technology infrastructure with more efficient, up-to-date alternatives, including cloud migration and cloud-based solutions;
•implement a lean operating model;
•build on existing partnership arrangements to further improve scale and drive spend efficiency through technology deployment and process optimization;
•rationalize our real estate footprint to align with our business strategy, future operating model and organizational structure; and
•optimize our vendor relationships to drive additional savings.
To achieve this plan, we have reached agreements with our existing partners to realize further cost efficiencies by transforming additional operational and back office processes. Apart from this plan, we intend to evolve our investments organization, which we expect will create additional efficiencies, to reflect our relationships with key external partners, our expected implementation of BlackRock’s “Aladdin” investment management technology platform and our expected reduction in fees for asset management services that we provide to AIG and third parties.
For additional information about our cost reduction and productivity improvements across the organization, see “Risk Factors—Risks Relating to Estimates and Assumptions—Our productivity improvement initiatives may not yield our expected expense reductions and improvements in operational and organizational efficiency” in the 2022 Form 10-K.
CLOSELY MANAGE CAPITAL TO CONTINUE TO PROVIDE STRONG CASH FLOW FOR STOCKHOLDERS
We have historically provided capital returns to our parent company, and we intend to continue to manage our businesses to produce meaningful returns to stockholders through potential dividends and share repurchases. We also intend to closely manage our in-force portfolio, seek to ensure that new business is profitable and proactively manage our businesses to optimize returns within and across portfolios.
INDIVIDUAL RETIREMENT
Overview
We are a leading provider of individual annuity products, serving over 1 million clients as of December 31, 2022. Our three product categories, fixed, fixed index and variable annuities, address a range of savings, investment, and income needs. We offer a variety of optional benefits within these products, including lifetime income guarantees and death benefits and sell our annuity products through our extensive distribution platform. For the year ended December 31, 2022, we recorded $15.1 billion in total individual annuity sales, with each of our product categories contributing at least $3.1 billion in premiums and deposits. Our broad and scaled product offering has allowed us to rank second in total individual annuity sales in each of the last ten years including the last twelve months ended September 30, 2022, according to LIMRA.
Broad distribution platform
Our Individual Retirement business maintains a growing multi-channel distribution footprint built on long-term relationships. As of December 31, 2022, our footprint included over 23,000 advisors and agents who actively sold our annuities in the prior 12 months, accessed through long-term relationships with approximately 630 firms distributing our annuity products, and approximately 9,700 new producers who sold our annuity products for the first time in 2022. Our strategic accounts function helps manage relationships with our largest distribution partners. We have also collaborated with some distribution partners to create differentiated fixed and fixed index annuity products tailored for specific markets, customer segments and distribution channels to add value to our customers while managing our balance sheet exposure.
Diversified product portfolio
Our diverse and broad product suite allows us to quickly adapt our offerings in response to shifting customer needs and economic and competitive dynamics, targeting areas where we see the greatest opportunity for risk-adjusted returns. As an example, we typically re-price our full fixed annuity product suite on a weekly basis to respond to market conditions, distributor preferences and competitive actions and can re-price more frequently if needed. Our product diversification, as evidenced by balanced new business sales across all three annuity product categories, allows for further new business flexibility in meeting customer demand and changing macroeconomic conditions.
Disciplined product risk management
Our products and product features are designed with both customer needs and our risk management in mind. We have a disciplined approach designed to manage risk exposure to our balance sheet by managing margins and capital and stress testing results under varied market conditions. As an example, our fixed index annuities are designed purposefully so that we can effectively manage the index crediting risk through our hedging program. Further, our fixed annuity block reflects a history of disciplined rate setting, with minimal exposure to guaranteed crediting rates above 4.5%. Our variable annuity business has pioneered risk-mitigating features such as VIX-indexed fees and flexible income choices which offer value for our customers while tailoring to our risk profile. Additionally, our variable annuity block reflects a history of disciplined product design, with limited exposure to legacy variable annuities with living benefits written before 2009, which account for 5% of our overall variable annuity portfolio as of December 31, 2022. Our product diversification further mitigates potential adverse outcomes that could impact our portfolio.
Individual Retirement is the largest contributor to our earnings, accounting for $1.7 billion or 59% of our adjusted pre-tax operating income in the year ended December 31, 2022. We have approximately 1 million policies in-force, representing $136.7 billion of AUMA as of December 31, 2022.
The following table presents Individual Retirement AUMA by product:
| | | | | | | | | | | | | | | | | | | | | | | | | | | | | |
| December 31, |
| (in millions) | | 2022 | | 2021 | | 2020 |
| Fixed annuities | | $ | 51,806 | | 37.9 | % | | $ | 57,823 | | 36.1 | % | | $ | 60,538 | | 38.5 | % |
| Fixed index annuities | | 30,403 | | 22.2 | % | | 31,809 | | 19.8 | % | | 27,893 | | 17.7 | % |
| Variable annuities | | 54,487 | | 39.9 | % | | 70,612 | | 44.1 | % | | 68,918 | | 43.8 | % |
Total* | | $ | 136,696 | | 100.0 | % | | $ | 160,244 | | 100.0 | % | | $ | 157,349 | | 100.0 | % |
* Excludes AUA of our retail mutual funds business that were sold to Touchstone on July 16, 2021, or otherwise liquidated.Products
Fixed annuities
We offer a range of fixed annuity products that offer principal protection and a specified rate of return over a single year or multi-year time periods. Beyond the guaranteed return periods, we offer renewal crediting rates that are dynamically managed in coordination with our investment team. We also offer optional living benefits for some of our fixed annuity products. The market risk associated with these living benefits is mitigated as the return on fixed annuities uses the guaranteed minimum interest rate as a floor, which prevents the account value from declining due to market returns.
We bear the risk of investment performance for fixed annuity products. These products primarily generate spread-based income on the difference between the investment income earned on the assets backing the policy (which are held in our general account) and the interest credited to the policyholder. For example, in the first quarter of 2022, our product investment management team coordinated with our Individual Retirement pricing team to quickly incorporate the assets originated by Blackstone into our pricing methodologies, resulting in subsequent price improvements and a more than 89% increase in year-over-year fixed annuity sales for 2022, as compared to 2021. Our product teams closely coordinate with our investment management function to efficiently manage this spread income. Such coordination provides us with the ability to quickly reprice and reposition our market offerings as new asset opportunities are sourced and as market conditions change in addition to closely managed renewal rates.
Fixed index annuities
We offer fixed index annuity products which provide our customers with returns linked to the underlying returns of various market indices. These products can include a range of optional benefits including guaranteed minimum death benefits (“GMDBs”) and guaranteed minimum withdrawal benefits (“GMWBs”). The market risk associated with these guarantees is mitigated as fixed index annuity account values generally do not decrease even when the chosen index has negative performance. We have accelerated the growth of our fixed index annuity platform, growing from $0.4 billion in sales (1.1% market share) in 2013 to $6.3 billion in sales for the year ended December 31, 2022 (9.2% market share for the twelve months ended September 30, 2022).
Similar to our fixed annuities, our fixed index annuities generate spread-based income on the difference between the investment income earned on the general account assets backing the policy and the interest credits our clients earn. We bear the risk associated with the interest credits that our clients earn, which is managed through hedging (as discussed below) in order to minimize the index exposure on our balance sheet. This is in addition to the pricing and renewal rate management that we employ against both fixed annuity and fixed index annuity products.
Variable annuities
We offer variable annuities that allow a customer to choose from a selection of investment options. Our variable annuity products generate fee-based income that is typically paid as a percentage of the assets in the investment options selected by the policyholder and held in one of our separate accounts. Policyholders generally bear the risk of the investment performance of assets held in a separate account. These products typically offer, and in some cases in order to limit volatility, require a portion of the account value to be allocated to, general account investment options.
Our variable annuity products offer guaranteed benefit features (collectively known as “GMxBs”), including GMDBs and living benefits which provide guaranteed lifetime income, such as GMWBs. We presently offer simple GMDBs, with 88% of our variable annuity GMDB account value as of December 31, 2022 either providing for a return of premium or locking-in a maximum anniversary value, and have limited exposure to legacy GMDB options, including rollups which represented 4% of variable annuity GMDB account value as of December 31, 2022. 77% of our variable annuity account value has a GMWB as of December 31, 2022 and we have a small portion of in-force contracts with guaranteed minimum income benefits (“GMIBs”), although we no longer offer this guaranteed benefit feature as of 2006 and the majority of this exposure has been reinsured. We seek to mitigate the market risk associated with certain guaranteed benefit features through a dynamic hedging program that is designed to reduce the equity market and interest rate risk associated with offering the benefits.
While only one living benefit can be purchased for a variable annuity contract, a contract can include both a GMDB and a living benefit. However, a policyholder can only receive payouts from one guaranteed feature on a contract containing both a GMDB and a living benefit, with the exception of a surviving spouse who has a rider to potentially collect both a GMDB upon his or her spouse’s death and a GMWB during the surviving spouse’s lifetime. As of December 31, 2022, 1.9% of our joint annuity contracts with living benefits are in spousal continuation status.
The following table presents our Individual Retirement premiums and deposits by product:
| | | | | | | | | | | | | | | | | | | | | | | | | | | | | |
| December 31, |
| (in millions) | | 2022 | | 2021 | | 2020 |
| Fixed annuities | | $ | 5,695 | | 37.7 | % | | $ | 3,011 | | 22.0 | % | | $ | 2,535 | | 26.3 | % |
| Fixed index annuities | | 6,316 | | 41.8 | % | | 5,621 | | 41.2 | % | | 4,096 | | 42.5 | % |
| Variable annuities | | 3,109 | | 20.5 | % | | 5,025 | | 36.8 | % | | 3,003 | | 31.2 | % |
Total* | | $ | 15,120 | | 100.0 | % | | $ | 13,657 | | 100.0 | % | | $ | 9,634 | | 100.0 | % |
* Excludes the sale of our retail mutual funds business that was sold to Touchstone on July 16, 2021, or otherwise liquidated.
While the COVID-19 pandemic negatively impacted sales results in 2020, we have retained market share relative to peers, and we had the first place ranking in total individual annuity sales for the twelve months ended September 30, 2022 and the second place ranking for the year ended December 31, 2021.
The following table presents our sales rankings by annuity product category according to LIMRA:
| | | | | | | | | | | | | | | | | | | | | | | | | | | | | | | | | | | | | | | | | |
| For the twelve months ended September 30, 2022 | | For the years ended December 31, |
| | 2021 | | 2020 | | 2019 | | 2018 | | 2017 | | 2016 |
| Overall | 1 | | 2 | | 2 | | 2 | | 1 | | 2 | | 2 |
| Fixed annuities | 4 | | 4 | | 5 | | 2 | | 3 | | 2 | | 2 |
| Fixed index annuities | 3 | | 3 | | 3 | | 3 | | 4 | | 7 | | 5 |
| Variable annuities | 7 | | 5 | | 6 | | 6 | | 6 | | 5 | | 5 |
Our fixed annuity and fixed index annuity products generate spread-based income on the difference between crediting rates paid and yields earned on assets we invest in our general account. Our variable annuity products generate fee-based income that is typically paid as a percentage of the assets in the investment options selected by the policyholder and held in our separate accounts. While our Individual Retirement variable annuity net insurance liabilities represented 20% of our in-force as of December 31, 2022, they only represented 10% of our new premiums and deposits for the year ended December 31, 2022. Given the current environment, we expect a further increase in the proportion of our fixed index annuities sales, resulting in an increasing proportion of spread income over fee income over time.
The following table presents Individual Retirement spread and fee income:
| | | | | | | | | | | | | | | | | | | | | | | | | | | | | |
| For the years ended December 31, |
| (in millions) | | 2022 | | 2021 | | 2020 |
Net base spread income(a) | | $ | 1,864 | | 57.9 | % | | $ | 1,743 | | 44.3 | % | | $ | 1,898 | | 50.6 | % |
| Variable investment income, excluding affordable housing | | 163 | | 5.1 | % | | 711 | | 18.1 | % | | 403 | | 10.8 | % |
| Affordable housing | | — | | — | % | | 145 | | 3.7 | % | | 129 | | 3.4 | % |
Total Spread income(b) | | $ | 2,027 | | 63.0 | % | | $ | 2,599 | | 66.1 | % | | $ | 2,430 | | 64.8 | % |
Fee Income(a)(c) | | 1,192 | | 37.0 | % | | 1,335 | | 33.9 | % | | 1,321 | | 35.2 | % |
| Total | | $ | 3,219 | | 100.0 | % | | $ | 3,934 | | 100.0 | % | | $ | 3,751 | | 100.0 | % |
(a) The results for the years ended December 31, 2022 and 2021 have been updated to reflect the adoption of LDTI. No updates have been made to the results for the year ended December 31, 2020 as our effective date for LDTI adoption was January 1, 2021.
(b) Total spread income represents net investment income less interest credited to policyholder account balances, exclusive of amortization of DSI of $55 million, $58 million and $76 million for the years ended December 31, 2022, 2021 and 2020, respectively.
(c) Fee income is defined as policy fees plus advisory fee and other income.
Distribution
Individual Retirement has a large and diverse distribution platform, allowing the business to reach and serve a wide range of consumers. Individual Retirement’s annuity products are offered through a longstanding, multichannel distribution network of approximately 630 third-party firms including banks, broker-dealers, general agencies, independent marketing organizations and independent insurance agents as of December 31, 2022. At Corebridge FD, we have approximately 450 professionals who work with these firms and their associated advisors to market and sell our products. According to LIMRA, we were the only company to rank in the top seven in sales across all three major annuity product categories for the twelve months ended September 30, 2022, and to have remained in the top 10 in each category since 2015.
The following table presents our Individual Retirement premiums and deposits by distribution channel:
| | | | | | | | | | | | | | | | | | | | | | | | | | | | | |
| For the years ended December 31, |
| (in millions) | | 2022 | | 2021 | | 2020 |
Broker dealer(a) | | $ | 5,876 | | 38.9 | % | | $ | 7,137 | | 52.3 | % | | $ | 4,576 | | 47.5 | % |
| Banks | | 7,446 | | 49.2 | % | | 4,756 | | 34.8 | % | | 3,659 | | 38.0 | % |
Independent non-registered marketing organizations/BGAs(b) | | 1,798 | | 11.9 | % | | 1,764 | | 12.9 | % | | 1,399 | | 14.5 | % |
| Total | | $ | 15,120 | | 100.0 | % | | $ | 13,657 | | 100.0 | % | | $ | 9,634 | | 100.0 | % |
(a) Includes wirehouses, independent and regional broker-dealers.
(b) Includes employee financial advisors.
Our distribution strategy is built around our approximately 450 professionals maintaining long-term relationships with the firms that distribute our products and the individual agents and registered representatives within those firms. Corebridge FD’s coordinated wholesaling approach positions us to go to market as ‘one firm,’ thereby better serving our distribution partners and increasing our relevance and perceived value to them. As of December 31, 2022, our top 25 third-party distribution partners have been on our platform for an average of approximately 25 years, with 9 of them for 30 years or more. As of December 31, 2022, we represented 13% on average of the total sales volume of our top 25 third-party distribution partners for our annuities. We also develop customized products and specialized strategies for our channels as appropriate, including variations of our fixed annuity products that better align with partner business models and variable annuity products with specialized rider options. These customized products comprised 43.8% of our 2022 annuity sales. The strong relationships formed through these collaborations are fundamental to our ability to continue to generate attractive risk-adjusted returns.
Markets
Our individual annuity products are primarily sold to mass affluent and high net worth individuals for retirement accumulation, retirement income and legacy planning. Increasing life expectancy and reduced expectations for traditional retirement income from defined benefit programs and fixed income securities are leading Americans to seek additional financial security as they approach retirement. As the retirement age population in the United States continues to grow, we expect the need for these retirement savings and income products to expand.
Competition
Our Individual Retirement business competes with traditional life insurers and financial services companies, including banks and asset management companies. Competition is based on pricing, product design, distribution, financial strength, brand and reputation, customer service and ease of doing business, among other factors. We expect the robust competition in our space to continue from traditional insurance companies, newer entrants into the insurance space, and substitute products such as certificates of deposit, mutual funds and other investment products. Newer entrants have frequently been owned or affiliated with alternative asset managers, which provide an enhanced investment strategy compared to traditional competitors. We expect our partnership with Blackstone to give us access to enhanced investment capabilities, enabling us to compete effectively in this changing environment. In parallel, several insurance company competitors have changed their focus away from the individual life and retirement market, which has created an opportunity for us to gain market share in product and distribution areas that others are de-emphasizing.
Strategy
Deepen distribution relationships
We continue to focus on leveraging our distribution strategy to expand the breadth and depth of our distribution relationships. This strategy broadens our product penetration with existing distribution partners and coordinates our sales activities through our strategic account managers and customized wholesaling model. Using both external and proprietary data, we seek to identify the highest value opportunities at both the distribution partner and financial professional level. We also target new high-impact distributors looking to grow and utilize our broad product set to better serve their end customers.
Continue to innovate products and features
Continuing to offer well-designed products with attractive risk-return profiles and customer appeal is fundamental to our success. For example, we recently broadened our product portfolio to include a fee-based fixed index annuity to meet the needs of our investment advisor distribution partners. Additionally, we are continuously evaluating adding product features and options that have the potential to enhance our overall risk-return profile and add value for our clients and distributors.
Target opportunistic and profitable growth
Our strong market positions and distribution relationships allow us to opportunistically target growth in products where market dynamics provide for attractive returns. We identify and pursue growth opportunities based on our assessment of the opportunity to generate both attractive returns and drive volume. According to Cerulli Associates, the U.S. retirement market is a $39 trillion opportunity due to the aging of the population, reduced access to private pensions, inter-generational wealth transfers, and improved life expectancy. We believe this will continue to fuel growth in the market for U.S. retirement assets, and in turn demand for our Individual Retirement products. We believe we are well-positioned to capture this growing market opportunity through our robust and balanced product line-up, our distribution platform and our partnership with Blackstone.
Risk Management
Our Individual Retirement risk management philosophy begins with the way we approach new business generation. We seek to prioritize long-term value over sales volume and adapt our product focus and product designs in the face of changing market dynamics. Over time, this approach has resulted in a well-diversified annuity business that generates consistent earnings through a combination of spread and fee-based income and has minimal exposure to unprofitable legacy lines of business. We have several risk management features that are embedded in the majority of our in-force business as described above. Finally, we deploy a sophisticated dynamic hedging program that aggregates risk at the portfolio level to realize efficiencies across our platform and seeks to produce consistently strong results through a variety of economic environments.
Diversified business
The breadth of our individual annuity offerings allows us to generate earnings that are driven by a well-balanced source of spread and fee-based income. We believe our strong fixed, fixed index and variable annuity products position us to weather economic uncertainty and adapt to competitive pressure better than a concentrated, single-product portfolio.
Product design
Fixed annuities - Fixed annuities are exposed to disintermediation risk in the event of rising interest rates and increased lapses. Our fixed annuities have surrender charge periods, generally in the three-to-seven year range, which may help mitigate increased early surrenders in a rising rate environment and approximately 45.8% of our account value have surrender charges. As a result of past market conditions and comparable to our peers, we were reducing the guaranteed minimum interest rates (“GMIRs”) offered by our fixed annuities over time, however, with the recent increase in interest rates our GMIR has started to increase. Our track record of disciplined rate setting has helped to mitigate some of the historical pressure on investment spreads. While older contracts that were priced in a higher interest rate environment face the most significant spread compression concerns, contracts with GMIRs over 4.5% account for a relatively small portion of our fixed annuity portfolio, which we expect will continue to decrease over time as new contracts are issued at lower GMIRs and older contracts experience lapses, withdrawals and deaths.
The following table presents our fixed annuity account value by GMIR:
| | | | | | | | | | | | | | | | | | | | | | | | | | | | | |
| December 31, |
| (in billions) | | 2022 | | 2021 | | 2020 |
| No GMIR | | $ | 2.5 | | 5.0 | % | | $ | 2.4 | | 4.9 | % | | $ | 2.4 | | 4.8 | % |
| <2.00% | | 28.1 | | 55.9 | % | | 25.4 | | 51.5 | % | | 24.8 | | 49.4 | % |
| 2.00 – 2.99% | | 3.4 | | 6.8 | % | | 3.8 | | 7.7 | % | | 4.2 | | 8.4 | % |
| 3.00 – 4.49% | | 15.9 | | 31.6 | % | | 17.2 | | 34.9 | % | | 18.3 | | 36.4 | % |
| 4.50%+ | | 0.4 | | 0.7 | % | | 0.5 | | 1.0 | % | | 0.5 | | 1.0 | % |
| Total* | | $ | 50.3 | | 100.0 | % | | $ | 49.3 | | 100.0 | % | | $ | 50.2 | | 100.0 | % |
* Includes payout immediate annuities.
Fixed annuity deposits in 2022 almost entirely consisted of products with GMIR’s less than 2.0%, while over $1.0 billion of surrenders and withdrawals occurred in products with GMIRs greater than 2.0%, driving inflows to the less than 2.0% GMIR products and outflows in the products with GMIRs greater than 2.0%. Our fixed annuity portfolio has a weighted average crediting rate of 2.7% and GMIR of 1.7% as of December 31, 2022.
Fixed annuities are also exposed to disintermediation risk in the event of rising interest rates and increased lapses. Fixed annuities have surrender charge periods, generally in the three-to-seven year range, which may help mitigate increased early surrenders in a rising rate environment.
The following table presents our fixed annuity account value by surrender charge:
| | | | | | | | | | | | | | | | | | | | | | | | | | | | | |
| December 31, |
| (in billions) | | 2022 | | 2021 | | 2020 |
| No surrender charge | | $ | 24.9 | | 49.4 | % | | $ | 26.2 | | 53.1 | % | | $ | 26.9 | | 53.5 | % |
| Greater than 0% – 2% | | 1.8 | | 3.6 | % | | 2.1 | | 4.3 | % | | 2.3 | | 4.6 | % |
| Greater than 2% – 4% | | 2.3 | | 4.6 | % | | 2.4 | | 4.9 | % | | 2.7 | | 5.4 | % |
| Greater than 4% | | 18.9 | | 37.6 | % | | 16.3 | | 33.0 | % | | 16.1 | | 32.1 | % |
| Non-surrenderable | | 2.4 | | 4.8 | % | | 2.3 | | 4.7 | % | | 2.2 | | 4.4 | % |
| Total | | $ | 50.3 | | 100.0 | % | | $ | 49.3 | | 100.0 | % | | $ | 50.2 | | 100.0 | % |
The following table presents our fixed annuity rider liabilities:
| | | | | | | | |
| December 31, |
| (in millions) | | 2020 |
GMWB* | | $ | 353 | |
* This balance includes liabilities related to unrealized appreciation of Investments of $215 million for the year ended December 31, 2020.
We do not have any fixed annuity rider liabilities for GMDB or GMIB.
Fixed index annuities - Our fixed index annuity block does not contain significant legacy risk exposure as we only began increasing sales meaningfully in this product category in 2013. Fixed index annuities are designed with simpler risk profiles than variable annuities and the associated index credits are hedged by our hedging team. The majority of our fixed index annuity portfolio does not contain guaranteed minimum living benefits, which we believe results in an attractive risk profile across our in-force fixed index annuity block. We introduced a GMDB option in our fixed index annuity portfolio in 2020, which is currently present in $300 million of fund value as of December 31, 2022.
The following table presents our fixed index annuity account value by guarantee type:
| | | | | | | | | | | | | | | | | | | | | | | | | | | | | |
| December 31, |
| (in millions) | | 2022 | | 2021 | | 2020 |
No GMWB | | $ | 22,507 | | 67.5 | % | | $ | 18,571 | | 64.8 | % | | $ | 14,363 | | 60.9 | % |
| GMWB | | 10,844 | | 32.5 | % | | 10,091 | | 35.2 | % | | 9,212 | | 39.1 | % |
| Total | | $ | 33,351 | | 100.0 | % | | $ | 28,662 | | 100.0 | % | | $ | 23,575 | | 100.0 | % |
The following table presents our fixed index annuity account value by surrender charge:
| | | | | | | | | | | | | | | | | | | | | | | | | | | | | |
| December 31, |
| (in billions) | | 2022 | | 2021 | | 2020 |
No surrender charge | | $ | 2.3 | | 6.9 | % | | $ | 1.9 | | 6.6 | % | | $ | 1.3 | | 5.5 | % |
Greater than 0% – 2% | | 1.4 | | 4.2 | % | | 1.6 | | 5.5 | % | | 1.1 | | 4.7 | % |
Greater than 2% – 4% | | 4.5 | | 13.5 | % | | 4.0 | | 13.8 | % | | 3.1 | | 13.1 | % |
Greater than 4% | | 25.2 | | 75.4 | % | | 21.2 | | 74.1 | % | | 18.1 | | 76.7 | % |
Non-surrenderable | | — | | — | % | | — | | — | % | | — | | — | % |
Total | | $ | 33.4 | | 100.0 | % | | $ | 28.7 | | 100.0 | % | | $ | 23.6 | | 100.0 | % |
Variable annuities - Years of prudent product design have resulted in an in-force variable annuity block that has minimal exposure to pre-2009 financial crisis liabilities and rollup death benefits. Our variable annuity GMDB exposure is primarily concentrated in return of premium guarantees, with little exposure to riskier return of account value options. Our living benefits exposure is concentrated in GMWBs. All GMWBs require the customer to invest in a restricted set of fund options, a limited number of which are customizable. We have a small portion of legacy GMIBs, representing 4% of our in-force portfolio as of December 31, 2022.
The following table presents our account value by GMDB design in our variable annuity portfolio:
| | | | | | | | | | | | | | | | | | | | | | | | | | | | | |
| December 31, |
| (in billions) | | 2022 | | 2021 | | 2020 |
| No GMDB | | $ | 0.8 | | 1.6 | % | | $ | 1.0 | | 1.6 | % | | $ | 0.9 | | 1.5 | % |
| Return of premium | | 31.2 | | 61.1 | % | | 38.9 | | 60.8 | % | | 36.5 | | 61.3 | % |
| Highest contract value attained | | 13.3 | | 26.0 | % | | 17.3 | | 27.0 | % | | 16.7 | | 27.9 | % |
| Rollups | | 2.1 | | 4.1 | % | | 2.9 | | 4.5 | % | | 2.9 | | 4.9 | % |
| Return of account value | | 3.7 | | 7.2 | % | | 3.9 | | 6.1 | % | | 2.6 | | 4.4 | % |
| Total | | $ | 51.1 | | 100.0 | % | | $ | 64.0 | | 100.0 | % | | $ | 59.6 | | 100.0 | % |
The following table presents our account value by benefit type in our variable annuity portfolio:
| | | | | | | | | | | | | | | | | | | | | | | | | | | | | |
| December 31, |
| (in billions) | | 2022 | | 2021 | | 2020 |
| GMWB | | $ | 39.2 | | 76.7 | % | | $ | 48.4 | | 75.6 | % | | $ | 45.0 | | 75.5 | % |
| GMDB only | | 9.3 | | 18.2 | % | | 12.2 | | 19.0 | % | | 11.4 | | 19.1 | % |
| GMIB | | 1.8 | | 3.5 | % | | 2.4 | | 3.8 | % | | 2.3 | | 3.9 | % |
| No guarantee | | 0.8 | | 1.6 | % | | 1.0 | | 1.6 | % | | 0.9 | | 1.5 | % |
| Total | | $ | 51.1 | | 100.0 | % | | $ | 64.0 | | 100.0 | % | | $ | 59.6 | | 100.0 | % |
The vast majority of our in-force variable annuity portfolio is designed with embedded risk mitigation features as follows:
•VIX-indexed fee: This feature increases the rider fee when market volatility rises, helping offset higher costs of hedging during periods of high equity volatility as well as providing value to the customer through lower fees during periods of lower equity volatility in the market. This feature is present in 88% of our total in-force GMWB variable annuity business as of December 31, 2022 and 100% of new GMWB variable annuity sales in the year ended December 31, 2022. The feature is unique to our product lines.
•Required fixed account allocation: This feature requires 10% – 20% of account value to be invested in an account that credits a fixed interest rate and provides no equity exposure. This feature is present in 88% of our in-force GMWB business as of December 31, 2022 and approximately 100% of new GMWB variable annuity sales with living benefits in the year ended December 31, 2022. The feature was introduced by our company in 2010.
•Volatility controlled funds: These funds, which are offered or in some cases are required in conjunction with certain living benefits, seek to maintain consistent and capped volatility exposure for the underlying funds in the variable annuity by managing exposures to volatility targets and/or caps instead of a more traditional fixed equity allocation. These funds also limit equity allocation and provide equity market tail protection through put options purchased within the funds. The funds account for 64% of our in-force GMWB living benefit AUMA as of December 31, 2022 and 24% of new GMWB variable annuity sales in the year ended December 31, 2022. Currently, we sell two main living benefit riders, one that requires election of volatility control funds with more generous payout features and one that does not require the use of volatility control funds and offers less generous payout features. The latter product is more popular, resulting in a lower percentage of new sales that use volatility control funds. We believe both riders are appropriately priced and have significant risk mitigating features.
•Withdrawal rate reduction at claim: This feature lowers the guaranteed income amount after the account value is depleted, consequently lowering our claim payments. This feature is present in 70% of our in-force GMWB business as of December 31, 2022 and 77% of new GMWB variable annuity sales for the year ended December 31, 2022.
The amount of consumer value embedded in a variable annuity guarantee is determined by the design of the guarantee and the benefit base, as specified in the contract. Net amount at risk represents our exposure to a potential loss through the variable annuity guarantee.
The following table presents our variable annuity net amount at risk (“NAR”) by benefit type:
| | | | | | | | | | | | | | | | | | | | | | | |
| December 31, |
Variable annuity NAR(a) | | 2022 | | 2021 | | 2020 |
| (in millions) | | NAR | | | NAR | | | NAR | |
GMWB(b) | | $ | — | | | | $ | — | | | | $ | 1,082 | | |
GMDB(b) | | $ | 1,615 | | | | $ | 684 | | | | $ | 788 | | |
| GMIB | | $ | — | | | | $ | — | | | | $ | 83 | | |
Combined(b)(c) | | $ | 2,057 | | | | $ | 556 | | | | $ | — | | |
(a) The NAR for GMDB represents the amount of benefits in excess of account value if death claims were filed on all contracts on the balance sheet date. The NAR for GMWB represents the present value of minimum guaranteed withdrawal payments, in accordance with contract terms, in excess of account value, assuming no lapses.
(b) The results for the years ended December 31, 2022 and 2021 have been updated to reflect the adoption of LDTI. No updates have been made to the results for the year ended December 31, 2020 as our effective date for LDTI adoption was January 1, 2021.
(c) Certain contracts contain a combination of at least two guaranteed features which could include GMDBs, GMWBs and GMIBs and are modelled together for the purpose of calculating the MRB.
The following table presents our variable annuity account value by surrender charge:
| | | | | | | | | | | | | | | | | | | | | | | | | | | | | |
| December 31, |
| (in billions) | | 2022 | | 2021 | | 2020 |
| No surrender charge | | $ | 27.0 | | 51.6 | % | | $ | 31.9 | | 49.0 | % | | $ | 28.0 | | 44.9 | % |
| Greater than 0% – 2% | | 7.0 | | 13.4 | % | | 10.3 | | 15.8 | % | | 10.0 | | 16.0 | % |
| Greater than 2% – 4% | | 5.1 | | 9.8 | % | | 9.4 | | 14.4 | % | | 11.3 | | 18.1 | % |
| Greater than 4% | | 12.1 | | 23.1 | % | | 12.4 | | 19.0 | % | | 12.0 | | 19.2 | % |
Non-surrenderable(a) | | 1.1 | | 2.1 | % | | 1.2 | | 1.8 | % | | 1.1 | | 1.8 | % |
Total(b) | | $ | 52.3 | | 100.0 | % | | $ | 65.2 | | 100.0 | % | | $ | 62.4 | | 100.0 | % |
(a) The non-surrenderable portion of variable annuities relates to funding agreements.
(b) Includes payout Immediate Annuities, funding agreements.
The variable annuity market has developed significantly over the past decade as many carriers altered product designs to better balance consumer and stockholder value after experiencing reduced profitability through the 2008 financial crisis and subsequent market downturns. In doing so, many carriers have reduced the benefits offered in their GMxBs through subsequent product rollouts. Our exposure to legacy variable annuities with living benefits written before 2009 accounts for 5% of our overall portfolio, as of December 31, 2022.
The following chart presents the distribution of our variable annuity account value across sale vintages and GMWB status as of December 31, 2022.
Hedging
In addition to prudent product design and in-force management, we seek to reduce the risk associated with our Individual Retirement products through a dynamic hedging program. Our hedge program utilizes market instruments, including swaps, futures and options to offset changes in our internal view of the exposure of our variable annuity living benefits as well as the index credits on fixed index annuities. For example, for variable annuity living benefits, the hedge targets are calculated as the difference between the present value of future expected benefit payments for the living benefit and the present value of future living benefit rider fees, with present values determined over numerous equally weighted stochastic scenarios. This stochastic projection method uses best estimate assumptions for policyholder behavior, including mortality, lapses, withdrawals and benefit utilization in conjunction with market scenarios calibrated to observable equity and interest rate option prices. We measure our exposure at least daily and seek to keep our net exposure, defined as hedge assets and associated contract liabilities, within defined limits. The hedging program is designed to provide additional protection against large and combined movements in levels of interest rates, equity prices, credit spreads and market volatility under multiple scenarios. See “Management’s Discussion and Analysis of Financial Condition and Results of Operations—Significant Factors Impacting Our Results—Impact of Variable Annuity Guaranteed Benefit Riders and Hedging.”
The market value of the hedge portfolio compared to the economic hedge target at any point in time may be different and is not expected to be fully offsetting. The primary sources of difference between the change in the fair value of the hedging portfolio and the economic hedge target include: basis risk due to the variance between expected and actual fund return; differences in realized volatility and implied volatility; actual versus expected changes in the hedge target driven by assumptions not subject to hedging, particularly policyholder behavior; and risk exposures that we have elected not to explicitly or fully hedge.
We also seek to leverage the scale of our business and our hedging programs across our lines of business. For example, we seek to take advantage of offsetting positions that we may have within our variable annuity, fixed index annuity, and index universal life businesses. By offsetting these positions, we are able to both reduce our risk and our trading costs. In 2022, this resulted in an estimated 28% reduction in equity hedging and approximately $5 million to $10 million of hedging cost savings.
GROUP RETIREMENT
Overview
Our Group Retirement business is a leading provider of retirement plans and services to employees of tax-exempt and public sector organizations as they plan, save for and achieve secure financial futures. We provide products and services through our fully integrated product manufacturing and distribution model to employees that are in-plan, as well as individuals out-of-plan. Our in-plan products include an open architecture recordkeeping platform and group annuities supported by plan administrative and compliance services. We offer financial planning advice to employees participating in retirement plans through our employee financial advisors. In addition to engaging with participants in-plan, as permitted by employer guidelines, we seek to manage employees’ other assets and retain rollover assets when employees separate from the plan service. Our out-of-plan offering includes proprietary and limited non-proprietary annuities, financial planning, and brokerage and advisory services, and continues to be a key contributing factor to our fee-based revenue.
Our target markets include K-12 schools, higher education institutions, healthcare providers, government employers and other tax-exempt institutions, where we serve over 22,000 plan sponsors across all 50 states in the 403(b), 457(b), 401(a) and 401(k) markets as of December 31, 2022. We were ranked third in K-12 schools, fourth in higher education institutions, fifth in healthcare institutions and fifth in government institutions by total assets as of September 30, 2022. According to Cerulli Associates, the size of the not-for-profit defined contribution retirement plan market, excluding the Federal Thrift Savings Plan, was $2.0 trillion in 2021. These plans allow us to work with approximately 1.7 million individuals and make up $75 billion of AUMA as of December 31, 2022. We offer customized versions of our in-plan annuities and certain of our Individual Retirement annuity products to our customers for their out-of-plan assets, primarily through the large individual retirement account (“IRA”) market. As of December 31, 2022, we had $40 billion of out-of-plan AUMA and served over 300,000 out-of-plan individuals, approximately 100,000 of whom also retain assets in one of our Group Retirement plans.
Through our broad product and service offerings, we create relationships with both plan sponsors (employers) and plan participants (employees). Our retirement plan solutions are delivered to employers by our business development professionals who, often in coordination with third-party plan consultants, work with employers to create a tailored plan configured to meet the specific needs of their employees. Our subsidiary broker-dealer, VALIC Financial Advisors, has approximately 1,300 registered professionals, of which approximately 1,100 are employee financial advisors as of December 31, 2022, directly engages with individual employees to prepare them for retirement by providing plan enrollment assistance, advice and comprehensive financial planning, with a focus on holistic financial wellness. Our financial advisors, augmented by digital self-service tools, enable us to reach the full range of employees, making retirement planning accessible to all. As a result of these capabilities, we have been recognized by a number of industry surveys as a leader in plan sponsor and participant experience. In a 2022 client satisfaction analysis conducted by Chatham Partners, we were rated above the industry benchmark in overall customer experience, plan sponsor services and participant services. Our plan participant website was ranked in the top three best-in-class websites according to a report released by DALBAR in the third quarter of 2022. In 2022, Cogent Syndicated recognized us as a top four preferred rollover IRA destination, including a top two preferred destination among plan participants likely to retire in two years and a top two preferred destination among job changers.
Differentiated employee financial advisors network and long-term customer relationships: Our employee financial advisors allow us to develop strong, long-term relationships with our clients by engaging with them early in their careers and providing customized solutions and support through the entire savings and retirement life cycle. For the year ended December 31, 2022, with the support of our employee financial advisors, we engaged nearly 54% of in-plan participants and provided more than 108,000 financial plans for in-plan participants and out-of-plan individuals. The strength of our customer relationships is evidenced by our large customer base and strong persistency rates. In our in-plan business, approximately 27% of our individual clients have been a customer of the Group Retirement business for more than 20 years, and the average length of our relationships with plan sponsors is nearly 28 years. In our out-of-plan business, approximately 43% of our individual customers have been customers of our Group Retirement business for more than 20 years.
Diversified asset base: The strong relationships and retention rates we have developed with our clients have translated into diversified spread-based and fee-based assets across our Group Retirement business. Our advisory and brokerage assets are increasingly becoming a larger portion of our AUMA and a source of fee-based revenue.
Niche full-service provider of Group Retirement products and services: In our target markets, we serve employers’ defined contribution plan needs and deliver education and advisory services to in-plan individuals and offer proprietary and limited non-proprietary annuities and brokerage services to out-of-plan individuals.
The following table presents Group Retirement AUMA by asset type:
| | | | | | | | | | | | | | | | | | | | |
| December 31, |
| (in millions) | | 2022 | | 2021 | | 2020 |
| In-plan spread based | | $ | 27,473 | | | $ | 32,549 | | | $ | 33,406 | |
| In-plan fee based | | 47,838 | | | 60,300 | | | 53,897 | |
Total in-plan AUMA(a) | | 75,311 | | | 92,849 | | | 87,303 | |
| Out-of-plan proprietary - general account | | 16,769 | | | 19,697 | | | 19,862 | |
| Out-of-plan proprietary - separate accounts | | 10,429 | | | 13,466 | | | 12,269 | |
Total out-of-plan proprietary annuities(b) | | 27,198 | | | 33,163 | | | 32,131 | |
| Advisory and brokerage | | 12,423 | | | 13,830 | | | 10,620 | |
| Total out-of-plan AUMA | | 39,621 | | | 46,993 | | | 42,751 | |
| Total AUMA | | $ | 114,932 | | | $ | 139,842 | | | $ | 130,054 | |
(a) Includes $12.5 billion, $15.1 billion and $14.3 billion of AUMA as of December 31, 2022, 2021 and 2020, respectively, that is associated with our in-plan investment advisory service that we offer to participants at an additional fee.
(b) Includes $4.0 billion, $4.9 billion and $4.3 billion of AUMA as of December 31, 2022, 2021 and 2020, respectively, in our proprietary advisory variable annuity. Together with our out-of-plan advisory and brokerage assets shown in the table above, we had a total of $16.4 billion, $18.7 billion and $15.0 billion of out-of-plan advisory assets as of December 31, 2022, 2021 and 2020, respectively.
The following table presents our general account value by GMIR:
| | | | | | | | | | | | | | | | | | | | | | | | | | | | | |
| December 31, |
| (in billions) | | 2022 | | 2021 | | 2020 |
| No GMIR | | $ | 4.7 | | 10.8 | % | | $ | 4.7 | | 10.7 | % | | $ | 4.6 | | 10.5 | % |
| <2.0% | | 12.6 | | 29.0 | % | | 11.9 | 27.0 | % | | 11.0 | 25.2 | % |
| 2.00% – 2.99% | | 4.6 | | 10.7 | % | | 5.1 | 11.5 | % | | 5.4 | 12.3 | % |
| 3.00% – 4.49% | | 14.5 | | 33.4 | % | | 15.3 | 34.7 | % | | 15.5 | 35.5 | % |
| 4.50%+ | | 7.0 | | 16.1 | % | | 7.1 | 16.1 | % | | 7.2 | 16.5 | % |
| Total * | | $ | 43.4 | | 100.0 | % | | $ | 44.1 | | 100.0 | % | | $ | 43.7 | | 100.0 | % |
* Includes payout immediate annuities and funding agreements.
We proactively manage our in-force product portfolio to improve profitability and returns. The majority of our outflows represents individuals accessing their retirement funds to meet financial needs rather than plan surrenders and is concentrated in our longest standing retirement plans, many of which offer GMIRs established decades ago. As a result, we have seen a favorable shift to lower GMIR products in our general account portfolio in our Group Retirement business.
Diversified sources of earnings: Our revenue is generated by a combination of spread and fee income. While the revenue mix remains balanced, we have increased our exposure to fee revenue over the last several years. A key contributing factor to our expanding fee revenue exposure has been the growth of our out-of-plan offerings, which are well-positioned to capitalize on the growing consumer demand for advisory services and the strong growth in the IRA market. These products supplement our in-plan offerings and provide strong risk-adjusted returns and attractive cash flow generation.
Positioned to capture market growth: The Group Retirement business is positioned to benefit from expected growth in the U.S. retirement market caused by demographic shifts and need for advice. From 1989 to 2019, median retirement account assets among retirees defined as individuals age 65 to 74 increased over 450%, according to data from the Federal Reserve. As the burden of retirement saving has shifted from employers to individuals, we expect to benefit from our participation in the IRA market, which is expected to grow faster than other retirement asset segments over the next five years.
We have a long history of innovation in the group retirement space. For example, our business issued the first 403(b) annuity contract in a K-12 school system over 50 years ago to a client that continues to be one of our largest in the Group Retirement business. In 1998, we launched an open architecture recordkeeping platform allowing plan participants to allocate money to a variety of mutual fund options or a fixed interest account, and in 2003, our employee financial advisors became the first to offer an in-plan investment advisory service to participants in reliance on the DOL’s SunAmerica Advisory Opinion. We are in active discussions with partners to offer in-plan guaranteed lifetime income solutions as an option in retirement plans, including as an investment option for plans we do not administer. We are a leader in the market and were the third-ranked provider of K-12 plans and fourth-ranked provider of higher education plans by total assets as of September 30, 2022.
Products and Services
Our Group Retirement offerings are segmented into in-plan and out-of-plan products and services.
In-plan products and services — We offer a variety of options for employer defined contribution plans, including products, plan administrative and compliance services, retirement education, financial planning and advisory solutions.
•In-plan recordkeeping: We offer an open architecture recordkeeping platform that allows plan participants to allocate money to a variety of mutual fund options or a fixed interest account. We provide access to more than 12,000 investments on this platform from over 160 fund families/asset managers as of December 31, 2022. A fixed investment only option can also be provided on this platform for plans where we are not the recordkeeper. We receive fee income for our provision of recordkeeping services and generate spread income on the fixed interest account.
•In-plan annuity: We offer a flexible group variable and fixed annuity that allows plan sponsors to select from a variety of fee structures, liquidity provisions and fund options. Several variations of our in-plan annuity are available based on plan characteristics, market, size and preferences. Customers receive additional protection from a modest guaranteed minimum death benefit and minimum guaranteed credited rates on the fixed account option. We receive fee income on the variable assets and generate spread income on the fixed annuity assets.
•Investment advisory: Through our employee financial advisors and with approval from the plan sponsor, we offer an in-plan investment advisory service to participants for an additional fee. As of December 31, 2022, we had $12.5 billion in AUMA.
Out-of-plan products and services — Through our employee financial advisors, we offer a variety of annuity, advisory and brokerage products to help clients meet their retirement savings goals outside of traditional employer sponsored pension plans. Our solutions reach clients primarily through their IRAs, which represent the fastest growing segment of the U.S. retirement asset landscape.
•Annuities — We offer a suite of proprietary annuities for accumulation and guaranteed lifetime income. In addition, we offer a non-proprietary annuity as needed to ensure we have a broad range of solutions available to our clients. Several of the proprietary annuities and living benefits are customized versions of products offered by our Individual Retirement business. Our proprietary annuities include:
•Fixed annuities: We offer a fixed annuity with a multi-year guaranteed fixed rate and another version with a guaranteed lifetime income benefit;
•Fixed index annuities: We offer a fixed index annuity providing accumulation and guaranteed lifetime income with a variety of index crediting strategies and multiple indexes; and
•Variable annuities: We offer a variable annuity for asset accumulation in both a brokerage and investment advisory account, including a version with an optional guaranteed lifetime income rider.
•Advisory and brokerage products
•Our investment advisory solution offers fiduciary, fee-based investments with a variety of asset managers and strategists; and
•Our full-service brokerage offering supports a limited non-proprietary variable annuity, securities brokerage accounts, mutual funds and 529 plans.
Our out-of-plan advisory and brokerage AUMA totaled $12.4 billion as of December 31, 2022. In addition, $4.0 billion of our out-of-plan proprietary annuities AUMA are advisory-focused as of December 31, 2022.
The following table presents our Group Retirement premiums and deposits, including client deposits into our advisory and brokerage products:
| | | | | | | | | | | | | | | | | | | | | | | | | | | | | |
| For the years ended December 31, |
| (in millions) | | 2022 | | 2021 | | 2020 |
In-plan(a)(b) | | | | | | | | | |
| Periodic | | $ | 3,785 | | 37.9 | % | | $ | 3,758 | | 36.6 | % | | $ | 3,676 | | 41.4 | % |
| Non-periodic | | 2,033 | | 20.3 | % | | 2,153 | | 21.0 | % | | 1,736 | | 19.6 | % |
| Total in-plan | | 5,818 | | 58.2 | % | | 5,911 | | 57.6 | % | | 5,412 | | 61.0 | % |
| Out-of-plan | | | | | | | | | |
| Out-of-plan proprietary annuities | | 2,124 | | 21.2 | % | | 1,855 | | 18.1 | % | | 2,084 | | 23.5 | % |
| Advisory and brokerage | | 2,058 | | 20.6 | % | | 2,502 | | 24.3 | % | | 1,376 | | 15.5 | % |
| Total out-of-plan | | 4,182 | | 41.8 | % | | 4,357 | | 42.4 | % | | 3,460 | | 39.0 | % |
| Total | | $ | 10,000 | | 100.0 | % | | $ | 10,268 | | 100.0 | % | | $ | 8,872 | | 100.0 | % |
(a) In-plan premium and deposits include sales of variable and fixed annuities, as well as mutual funds for 403(b), 401(a), 457(b) and 401(k) plans.
(b) Includes $3.5 billion, $3.1 billion and $3.0 billion of inflows related to in-plan mutual funds for the years ended December 31, 2022, 2021 and 2020, respectively.
For the year ended December 31, 2022, approximately 38% of our new sales were attributable to in-plan periodic deposits, which represent employee contributions via payroll deduction, matching employer contributions and other deposits of a recurring nature. Periodic deposits provide stability to our overall sales volumes, and we believe they are less sensitive to economic and competitive conditions than sales of out-of-plan annuities and other products.
We receive fee-based income for providing plan administration on our open architecture recordkeeping platform, from our variable annuity separate account and from investment advisory services, and spread-based income from fixed annuity and fixed index annuity assets. Fee-based income is primarily based on the assets under administration and spread-based income is based on the difference between crediting rates and yields earned on assets we invest in our general account.
The following table presents Group Retirement spread and fee income:
| | | | | | | | | | | | | | | | | | | | | | | | | | | | | |
| For the years ended December 31, |
| (in millions) | | 2022 | | 2021 | | 2020 |
Net base spread income(a) | | $ | 749 | | 47.2 | % | | $ | 761 | | 36.5 | % | | $ | 799 | | 44.3 | % |
| Variable investment income, excluding affordable housing | | 118 | | 7.4 | % | | 424 | | 20.3 | % | | 215 | | 11.9 | % |
| Affordable housing | | — | | — | % | | 84 | | 4.0 | % | | 74 | | 4.1 | % |
Total Spread income(b) | | $ | 867 | | 54.6 | % | | $ | 1,269 | | 60.8 | % | | $ | 1,088 | | 60.3 | % |
Fee Income(a)(c) | | 720 | | 45.4 | % | | 817 | | 39.2 | % | | 715 | | 39.7 | % |
| Total | | $ | 1,587 | | 100.0 | % | | $ | 2,086 | | 100.0 | % | | $ | 1,803 | | 100.0 | % |
(a) The results for the years ended December 31, 2022 and 2021 have been updated to reflect the adoption of LDTI. No updates have been made to the results for the year ended December 31, 2020 as our effective date for LDTI adoption was January 1, 2021.
(b) Total spread income represents base net investment income less interest credited to policyholder accounts balances, exclusive of amortization of DSI of $14 million, $15 million and $0 million for the years ended December 31, 2022, 2021 and 2020, respectively.
(c) Fee income is defined as policy fees plus advisory fee and other income.
The following table presents Group Retirement account value by product:
| | | | | | | | | | | | | | | | | | | | | | | | | | | | | |
| December 31, |
| (in billions) | | 2022 | | 2021 | | 2020 |
| By product | | | | | | | | | |
| Variable annuity without GLB | | $ | 55.3 | | 71.7 | % | | $ | 66.5 | | 75.2 | % | | $ | 63.0 | | 74.8 | % |
| Variable annuity with GLB | | 2.1 | | 2.7 | % | | 2.7 | | 3.1 | % | | 2.7 | | 3.2 | % |
| Fixed annuity | | 15.5 | | 20.1 | % | | 15.1 | | 17.1 | % | | 14.7 | | 17.5 | % |
| Fixed index annuity | | 4.2 | | 5.5 | % | | 4.1 | | 4.6 | % | | 3.8 | | 4.5 | % |
| Total | | $ | 77.1 | | 100.0 | % | | $ | 88.4 | | 100.0 | % | | $ | 84.2 | | 100.0 | % |
Distribution
Since we started our first K-12 retirement plan relationship in 1964, Group Retirement has built a large, well-diversified business with many long-tenured partnerships. Group Retirement is supported by an institutional business development professionals that partners with the plan consultant community and maintains relationships with existing plan sponsors. The team is structured to engage effectively across our different employer markets to acquire, retain and meet the different needs of exclusive and multi-vendor relationships.
We offer plan sponsors actionable insights through SponsorFIT (“SponsorFIT”), our intuitive plan sponsor portal, helping plan sponsors use data to make well-informed decisions. With real-time data on participant engagement, advisor activity, and investment selection, plan sponsors can spot trends and adjust for improved retirement outcomes. Our relationship management team works closely with plan sponsors to leverage plan data and other key metrics from SponsorFIT to build comprehensive business plans aimed at improving their overall plan health.
As of December 31, 2022, we employed approximately 1,100 employee financial advisors, averaging approximately 10 years of tenure with our company. These advisors are able to engage plan participants early in their careers and serve them throughout their entire savings and retirement journey. To meet plan sponsor preferences and client needs, we have a range of financial professionals, including salaried retirement plan consultants, financial advisors and phone-based financial professionals to provide the right level of support. These professionals provide a wide range of services, including enrollment support, details on plan design, financial plans and individual financial wellness programs.
Our clients have access to self-service tools and education on our participant digital service platform specific to our Group Retirement business. In addition, we offer an interactive financial planning tool, Retirement Pathfinder, a do-it-yourself option or the choice to build a financial plan with an advisor. Retirement Pathfinder considers the individual’s entire financial picture and enables real-time decision-making relative to savings levels, investment allocation, retirement date, and personal goals, putting our clients in control of their financial futures. Our advisors seek to meet our clients early on in their careers and advocate for good financial planning habits, drive increased contributions and asset levels and provide support into and through retirement. As of December 31, 2022, approximately 1.6 million of our in-plan participants did not have an out-of-plan product, resulting in a significant pipeline of potential clients for deeper engagement with our employee financial advisors. Over time, we support our clients entering the spending phase of their financial journey by reviewing solutions such as remaining in-plan or other out-of-plan options, with approximately 20% of rollovers out of their retirement plans being retained by our advisors in an out-of-plan IRA in the year ended December 31, 2022.
Group Retirement has been actively investing in technology and contemporary digital solutions to improve the client experience and optimize our platform. These investments have led to broad-based improvements, efficiencies and increases in client satisfaction.
Markets
We see significant growth opportunities in two of the fastest growing segments of the U.S. retirement market. Our core in-plan business targets tax exempt and public sector institutions spanning K-12 schools, higher education institutions, healthcare providers, government employers and other tax-exempt institutions. Our out-of-plan business targets IRAs, which, according to Cerulli Associates, is expected to be the largest and fastest-growing segment of U.S. retirement assets. The end consumers in our core in-plan business are primarily mass market and mass affluent, with smaller average account sizes and are younger than our Individual Retirement clients.
Competition
Our Group Retirement segment sells annuities and other brokerage and advisory services and competes for plan sponsor and out-of-plan clients. In the plan sponsor market, Group Retirement competes to provide retirement plan products, primarily to serve tax exempt and public sector employers, with other insurance companies and asset managers. We have a history of providing competitive products with a high-touch service model to employers; however, pressure on fees and need for high tech solutions can impact new business sales and ability to grow profitably. In the out-of-plan market, Group Retirement competes with other broker-dealers and registered investment advisors in serving individuals’ holistic retirement planning needs. We meet these needs through the financial planning process with a combination of proprietary and limited non-proprietary annuities, investment advisory brokerage services offering mutual funds, portfolio models and ETFs.
Strategy
Continue to grow our sophisticated advisory platform
We intend to continue to grow our high-margin, capital-efficient in-plan and out-of-plan advisory platform by providing comprehensive financial planning services through approximately 1,100 employee financial advisors as of December 31, 2022. We believe our employee financial advisors will continue to play an important role in growing the advisory platform by providing full-service investment and retirement planning advice to long-term clients and their families. By continuing to offer third-party mutual funds and expanding the annuity offerings, we expect to capture additional fee-based revenue while providing our clients attractive financial solutions outside of the scope of our own product suite.
Increase penetration in core markets and expand into new markets and solutions
We plan to continue to target certain sub-markets with a strong need for in-plan advice, attractive profitability and alignment to our business strengths, including tax-exempt and public sector employees in the K-12, higher education, healthcare provider, government employer and other tax-exempt institution markets. We intend to leverage our strong market positioning, platform capabilities and relationships with plans and plan consultants to continue to drive new plan relationships, secure exclusive vendor status and expand participation rates. In addition, we expect to continue to build new businesses and solutions to access adjacent market opportunities.
Build deeper, broader and longer-term client relationships
We expect to continue to develop meaningful, long-term relationships with clients earlier in their financial life cycle of accumulating retirement savings by leveraging our in-plan market share, broad suite of end-to-end capabilities and highly experienced in-house advisor network. Our goal is to build trust with our clients over time and tailor our engagement based on their ongoing needs. As our client’s financial needs mature, we will look for additional opportunities to serve our clients’ interests with a diverse range of financial products and services.
Invest in technology and digitization to enhance the client experience
We intend to continue to invest in technology and digitization to meet the rapidly changing consumer expectations for responsiveness and personalization. We have already made significant investments in digitizing our advisors’ end-to-end toolkits to provide differentiated interactive experiences, which we expect will help us win new business and drive participant enrollment and enhance financial wellness. In addition, we are actively developing tools for plan sponsors to drive plan utilization, educate on plan benefits, and enhance and monitor participant engagement.
Risk Management
Our Group Retirement risk management philosophy begins with the way we generate business, recognizing the opportunity for long-term, multi-product relationships with plan sponsors and individuals. Our in-plan solutions are open architecture or annuity-based record-keeping platforms that generate a combination of fee- and spread-based income and have minimal exposure to guaranteed living benefits. Similarly, most of our out-of-plan business is in accumulation-oriented annuities, brokerage and advisory solutions. For the proprietary annuity with living benefits that we sell, we leverage the product, design, pricing, hedging and administrative capabilities of Individual Retirement. Our Group Retirement risk management approach is also designed to integrate and account for our VALIC Financial Advisors brokerage and advisory business.
Diversified business mix
The broad scope of our products and services, including recordkeeping, proprietary and limited non-proprietary annuities, mutual funds and advisory services provides a diverse source of fee and spread income and includes solutions with differing capital needs. We do not have any significant concentration of earnings, given the large number of plans and individual clients across multiple market segments and geographies.
Product design
Retirement plans: For recordkeeping, plans using our in-plan recordkeeping are designed and priced on a case-by-case basis to balance competitiveness, risk, capital needs and profitability. For annuity plans, we manage crediting rates, investment options and our cost structure to help achieve desired returns.
Proprietary annuities: Our proprietary annuities are primarily accumulation-oriented products. Products with guaranteed living benefits mirror the design and risk management framework, including hedging, followed by Individual Retirement.
Variable annuity: Our variable annuity GMDB exposure is primarily related to return of premium guarantees, including roll-up policies, 100% of which will revert to return of premium after the relevant individual reaches age 70.
The following table presents our account value by GMDB design in our variable annuity portfolio:
| | | | | | | | | | | | | | | | | | | | | | | | | | | | | |
| December 31, |
| (in billions) | | 2022 | | 2021 | | 2020 |
Roll-up, will revert to return of premium* | | $ | 31.7 | | 55.3 | % | | $ | 40.5 | | 58.6 | % | | $ | 39.4 | | 60.0 | % |
Roll-up, reverted to return of premium* | | 15.4 | | 26.8 | % | | 16.8 | | 24.3 | % | | 14.9 | | 22.7 | % |
| Return of premium | | 9.9 | | 17.2 | % | | 11.6 | | 16.7 | % | | 11.1 | | 16.8 | % |
| Return of account value | | 0.3 | | 0.5 | % | | 0.2 | | 0.3 | % | | 0.2 | | 0.4 | % |
| Maximum anniversary value | | 0.1 | | 0.2 | % | | 0.1 | | 0.1 | % | | 0.1 | | 0.1 | % |
| Total | | $ | 57.4 | | 100.0 | % | | $ | 69.2 | | 100.0 | % | | $ | 65.7 | | 100.0 | % |
* Group Retirement guaranteed rollup benefits generally revert to the return of premium at age 70. As of December 31, 2022, this includes 202,994 contracts for policyholders age 70 and over, with associated account values of $8.5 billion held in the general account and $6.9 billion held in separate accounts; as of December 31, 2021, this includes 192,606 contracts for policyholders age 70 and over, with associated account values of $8.3 billion held in the general account and $8.5 billion held in separate accounts. These contracts which have reverted to return of premium benefits due to the attained age of the policyholder represent a net amount at risk of $64 million and $19 million at December 31, 2022 and December 31, 2021, respectively.
The following table presents our variable annuity account values by benefit type:
| | | | | | | | | | | | | | | | | | | | | | | | | | | | | |
Variable annuity account values by benefit type* | December 31, |
| (in billions) | | 2022 | | 2021 | | 2020 |
| GMDB only | | $ | 55.3 | | 96.3 | % | | $ | 66.5 | | 96.0 | % | | $ | 63.0 | | 95.9 | % |
| GMDB and GMWB | | 2.1 | | 3.7 | % | | 2.7 | | 4.0 | % | | 2.7 | | 4.1 | % |
| Total | | $ | 57.4 | | 100.0 | % | | $ | 69.2 | | 100.0 | % | | $ | 65.7 | | 100.0 | % |
* Excludes a block of assumed business with total account value of $113 million, $161 million and $183 million as of December 31, 2022, December 31, 2021 and December 31, 2020, respectively.
Variable annuity net amount at risk
The NAR for Group Retirement’s GMDB and GMWB are calculated in the same way as described for Individual Retirement.
The following table presents our variable annuity NAR by guarantee type:
| | | | | | | | | | | | | | | | | | | | | | | |
| December 31, |
| | 2022 | | 2021 | | 2020 |
| (in millions) | | NAR | | | NAR | | | NAR | |
GMDB(b) | | $ | 371 | | | | $ | 159 | | | | $ | 180 | | |
| | | | | | | | | |
Combined(a)(b) | | $ | 39 | | | | $ | 14 | | | | $ | 61 | | |
(a) Certain contracts contain both guaranteed GMDB and GMWB features and are modeled together for the purposes of calculating the MRB.
(b) The results for the years ended December 31, 2022 and 2021 have been updated to reflect the adoption of LDTI. No updates have been made to the results for the year ended December 31, 2020 as our effective date for LDTI adoption was January 1, 2021.
The primary risk associated with the fixed investment option we offer, both in-plan and out-of-plan, relates to low fixed income returns leading to spread compression. For several years, we have been successful in introducing lower GMIR fixed options into many of our plans. In addition, consistent with Individual Retirement, we have reduced the GMIRs on our fixed annuities and fixed investment options over time, in line with market conditions and competitor actions. Disciplined rate setting has also helped to mitigate some of the pressure on spreads. Since December 31, 2019, the proportion of the portfolio with no GMIR or a GMIR of less than 2% has grown from 34% to 47%, due to the issuance of new business and run-off of older contracts with higher GMIRs.
Fixed annuities and fixed investment options offered in-plan are exposed to significantly less disintermediation risk in the event of rising interest rates due to plan and participant level restrictions on withdrawals. Group Retirement annuity deposits are typically subject to five-to-seven year surrender charge periods, which may also help mitigate increased early duration surrenders in a rising rate environment.
Our out-of-plan fixed index annuity product design and approach to hedging mirrors that of Individual Retirement, with Group Retirement sales beginning in 2015.
The following table presents our fixed index annuity account value by guarantee type:
| | | | | | | | | | | | | | | | | | | | | | | | | | | | | |
| December 31, |
| (in millions) | | 2022 | | 2021 | | 2020 |
| No GMWB | | $ | 2,401 | | 56.3 | % | | $ | 2,249 | | 54.8 | % | | $ | 2,003 | | 53.0 | % |
| GMWB | | 1,860 | | 43.7 | % | | 1,853 | | 45.2 | % | | 1,775 | | 47.0 | % |
| Total | | $ | 4,261 | | 100.0 | % | | $ | 4,102 | | 100.0 | % | | $ | 3,778 | | 100.0 | % |
Operational risk management
Retirement plan recordkeeping and administration, brokerage and advisory services are complex and highly regulated. As a result, our Group Retirement business faces a variety of operational risks, including people, process, technology and external events risk. We have a risk and control team to facilitate the identification and mitigation of operational risks along with a dedicated Enterprise Risk Management (“ERM”) team to provide review and challenge of management’s risk and control self-assessments, as well as oversight and monitoring of operational risk. Additionally, Group Retirement has a dedicated team of compliance professionals who bring a variety of regulatory expertise to bear as part of the overall operational risk management program.
LIFE INSURANCE
Overview
We develop and distribute life insurance products in the U.S. market (“Domestic Life”) with a growing presence in the life insurance market in the United Kingdom and the distribution of private medical insurance in Ireland (“International Life”). We are a key player in the term life insurance, index universal life insurance and smaller face amount whole life insurance markets, ranking as a top 25 seller of term life insurance (“Term”), universal life insurance (“UL”) and whole life insurance (“Whole Life”) products for the twelve months ended September 30, 2022. We are also expanding our presence in transactional segments of the Whole Life market with new product offerings. Our well-balanced distribution platform enables us to have access to approximately 950 MGAs/BGAs and approximately 33,000 independent agents as of December 31, 2022 in a rapidly evolving market. As of December 31, 2022, we had approximately 4.4 million in-force policies, net of those ceded to Fortitude Re in our Domestic Life business. As of December 31, 2022, we had $23.0 billion of net insurance liabilities, as well as $984 billion of in-force life insurance coverage in our Domestic Life business, and $195 million of net insurance liabilities as well as $225 billion of in-force life insurance coverage and approximately 2.6 million policyholders in our International Life business.
Versatile and competitive product suite: We offer a competitive and flexible product suite that is designed to meet the needs of our specific customer segments and actively manage new product margins and in-force profitability. We actively participate in chosen product lines which we believe have better growth and margin prospects for our offerings, including Term and index universal life insurance (“IUL”), and have reduced our exposure to interest rate sensitive products, including guaranteed universal life insurance (“GUL”) and guaranteed variable universal life insurance (“VUL”), the latter of which we no longer offer. Our dynamic product offerings and design expertise are complemented by our (i) long-term commitment to the U.S. market; (ii) robust distribution capabilities, which enable us to expand our presence in key pockets of growth, such as guaranteed issuance whole life (“GIWL”) and simplified issue whole life (“SIWL”); and (iii) disciplined underwriting profile, consistently resulting in mortality at or below pricing, excluding COVID-19 impacts. We continue to execute our multi-year strategies to enhance returns, including building state-of-the-art digital platforms and underwriting innovations, which are expected to continue to bring process improvements and cost efficiencies.
Well-positioned to meet the growing demand for life insurance: We believe that there is a significant and growing demand in the market for certain types of life insurance and in turn, demand for our products. Consumers have a significant need for life insurance. Additionally, consumers use life insurance to provide living benefits in case of chronic, critical or terminal illnesses, and to supplement retirement income. Yet according to LIMRA, half of American adults surveyed in 2022 did not own any form of life insurance. Further, 68% of respondents said they need life insurance, representing an 18% “life insurance protection gap,” equal to twice the amount recorded in 2019. Against this trend, almost one-third of Americans (31%) say they are more likely to purchase coverage because of the pandemic, according to LIMRA.
Diversified distribution network with significant direct-to-consumer platforms: We have strong third-party distribution relationships, providing us with access to approximately 950 MGAs/BGAs and approximately 33,000 independent agents as of December 31, 2022. Within our platform, we have a growing connection to direct-to-consumer distribution both through select partnerships, where the end distributor sells via a direct marketing model, and our wholly owned AIG Direct that represented 11% of our sales for the year ended December 31, 2022. These distribution relationships provide us with access to a broad range of customers from the middle market to high net worth and present us with growth opportunities across our customer base.
The following table presents a breakdown of our Life continuous payment premium equivalent (“CPPE”)* sales by geography:
| | | | | | | | | | | | | | | | | | | | | | | | | | | | | |
| For the years ended December 31, |
| (in millions) | | 2022 | | 2021 | | 2020 |
| Domestic Life | | $ | 248 | | 55.9 | % | | $ | 252 | | 55.6 | % | | $ | 267 | | 58.6 | % |
| International Life | | 196 | | 44.1 | % | | 201 | | 44.4 | % | | 188 | | 41.4 | % |
| Total | | $ | 444 | | 100.0 | % | | $ | 453 | | 100.0 | % | | $ | 455 | | 100.0 | % |
* Life insurance sales are shown on a CPPE basis. Life insurance sales include periodic premiums from new business expected to be collected over a one-year period and 10% of unscheduled and single premiums from new and existing policyholders.
The following table presents a breakdown of our International Life CPPE sales by product:
| | | | | | | | | | | | | | | | | | | | | | | | | | | | | |
| For the years ended December 31, |
| (in millions) | | 2022 | | 2021 | | 2020 |
| Group Business | | $ | 96 | | 48.9 | % | | $ | 100 | | 49.7 | % | | $ | 96 | | 51.0 | % |
| Term Life | | 66 | | 33.7 | % | | 69 | | 34.3 | % | | 63 | | 33.5 | % |
| Critical Illness | | 16 | | 8.2 | % | | 18 | | 9.0 | % | | 14 | | 7.4 | % |
| Whole life | | 16 | | 8.2 | % | | 11 | | 5.5 | % | | 11 | | 5.9 | % |
| Income Protection | | 1 | | 0.5 | % | | 2 | | 1.0 | % | | 2 | | 1.1 | % |
| Benefits and riders | | 1 | | 0.5 | % | | 1 | | 0.5 | % | | 2 | | 1.1 | % |
| Total | | $ | 196 | | 100.0 | % | | $ | 201 | | 100.0 | % | | $ | 188 | | 100.0 | % |
The following table presents a breakdown of our Ireland Life gross commission by product:
| | | | | | | | | | | | | | | | | | | | | | | | | | | | | |
| For the years ended December 31, |
| (in millions) | | 2022 | | 2021 | | 2020 |
Private medical insurance commission* | | $ | 106 | | 97.3 | % | | $ | 103 | | 97.2 | % | | $ | 90 | | 97.8 | % |
| Life income | | 2 | | 1.8 | % | | 2 | | 1.9 | % | | 1 | | 1.1 | % |
| Other income | | 1 | | 0.9 | % | | 1 | | 0.9 | % | | 1 | | 1.1 | % |
| Total | | $ | 109 | | 100.0 | % | | $ | 106 | | 100.0 | % | | $ | 92 | | 100.0 | % |
*Includes health and well-being.
The following table presents a breakdown of our Life insurance net insurance liabilities by geography:
| | | | | | | | | | | | | | | | | | | | | | | | | | | | | |
| Net insurance liabilities by Geography | December 31, |
| (in millions) | | 2022 | | 2021 | | 2020 |
| Domestic Life | | $ | 22,984 | | 99.2 | % | | $ | 27,705 | | 98.8 | % | | $ | 25,968 | | 98.0 | % |
| International Life | | 195 | | 0.8 | % | | 336 | | 1.2 | % | | 520 | | 2.0 | % |
| Total | | $ | 23,179 | | 100.0 | % | | $ | 28,041 | | 100.0 | % | | $ | 26,488 | | 100.0 | % |
Products
We are focused on providing financial security for our policyholders and their loved ones when they need it most. Our life insurance and protection products include Term, IUL and Whole Life. Our product suite was historically positioned towards higher net worth customers, but our more recent mix of products has expanded our presence in the middle market with the introduction of GIWL and SIWL products, more emphasis on selected distribution channels and de-emphasis of guaranteed universal life. Our Domestic Life business accounts for $22.4 billion of our general account value and $0.8 billion of our separate account value as of December 31, 2022.
We offer group and individual life insurance in the UK, and distribute private medical insurance in Ireland. Our UK business has grown rapidly and we believe it to be the fourth-ranked provider of individual life new business in the market as of September 30, 2022. In Ireland, we are the second-ranked distributor and administrator of private medical insurance by market share as of December 31, 2021, through an MGA model whereby we manage the distribution and customer service for our clients while leveraging a deep carrier relationship to provide the risk underwriting. As of December 31, 2022, we had $225 billion of in-force coverage across 2.6 million policyholders in the UK, and over 676,000 customers in Ireland.
Our traditional life insurance (“Traditional Life”) products include Term and Whole Life. Our universal life insurance (“Universal Life”) products include IUL, GUL and VUL.
The following table presents a breakdown of our Life insurance premium and deposits by product:
| | | | | | | | | | | | | | | | | | | | | | | | | | | | | |
| For the years ended December 31, |
| (in millions) | | 2022 | | 2021 | | 2020 |
| Traditional Life | | $ | 1,820 | | 42.9 | % | | $ | 1,804 | | 42.6 | % | | $ | 1,772 | | 43.8 | % |
| Universal Life | | 1,600 | | 37.8 | % | | 1,635 | | 38.7 | % | | 1,649 | | 40.7 | % |
| | | | | | | | | |
| Total US | | 3,420 | | 80.7 | % | | 3,439 | | 81.3 | % | | 3,421 | | 84.5 | % |
| International | | 816 | | 19.3 | % | | 789 | | 18.7 | % | | 626 | | 15.5 | % |
| Total | | $ | 4,236 | | 100.0 | % | | $ | 4,228 | | 100.0 | % | | $ | 4,047 | | 100.0 | % |
The following table presents a breakdown of our Domestic Life insurance net insurance liabilities by product:
| | | | | | | | | | | | | | | | | | | | | | | | | | | | | |
| For the years ended December 31, |
| (in billions) | | 2022 | | 2021 | | 2020 |
| Universal Life* | | $ | 14.0 | | 60.9 | % | | $ | 15.9 | | 57.4 | % | | $ | 16.3 | | 62.7 | % |
| Traditional Life* | | 9.0 | | 39.1 | % | | 11.8 | | 42.6 | % | | 9.7 | | 37.3 | % |
| | | | | | | | | |
| Total | | $ | 23.0 | | 100.0 | % | | $ | 27.7 | | 100.0 | % | | $ | 26.0 | | 100.0 | % |
* The results for the years ended December 31, 2022 and 2021 have been updated to reflect the adoption of LDTI.
Our product suite is competitive and flexible, and is designed to accommodate the current and future needs of specific customer segments. For example, our cash access features provide access to liquidity prior to death, while our enhanced and guaranteed cash value features enable the policy to flex to address future consumer needs. Our recent and current product offerings include:
Traditional Life
Term Life Insurance — Term provides death benefit coverage and level premiums for a specified number of years. A focus area for our business, we offer Term products with coverage durations and coverage tailored to serve our customers’ financial plans. We have a strong reputation as a top Term insurance provider, with key focus ages between 20 and 70 years old. The average face amount of our Term insurance products is approximately $725,000.
Whole Life Insurance — Whole Life provides permanent death benefit coverage and a tax-advantaged savings component that accumulates at a fixed rate. We offer a GIWL product focused on the senior final expense market at low face amounts. With more of the population reaching retirement age over the next several years, we see this as an area that we expect to meaningfully contribute to our growth. Our success and growth in the senior market has led to the development of an SIWL product for this market, which had a broad market launch in the second half of 2022 on a digital platform to streamline the sales process and customer experience as well as scale volume more cost effectively. Our GIWL and SIWL products have an average face amount of approximately $10,000 and $15,000, respectively. For both GIWL and SIWL products, we target customers between the ages of 50 and 80 years old.
GIWL is underwritten with a 100% acceptance rate regardless of an individual’s underlying health. This underwriting methodology is typically paired with a graded death benefit product that limits death benefit proceeds during the first few years of a life insurance policy to minimize adverse mortality impacts and keep coverage affordable. SIWL underwriting requires limited applicant information relative to traditional underwriting, requiring an abbreviated application without a physical examination or laboratory testing. This streamlined structure is typically associated with simpler products and lower death benefit amounts to ensure the product offering is made available at an affordable price and meeting different client needs.
Universal Life
Index Universal Life Insurance — IUL provides permanent death benefit coverage and a tax-advantaged savings component that accumulates with performance tied to a chosen index. We provide two main IUL products, Max Accumulator+ and Value+ Protector, to meet the accumulation and protection needs of our policyholders in a wide range of target ages from younger to middle-aged. These products allow the statutory policyholder to participate in a portion of the performance of an index price movement while also protecting them from negative return risk. Both of our IUL products provide some customers with a fluid-less option up to a $2 million face amount, offering a streamlined customer experience. The Max Accumulator+ product has key focus ages between 30 and 55 years old with average face amounts of approximately $500,000, while the Value+ Protector product has key focus ages between 45 and 70 years old with average face amounts of approximately $300,000.
Guaranteed Universal Life Insurance — GUL provides permanent death benefit coverage and a tax-advantaged savings component that accumulates at a crediting rate set by the insurance company. We issue a guaranteed death benefit product that provides low-cost permanent death benefit protection. Beginning in 2019, we began to diversify our sales away from GUL to
focus on less interest rate sensitive market segments, resulting in a steep decline in sales. We do not anticipate this product line to be a large contributor to our portfolio over the near term.
The following table presents the net balance sheet impact for universal life policies with secondary guarantees and for universal life policies with similar expected benefit payment patterns. The table reflects the impact of reinsurance, including business ceded to Fortitude Re, and includes policyholder benefit liabilities. Account values for index universal life policies are removed from this table.
| | | | | | | | | | | | | | | | | | | | |
| | For the years ended December 31, |
| (in millions) | | 2022 | | 2021 | | 2020 |
| ULSG liability, excluding impact of unrealized appreciation on investments, beginning of year* | | $ | 2,653 | | | $ | 2,363 | | | $ | 1,942 | |
| Actuarial Assumption updates* | | (24) | | | (116) | | | 180 | |
| Incurred guaranteed benefits* | | 909 | | | 934 | | | 711 | |
| Paid guaranteed benefits* | | (605) | | | (528) | | | (470) | |
| ULSG liability, excluding impact of unrealized appreciation on investments, end of year | | $ | 2,933 | | | $ | 2,653 | | | $ | 2,363 | |
| ULSG Account value* | | 1,821 | | | 1,834 | | | 1,902 | |
| ULSG liability, excluding impact of unrealized appreciation on investments, end of year ULSG AV | | $ | 4,754 | | | $ | 4,487 | | | $ | 4,265 | |
| ULSG Fee value | | $ | 1,066 | | | $ | 1,027 | | | $ | 1,087 | |
* The results for the years ended December 31, 2022 and 2021 have been updated to reflect the adoption of LDTI. No updates have been made to the results for the year ended December 31, 2020 as our effective date for LDTI adoption was January 1, 2021.
As of December 31, 2022, the net ULSG liability of $2.9 billion represents approximately 1% of our net insurance liabilities. As of December 31, 2022, the statutory net ULSG liability of approximately $2.6 billion represents approximately 0.9% of our combined statutory reserves of the fleet. We carry positive statutory cash flow testing and GAAP loss recognition margins on this portfolio, noting that our ultimate lapse rates are zero for statutory reserves and generally 1.0% or lower for GAAP liabilities.
Variable Universal Life Insurance — VUL provides permanent death benefit coverage and a tax-advantaged savings component whose performance is tied to underlying investment funds selected by the policyholder. We made the decision to exit this market in 2021 due to unattractive profitability and embedded volatility from rate and equity exposures.
The following table presents a breakdown of our Domestic Life CPPE sales by product:
| | | | | | | | | | | | | | | | | | | | | | | | | | | | | |
| (in millions) | For the years ended December 31, |
| 2022 | | 2021 | | 2020 |
| Traditional Life | | $ | 154 | | 62.1 | % | | $ | 150 | | 59.5 | % | | $ | 154 | | 57.7 | % |
| Universal Life | | 94 | | 37.9 | % | | 102 | | 40.5 | % | | 113 | | 42.3 | % |
| Total | | $ | 248 | | 100.0 | % | | $ | 252 | | 100.0 | % | | $ | 267 | | 100.0 | % |
The following table presents Life Insurance underwriting margin:
| | | | | | | | | | | | | | | | | | | | |
| (in millions) | For the years ended December 31, |
| 2022 | | 2021 | | 2020 |
| Underwriting margin* | | $ | 1,561 | | | $ | 1,614 | | | $ | 1,261 | |
* The results for the years ended December 31, 2022 and 2021 have been updated to reflect the adoption of LDTI. No updates have been made to the results for the year ended December 31, 2020 as our effective date for LDTI adoption was January 1, 2021.
Distribution
We have a strong and well-balanced distribution platform through which we reach and serve a wide range of customers. Our products are sold primarily through independent distribution channels and our direct-to-consumer platform, AIG Direct. Our platform provides access to approximately 33,000 independent agents, approximately 950 MGAs/BGAs and approximately 130 in-house agents as of December 31, 2022.
The breadth of our distribution platform enables us to match our products with appropriate channels. For example, we sell final expense coverage for seniors primarily through our Transactional Markets Groups (“TMG”) and a specialized IUL product primarily through Partners Group (“PG”). Furthermore, our strategy is to continue to expand our presence in underserved, higher growth areas, notably in the middle market. We also intend to strengthen our presence in channels exhibiting strong sales growth in products that we believe offer superior risk-adjusted returns, including TMG and PG. Regardless of the market, we seek to provide our policyholders with meaningful value for their premium dollars.
Our current distribution channel structure is outlined below:
AIG Direct — Our direct-to-consumer channel employs approximately 130 salaried agents as of December 31, 2022, and sells Term products through a call center model. AIG Direct primarily markets to middle market consumers through a variety of direct channels, including several types of digital channels such as search advertising, display advertising and email as well as direct mail.
Brokerage — A variety of traditional intermediaries market our Term and IUL products to middle market, mass affluent, affluent and some high net worth markets. Our broker intermediaries typically sell through a mix of digital, direct and in-person methods. We have significantly re-priced and de-emphasized GUL products in the brokerage channel over the last several years.
Partners Group — We partner with independent MGAs who tend to work with a smaller number of carriers to sell our Term and IUL products to middle market, mass affluent and affluent markets. Our independent MGA partners distribute products primarily face-to-face.
Transactional Markets Group — We partner with senior market-focused BGAs and direct marketers to provide GIWL products for middle market seniors, with a SIWL product launched in the second half of 2022. We have approximately 120,000 contracted agents who can sell our products through a mix of direct marketing and traditional methods. Until November 2021, TMG only sold GIWL products.
The following table presents a breakdown of our Domestic sales by distribution channel:
| | | | | | | | | | | | | | | | | | | | | | | | | | | | | |
| (in millions) | For the years ended December 31, |
| 2022 | | 2021 | | 2020 |
| Brokerage | | $ | 85 | | 34.3 | % | | $ | 84 | | 33.3 | % | | $ | 83 | | 31.1 | % |
| Partners Group | | 72 | | 29.0 | % | | 69 | | 27.4 | % | | 79 | | 29.6 | % |
| Transactional Markets | | 57 | | 23.0 | % | | 60 | | 23.8 | % | | 53 | | 19.9 | % |
| Direct | | 28 | | 11.3 | % | | 30 | | 11.9 | % | | 38 | | 14.2 | % |
| Other | | 6 | | 2.4 | % | | 9 | | 3.6 | % | | 14 | | 5.2 | % |
| Total | | $ | 248 | | 100.0 | % | | $ | 252 | | 100.0 | % | | $ | 267 | | 100.0 | % |
Markets
Our life insurance products are sold to a diverse demographic including high net worth, affluent, mass affluent and middle market consumers. We continue to see significant growth opportunities in the market, with nearly half of American adults not owning any form of life insurance, despite the growing number who recognize the importance of coverage. As a result, we anticipate expansion of life insurance and protection products.
Competition
We compete in a mature market with other large, well-established carriers including mutual, private and public insurance companies. Over the past several years, low interest rates decreased the returns on spread-based life products, causing several of our peers to reevaluate their portfolio strategy and exit from select operations. Nevertheless, the life insurance industry remains highly competitive, with existing players and new entrants competing on factors such as product design, scale, pricing, financial strength, service, digital capabilities and name brand.
Strategy
Diverse distribution channels: We intend to continue to expand on our history of innovation to offer high value and transparent products to consumers. We expect to place enhanced focus on driving growth through our Transaction Markets Group, Partners Group and direct-to-consumer channels.
Meet consumer demand from protection gap: We believe that our distribution footprint and product suite position us well to address the life insurance protection gap that is prevalent across the United States. We have a long history of strong performance in the Term market that we expect to grow through enhanced consumer awareness of life insurance coupled with
an improved new business process. We are well positioned for growth in the IUL and final expense markets through a combination of innovative products and processes delivering value for the end consumer.
Digitization and modernization of purchase and underwriting processes: We seek to streamline and improve the client and agent experience through digital engagement, process digitization and continued implementation of underwriting innovation. We recognize the inconveniences that traditional underwriting processes can present to consumers and endeavor to make the purchase experience easier and more seamless for potential clients while maintaining our focus on risk management and go-forward profitability. We have and will continue to expand our life insurance underwriting data sources to help us augment application information and obtain more precise underwriting data. The traditional and invasive medical exam and fluid analysis can, in certain situations, be replaced and/or confirmed with available data tools that provide automated and historic applicant information. Using this information in our internally built model allows us to expedite and refine underwriting outcomes. We plan to continue to innovate in the underwriting and customer acquisition process, while focusing on fair, transparent and reasonable use of new technologies in the life insurance underwriting process. For a discussion of risks associated with such technological changes, see “Risk Factors—Risks Relating to Business and Operations—We face intense competition in each of our business lines and technological changes may present new and intensified challenges to our business” in the 2022 Form 10-K. We utilize our risk management and governance frameworks to support this innovation. See “—Risk Management—Underwriting” below for additional information.
Generate strong cash flows through reduction of interest sensitive and capital intensive products: We are continuing to transition our products away from capital-intensive and highly interest sensitive products and towards more focused, protection-oriented products such as GIWL, SIWL, IUL and Term.
Risk Management
Our approach to risk management begins with the selection of liabilities that we choose to generate. Our Life Insurance portfolio provides a balanced source of returns with a focus on segments of the life insurance market with less capital intensity and interest rate sensitivity. We use sophisticated and well-developed underwriting procedures to price the risks we originate and a measured approach to reinsurance to determine the exposures we chose to retain. Our enterprise-wide asset liability management and hedging practices are leveraged to further improve the risk profile of our Life Insurance business.
Diversification
Our Life Insurance business is diversified by our multi-channel distribution approach, accessing both direct-to-consumer and third-party channels, and by geography through our International Life operations.
Product design and pricing
We aim to provide protection-focused products through our Term, Whole Life and IUL products, which have less capital intensity than other segments of the market, such as UL products with secondary guarantees. We believe this product set provides significant consumer value through financial protection and results in an attractive and well-managed liability portfolio.
Product pricing is part of a robust product development process that takes into consideration a balance of market positioning, risk analysis and profitability. A disciplined approach is taken to actively manage new product margins and in-force profitability. For new product sales, we target top quartile market performance with strong margins with the goal of providing a good consumer value for the cost of the product.
Detailed review of all assumptions is conducted and approved with a formal committee structure supported by a wide group of internal stakeholders to ensure risk mitigation and alignment to company objectives.
Our legacy universal life block contains secondary guarantees which become more valuable to the policyholder as interest rates decrease. We have established additional policyholder liabilities (in addition to the base liabilities) to account for future policyholder benefits resulting from these guarantees. We have recently deprioritized the sale of guaranteed universal life and it is expected to continue to account for a small portion of our product portfolio in the future.
Underwriting
We have a disciplined underwriting process designed to perform a comprehensive risk analysis and final assessment on each individual file, assessing the relative risk from both a medical and financial standpoint. The process is designed to meet individual product pricing, mortality and profitability expectations while adhering to our carefully formulated internal medical and nonmedical underwriting guidelines as well as all legislative directives and requirements.
Throughout our history, we have tried to continually improve our underwriting. Since the mid-2000s, we have integrated several newly available sources of data to confirm and refine our traditional underwriting, including databases that house pharmaceutical data, medical claims data and historical lab test data. These additional data sources and analytics include prescription drug databases, medical claims data, historical medical lab data and lab scoring (third-party and in-house scoring across other sources of medical data to incorporate cross-effects, in addition to single measurements of various indications), all of which are now used in various ways across our underwriting process. These sources help augment more traditional data sources such as application questions, lab data gathered via a paramedical visit and physical medical records reviews. We have also continued to refine our process of evaluation within existing data sources, such as gathering more refined data on cardiac conditions and opioid use. We expect to continue to improve our underwriting standards and refine our underwriting guidelines once or more per year. Our team of underwriting and medical professionals is highly experienced averaging more than 25 years of industry experience.
We remain focused on continually incorporating the latest evidence, data and risk experience to enhance our underwriting efficiency through more accurate risk assessments, faster service and enhanced customer satisfaction for both distribution and policyholders — all contributing to increased profitability.
Maintaining strong controls is very important and includes such rigor as periodic audits from our reinsurers, regular internal audit review, comprehensive and continual underwriter training, and in-force risk reviews such as post-issue prescription drug checks, contestable claims and living benefit assessments.
We have also been working to automate certain underwriting reviews so as to make decisions on applications in a similar manner as underwriters today, but without human intervention. This has resulted in material efficiency improvements, including a greater than 65% increase in automated underwriting throughput rates, a more than 15-day average reduction in turnaround times and a 45% reduction in Attending Physician Statement orders since 2017. We plan to continue to increase automated underwriting while maintaining our risk discipline to effectively manage mortality margins.
Accelerated Underwriting (“AU”), underwriting without a traditional medical exam and lab profile, is increasingly a strategic imperative to maintain our core market position. A key focus is on using data sources and analytics to replicate the value of traditional medical information, while maintaining risk discipline. We offer AU on Term insurance products that have face amounts up to $1 million, and IUL insurance products that have face amounts up to $2 million.
While expansion of automated decisioning applications and AU is part of our strategy, we are moving forward carefully with control and compliance processes in place to minimize risk and leverage key learnings. Performance monitoring, risk metrics and exposure limits, back-testing and audits are in place. We conduct due diligence on the distributors and other third parties that are involved with our automated decisioning and AU programs to reduce the risks associated with these new technologies and practices, promote quality and profitable business and avoid potential exploitive practices.The regulatory landscape is developing with respect to ensuring fair, transparent and reasonable use of new technologies in the life insurance underwriting process. We continue to engage through industry trade groups with our regulators with the intention of maximizing optimal customer outcomes. In addition, active involvement in industry thought leadership allows us to learn from best practices and obtain new tools for success as well as mitigate any potential reputational and regulatory risks that arise in this new territory.
Reinsurance
We mitigate our exposure to any particular product by proactively managing our retention policy. We utilize our internal retention, auto-bind and facultative reinsurance capabilities to meet the needs of high net worth customers who require larger face amount policies. We generally limit our exposure on any single life to no greater than $3.5 million for Term, no greater than $10 million on any UL issued in 2020 and later, and no greater than $5 million for the majority of UL issued prior to 2020. These reinsurance partners are consulted frequently from product development and pricing to post-issue audits and reviews.
Hedging
We use hedges to reduce a portion of the market risk contained in our IUL products. To support our obligations under the index account options, we enter into derivatives contracts. The payouts from these contracts, in combination with returns from the underlying fixed income investments, seek to replicate those returns promised to a customer within the products.
We also hedge a portion of the interest rate risk exposure for our GUL products. Interest rate risk for these policies generally emerges due to changes in interest rates between the time a policy is sold and the time annual premiums are paid. In order to mitigate a portion of this interest rate risk, we enter into derivatives contracts whose payouts, in combination with returns from the underlying fixed income investments, seek to replicate the interest rate environment that existed at the time of sale, which helps to stabilize our margins.
U.S. Group Benefits Exit
In 2016, we made a strategic decision to exit the U.S. Group Benefits business, which included Stop Loss, Worksite, and Employer and Affinity products (Life, Disability and Dental). Some product lines were systematically transitioned to chosen carriers, while other blocks moved on their own or were terminated. As of December 31, 2022, liabilities of $337 million related to claims for waiver of premium, long-term disability, third-party administered catastrophic excess major medical coverage and other group products remain with us. These lines of business are currently in run-off with no new business being written. A small staff remains to handle administration, third party administrator management and claims handling.
Impact of COVID-19
The COVID-19 pandemic has resulted in several economic and operational disruptions affecting our businesses. We continue to closely monitor the impact of the COVID-19 pandemic on our life insurance mortality experience.
See “Management’s Discussion and Analysis of Financial Condition and Results of Operations—Executive Summary—Corebridge’s Macroeconomic, Industry and Regulatory Trends—Impact of COVID-19.”
INSTITUTIONAL MARKETS
Overview
Our Institutional Markets business provides sophisticated, bespoke risk management solutions to both financial and non-financial institutions. Institutional Markets complements our retail businesses by targeting large institutional clients. Institutional Markets allows us to opportunistically source long-term liabilities with attractive risk-adjusted return profiles that are consistent with our overall risk management philosophy.
Our Institutional Markets products are distributed in very specialized markets. Our product portfolio consists of annuities sold through the PRT markets and annuities sold in the structured settlements markets, life insurance sold through the COLI and BOLI markets and capital market products, including GICs and synthetic products such as SVW contracts. Institutional Markets also offers reinsurance for pension liabilities, mainly from cedants based in the UK.
The breadth of our Institutional Markets offering allows us to be selective in our liability generation and allocate capital towards the areas where we see the greatest risk-adjusted returns. Over time, this approach has resulted in a collection of strong business lines that each contribute to Institutional Markets’ earnings.
Scale and operating leverage: The transaction sizes across our Institutional Markets products are much larger than in our retail businesses, allowing us to generate significant new business volumes by winning only a few incremental new transactions, while maintaining a small and efficient operational footprint. Our products generate earnings primarily through net investment spread, with a smaller portion of fee-based income and underwriting margin.
Positioned to capture growth: Favorable market trends point to continued demand for our institutional products. We believe the shift away from defined benefit plans is expected to continue to fuel a strong pipeline of mid-sized to jumbo (greater than $1 billion in premium) PRT opportunities, in both the U.S. market, with direct to plan sponsors, and the UK market, via reinsurance, as plan sponsors increasingly seek bespoke options to exit or decrease liabilities and the related administration. The growth in retirement assets and an aging U.S. population will continue to drive growth in our SVW product, which allows qualified professional asset managers (“QPAMs”) managing stable value funds primarily for defined contribution plans and BOLI providers to offer participants a stable return option, which is increasingly valuable as consumers near retirement. Our SVW product provides a tailored alternative to money market funds that is countercyclical in nature and provides incremental opportunities during equity and credit market turbulence.
New asset capabilities: Our ability to generate profitable new business is dependent on our ability to source large specialized asset portfolios that support our product value propositions while generating attractive net investment spreads. We believe our strategic partnership with Blackstone will help us unlock further opportunities in this market through Blackstone’s ability to source and originate scaled and specialized assets both domestically and internationally. We expect this strategic partnership to offer a competitive advantage for our PRT and GIC businesses.
Products
Our Institutional Markets business develops, markets and distributes the following products and solutions.
Pension Risk Transfer
PRT provides solutions for employers who have decided to exit or defease all or a portion of their pension plan by transferring the accrued benefit liabilities and administrative responsibilities to an insurer. Such transfers can reduce obligations to pay future pension benefits to plan participants, eliminate risks and provide for outside administration. Our PRT products are comparable to income annuities, as we generally receive an upfront premium in exchange for paying guaranteed retirement benefits. These products primarily create earnings through spread income. We are active in both the domestic and international PRT markets. According to LIMRA, overall, the domestic PRT market had $56.6 billion of premium in the twelve months ended September 30, 2022. In the domestic market, we offer group annuity contracts to employers for defined benefit pension plan terminations, such as terminal funding, as well as the settlement of partial benefit liabilities. We are cash-balance plan specialists and handle underwriting and administration of unique provisions. We offer contracts of various sizes, historically ranging from mid-market sized transactions to transactions with premiums in excess of $1 billion. Transaction types include buy-in and buy-out transactions which may utilize guaranteed separate accounts. These transactions are often purchased by plan sponsors with assets-in-kind. The majority of our PRT transactions involve full plan terminations. PRT liabilities have a longer duration which allows them to be backed with higher yielding assets benefiting from duration and illiquidity premium. In the international market, we provide funded reinsurance solutions to primary writers in the bulk purchase annuities (“BPA”) market where there is an appetite to cede risk due to capital constraints and requirements. Across the domestic PRT market, we manage the liabilities for plans covering approximately 154,000 participants as of December 31, 2022.
We are also a premier group annuity underwriter and administrator of customized PRT contracts. We believe plan advisors and their clients appreciate our expertise, flexibility and collaborative approach in developing tailored, cost-effective contracts for all sizes and types of defined benefit pension plans, along with unique benefit provisions and special administrative services. We notably created the industry’s first group annuity guide for pension plan terminations and settlements, which contains details on financial quality (criteria defined by Department of Labor (“DOL”) concerning rules for insurer selection), annuity contract experience and service capabilities, contract installation procedures and data requirements, sample participant correspondence and notification, and a sample group annuity contract. As of December 31, 2022, we have $11.4 billion in PRT net insurance liabilities.
Guaranteed Investment Contracts
GICs are single premium accumulation products that provide a guaranteed repayment of principal and a fixed or floating interest rate for a predetermined period of time. Our primary product in the GIC space is a FABN program. We opportunistically issue FABNs, which are sold to institutional investors through investment banks and other third-party broker-dealers. We also borrow from the FHLB utilizing their funding agreement program. These products generate spread-based income without significant longevity or mortality exposure, which enables us to optimize our asset portfolio and improve our returns given the certainty in liability profile. The profitability of our GIC portfolio is largely dependent on market conditions and asset origination. As of December 31, 2022, we have $8.0 billion in net insurance liabilities related to our GICs.
Structured Settlement Annuities
Structured settlement annuities provide periodic payments specifically designed to meet an injured party’s needs over time. These periodic payments consist of recurring payment streams and lump-sum payments on both a guaranteed and life contingent basis. As of December 31, 2022, we had $3.5 billion in structured settlement annuity net insurance liabilities and continued to service $15.3 billion of structured settlement net insurance liabilities ceded to Fortitude Re.
Defined Contribution and BOLI Stable Value Wraps
SVW contracts are synthetic contracts that provide limited guarantees for stable value fund portfolios or COLI-BOLI separate account portfolios, preserving the principal while providing steady, positive returns for participants or institutions. They are typically issued to QPAMs that manage stable value funds, typically for employee benefit plans and life insurance company separate accounts with respect to certain underlying VUL BOLI investment fund options. These products generate earnings through fee income without significant longevity or mortality exposure.
We primarily offer group annuity contracts and are among the leading providers of stable value wrap products to defined contribution employee benefit plans. We had approximately 190 in-force stable value wrap-defined contribution (“SVW-DC”) contracts representing more than $47.1 billion of notional value as of December 31, 2022. We see further growth opportunities in higher margin products, including contracts offered to 403(b) and 529 plan providers. Overall, the SVW market in the United States had $495.8 billion of notional value as of September 30, 2022.
Corporate Markets
COLI-BOLI comprises universal and variable universal life insurance products that are issued to both non-financial and financial corporate clients to provide financial efficiencies and offset rising costs of programs such as health and welfare benefits, post-retirement benefits and supplemental income to key individuals.
We offer a number of COLI-BOLI products, including money center BOLIs and insurance COLIs, and have a client base of nearly 100 institutions as of December 31, 2022. Our BOLI products are sold on a universal life or variable universal life product with exposure to spread and mortality, while our COLI products are sold on a variable universal life product that generates earnings through spread, fee and mortality exposure. As of December 31, 2022, we have $7.2 billion of net insurance liabilities related to our Corporate Markets products.
Within Corporate Markets, we also manage a portfolio of private placement variable annuity and universal life insurance products historically offered in the high net worth market.
The following table presents a reconciliation of Institutional Markets GAAP premiums to premiums and deposits:
| | | | | | | | | | | | | | | | | |
| For the years ended December 31, |
| (in millions) | 2022 | | 2021 | | 2020 |
| Premiums | $ | 2,913 | | | $ | 3,774 | | | $ | 2,564 | |
| Deposits | 1,382 | | | 1,158 | | | 2,284 | |
Other* | 30 | | | 25 | | | 25 | |
| Premiums and deposits | $ | 4,325 | | | $ | 4,957 | | | $ | 4,873 | |
*Other principally consists of ceded premiums, in order to reflect gross premiums and deposits.
Our SVW products, for both the defined contribution market as well as the separate account BOLI market (“SVW-BOLI”), generate fee-based income as a percentage of assets. Our general account PRT, GIC and structured settlement products generate spread-based income on the difference between crediting rates paid and yields earned on assets we invest. Our Corporate Markets products generate underwriting margin, a combination of premiums net of policyholder benefits, spread income and fee income.
The following table presents Institutional Markets spread income, underwriting margin and fee income:
| | | | | | | | | | | | | | | | | | | | | | | | | | | | | |
| For the years ended December 31, |
| (in millions) | | 2022 | | 2021 | | 2020 |
| Spread income* | | $ | 285 | | 67.1 | % | | $ | 487 | | 74.9 | % | | $ | 350 | | 71.9 | % |
| Underwriting margin* | | 77 | | 18.1 | % | | 102 | | 15.7 | % | | 75 | | 15.4 | % |
| Fee income* | | 63 | | 14.8 | % | | 61 | | 9.4 | % | | 62 | | 12.7 | % |
| Total | | $ | 425 | | 100.0 | % | | $ | 650 | | 100.0 | % | | $ | 487 | | 100.0 | % |
* The results for the years ended December 31, 2022 and 2021 have been updated to reflect the adoption of LDTI.
Distribution
Institutional Markets distributes products through the channels described below:
PRT: We source PRT liabilities through our long-standing relationships with insurance and reinsurance brokers and consultants, and through our assumed reinsurance channel from primary insurance partners.
GICs: We have a FABN program, which is a medium term note program under which funding agreements are issued to a special-purpose trust that issues marketable notes. The notes are underwritten and marketed by major investment banks’ broker-dealer operations and are sold to institutional investors. We also borrow from Federal Home Loan Banks (“FHLBs”) by utilizing their funding agreement program and may issue GICs directly to institutional clients or special purposes vehicles.
Structured settlement annuities: As of December 31, 2022, we distributed structured settlement products through independent insurance agencies.
Corporate Markets and SVW-BOLI: We distribute COLI-BOLI and SVW-BOLI through specialized brokers representing large money center banks and corporations.
SVW-DC: We distribute SVW products through QPAMs, trustees of stable value funds and defined contribution plan sponsors.
Markets
Our Institutional Markets business provides sophisticated, bespoke risk management solutions to both financial and non-financial institutions. In PRT, large industry participants compete for a growing pool of assets driven by corporations seeking to transfer longevity and asset risks associated with their pension obligations to insurance companies; in structured settlements, these companies compete to help defendants or insurers of defendants in legal settlements provide long-term streams of payments to plaintiffs; in SVW-DC, QPAMs compete to provide value-added solutions to asset and wealth managers to satisfy growing demand for stable retirement income.
Competition
Institutional Markets operates in a competitive market and competes with large industry participants. In each product category, we face strong competition from domestic and international insurance and reinsurance companies, as well as from other financial institutions in the SVW markets. We face a growing set of competitors in the PRT market as more insurers, many backed by alternative asset managers, look to capitalize on a growing trend of defined benefit plan sponsors looking to pass on the risk of their pension fund liabilities in both the United States and internationally. We also face robust competition in other businesses, mainly from other insurance companies. Main points of competition are price, credibility and financial strength, and the ability to execute and administer complex transactions. We offer tailored solutions ranging from complete buyouts to reinsurance arrangements that allow us to compete on a wider set of opportunities in customized ways. We believe that our partnership with Blackstone and the associated asset origination capabilities will help us compete in several of our businesses, particularly PRT.
Strategy
Expand FABN program to accelerate cash flows: We plan to grow our GIC portfolio by expanding our FABN program through FABN issuances and FHLB funding agreements. We will continue to evaluate expanding both capacity and utilization. We believe this strategy will also serve as a strong and attractive funding source as we continue to put Blackstone originated and managed assets to work.
Improve PRT market position through new products and unique capabilities: In PRT, we plan to continue our focus on the larger end of the full plan termination market. This sub-segment of the market allows us to demonstrate our differentiated capabilities around managing market risks, asset-in-kind portfolios and deferred participant longevity. We have developed new product offerings and solutions to participate in buy-in-to-buy-out plan termination solutions. Internationally, we intend to continue to provide reinsurance for UK PRT transactions focused on the larger end of the BPA market, and are developing longevity swap products to enhance our deal execution capabilities. We expect to continue to expand our list of cedant insurers and our asset origination capabilities to support UK PRT transactions. We believe that our Blackstone partnership will differentiate our competitive position by providing assets with a duration, liquidity and return profile that are well-suited to the PRT market. Additionally, we will continue to opportunistically enter other international markets that are aligned with our core competencies and expertise when favorable market and regulatory conditions exist.
Grow and maintain strong market presence in the stable value wrap and Bank-Owned Life Insurance markets: We plan to grow the sales of our SVW-DC product by adding new QPAM partners, developing new SVW-DC products as alternative offerings to traditional money market funds, and developing new products in response to regulatory and tax law changes. Additionally, we expect to continue to consolidate our position with respect to our share of the SVW-BOLI market as larger banks look to restructure their current programs. We also intend to opportunistically grow our market share in the new issue, general or separate account COLI-BOLI market as market conditions and tax laws evolve.
Maintain presence in structured settlement annuities market: We plan to focus our product development and solutions on both qualified and non-qualified markets as we continue to concentrate on term-certain and lightly underwritten lives. We will seek to optimize efficiencies in the administration of our current portfolio and reinsured block.
Risk Management
Our Institutional Markets business takes a holistic approach to risk management spanning product diversification and asset-liability management. Also, our pricing strategy prioritizes long-term value over sales volumes and targets specific segments where we believe we can find superior risk-adjusted returns. This approach has historically produced consistently strong results across a variety of economic environments.
Diversification
Our product breadth and varied distribution channels allow us to focus our new business generation towards the areas where we see the highest risk-adjusted returns, and away from areas where we believe pricing pressure has reduced returns to an unattractive level. This helps us remain disciplined in pricing and to diversify the concentration risk created by the large case sizes in the market. The spread income generated by the funded businesses within Institutional Markets is balanced with the fee income produced by the SVW businesses. In addition, the longevity risk generated from the PRT and structured settlements businesses helps diversify the mortality risk generated from our Life Insurance business.
Product design
In PRT, we deliberately avoid commoditized areas of the all-retiree middle market that are highly competitive, and instead focus on the larger end of the plan termination market. This specialized focus allows us to utilize the scale of our balance sheet, as well as our asset selection and derivative hedging capabilities to win transactions. In the SVW market, our product design does not provide non-zero guarantees, mitigates credit default risk and allows for portfolio immunization at the discretion of the wrap provider. In structured settlements, we focus on term certain funding, standard lives, and the lightly underwritten portion of the market, and avoid the highly competitive areas of the market that involve large case, highly underwritten, sub-standard lives.
Asset-liability management
We seek to minimize the gap between the duration of our assets and liabilities to reduce interest rate risk. We closely coordinate with our investment management team to source asset portfolios that can back our various liability obligations and generate attractive net investment spreads. In situations where liability durations exceed the naturally available pool of duration matched assets, we actively monitor derivative strategies that can be used to close any ALM mismatches. The GIC portfolio is monitored to ensure that the assets and liabilities in that sub-segment are tightly matched in addition to being risk managed as part of the overall general account. Asset selection focuses on the underlying characteristics of the liability funding source, both in terms of duration and any embedded optionality present in either the assets or liabilities.
Reinsurance
All payout annuities (PRT and structured settlements) in Institutional Markets issued prior to 2012 have been reinsured to Fortitude Re. From a counterparty credit perspective, the reinsurance transactions were structured as modified coinsurance with funds withheld, so the assets continue to reside on our balance sheet. In addition, the majority of the mortality risk in the COLI-BOLI segment is either experience rated, or has been reinsured to third-party reinsurers.
CORPORATE AND OTHER
Our Corporate and Other segment consists primarily of corporate expenses not attributable to our other segments, our institutional asset management business, which includes managing assets for non-consolidated affiliates, the results of our consolidated investment entities and the results of our legacy insurance lines ceded to Fortitude Re. For the year ended December 31, 2022, our Corporate and Other recorded adjusted revenue of $846 million and adjusted pre-tax loss of $383 million.
Fortitude Re
Fortitude Re is a Bermuda reinsurance company which was established in 2018 by AIG to enter into a series of reinsurance transactions related to AIG’s run-off portfolio. In two transactions in 2018 and 2020, AIG sold substantially all of its ownership interest in Fortitude Re’s parent company (“FR Parent”) to Carlyle FRL, an investment fund advised by an affiliate of The Carlyle Group and T&D Investments, Inc., a subsidiary of T&D Holdings, Inc. We currently hold a less than 3% indirect interest in Fortitude Re.
As of December 31, 2022, $26.8 billion of our liabilities representing a mix of run-off life and annuity risks had been ceded to Fortitude Re under these reinsurance transactions. Effective as of January 1, 2022, certain AIG subsidiaries sold to an affiliate of Fortitude Re all of the outstanding capital stock of two servicing companies. The ceding insurers entered into administrative services agreements pursuant to which AIG transferred administration of certain of our ceded business to those companies.
Through this series of transactions, Fortitude Re has become our largest reinsurance counterparty. Accordingly, the reinsurance agreements between us and Fortitude Re provide us with certain protections in the event that Fortitude Re becomes unable to meet its obligations related to the transactions. For example, the agreements were structured as modified coinsurance with funds withheld. Under this type of reinsurance structure, the investments supporting the reinsurance agreements continue to be held by us. Accordingly, the applicable reserve balances are fully collateralized. Also, we have the right to recapture the ceded business in the case of certain events, including certain regulatory ratios applicable to Fortitude Re falling below certain thresholds. Further, we have the right to one seat on Fortitude Re’s board of managers.
The investment assets supporting the reinsurance agreements with Fortitude Re mostly consist of available for sale securities. Because these assets continue to be held by us, they continue to be reflected on our balance sheet and in our GAAP results of operations. Meanwhile, Fortitude Re receives or makes quarterly payments that represent the net gain or loss under the treaty for the relevant quarter, including any net investment gain or loss on the assets in the modified coinsurance account, which can lead to volatility in our net income. Given our limited economic interest in FR Parent, we believe adjusting our earnings for the items related to the Fortitude Re reinsurance treaties provides a better view of the net income attributable to our underlying operations.
Similarly, because the investments supporting the reinsurance transaction are held on our balance sheet, changes in the fair value of these assets are included in the embedded derivative of the Fortitude Re funds withheld arrangements and introduce volatility into our balance sheet. While our net income experiences volatility as a result of the Fortitude Re reinsurance arrangements, it is almost entirely offset by changes in OCI resulting in minimal impact to our net investment.
The following table outlines the impact to comprehensive income of the funds withheld arrangements with Fortitude Re:
| | | | | | | | | | | | | | | | | | | | |
| For the years ended December 31, |
| (in millions) | | 2022 | | 2021 | | 2020 |
| Net investment income – Fortitude Re funds withheld assets | | $ | 891 | | | $ | 1,775 | | | $ | 1,427 | |
| Net realized losses on Fortitude Re funds withheld assets: | | | | | | |
| Net realized gains (losses) – Fortitude Re funds withheld assets | | (397) | | | 924 | | | 1,002 | |
| Net realized gains (losses) – Fortitude Re embedded derivatives | | 6,347 | | | (687) | | | (3,978) | |
| Net realized gains (losses) on Fortitude Re funds withheld assets | | 5,950 | | | 237 | | | (2,976) | |
| (Loss) income before income tax benefit | | 6,841 | | | 2,012 | | | (1,549) | |
| Income tax benefit (expense)* | | (1,437) | | | (423) | | | 325 | |
| Net (loss) income | | 5,404 | | | 1,589 | | | (1,224) | |
| Change in unrealized appreciation of all other investments | | (5,064) | | | (1,488) | | | 1,165 | |
| Comprehensive income (loss) | | $ | 340 | | | $ | 101 | | | $ | (59) | |
* The income tax expense (benefit) and the tax impact on OCI were computed using the U.S. statutory tax rate of 21%.
OVERVIEW
Investment Management is an integral part of our business model. We aim to support our liabilities with a high quality and diversified portfolio taking into consideration the liability duration, convexity and liquidity profile. In addition, we seek to originate assets that enable us to further manage our asset-liability profile, generate enhanced risk-adjusted returns and iterate our product designs to improve our risk profile. We manage general and separate account assets across markets, including public fixed income, structured products, public and private equity, private debt and commercial real estate. We have produced steady returns on invested assets and minimized the volatility of our earnings through different market environments.
Currently, we manage a diverse array of corporate, municipal, infrastructure and government bonds, sourced from public and private markets in developed and emerging economies as well as various structured product asset classes including ABS, collateralized loan obligations (“CLOs”) and MBS. We also originate commercial and residential mortgage loans and middle market commercial loans. In addition, we manage, oversee and originate certain types of equity and alternative investments.
The following table presents carrying amounts of our total investments:
| | | | | | | | | | | | | | | | | | | | |
| (in millions) | | Excluding Fortitude Re Funds Withheld Assets | | Fortitude Re Funds Withheld Assets | | Total |
| December 31, 2022 | | | | | | |
| Bonds available for sale: | | | | | | |
| U.S. government and government-sponsored entities | | $ | 925 | | $ | 273 | | $ | 1,198 |
| Obligations of states, municipalities and political subdivisions | | 5,195 | | 731 | | 5,926 |
Non-U.S. governments(a) | | 3,977 | | 415 | | 4,392 |
Corporate debt(a) | | 91,939 | | 12,753 | | 104,692 |
| Mortgage-backed, asset-backed and collateralized: | | | | | | |
| RMBS | | 11,122 | | 822 | | 11,944 |
| CMBS | | 9,528 | | 540 | | 10,068 |
| CLO | | 7,994 | | 192 | | 8,186 |
| ABS | | 9,774 | | 613 | | 10,387 |
| Total mortgage-backed, asset-backed and collateralized | | 38,418 | | 2,167 | | 40,585 |
| Total bonds available for sale | | 140,454 | | 16,339 | | 156,793 |
| Other bond securities | | 284 | | | 3,485 | | 3,769 |
| Total fixed maturities | | 140,738 | | 19,824 | | 160,562 |
| Equity securities | | 170 | | — | | 170 |
| Mortgage and other loans receivable: | | | | | | |
| Residential mortgages | | 5,851 | | — | | 5,851 |
| Commercial mortgages | | 29,190 | | 3,272 | | 32,462 |
| Life insurance policy loans | | 1,395 | | 355 | | 1,750 |
| Commercial loans, other loans and notes receivable | | 4,285 | | 218 | | 4,503 |
Total mortgage and other loans receivable(b) | | 40,721 | | 3,845 | | 44,566 |
Other invested assets(c) | | 8,392 | | 2,026 | | 10,418 |
| Short-term investments | | 4,331 | | 69 | | 4,400 |
Total(d) | | $ | 194,352 | | | $ | 25,764 | | | $ | 220,116 | |
(a) Our credit exposure to the Russian Federation and Ukraine through our fixed maturity securities portfolio, excluding Fortitude Re funds withheld assets, was $29 million at December 31, 2022. The credit exposure to the Russian Federation and Ukraine of our Fortitude Re funds withheld assets fixed maturity securities portfolio was $7 million at December 31, 2022. Exposure to the Russian Federation and Ukraine represents an immaterial percentage of our aggregate credit exposures on our fixed maturity securities.
(b) Net of total allowance for credit losses for $600 million at December 31, 2022.
(c) Other invested assets, excluding Fortitude Re funds withheld assets, include $5.3 billion of private equity funds as of December 31, 2022, which are generally reported on a one-quarter lag.
(d) Includes the consolidation of approximately $9.7 billion of consolidated investment entities at December 31, 2022
Historically, our investments have largely been managed by affiliated investment managers. We have made and expect to continue to make increasing use of highly-respected third-party managers for various asset classes, particularly where we can increase our access to attractive investments or benefit from scale and market-leading capabilities. For example, in November 2021 we entered into a strategic partnership with Blackstone as described below in “—Our Strategic Partnership with Blackstone.” In addition, we have entered into the BlackRock Agreements, as described below in “—Our Investment Management Agreements with BlackRock.”
Regardless of whether our investments are managed by an internal or external provider, our Chief Investment Officer will continue to be responsible for overseeing our overall portfolio, including decisions surrounding asset allocation, risk composition and investment strategy. Also, specialized internal teams will work closely with business personnel to develop asset strategies tied to insurance company objectives so that our investment operations will continue to be integrated with our pricing and product development. Monitoring and oversight of external providers will be performed by our Chief Investment Officer in conjunction with our Finance, Legal, Enterprise Risk Management and Compliance Departments. All externally managed assets will be folded into our credit, market, capital, liquidity and foreign exchange risk monitoring frameworks.
In addition, we are preparing to implement BlackRock’s “Aladdin,” an investment management technology platform that will provide an end-to-end investment solution spanning trade capture, analytics, back office capabilities and other services which are currently performed across many systems at AIG.
We intend to evolve our investments organization, which we expect will create additional efficiencies, to reflect our relationships with key external partners, our expected implementation of BlackRock’s “Aladdin” investment management technology platform and our expected reduction in fees for asset management services that we provide to AIG and third parties.
HIGH QUALITY PORTFOLIO
As of December 31, 2022, 91% of our fixed maturity security portfolio, excluding Fortitude Re funds withheld assets, were investment grade. The fixed maturity security portfolio of our insurance operating subsidiaries, excluding the Fortitude Re funds withheld assets, was 94% investment grade as of December 31, 2022. The fixed maturity security portfolio of our insurance operating subsidiaries excludes $3.4 billion of securities related to consolidated investment entities that do not represent direct investments of Corebridge’s insurance subsidiaries and $1.2 billion of eliminations primarily related to the consolidated investment entities and the insurance operating subsidiaries. Our investment decision process relies primarily on fundamental analysis. Third-party rating services’ ratings and opinions provide one source of independent perspective for consideration in the internal analysis. We stress-test the underwritten assets and asset classes under various adverse scenarios.
The following chart depicts the NAIC designation of fixed maturity assets held in our insurance operating subsidiaries, excluding the Fortitude Re funds withheld assets, as of December 31, 2022:
The following charts depict our portfolio by credit rating excluding assets held through our modified coinsurance arrangements:
Our asset portfolio is managed within the limits and constraints set forth in our investment and risk policies. These policies set limits on investments in our portfolio by asset class, such as corporate bonds, residential mortgage backed securities (“RMBS”), commercial mortgage backed securities (“CMBS”), CLOs, commercial and residential mortgage whole loans and alternative investments. We also set credit risk limits for exposure to single issuers and countries that vary based on ratings, as well as limits on aggregate investments in below investment grade assets. In addition, our asset portfolio is constructed to withstand both liquidity and capital stresses that may arise due to market dislocations.
Our credit risks are managed by credit professionals, subject to ERM oversight and various control processes. Their primary role is to ensure appropriate credit risk management in accordance with our credit policies and procedures relative to our credit risk parameters. We monitor and control our company-wide credit risk concentrations and attempt to avoid unwanted or excessive risk accumulations.
Our underwriting practices for investing in mortgage loans, mortgage-backed securities and structured securities take into consideration the quality of the issuer, the originator, the manager, the servicer, security credit ratings, characteristics of the underlying collateral and the level of credit enhancement in the transaction, as applicable.
In commercial real estate, we seek out opportunities with low leverage and strong sponsorship. Our CML portfolio is focused on multi-family as its largest property type allocation. Our CMBS portfolio is focused on North America and includes high quality securities, with an average rating of ‘‘AA,’’ 96% of which are designated NAIC 1.
Our RMBS portfolio is a mix of agency and non-agency securities of which 98% are designated NAIC 1. The non-agency RMBS portfolio is a seasoned portfolio, reflecting a borrower mix that has seen and survived previous housing credit stress, and provides a stable return profile across a range of internal stress scenarios. Our smaller RML portfolio continues to be centered on high credit quality jumbo loans underwritten with full documentation, low loan-to-value ratios and high FICO scores.
Our asset-backed securities (“ABS”) and CLO portfolios are focused on investment grade assets with structural credit enhancement in pools of collateral that are managed by experienced investment managers. Our CLO portfolio consists of 98% investment grade and 92% NAIC 1 assets and the underlying collateral pools predominantly consist of first lien senior secured loans. Our ABS portfolio is focused on private ABS that are secured by high-quality assets with recurring cash flow streams and consists of near 100% investment grade and 53% NAIC 1 assets.
In addition to our core fixed income portfolio, we opportunistically allocate a portion of our portfolio to alternative investments where we primarily focus on private equity, real estate equity and direct private equity investments and co-investments, and to a lesser extent, hedge fund investments. Our alternative investment strategy is subject to internal concentration limits and designed to provide diversification away from fixed income markets and support growth of our surplus portfolio.
INVESTMENT STRATEGY
Our investment strategy is to provide net investment income to support liabilities that result in stable distributable earnings and enhance portfolio value, subject to asset liability management, capital, liquidity, regulatory, legal and rating agency constraints, overall market and economic conditions and our risk appetite. Insurance liabilities are supported by mainly investment-grade fixed maturity securities that meet our duration, risk-return, tax, liquidity, credit quality and diversification objectives. We assess fixed maturity asset classes, including credit (public and private), commercial real estate and residential real estate, based on their fundamental underlying risk factors.
We maintain a diversified, high quality portfolio of fixed maturity securities issued by corporations, municipalities and other governmental agencies; structured securities collateralized by, among other assets, residential and commercial real estate; and commercial mortgage loans that, to the extent practicable, match the currency and duration characteristics of our liabilities. As part of our Risk Management framework, we seek to diversify the portfolio across asset classes, sectors and issuers to mitigate idiosyncratic portfolio risks. The investment portfolio of each product line is tailored to the specific characteristics of its insurance liabilities, and as a result, duration varies between distinct portfolios. We also utilize derivatives to manage our asset and liability duration as well as currency exposures.
Investments that support our surplus seek to enhance portfolio returns and are generally comprised of a mix of fixed maturity investment grade and below investment grade securities and various alternative asset classes, including private equity, real estate equity and hedge funds. Over the past few years, hedge fund investments have been reduced with more emphasis given to private equity, real estate and below investment grade credit. Although these alternative investments are subject to periodic earnings fluctuations, they have historically achieved returns in excess of the fixed maturity portfolio returns. We expect to increase our allocation to alternatives within surplus by approximately $3 billion by 2024.
CREDIT RISK
Credit risk is the risk that our customers or counterparties are unable or unwilling to repay their contractual obligations when they become due. Credit risk may also result from a downgrade of a counterparty’s credit ratings or a widening of its credit spreads.
We devote considerable resources to managing our direct and indirect credit exposures. These exposures may arise from, but are not limited to, fixed income investments, corporate and consumer loans and leases, reinsurance and retrocessional insurance recoverables and counterparty risk arising from derivatives activities.
Our credit risks are managed by our credit professionals, subject to various control processes. Their primary role is to ensure appropriate credit risk management in accordance with our credit policies and procedures relative to our credit risk parameters. Our credit risk management framework includes the following elements related to our credit risks:
•developing and implementing our company-wide credit policies and procedures;
•approving delegated credit authorities to our credit executives and qualified credit professionals;
•developing methodologies for quantification and assessment of credit risks;
•managing a system of credit and program limits, as well as the approval process for credit transactions, above limit exposures and concentrations of risk that may exist or be incurred;
•evaluating, monitoring, reviewing and reporting of credit risks and concentrations regularly with senior management; and
•approving appropriate credit reserves, credit-related other-than-temporary impairments and corresponding methodologies for all credit portfolios.
We monitor and control our company-wide credit risk concentrations and attempt to avoid unwanted or excessive risk accumulations, whether funded or unfunded. To minimize the level of credit risk in some circumstances, we may require mitigants, such as third-party guarantees, reinsurance or collateral, including commercial bank-issued letters of credit and trust collateral accounts. We treat these guarantees, reinsurance recoverable, and letters of credit as credit exposure and include them in our risk concentration exposure data. We also monitor the quality of any trust collateral accounts.
OUR STRATEGIC PARTNERSHIP WITH BLACKSTONE
In November 2021, we entered into a strategic partnership with Blackstone that we believe has the potential to yield significant economic and strategic benefits over time. We believe that Blackstone’s ability to originate attractive and privately sourced, fixed-income oriented assets will be accretive to our businesses and provide us with an enhanced competitive advantage.
Pursuant to the partnership, we initially transferred management of $50 billion of our existing investment portfolio. Beginning in the fourth quarter of 2022, we transferred an additional $2.1 billion to Blackstone. The amount managed by Blackstone will increase to $92.5 billion by the third quarter of 2027.
As of December 31, 2022, the book value of the assets managed by Blackstone was approximately $48.9 billion. We expect Blackstone to invest these assets primarily in Blackstone-originated investments across a range of asset classes, including private and structured credit, and commercial and residential real estate securitized and whole loans. Blackstone’s preferred credit and lending strategy is to seek to control all significant components of the underwriting and pricing processes with the goal of facilitating bespoke opportunities with historically strong credit protection and attractive risk-adjusted returns. Blackstone seeks to capture enhanced economics to those available in the traditional fixed income markets by going directly to the lending source.
As described above, Blackstone currently manages a portfolio of private and structured credit assets, commercial and residential real estate securitized and whole loans for Corebridge. We believe Blackstone is well-positioned to add value and drive new originations across credit and real estate asset classes. We continue to manage asset allocation and portfolio-level risk management decisions with respect to any assets managed by Blackstone, ensuring that we maintain a consistent level of oversight across our entire investment portfolio considering our asset-liability matching needs, risk appetite and capital positions.
OUR INVESTMENT MANAGEMENT AGREEMENTS WITH BLACKROCK
Under the BlackRock Agreements, we have completed the transfer of the management of approximately $82.4 billion in book value of liquid fixed income and certain private placement assets in the aggregate to BlackRock as of December 31, 2022. In addition, liquid fixed income assets associated with Fortitude Re portfolio were separately transferred to BlackRock. The BlackRock Agreements provide us with access to market-leading capabilities, including portfolio management, research and tactical strategies in addition to a larger pool of investment professionals. We believe BlackRock’s scale and fee structure make BlackRock an excellent outsourcing partner for certain asset classes and will allow us to further optimize our investment management operating model while improving overall performance. The fees, terms and conditions of the BlackRock Agreements were extensively negotiated, and we believe them to be highly competitive with those available from other leading investment managers for a fixed income portfolio of comparable size. Further, BlackRock is responsible for its own overhead and operating expenses under the BlackRock Agreements, with the insurance company subsidiaries reimbursing reasonable and documented out-of-pocket third-party expenses.
With respect to other potential liabilities under the BlackRock Agreements, the insurance company subsidiaries have agreed to indemnify BlackRock for certain losses incurred in connection with the services provided by BlackRock pursuant to the BlackRock Agreements or resulting from the insurance company subsidiaries’ breach of the investment management agreements.
The investment management agreements contain detailed investment guidelines and reporting requirements. These agreements also contain reasonable and customary representations and warranties, standard of care, confidentiality and other provisions. The investment management agreements will continue unless terminated by either party on 45 days’ notice or by us immediately for cause. We will continue to be responsible for our overall investment portfolio, including decisions surrounding asset allocation, risk composition and investment strategy.
The investment management agreements are not linked to our implementation of BlackRock’s “Aladdin” investment management technology platform.
We believe that our employees’ dedication, commitment, and engagement are key to our success and that we foster a constructive and collaborative work environment. Our principal human capital management objectives include attracting, developing and retaining the highest quality talent. As of December 31, 2022, we had over 7,700 employees located primarily in the United States, Ireland and UK. In May 2022, in connection with our productivity program, we entered into an agreement with a third-party service provider pursuant to which, as a result of the outsourcing components of our insurance operations, finance, information technology and actuarial services, approximately 180 of our employees are expected to become or have become employees of that provider, and certain reductions in force are expected to occur or have occurred.
Historically, as a subsidiary of AIG, we have operated under the AIG umbrella of strategies, policies and programs governing human capital management. The following provides examples of key programs and initiatives we have implemented or plan to implement to attract, develop and retain our diverse workforce.
COMPETITIVE COMPENSATION AND BENEFITS
We continue to align our employees’ compensation with the Company’s overall performance and provide competitive compensation opportunities to attract and retain highly skilled employees for our various business needs. We intend to provide a performance-driven compensation structure that consists of a base salary and short-term and long-term incentive programs. In addition, we offer comprehensive benefits to support our employees’ health and wellness needs, including subsidized health-care plans, life insurance and disability, wellness and mental health benefits, paid time off and parental leave policies, and matching 401(k) contributions.
HEALTH AND SAFETY
We care about the health and safety of our employees. In response to the COVID-19 pandemic, we quickly and effectively transitioned a majority of our employees to remote work. We intend to maintain a hybrid work model for the foreseeable future.
CAREER DEVELOPMENT
We believe that professional development is a positive investment in our talent. Our goal is to build the skills of our employees by providing ample opportunities to access learning and development that enhances their abilities to perform in their current or future roles. Accordingly, we have established a library of on-demand learning options, combined with immersive learning experiences, that build skills at all levels. We also offer tuition, certification, and training reimbursement programs to encourage employees to enhance their education, skills and knowledge for continued growth. We place significant importance and attention on promoting internal talent and succession planning. We conduct an annual review of our talent development and succession plans for each of our functions and operating segments to identify and develop a talent pipeline for positions at all levels of the organization.
DIVERSITY AND INCLUSION
We have created an inclusive workplace focused on attracting, retaining, and developing diverse talent that fosters a culture of inclusion and belonging for all employees. Our management team leads our public Company's diversity, equity, inclusion and belonging (“DEI”) efforts. In June 2021, we launched our Diversity Council, tasked with monitoring DEI initiatives as an integral part of our business strategies. In addition, our talent acquisition team has established strategic partnerships with third-party organizations such as HBCU First, Rock the Street, International Associates of Black Actuaries and Organization Latino Actuaries to ensure diverse talent pools for our early career opportunities.
Employee Resource Groups (“ERGs”) are groups of employees who come together based on a shared interest in a specific dimension of diversity and are an essential means of reinforcing a culture of inclusion and belonging in our organization. Our ERG network spans multiple geographies and dimensions and is open to all employees. The ERGs form a cornerstone of our DEI efforts by representing our diverse workforce, facilitating networking and connections with peers, and supporting a culture of inclusion and engagement within the Company.
Environmental, Social and Governance Our parent company, AIG, has a strong ESG foundation focused on community resilience, financial security, and sustainable operations. As we become a stand-alone business, we plan to leverage this framework as a starting point, and evolve our approach over time in line with our industry, geographic and business focus.
COMMUNITY RESILIENCE: GIVING BACK THROUGH PHILANTHROPY AND VOLUNTEERISM
Operating as a responsible corporate citizen is central to our success as a business. We are committed to making a positive difference in the communities where we work, live and serve our customers. We align our charitable giving around building resilience and financial security for individuals, families and communities. For example, since 2014, we, in conjunction with AIG, have partnered with Junior Achievement to support financial education and workforce readiness, enabling thousands of students to participate in Junior Achievement programming.
We currently support programs that leverage our employees’ passion for giving back. For example, in connection with Giving Tuesday, in December 2022, our employees volunteered to pack snacks, meals and activities bags for the community. Additionally, during this event, volunteers delivered care packages to homebound seniors and worked with Habitat for Humanity to build the exterior shell of a home.
FINANCIAL SECURITY: HELPING PEOPLE ACHIEVE FINANCIAL WELLNESS AND SUSTAINABILITY
Enabling financial wellness is a key focus for us and the clients we serve. We offer products, resources and information to assist clients with their financial planning, including access to professional guidance, financial literacy and education and online tools and resources. As part of our commitment to promoting financial security and resilience more broadly, we also partner with the Foundation for Financial Planning to increase pro bono financial planning for at-risk Americans, including cancer patients, military veterans, victims of natural disasters, domestic violence survivors, financially vulnerable seniors and frontline healthcare workers.
With fewer people covered by traditional pension plans, annuities can fill a gap in retirement portfolios by providing a monthly check for as long as a person lives, no matter how the market performs. We are a leading provider of annuity products that offer the opportunity for growth, principal protection and protected income for life. We are also a founding member of the Alliance for Lifetime Income, a non-profit educational organization that educates Americans about the value and importance of having protected lifetime income in retirement.
As a life insurance and annuity provider, we help customers think about “longevity risk” — the possibility that people could deplete their retirement savings as they manage the healthcare, LTC and financial planning challenges that come with longer lifespans. In the United States, we offer life insurance products with accelerated death benefits that can be used to cover financial needs during one’s later retirement years.
We will continue to be an industry leader and advocate for insurance products and services that will serve the needs of our customers, and for ensuring financial security.
SUSTAINABLE OPERATIONS: A FOCUS ON SUSTAINABILITY
Sustainability is focused on protecting the future, and that’s at the heart of what we do: With a broad portfolio of products offered through partners and advisors, we help people envision their future.
Long-term business sustainability is critical to our ability to meet our customers’ needs, particularly in light of demographic trends driving the need for longer-term financial wellness. The backbone of our sustainability is a diversified, well-managed product line with a balanced and diverse approach to product distribution. Our multi-layered approach also relies on responsible governance, capital management with a view toward our long-term commitments, dynamic pricing, a risk-managed investment portfolio and hedging of market risks where applicable and economically prudent.
We rely on a combination of copyright, patent, trademark, trade secret and internet domain laws to establish and protect our intellectual property rights. We maintain a portfolio of trademarks that we consider important to the marketing of our products and business, some of which are registered with the U.S. Patent and Trademark Office and in other jurisdictions. These trademarks include product names that appear in this report. We also protect aspects of our business as trade secrets, where appropriate. We believe that the value associated with our intellectual property is significant to our business.
Overview
Our businesses and operations are subject to regulation and supervision by many different types of regulatory authorities, including insurance, securities, derivatives and investment advisory regulators in the United States and abroad. We expect that the U.S. and international regulations applicable to us and our regulated entities will continue to evolve for the foreseeable future. Additionally, in the United States, where the majority of our businesses are based, while the federal government does not directly regulate insurance business, federal legislation and administrative policies in several areas, including pension regulation, age and sex discrimination, financial services regulation, securities regulation and federal taxation, can significantly affect the insurance industry and certain of our other operations. See “Risk Factors—Risks Relating to Regulation—Our business is heavily regulated” in the 2022 Form 10-K. Legislators, regulators and self-regulatory organizations may also consider changes to existing laws or regulations impacting our business, such as, for example, changes to reserving and accounting requirements, standard of care for financial professionals, and permitted investments. See “Risk Factors—Risks Relating to Regulation—New domestic or international laws and regulations, or new interpretations of current laws and regulations may affect our ability to compete effectively” in the 2022 Form 10-K. Further, insurance and other regulatory authorities and law enforcement agencies, attorneys general and other governmental authorities from time to time make inquiries and conduct examinations or investigations regarding our compliance, as well as compliance by other companies in our industry, with applicable laws.
U.S. REGULATION
State Insurance Regulation
Together, our U.S. insurance subsidiaries are licensed to transact insurance business and subject to extensive regulation and supervision by insurance regulators in the jurisdictions in which they do business, including the 50 states, the District of Columbia, Guam, Puerto Rico and the U.S. Virgin Islands. The primary regulator of an insurance company, however, is located in its state of domicile. AGC is domiciled in Missouri and is primarily regulated by the Missouri Department of Commerce and Insurance, each of AGL and VALIC is domiciled in Texas and is primarily regulated by the Texas Department of Insurance, and USL is domiciled in New York and is primarily regulated by the NYDFS.
The method of regulation of our insurance subsidiaries varies by jurisdiction but generally has its source in statutes that delegate regulatory and supervisory powers to state insurance officials. The regulation and supervision relate primarily to the financial condition of the insurers, licensing, corporate conduct, including transactions among affiliates, market conduct activities and investments. In general, such regulation is for the protection of policyholders rather than the creditors or equity owners of these companies.
As a holding company with no significant business operations of its own, Corebridge Parent depends on dividends from our subsidiaries to meet its obligations. State insurance statutes typically place restrictions and limitations on the amount of dividends or other distributions payable by insurance company subsidiaries to their parent companies, as well as on transactions between an insurer and its affiliates. For example, the insurance statutes of Missouri and Texas generally permit without regulatory approval the
payment of dividends that, together with dividends paid during the preceding twelve months, do not exceed the greater of (i) 10% of statutory policyholders’ surplus as of the preceding December 31 and (ii) statutory net gain from operations for the preceding calendar year. Additionally, under the Missouri and Texas insurance statutes, dividends may be paid only to the extent the insurer has unassigned surplus (as opposed to contributed surplus). New York has similar dividend restrictions, in some cases with more restrictive requirements. Dividends in excess of applicable prescribed limits, based on prior year’s earnings and surplus of the insurance company, established by the applicable state regulations are considered to be extraordinary transactions and require prior approval or non-disapproval from the applicable insurance regulator.
Additionally, in the United States, the NAIC is a standard-setting and regulatory support organization created and governed by the chief insurance regulators from the 50 states, the District of Columbia and U.S. territories. Among other things, the NAIC develops and recommends adoption of model insurance laws and regulations. The NAIC is not a regulator, but, with assistance from the NAIC, state insurance regulators establish standards and best practices, conduct peer reviews and coordinate regulatory oversight. Model laws and regulations promulgated by the NAIC become effective in a state once formally adopted and are subject to revision by each state. Certain of such model laws and regulations are noted in more detail below.
The NAIC’s Insurance Holding Company System Regulatory Act and the Insurance Holding Company System Model Regulation (together, the “Holding Company Models”), versions of which have been enacted by all of the states in which we have domestic insurers, generally require registration and periodic reporting by insurance companies that are licensed in such jurisdictions and are controlled by other entities. They also require periodic disclosure concerning the entity that controls the registered insurer and the other companies in the holding company system and prior approval of intercompany transactions and transfers of assets. Insurance holding company laws also generally provide that no person, corporation or other entity may acquire control of an insurance company, or a controlling interest in any direct or indirect parent company of an insurance company, without the prior approval of such insurance company’s domiciliary state insurance regulator. Under the laws of each of the domiciliary states of our U.S. insurance subsidiaries, Missouri, New York and Texas, any person acquiring, directly or indirectly, 10% or more of the voting securities of an insurance company is presumed to have acquired “control” of the company, which may consider voting securities held at both the parent company and subsidiaries collectively. This statutory presumption of control may be rebutted by a showing that control does not exist in fact. State insurance regulators, however, may find that “control” exists in certain circumstances in which a person owns or controls less than 10% of the voting securities.
In December 2020, the NAIC amended the Holding Company Models to incorporate a liquidity stress test (“LST”) requirement for large life insurers based on a set of scope criteria and a Group Capital Calculation (“GCC”). LST is intended to support macroprudential surveillance by the NAIC regulators, including to assess the potential impact on broader financial markets of aggregate asset sales within a liquidity stress scenario The NAIC encouraged states to implement the GCC provisions by November 7, 2022, the deadline by which U.S. states were required to adopt GCC requirements or become subject to federal preemption and Solvency II group capital requirements in connection with covered agreements the United States reached with the EU and UK to address, among other things, group capital requirements. Further, the NAIC has proposed making the GCC and LST amendments to the Holding Company Models accreditation standards, effective January 1, 2026. Of our domiciliary insurance regulators, Missouri and Texas have adopted the GCC requirements, while New York has pending legislation that would impose GCC requirements on parent companies of insurers doing business in New York. We continue to monitor efforts to adopt the GCC requirements in New York, as well as other changes being considered by the NAIC with respect to its LST framework.
The NAIC’s Risk Management and Own Risk and Solvency Assessment Model Act (“ORSA”) requires that insurers maintain a risk management framework and conduct an internal own risk and solvency assessment of the insurer’s material risks in normal and stressed environments and submit annual ORSA summary reports to the insurance group’s lead U.S.-state regulator. The NAIC has also adopted a Corporate Governance Annual Disclosure Model Act (“CGAD”) that requires insurers to submit an annual filing regarding their corporate governance structure, policies and practices. Further, the NAIC has had an increased focus on private equity owned life insurers following sizeable increases in the number of private equity owned life insurers as noted by its Capital Markets Bureau and the Federal Insurance Office in 2021. The NAIC adopted Regulatory Considerations Applicable (But Not Exclusive) to Private Equity (PE) Owned Insurers (the “Regulatory Considerations”) in 2022, intended to identify where existing disclosures, policies, control and affiliation requirements, and other procedures should be modified, or new ones created, to address any gaps based on the increase in the number of PE-owned insurers, the role of asset managers in insurance and the potential for control via asset management arrangements, and the increase of private investments in insurers’ portfolios, among other reasons. Many of the Regulatory Considerations have been referred to NAIC working groups and task forces, including analysis on definition and evaluation of control and review of reliance on rating agency ratings, while others such as new reporting on investment schedules relative to investment transactions with related parties and additional disclosures relative to private equity and complex assets have become effective for the reporting period ending 2022.
Every state has adopted, in substantial part, the RBC Model Law promulgated by the NAIC that allows states to act upon the results of RBC ratio calculations and provides four incremental levels of regulatory action regarding insurers whose RBC ratio calculations fall below specific thresholds. Those levels of action range from the requirement to submit a plan describing how an insurer would regain a specified RBC ratio to a mandatory regulatory takeover of the company. The RBC ratio formula is designed to measure the
adequacy of an insurer’s statutory surplus in relation to the risks inherent in its business. The RBC formula computes a risk-adjusted surplus level by applying discrete factors to various asset, premium, reserve and other financial statement items, or in the case of interest rate and equity return (C-3) market risk, applying stochastic scenario analyses. These factors are developed to be risk-sensitive so that higher RBC requirements are applied to items exposed to greater risk. The RBC ratio of each of our U.S. based insurance companies, determined by the ratio of a company’s total adjusted capital (as defined by the NAIC) to its “company action level” of RBC (as defined by the NAIC), exceeded minimum required levels as of December 31, 2022. The NAIC has adopted, or is considering, several changes impacting how RBC is calculated, including initiatives aimed at a comprehensive review of RBC investment framework as well as a proposed modeling methodology to determine RBC for collateralized loan obligations to replace the use of rating agency ratings. We will continue to monitor these developments and evaluate their potential impact to our business, financial condition and legal entities.
The NAIC also provides standardized insurance industry accounting and reporting guidance through the NAIC Accounting Practices and Procedures Manual. Statutory accounting principles promulgated by the NAIC, including for our insurance company subsidiaries, have been, or may be, modified by individual state laws, regulations and permitted practices granted by our domiciliary insurance regulators. Changes to the NAIC Accounting Practices and Procedures Manual or modifications by the various state insurance departments may impact the investment portfolios and the statutory capital and surplus of our U.S. insurance companies. In particular, the NAIC indicated in 2022 that it was considering revisions to SSAP 7 to address the treatment of net negative interest maintenance reserves being generated by insurance companies in the current rising interest rate environment.
Further, effective January 1, 2017 the NAIC Valuation Manual contains a principle-based approach to life insurance company reserves (“PBR”). PBR is designed to tailor the reserving process to more closely reflect the risks of specific products, rather than the factor-based approach employed historically. Subsection 20 of the Valuation Manual (“VM-20”) applies to individual life insurance reserves, most notably term insurance and ULSGs and replaces Regulation XXX and Guideline AXXX for new life insurance business issued after January 1, 2017. Variable annuity reserving requirements, found in subsection 21 of the Valuation Manual (“VM-21”), replaced the previous Actuarial Guideline XLIII requirements. We implemented VM-20 as of January 1, 2020, with respect to relevant policies issued on or after such date, and applied VM-21 in full, effective January 1, 2020, to both new and existing VA business. The NAIC’s work to update the Valuation Manual and address issues relating to the PBR framework, including VM-20 and VM-21 and other parts of the Valuation Manual, is ongoing, and we will continue to monitor such developments as they evolve. See also Notes 7 and 19 to our audited consolidated financial statements for risk and additional information related to these statutory reserving requirements.
In addition to the NAIC’s model laws and regulations, state insurance laws and regulations also include numerous provisions governing the marketplace activities of life and annuity insurers, including provisions governing the form and content of disclosure to consumers, illustrations, advertising, sales practices, customer privacy protection, permissible use of data in insurance practices, and complaint handling. State legislatures and insurance regulators have shown interest in the use of external data and artificial intelligence in insurance practices, including underwriting, marketing and claims practices. The NAIC adopted Artificial Intelligence Principles in August 2020, and a number of states have had legislative or regulatory initiatives relating to the use of external data and artificial intelligence in the insurance industry, including Colorado’s algorithmic and external data accountability law. The regulatory landscape is developing with respect to ensuring fair, transparent and reasonable use of new technologies in the life insurance underwriting process. We continue to engage through industry trade groups with our regulators with the intention of maximizing optimal customer outcomes.
Insurance regulators have also shown interest in climate change risk and disclosure. In 2022, the NAIC adopted revisions to its Climate Risk Disclosure Survey, which numerous states mandate for insurers with premiums exceeding certain thresholds. The NAIC Climate and Resiliency (EX) Task Force Solvency Workstream is also considering potential enhancements to existing regulatory tools relative to the solvency effects of climate change (e.g., on underwriting and investments) which may be incorporated into the NAIC’s Financial Analysis Handbook, the Financial Condition Examiners Handbook and the ORSA Guidance Manual. In addition, in 2021, the NYDFS issued final Guidance for New York Domestic Insurers on Managing the Financial Risks from Climate Change, detailing the NYDFS’s expectations related to insurers’ management of the financial risks from climate change and integration into their governance frameworks, risk management frameworks, and business and investment strategies.
State regulatory authorities generally enforce provisions relating to marketplace activities through periodic market conduct inquiries, data calls, investigations and examinations. Further, as part of their regulatory oversight process, state insurance departments conduct periodic financial examinations, generally once every three to five years, of the books, records, accounts and business practices of insurers domiciled in their states. Examinations are generally carried out under guidelines promulgated by the NAIC and, in the case of financial exams, in cooperation with the insurance regulators of other domiciliary states of an insurance holding company group. There can be no assurance that any noncompliance with such applicable laws, regulations or guidance would not have a material adverse effect on our business, results of operations, financial condition and liquidity.
Unclaimed Property
We are subject to the laws and regulations of states and other jurisdictions concerning identification, reporting and escheatment of unclaimed or abandoned funds, and are subject to audit and examination for compliance with these requirements.
State Guaranty Associations
U.S. states have state insurance guaranty associations in which insurers doing business in the state are required by law to be members. Member insurers may be assessed by the associations for certain obligations of insolvent insurance companies to policyholders and claimants. Typically, states assess member insurers in amounts related to the member’s proportionate share of the relevant type of business written by all members in the state. Some jurisdictions permit member insurers to recover assessments that they paid through full or partial premium tax offsets, usually over a period of years. The protection afforded by a state’s guaranty association to policyholders of insolvent insurers varies from state to state. The aggregate assessments levied against us have not been material to our financial condition in any of the past three years.
Dodd-Frank
Dodd-Frank, signed into law in 2010, brought about extensive changes to financial regulation in the United States and established the Financial Stability Oversight Council. Dodd-Frank also established the Federal Insurance Office (“FIO”) to serve as the central insurance authority in the federal government. While not serving a regulatory function, FIO performs certain duties related to the business of insurance, represents the U.S. in international insurance forums, and has authority to collect information on the insurance industry and recommend prudential standards. Certain parts of Dodd-Frank are noted below in more detail.
Title V of Dodd-Frank authorizes the United States to enter into covered agreements with foreign governments or regulatory entities regarding the business of insurance and reinsurance. On September 22, 2017, the United States and the EU entered into such an agreement to address, among other things, reinsurance collateral and group capital requirements, and on December 18, 2018, the United States signed a covered agreement with the UK in anticipation of the UK’s withdrawal of its membership in the EU, commonly referred to as Brexit, which is similar to the agreement with the EU. The NAIC adopted amendments to the credit for reinsurance model law and regulation and adopted GCC to conform to the requirements of the covered agreements. Numerous states have adopted the GCC requirements in their statutes.
Title VII of Dodd-Frank provides for significantly increased regulation of, and restrictions on, derivatives markets and transactions that have affected and, as additional regulations come into effect, could affect various activities of insurance and other financial services companies, including (i) regulatory reporting for swaps, including security-based swaps, (ii) mandated clearing through central counterparties and execution through regulated swap execution facilities for certain swaps (other than security-based swaps, which are not currently subject to mandatory execution or clearing requirements but could be in the future)\ and (iii) margin and collateral requirements. The Commodities Futures Trading Commission (“CFTC”), which oversees and regulates the U.S. swap, commodities and futures markets, and the SEC, which oversees and regulates the U.S. securities and security-based swap markets, have finalized the majority of the rules to carry out such mandate of Title VII of Dodd-Frank. Increased regulation of, and restrictions on, derivatives markets and transactions, including regulations related to initial margin for swaps and securities-based swaps, could increase the cost of our trading and hedging activities, reduce liquidity and reduce the availability of customized hedging solutions and derivatives.
Dodd-Frank also mandated a study to determine whether stable value contracts should be included in the definition of “swap.” If that study concludes that stable value contracts are swaps, Dodd-Frank authorizes certain federal regulators to determine whether an exemption from the definition of a swap for stable value contracts is appropriate and in the public interest. Our Institutional Markets business issues stable value contracts. We cannot predict what regulations might emanate from the aforementioned study or be promulgated applicable to this business in the future. In the event that the study determines that stable value contracts should be included in the definition of “swap,” Section 719(d)(1)(C) of Dodd-Frank provides that such determination would only apply to newly issued stable value contracts.
Title II of Dodd-Frank provides that a financial company whose largest United States subsidiary is an insurer may be subject to a special orderly liquidation process outside the Bankruptcy Code. U.S. insurance subsidiaries of any such financial company, however, would be subject to rehabilitation and liquidation proceedings under state insurance law.
Pursuant to Dodd-Frank, federal banking regulators adopted rules that apply to certain qualified financial contracts, including many derivatives contracts, securities lending agreements and repurchase agreements, with certain banking institutions and certain of their affiliates. These rules, which became effective on January 1, 2019, generally require the banking institutions and their applicable affiliates to include contractual provisions in their qualified financial contracts that limit or delay certain rights of their counterparties arising in connection with the banking institution or an applicable affiliate becoming subject to a bankruptcy or similar proceeding. Certain of our derivatives, securities lending agreements and repurchase agreements are subject to these rules, and as a result, we are subject to greater risk and could receive a more limited recovery in the event of a default by such bank institution or the applicable affiliates.
ERISA
We provide products and services to certain employee benefit plans that are subject to the Employee Retirement Income Security Act of 1974, as amended (“ERISA”), and/or the Code. Plans subject to ERISA include certain pension and profit sharing plans and welfare plans, including health, life and disability plans. As a result, our activities are subject to the restrictions imposed by ERISA and the Code, including the requirement under ERISA that fiduciaries must perform their duties solely in the interests of ERISA plan participants and beneficiaries, and that fiduciaries may not cause a covered plan to engage in certain prohibited transactions. The applicable provisions of ERISA and the Code are subject to enforcement by the DOL, the IRS and the Pension Benefit Guaranty Corporation.
Standard of Care Developments
We and our distributors are subject to laws and regulations regarding the standard of care applicable to sales of our products and the provision of advice to our customers. In recent years, many of these laws and regulations have been revised or reexamined while others have been newly adopted. We closely monitor these legislative and regulatory activities and evaluate the impact of these requirements on us and our customers, distribution partners and financial advisers. Where needed, we have made significant investments to implement and enhance our tools, processes and procedures, to comply with the final rules and interpretations. These efforts and enhancements have resulted in increased compliance costs and may impact sales results and increase regulatory and litigation risk. Additional changes in standard of care requirements or new standards issued by governmental authorities, such as the DOL, the SEC, the NAIC or state regulators and/or legislators, have impacted, and may impact our businesses, results of operations and financial condition.
DOL Fiduciary Rule
In June 2020, the DOL issued final guidance on the definition of a “fiduciary” for purposes of transactions with ERISA qualified plans, related plan participants and IRAs. The DOL’s final guidance confirmed use of a five-part test for determining who is an investment advice fiduciary and also confirmed related exemptions. In December 2020, the DOL issued the final version of a new prohibited transaction exemption for parties that qualify as investment advice fiduciaries (the “DOL Fiduciary Rule”). This final version is intended to align broadly with the SEC’s Best Interest Regulation as well as other relevant standards of care requirements. See “—SEC Best Interest Regulation.” The terms of the DOL’s exemption impose impartial conduct standards (including a best interest standard), as well as:
•disclosure obligations;
•a duty to establish, maintain and follow policies and procedures intended to comply with the exemption; and
•a duty to perform an annual retrospective review for compliance with the exemption.
In 2021 and 2022, the DOL indicated that it was reviewing issues relating to its regulation of fiduciary investment advice and will take further regulatory actions. The review is expected to make revisions to the definition of fiduciary “investment advice” to ERISA plans and IRAs. The DOL also indicated that it is reviewing, and may amend, prohibited transaction exemptions available to investment advice fiduciaries. Among other impacts of potential changes, such proposed amendments could have an adverse effect on sales of annuities through our independent distribution partners.
SEC Best Interest Regulation
On June 30, 2020, Regulation Best Interest (“Regulation BI”), which establishes new duties of care, disclosure and conflict mitigation that a broker must meet when making a recommendation of a securities transaction or investment strategy involving securities to a retail customer, and Form CRS, which requires enhanced disclosure by broker-dealers and investment advisers regarding client relationships and certain conflicts of interest issues, became effective. Both were adopted by the SEC in June 2019 as part of a package of final rulemakings and interpretations, at the same time as the SEC issued two interpretations, which became final upon publication, under the Advisers Act. The first interpretation addressed the standard of conduct applicable to SEC-registered investment advisers, including details regarding the fiduciary duty owed to clients, required disclosures and the adviser’s continuous monitoring obligations. The second interpretation clarified when investment advice would be considered “solely incidental” to brokerage activity for purposes of the broker-dealer exclusion from SEC investment adviser registration. The SEC has also issued periodic post-rulemaking guidance on certain aspects of Regulation BI and Form CRS, and could provide additional guidance regarding these final rules in the future. Given its relatively recent adoption, Regulation BI has been a focus of SEC examination and the SEC recently issued a risk alert identifying deficiencies noted by SEC exam staff of firms’ compliance with Regulation BI. Accordingly, compliance with Regulation BI could impose additional costs and affect how we manage our business and overall costs.
State Standard of Care Developments
In 2020, the NAIC adopted revisions to its Suitability in Annuity Transactions Model Regulation (#275) (the “NAIC Model”) implementing a best interest standard of care applicable to sales and recommendations of annuities. The new NAIC Model conforms in large part to Regulation BI, providing that all recommendations by agents and insurers must be in the best interest of the consumer
under known circumstances at the time an annuity recommendation is made, without placing agents’ or insurers’ financial interests ahead of the consumer’s interest in making a recommendation. A majority of states have adopted amendments to their suitability rules based on the NAIC Model revisions, and we expect that a substantial majority of states will do so. In addition, certain state insurance and/or securities regulators and legislatures have adopted, or are considering adopting, their own standards of conduct, some of which are broader in scope than the NAIC Model. For example, in 2018, the NYDFS adopted the First Amendment to Insurance Regulation 187 — Suitability and Best Interests in Life Insurance and Annuity Transactions (“Regulation 187”). As amended, Regulation 187 requires producers to act in their client’s best interest when making both point-of-sale and in-force recommendations and to deliver to the client the written basis for the recommendation, as well as the facts and analysis to support the recommendation. The amended regulation also imposes additional duties on life insurance companies in relation to these transactions, such as requiring insurers to establish and maintain procedures designed to prevent financial exploitation and abuse. Besides New York, other states have also adopted, or are considering adopting, legislative and/or regulatory proposals implementing fiduciary duty standards with applicability to insurance producers, agents, financial advisors, investment advisers, broker-dealers and/or insurance companies. The proposals vary in scope, applicability and timing of implementation. We cannot predict whether any such proposals will be adopted. However, changes in fiduciary duty standards could impose additional costs in the areas of compliance and employee training and affect how we manage our business and overall costs.
Federal Retirement Legislation
On December 20, 2019, the Setting Every Community Up for Retirement Enhancement (“SECURE”) Act was signed into law. The SECURE Act includes many provisions affecting qualified contracts, some of which became effective upon enactment on January 1, 2020, or later, and some of which were retroactively effective. Some of the SECURE Act provisions that became effective on January 1, 2020, include, without limitation: an increase in the age at which required minimum distributions generally must commence, to age 72, from the previous age of 701∕2; new limitations on the period for beneficiary distributions following the death of the plan participant or IRA owner; elimination of the age 701∕2 restriction on IRA contributions (combined with an offset to the amount of eligible qualified charitable distributions by the amount of post-701∕2 IRA contributions); a new exception to the 10% additional tax on early distributions for the birth or adoption of a child, which also became an allowable plan distribution event; and, reduction of the earliest permissible age for in-service distributions from pension plans and certain Section 457 plans to 591∕2. We have implemented new processes and procedures, where needed, designed to comply with the new requirements.
In December 2022, Congress enacted comprehensive retirement legislation within the Consolidated Appropriations Act, 2023, known as “SECURE 2.0.” The provisions enacted may impact our products and services, including changes to required minimum distribution rules. We are evaluating the impact of the legislation and will implement new processes and procedures, where needed, to comply with the new requirements.
U.S. Securities, Investment Adviser, Broker-Dealer and Investment Company Regulation
Our investment products and services are subject to applicable federal and state securities, investment advisory, fiduciary, including ERISA, and other laws and regulations. The principal U.S. regulators of these operations include the SEC, FINRA, CFTC, Municipal Securities Rulemaking Board, state securities commissions, state insurance departments and the DOL.
Our variable life insurance, variable annuity and mutual fund products generally are subject to regulation as “securities” under applicable federal securities laws, except where exempt. Such regulation includes registration of the offerings of these products with the SEC, unless exempt from such registration, and requirements of distribution participants to be registered as broker-dealers, as well as recordkeeping, reporting and other requirements. This regulation also involves the registration of mutual funds and other investment products offered by our businesses, and the separate accounts through which our variable life insurance and variable annuity products are issued, as investment companies under the Investment Company Act, except where exempt. The Investment Company Act imposes requirements relating to compliance, corporate governance, disclosure, recordkeeping, registration and other matters. In addition, the offering of these products may involve filing and other requirements under the securities, corporate, or other laws of the states and other jurisdictions where offered or organized, including the District of Columbia and Puerto Rico. Our separate account investment products are also subject to applicable state insurance regulation.
We have several subsidiaries that are registered as broker-dealers under the Exchange Act and are members of FINRA and/or are registered as investment advisers under the Investment Advisers Act of 1940, as amended (the ‘‘Advisers Act’’). Certain of these broker-dealers and investment advisers are involved in our life and annuity product sales, including participating in their distribution and/or serving as an investment adviser to mutual funds that underlie variable products offered by us. Other subsidiaries are registered with the SEC as investment advisers under the Advisers Act and serve as an investment adviser to out-of-plan and in-plan participant customers, act as investment advisers to our insurance subsidiaries and certain non-insurance subsidiaries and also provide investment management and advisory services to unaffiliated institutional clients. In addition to registration requirements, the Exchange Act, the Advisers Act and the regulations thereunder impose various compliance, disclosure, qualification, recordkeeping, reporting and other requirements on these subsidiaries and their operations. State securities laws also impose filing and other requirements on broker-dealers, investment advisers and/or their licensed representatives, except where exempt. The SEC, FINRA and other regulatory bodies also have the authority to examine regulated entities, such as our broker-dealer and investment adviser
subsidiaries, and to institute administrative or judicial proceedings that may result in censure, fines, prohibitions or restrictions on activities, or other administrative sanctions.
Further, our licensed sales professionals appointed with certain of our broker-dealer and/or investment adviser subsidiaries and our other employees, insofar as they sell products that are securities, including wholesale and retail activity, are subject to the Exchange Act and to examination requirements and regulation by the SEC, FINRA and state securities commissioners. Regulation and examination requirements also extend to our subsidiaries that employ or control those individuals.
The business of our investment adviser subsidiaries will be impacted by SEC regulatory initiatives with respect to the investment management business. The SEC is engaged in various initiatives and reviews that seek to modernize the regulatory structure governing the investment management industry, including investment advisers registered under the Advisers Act and investment companies registered under the Investment Company Act. In addition to rules discussed above, the SEC has adopted rules that include (i) new monthly and annual reporting requirements for mutual funds, (ii) significant amendments to rules regarding advertisements by investment advisers and (iii) significant changes to the regulations applicable to the use of derivatives by mutual funds and mutual funds’ valuation methodologies and procedures. The SEC has also proposed comprehensive rules changing the regulation of investment advisers to private funds, rules prohibiting investment advisers from outsourcing certain services or functions without meeting minimum requirements, and in November 2022 proposed rule and related amendments that, among other things, change how open-end funds, other than money market funds and exchange traded funds (“ETFs”), manage their liquidity risk, require these funds to use a liquidity management tool called “swing pricing” and to implement a “hard close,” and require funds to provide timelier and more detailed public reporting of fund information. If adopted as proposed, the regulatory, compliance, and operational burdens associated with these proposals will be costly and may impede the growth of certain investment adviser subsidiaries, and the hard close and swing pricing proposal in particular raises significant operational challenges for mutual funds and intermediaries that offer fund shares, including our insurance company and recordkeeping subsidiaries.
U.S. Securities Environmental, Social and Governance Developments
The SEC, beginning in late 2020 and continuing through 2022, instituted a comprehensive regulatory agenda focusing on ESG issues. The SEC commissioners and staff announced a number of actions, including forming an enforcement task force designed to harmonize the efforts of the SEC’s divisions and offices, proposed comprehensive rulemakings for ESG disclosure for investment advisers and funds registered under the Investment Company Act and climate-specific disclosure for public issuers, announcing ESG as an examination priority, addressing stockholder rights and creating accountability in statements and conduct, and proposed amendments to the “names rule” under the Investment Company Act to reflect the effect of ESG factors on a fund’s investment objectives and performance. The SEC’s Division of Examinations issued a risk alert in 2021 highlighting ESG deficiencies, internal control weaknesses and effective practices identified during recent examinations of investment advisers, registered investment companies and private funds. In February 2023, the SEC’s Division of Examinations reaffirmed that examinations will continue to focus on ESG-related advisory services and investment products. The increased regulatory and compliance burdens that we expect would result from the implementation of any of these initiatives could be costly.
On March 21, 2022, the SEC released proposed rule changes on climate-related disclosure, among other items. The proposed rule changes would require registrants, including public issuers such as us, to include certain climate-related disclosures in registration statements and periodic reports. These proposed disclosures include information about climate-related risks that are reasonably likely to have a material impact on the registrant’s business, results of operations, or financial condition, and include a new note to their audited financial statements that provides certain climate-related metrics and impacts on a line-item basis. The required information about climate-related risks also would include disclosure of a registrant’s greenhouse gas emissions (including Scope 3 emissions), information about climate-related targets and goals, and transition plan, if any, and would require extensive attestation requirements. If adopted as proposed, the rule changes are expected to result in additional compliance and reporting costs.
Privacy, Data Protection and Cybersecurity
We are subject to U.S. laws and regulations that require financial institutions and other businesses to protect the security, confidentiality, availability and integrity of personal, customer and other sensitive non-public information and the information systems used to process this information and conduct important business operations. These laws and regulations impose a broad range of obligations including processing, disclosing and transferring personal information in compliance with certain restrictions; providing notice to data subjects regarding our personal information processing practices, including our policies relating to the collection, disclosure, use, retention, disposal and other handling of personal and other sensitive non-public information; and maintaining a comprehensive security program designed to maintain the security, confidentiality, availability and integrity of that information and of our information systems. Some of these laws and regulations require us to notify affected individuals and regulators of certain events involving the unauthorized access to, use of or loss of, personal information and information systems. U.S. federal and state legislatures and self-regulatory bodies are expected to continue to consider additional laws, regulations and guidelines relating to privacy and other aspects of customer information and to the ongoing security, confidentiality, availability and integrity of non-public information and information systems.
On March 1, 2017, the NYDFS’s Part 500 Cybersecurity Regulation (“NYDFS Cybersecurity Regulation”) became effective and requires covered financial services institutions (“covered entities”) to implement a cybersecurity program designed to protect the confidentiality, integrity and availability of the covered entity’s information systems and the non-public information stored on those information systems. The NYDFS Cybersecurity Regulation imposes specific technical safeguards as well as governance, risk assessment, monitoring and testing, third-party service provider oversight, incident response and reporting and other requirements. We annually file certifications of compliance as required under the NYDFS Cybersecurity Regulation. Further, on July 29, and November 9, 2022, the NYDFS released draft and official proposed amendments to the NYDFS Cybersecurity Regulation, which include additional obligations for large covered entities, enhanced governance requirements, updates to risk assessment and independent audit requirements, new technology requirements, new asset inventory and business continuity and disaster recovery related requirements, several new notification obligations and clarifying changes regarding enforcement. Requirements under the NYDFS’ Cybersecurity Regulation are similar in many, but not all, respects to those under the NAIC Model Law. The NAIC Model Law requires insurers, insurance producers and other entities required to be licensed under state insurance laws to develop and maintain a written information security program, conduct risk assessments, oversee the data security practices of third-party service providers and other related requirements.
In January 2020, the California Consumer Privacy Act of 2018 (“CCPA”) came into effect and was subsequently amended by the California Privacy Rights Act (“CPRA”), a ballot initiative passed in 2020. The CCPA imposes a number of requirements on businesses that collect the personal information of California consumers, including requirements that provide individuals with certain rights to their personal information and make mandatory disclosures regarding how the businesses use and disclose consumers’ personal information, and establishes a private right of action in some cases if consumers’ personal information is subject to a data breach as a result of the business’s violation of the duty to implement and maintain reasonable security practices. The CPRA took effect on January 1, 2023 and expands upon the CCPA’s requirements imposed on businesses that collect California consumers’ personal information, including additional rights for consumers. It also created the California Privacy Protection Agency which is charged with adopting regulations in furtherance of the CCPA and enforcing both the CCPA and the CPRA. Similar legislation has been proposed and in some cases adopted in other states and will become effective in 2023 (e.g. Virginia, Colorado, Connecticut, and Utah), and additional privacy and cybersecurity laws are expected to be enacted by the states or the federal government in the near future.
In February and March 2022, the SEC released several proposed rules enhancing disclosure requirements for registered companies and investment advisers and funds, respectively, covering cybersecurity risk and management, and incident reporting. If enacted, the proposed rules would, among other things, require registered companies to disclose any material cybersecurity incident on its Form 8-K within four business days of determining that the incident it has experienced is material. They would also require periodic disclosures of, among other things, (i) details on the company’s cybersecurity policies and procedures, (ii) cybersecurity governance and oversight policies, including the board of directors’ oversight of cybersecurity risks and (iii) details of any cybersecurity incident that was previously disclosed on Form 8-K, as well as any undisclosed incidents that were non-material, but have become material in the aggregate. If enacted, the proposed rules would also require that investment advisers implement certain cybersecurity policies and procedures such as risk assessments, report significant cybersecurity incidents to the SEC within 48 hours and include cybersecurity-related disclosures in their Form ADV Part 2A.
The SEC continues to focus on cybersecurity in the asset management industry and has published periodic guidance on the topic, recommending periodic assessments of information, how it is stored and how vulnerable it is, as well as strategies to prevent, detect and respond to cyber threats, including as it relates to risks faced by the advisers’ third-party service providers.
The above-mentioned changes in the privacy and cybersecurity landscape in the United States may require additional compliance investment and additional changes to policies, procedures and operations.
INTERNATIONAL REGULATION
Insurance and Financial Services Regulation
A portion of our business is conducted in foreign countries. Generally, our subsidiaries operating in foreign jurisdictions must satisfy local regulatory requirements; licenses issued by foreign authorities to our subsidiaries are subject to modification or revocation by such authorities, and therefore these subsidiaries could be prevented from conducting business in certain of the jurisdictions where they currently operate. For our international operations, a decline in capital and surplus over capital requirements would limit the ability of our insurance subsidiaries to make dividend payments or distributions. Additionally, regulators in the countries in which such subsidiaries operate may deem it necessary to impose restrictions on dividend distributions in the event of a significant financial market or insurance event which creates uncertainty over our future capital and solvency position.
Our UK insurance subsidiary, AIG Life (United Kingdom), is subject to dual regulation by the UK Prudential Regulation Authority (the “PRA”) and the UK Financial Conduct Authority (the “FCA”). The PRA oversees the financial health and stability of insurance companies and is responsible for the prudential regulation and day-to-day supervision of insurance companies. The PRA oversees
statutory requirements for UK insurers, including capital adequacy and liquidity requirements and minimum solvency margins, to which AIG Life (United Kingdom) must adhere.
In 2016, the prudential regulation of insurance and reinsurance companies across Europe, including AIG Life (United Kingdom), became subject to the Solvency II Directive 2009/138/EC, as implemented in the United Kingdom, and associated regulations (together, “Solvency II”). This new regime effected a full revision of the insurance industry’s solvency framework and prudential regime, in particular imposing minimum capital and solvency requirements, governance requirements, risk management and public reporting standards. Both the UK and the European Union (the “EU”) are in the process of reviewing and suggesting amendments to Solvency II, which may impact each of the areas listed in the previous sentence. The timeframe within which any such proposed reforms will be implemented into UK law and regulation is currently unclear and will depend upon the nature and extent of the proposed changes to the domestic regime, as well as the UK insurance industry’s responses to them. For information on the status of the Solvency II framework following the UK’s withdrawal from the EU, see “—Brexit.” The FCA seeks to protect consumers and oversees financial services products and practices, including those governing insurance companies in the UK. With respect to governance, AIG Life (United Kingdom) is subject to the UK’s Senior Managers and Certification Regime (“SMCR”), legislation aimed to reduce harm to consumers and strengthen market integrity by making senior individuals more accountable for their conduct and competence. In March 2022, PRA and FCA rules around operational resilience came into force requiring firms to strengthen their operational resilience by identifying important business services and setting tolerance levels for operational disruption. At the same time, detailed rules on how firms should be managing their outsourcing and third party relationships came into force. Connected to this, the UK regulators are opening a debate on critical third parties (“CTP”) and managing the risks these firms pose in the financial services arena. In the EU, the EU Digital Operational Resilience Act (“DORA”) will require covered entities, including insurance intermediaries, reinsurance intermediaries and ancillary insurance intermediaries, other than micro-, small, or medium enterprises, to comply with a wide range of organizational and technical requirements to identify, manage and mitigate operational risk arising from use of network and information systems and, in particular, the use of third party ICT service providers. Covered entities will be required to comply with DORA by January 2025.
The Bermuda Monetary Authority (the “BMA”) regulates our insurance subsidiary in Bermuda, AIGB. The Insurance Act 1978 (the “Bermuda Insurance Act”), its related regulations and other applicable Bermuda law, impose a variety of requirements and restrictions including the filing of annual and quarterly statutory financial returns; compliance with minimum enhanced capital requirements; compliance with the BMA’s recently revised Insurance Code of Conduct; provisional restrictions on the payment of dividends and distributions; and restrictions on certain changes in control of regulated (re)insurers. The term “insurer” includes “reinsurer” in the Bermuda Insurance Act.
AIGB, which is currently licensed to carry on long-term business, is registered as a Class E insurer which is the license class for long-term insurers with total assets of more than $500 million. AIGB is not currently licensed to carry on general business and has not sought authorization as a general business insurer or approval as an accredited, certified or reciprocal jurisdiction reinsurer in any state or jurisdiction of the United States or any other country.
Pursuant to the terms of the Bermuda Insurance Act, as a Class E insurer, AIGB will not be permitted to engage in non-insurance business unless that non-insurance business is ancillary to its core business. Non-insurance business means any business other than insurance business and includes carrying on investment business, underwriting debt or securities or otherwise engaging in investment banking and carrying on the business of management, sales or leasing of real property.
A Class E insurer must refrain from declaring or paying any dividends during any financial year if it would cause the company to fail to meet its minimum margin of solvency (“MMS”) or enhanced capital requirement. Furthermore, a long‐term insurer may not declare or pay a dividend to any person other than a policyholder unless the value of the assets of its long‐term business fund (as certified by the company’s approved actuary) exceeds the value of the liabilities of its long‐term business and the amount of any such dividend shall not exceed the aggregate of that excess and any other funds properly available for the payment of dividends arising out of the company’s non- long‐term business .In addition to the foregoing restrictions under the Bermuda Insurance Act, a long-term insurer remains subject to the provisions of the Bermuda Companies Act 1981, which also has restrictions on when such an insurer is able to pay dividends and distributions.
Derivatives
Regulation of, and restrictions on, derivatives markets and transactions were adopted outside the United States in conjunction with similar regulation promulgated by U.S. regulators.(For U.S. derivatives discussion, see “U.S. Regulation—Dodd Frank” for further information). For instance, the EU and UK established a set of regulatory requirements for EU and UK derivatives activities and EU- and UK-regulated entities under the European Market Infrastructure Regulation (“EMIR”) and English law, respectively. These requirements include, among other things, various risk mitigation, risk management, margin posting, regulatory reporting and, for certain categories of derivatives, clearing requirements, that are broadly similar to, but also deviate in certain respects from U.S. regulations of these activities.
Markets in Financial Instruments Directive (MiFID) II
The Markets in Financial Instruments Directive (“MiFID II”) and Markets in Financial Instruments Regulation took effect in Europe on January 3, 2018. MiFID II and the related regulations are intended to create transparency in market trading by, for example, imposing trade and transaction reporting and other requirements. AIG Asset Management (Europe) Limited has implemented and continues to implement new policies, procedures and reporting protocols required to ensure compliance with this legislation and its related rules.
EMIR, which governs derivatives, and MiFID II were adopted by the UK government as part of the Brexit legislative “onshoring” process. The MiFID requirements were implemented in the UK before the UK’s exit from the EU and then amended to reflect the UK’s exit from the EU. MiFIR and EMIR were “onshored” to become part of English law. The UK government has announced intended reforms to the MiFID rules governing trading venues and equity markets in the UK onshored versions of MiFID II and MiFIR in the Wholesale Markets Review and minor changes to EMIR. However, substantive obligations on AIG Asset Management (Europe) Limited arising from EMIR and MIFID II are unlikely to change in the UK context in the near future.
Securities, Investment Adviser, Broker-Dealer and Investment Company Regulation
We operate investment-related businesses in, among other jurisdictions, the UK and Ireland. These businesses may advise on and market investment management products and services, investment funds and separately managed accounts. The regulatory authorities for these businesses include securities, investment advisory, financial conduct and other regulators that typically oversee such issues as: (1) company licensing; (2) the approval of individuals with positions of responsibility; (3) conduct of business to customers, including sales practices; (4) solvency and capital adequacy; (5) fund product approvals and related disclosures; and (6) securities, commodities and related laws, among other items. For example, our regulated asset manager in the UK is subject to the SMCR regime described above. We also participate in investment-related joint ventures in jurisdictions outside the United States, primarily in Europe and Asia. In some cases, our international investment operations are also subject to U.S. securities laws and regulations.
FSB and IAIS
The Financial Stability Board (the “FSB”) consists of representatives of national financial authorities of the G20 countries. The FSB is not a regulator but is focused primarily on promoting international financial stability.
The IAIS represents insurance regulators and supervisors of more than 200 jurisdictions (including regions and states) in nearly 140 countries and seeks to promote globally consistent insurance industry supervision. The IAIS is not a regulator, but one of its activities is to develop insurance regulatory standards for use by local authorities across the globe. The IAIS has adopted ComFrame, a Common Framework for the Supervision of Internationally Active Insurance Groups (“IAIGs”). ComFrame sets out qualitative and quantitative standards for group supervision, governance and internal controls, enterprise risk management, and recovery and resolution planning. As part of ComFrame, the IAIS is developing a risk-based global insurance capital standard (“ICS”) applicable to IAIGs, with the purpose of creating a common language for supervisory discussions of group solvency of IAIGs. Although AIG has been designated as an IAIG, we are not to date separately designated as an IAIG.
The IAIS has adopted a holistic framework (the “Holistic Framework”) for the assessment and mitigation of systemic risk in the insurance sector. The Holistic Framework recognizes that systemic risk can emanate from specific activities and exposures arising from either sector-wide trends or concentrations in individual insurers.
In light of the IAIS adoption of the Holistic Framework, the FSB decided in December 2022 to discontinue the annual identification of Global Systematically Important Insurers in favor of instead applying the Holistic Framework to inform the FSB’s consideration of systemic risk in insurance.
The standards issued by the FSB and/or the IAIS are not binding on the United States or other jurisdictions around the world unless and until the appropriate local governmental bodies or regulators adopt laws and regulations implementing such standards. At this time, as these standards have been adopted only recently and in some cases remain under development, it is not known how the IAIS’ frameworks and/or standards might be implemented in the United States and other jurisdictions around the world or how they might ultimately apply to us.
Brexit
On June 23, 2016, the UK held a referendum in which a majority voted for the UK to withdraw its membership from the EU, known as Brexit. The UK left the EU on January 31, 2020. On December 24, 2020, a trade and cooperation agreement was reached between the UK and the EU which covered areas like economic and security co-operation, tariff-free trade in goods, social security coordination, law enforcement and judicial cooperation in criminal matters, among others, but was largely silent on financial services. Solvency II had been incorporated into UK law prior to January 2020. As of the date of this report, the only changes made were to reflect that the UK is no longer a member of the EU, and, as such, the provisions of the Solvency II framework continue to apply in the UK. Accordingly, there is currently no change to capital adequacy, risk management and regulatory reporting requirements for UK authorized insurers and reinsurers. However, it is likely that the UK’s domestic prudential regime may begin to diverge from Solvency
II as implemented in the EU directive over time. There are ongoing legislative proposals to reform the UK financial services regulatory regime (including particularly the implementation of Solvency II in the UK) and revoke and replace retained EU law in the Financial Services and Market Bill 2022-23.
Climate Change
There were a number of climate-related policy developments throughout 2022, mostly focused on the UK (which we expect will impact our UK operations) and European markets.
The UK FCA applies climate change reporting requirements to larger UK asset managers and UK life insurers that issue insurance-based investment products, which requires those firms to obtain a considerable amount of climate change-related data in relation to their underlying investments. In October 2021, the UK government published its “Greening Finance: A Roadmap to Sustainable Investing”, in which it signaled its support for the International Sustainability Standards Board’s (ISSB) development of sustainability reporting standards and its “roadmap” to apply mandatory disclosure requirements in Annual Reports incorporating the UK Green Taxonomy and ISSB issued standards for the “most economically significant companies.” Further consultation followed from the FCA in October 2022 with regard to Sustainability Disclosure Requirements (“SDR”) and investment labels to discuss concerns that firms could be making “exaggerated, misleading or unsubstantiated sustainability-related claims about their products; claims that do not stand up to closer scrutiny.”
In October 2022, Sam Woods, Chief Executive Officer of the PRA, published a “Dear CEO” letter reflecting on how firms should continue to embed the requirements of the PRA’s climate-related regulation. These regulations include: April 2019’s Supervisory Statement on expectations for firms’ management of climate-related financial risks; Sam Woods’ June 2020 letter stating that by the end of 2021 firms should have embedded fully their approaches to managing climate risks; and the PRA’s October 2021 Climate Change Adaptation Report in which the PRA set out that they would start actively supervising firms against supervisory expectations from 2022 onwards.
The EU Sustainable Finance Disclosure Regulation applied from March 2021 and introduced a common sustainability disclosure regime for EU insurers that provides insurance-based investment products and EU asset managers, in particular for products that promote environmental or social characteristics or invest in sustainable investments.
Changes to MiFID II applicable beginning August 2, 2022, introduced provisions on integrating sustainability factors, risks and preferences into certain organizational requirements and operating conditions for EU MiFID investment firms, including in respect of suitability assessments when products are sold to investors.
On August 11, 2022, the BMA published its “Consultation Paper - Guidance Note: Management of Climate Risk for Commercial Insurers”, which provides details on the BMA’s expectations regarding climate risk in the context of environmental, social and governance risk aspects, and its consideration in governance and risk management requirements, which are part of the revised Insurance Code of Conduct.
Privacy, Data Protection and Cybersecurity
Our UK insurance subsidiary, AIG Life (United Kingdom), is subject to data protection legislation, including the UK General Data Protection Regulation (“UK GDPR”) (i.e., Regulation (EU) 2016/679 (the “EU GDPR”) as it forms part of retained EU law (as defined in the European Union (Withdrawal) Act 2018) and the UK Data Protection Act of 2018. The UK GDPR imposes a range of compliance obligations in relation to the processing of personal information, including the rights of data subjects to, in certain circumstances, request access, correction and deletion of their personal information and not to be subject to a decision based solely on automated processing, robust internal accountability controls and short timelines for data breach notifications.
Sanctions for non-compliance with the UK GDPR include fines of up to the higher of £17.5 million or 4% of global worldwide turnover for the most serious infringements. In March 2022, the UK introduced the International Data Transfer Agreement (“IDTA”) and International Data Transfer Addendum (“Addendum”) for the cross-border transfer of personal data. All contracts signed on or after September 22, 2022, must use the new IDTA or Addendum in place of the previously used Standard Contractual Clauses (“SCCs”) for cross-border data transfers. All contracts entered into prior to September 22, 2022, incorporating the previously used SCCs must be updated to include the IDTA or Addendum by March 22, 2024, onwards. While data protection law in the UK remains closely aligned with that in the EU, it is possible that they diverge in the future. Proposals for general reform of the current data protection regime are under consideration by the UK government. At present, there is no timescale for any changes to be made. For additional information on the UK’s withdrawal from the EU, see “—Brexit.”
In Ireland, Laya Healthcare Limited is subject to data protection legislation, including the EU GDPR. The EU GDPR imposes a range of compliance obligations in relation to the processing of personal information, including the rights of data subjects to, in certain circumstances, request access, correction and deletion of their personal information and not to be subject to a decision based solely on automated processing, robust internal accountability controls, and shorten timelines for data breach notifications. Sanctions for non-compliance include fines of up to the higher of €20 million or 4% of global worldwide turnover for the most serious infringements. The Data Protection Commissioner in Ireland is an active regulator issuing a number of fines across industries including extensive
fines against companies for data protection violations. The European Commission issued new EU SCCs for international data transfers to address the requirements arising out of the decision of the Court of Justice of the European Union in Data Prot. Comm’r, v. Facebook Ireland Ltd. and align with the corresponding guidance from the European Data Protection Board (“EDPB”). All existing SCCs entered into prior to September 27, 2021, were required to be replaced with the new EU SCCs by December 27, 2022. All new agreements executed on or after September 26, 2021 have had to use the new EU SCCs where relevant. The EDPB has issued additional guidance, further clarifying what constitutes international data transfers, and such international data transfers have been subject to increasing scrutiny by data protection supervisory authorities in the EU.
The European Economic Area countries (“EEA”) and the UK have also taken steps to regulate the use of personal data, including external data, and algorithms used for the purpose of AI and automated decision-making. In April 2021, the European Commission published its proposal for a Regulation on a European approach for Artificial Intelligence, known as the Artificial Intelligence Act, which recommends a risk-based approach to restricting, regulating and permitting different AI systems. On December 6, 2022, the Council of the EU approved a compromise draft of the AI Act which will now be voted on by the European Parliament before moving forward for discussions between the EU Member States, the European Parliament and the European Commission. At present, it is anticipated that the AI Act may be adopted by the end of 2023. European countries and supranational political organizations like the EU and the Council of Europe are expected to take an active role in regulating AI in ways that may impact the insurance industry in the future.
The BMA introduced the Insurance Sector Operational Cyber Risk Management Code of Conduct (the “Cyber Code of Conduct”) which became effective on January 1, 2021, and full compliance has been required since December 31, 2021. The Cyber Code of Conduct requires that registrants, such as AIG Life of Bermuda, Ltd. (“AIGB”) , (i) comply with certain new requirements including being able to evidence that there is adequate board visibility and governance of cyber risk, (ii) maintain an operational cyber risk management program, and (iii) establish an asset inventory detailing all information assets.
Our corporate website is www.corebridgefinancial.com. We make available free of charge, through the Investor Relations section of our corporate website, the following reports (and related amendments as filed with the SEC) as soon as reasonably practicable after such materials are electronically filed with, or furnished to, the SEC:
•Annual Reports on Form 10-K
•Quarterly Reports on Form 10-Q
•Current Reports on Form 8-K
•Proxy Statements on Schedule 14A, as well as other filings with the SEC
Also available on our corporate website:
•Audit Committee Charter
•Corporate Governance Guidelines
•Director, Executive Officer and Senior Financial Officer Code of Business Conduct and Ethics (we will post on our website any amendment or waiver to this Code within the time period required by the SEC)
•Employee Code of Conduct
Information contained on our website or that can be accessed through our website is not incorporated by reference into this Recast 2022 Form 10-K. Reference to our website is made as an inactive textual reference.
Information About Our Executive Officers The following table sets forth certain information concerning our executive officers. The respective age of each individual in the table below is as of December 31, 2022.
| | | | | | | | | | | | | | |
| Name | | Age | | Position |
| Kevin Hogan | | 60 | | Director, President and Chief Executive Officer |
| Elias Habayeb | | 50 | | Executive Vice President and Chief Financial Officer |
| Todd Solash | | 47 | | Executive Vice President and President of Individual Retirement and Life Insurance |
| Katherine Anderson | | 59 | | Executive Vice President and Chief Risk Officer |
| David Ditillo | | 47 | | Executive Vice President and Chief Information Officer |
| Terri Fiedler | | 59 | | Executive Vice President and President of Retirement Services |
| Lisa Longino | | 56 | | Executive Vice President and Chief Investment Officer |
| Amber Miller | | 51 | | Executive Vice President and Chief Auditor |
| Christine Nixon | | 58 | | Executive Vice President and General Counsel |
| Jonathan Novak | | 51 | | Executive Vice President and President of Institutional Markets |
| Elizabeth Palmer | | 59 | | Executive Vice President and Chief Marketing Officer |
| Alan Smith | | 55 | | Executive Vice President and Chief Human Resources Officer |
| Mia Tarpey | | 49 | | Executive Vice President and Chief Operating Officer |
Kevin Hogan has served as a director of Corebridge since June 2021. Mr. Hogan also has served as President and Chief Executive Officer of Corebridge since December 2014. Mr. Hogan serves on the board of the American Council of Life Insurers. He was also a founding board member of Alliance for Lifetime Income, where he currently serves as a director. Mr. Hogan started his career in 1984 at AIG in New York and subsequently held management positions in AIG Property Casualty in Chicago, Tokyo, Hong Kong, Singapore and China and AIG Life & Retirement in China, Taiwan and New York. From 2009 until rejoining AIG in 2013, he was Chief Executive Officer, Global Life for the Zurich Insurance Group, Ltd. Prior to his current role, he served as Chief Executive Officer of AIG’s Consumer organization and senior officer for Japan.
Mr. Hogan brings to the Board his expertise and key leadership skills developed through extensive experience in the financial services industry, with a strong background across insurance, and perspective as Chief Executive Officer of Corebridge.
Elias Habayeb has served as Executive Vice President of Corebridge since October 2021 and Chief Financial Officer of Corebridge since November 2021. Prior to his current role, Mr. Habayeb served in a number of senior financial roles for AIG, most recently as Chief Financial Officer for General Insurance where he oversaw all finance activities supporting the General Insurance business. He also served as AIG’s Deputy Chief Financial Officer and AIG’s Chief Accounting Officer. His previous roles included Chief Financial Officer of International Lease Finance Corporation, a wholly owned subsidiary of AIG, where he led efforts for its ultimate sale in 2014. Prior to AIG, Mr. Habayeb was a partner at Deloitte & Touche LLP and has more than 25 years of financial services experience in banking and insurance.
Todd Solash has served as President of Individual Retirement and Life Insurance and Executive Vice President of Corebridge since February 2022. Mr. Solash joined AIG in 2017 as President of Individual Retirement. Prior to joining AIG, Mr. Solash served as Senior Executive Director, Head of Individual Annuity at AXA Equitable Life Insurance Company from 2010 to 2017. Mr. Solash serves on the Board of LL Global, the parent company of LIMRA and Life Office Management Association.
Katherine Anderson has served as Chief Risk Officer of Corebridge since 2016 and Executive Vice President since February 2022. Ms. Anderson joined AIG in August 2014 as Chief Risk Officer and Vice President of its consumer businesses. Previously, Ms. Anderson served for 13 years in various roles at ING, including Chief Insurance Risk officer of the Asia-Pacific region, Chief Financial Officer and Chief Actuary of the Latin America region, and Vice President of the U.S.-domiciled reinsurance organization. Ms. Anderson is a Fellow of the Society of Actuaries.
David Ditillo has served as Chief Information Officer of Corebridge since 2020 and Executive Vice President since February 2022. Prior to joining AIG, Mr. Ditillo served in various technology executive management roles at MetLife, Inc., including Senior Vice President and Chief Information Officer for its U.S. business and Senior Vice President of U.S. Application Development.
Terri Fiedler has served as President, Retirement Services since October 2022. Previously, she was President of AIG Financial Distributors since May 2019. Ms. Fiedler served as Executive Vice President, Strategic Accounts for AIG Financial Distributors, responsible for working closely with the organization’s business teams to fully meet the product and services needs of AIG Life & Retirement’s largest clients from May 2012 through April 2019. Prior to joining AIG, Ms. Fiedler was the Senior Director of National Account Management at Invesco U.S. from September 2007 to May 2012 and, prior to that, spent 12 years at AIM Distributors. She
currently serves as a director of Archer Holdco, LLC. and Chair of the Insured Retirement Institute and a Board Director for the Foundation for Financial Planning.
Lisa Longino has served as Chief Investment Officer of Corebridge Financial since February 2023. Prior to joining Corebridge, Ms. Longino was Head of Global Investment Strategy for Prudential Financial. Previously, she held several investment roles over more than 20 years at MetLife, including Head of Insurance Asset Management, Head of Portfolio Management and Head of Investment Grade Trading. Ms. Longino has been investing for insurance companies for over three decades with a focus on fixed income portfolios matched to insurance liabilities.
Amber Miller has served as Chief Auditor of Corebridge since July 2018 and Executive Vice President since February 2022. Ms. Miller joined AIG in September 2008, serving in various roles in internal audit covering various AIG products and functions. Prior to joining AIG, Ms. Miller served in various audit management roles at JPMorgan Chase for 15 years in the United States and the UK. Ms. Miller is a certified internal auditor.
Christine Nixon has served as General Counsel of Corebridge since 2010 and Executive Vice President since February 2022. Ms. Nixon has also served as Senior Vice President and Deputy General Counsel of AIG since 2010. Ms. Nixon joined AIG in 1999, when AIG acquired SunAmerica Inc., having been appointed to Vice President and Co-General Counsel in 2000 and Deputy Chief Legal Counsel and Secretary in 2001 for SunAmerica Inc., and General Counsel of AIG Retirement Services in 2006. Prior to joining AIG, Ms. Nixon served as Associate Counsel at SunAmerica Inc. Prior to joining SunAmerica Inc., Ms. Nixon was an associate at Sheppard, Mullin, Richter & Hampton LLP.
Jonathan Novak has served as President of Institutional Markets since April 2012 and Executive Vice President since February 2022. Mr. Novak also serves as Head of Life & Retirement Strategy, Corporate Development and Reinsurance of AIG. Mr. Novak joined AIG in April 2012. Prior to joining AIG, Mr. Novak served as Managing Director in the Financial Institutions Risk Management business at Goldman Sachs for 12 years. Prior to that, Mr. Novak served as an Associate in the Reinsurance Underwriting division at Berkshire Hathaway for four years. Mr. Novak holds the Chartered Financial Analyst professional designation.
Elizabeth Palmer has served as the Chief Marketing Officer of Corebridge since March 2019 and Executive Vice President since February 2022. Prior to joining Corebridge, Ms. Palmer served as the Senior Vice President and Chief Communications Officer of the Teachers Insurance and Annuity Association from 2010 to 2019. Ms. Palmer serves on the board of the National Council on Aging and as the Treasurer for Alliance for Lifetime Income.
Alan Smith has served as the Head of Human Resources of Corebridge since October 2020 and Executive Vice President since February 2022. Prior to joining AIG, Mr. Smith was the Chief Human Resources Officer & Interim Chief Administration Officer for Whittle Management, a private equity-backed global for profit K-12 educational company, from December 2017 to September 2020. Prior to that, Mr. Smith held senior human resources leadership roles with TE Connectivity from 2008 to 2017, including his role as Vice President of Human Resources for the Communications Solutions Segment, while based in Shanghai, China, from 2013 to 2017. Mr. Smith serves on the board of Cornerstone Family Programs. Mr. Smith is also an elected member of the Morris School District Board of Education.
Mia Tarpey has served as Executive Vice President and Chief Operating Officer since August 2022. Ms. Tarpey joined AIG in June 2021 as Head of the Separation Management Office. Prior to joining AIG, Ms. Tarpey served in various roles at Equitable Financial Life Insurance Company from 2015 to 2021, most recently as Managing Director and Head of Operations and Strategy for Individual Retirement. Previously, she served as Chief Administrative Officer of Chase Wealth Management, a division of JP Morgan Chase & Co. and held various roles at E*TRADE Financial Corporation in corporate development, innovation and risk management. Ms. Tarpey also worked for CIBC World Markets Corp. in its investment banking and venture capital investing business.
ITEM 7. | Management’s Discussion and Analysis of Financial Condition and Results of Operations
Glossary and Acronyms of Selected Insurance Terms and ReferencesThroughout this Management’s Discussion and Analysis of Financial Condition and Results of Operations (“MD&A”), we use certain terms and abbreviations, which are summarized in the Glossary and Acronyms.
Corebridge has incorporated into this discussion a number of cross-references to additional information included throughout this Recast 2022 Form 10-K and the 2022 Form 10-K to assist readers seeking additional information related to a particular subject.
In this Report, unless otherwise mentioned or unless the context indicates otherwise, we use the terms “Corebridge,” “we,” “us” and “our” to refer to Corebridge Financial, Inc., a Delaware corporation, and its consolidated subsidiaries. We use the term “Corebridge Parent” to refer solely to Corebridge Financial, Inc., and not to any of its consolidated subsidiaries.
This MD&A addresses the consolidated financial condition of Corebridge as of December 31, 2022, compared with December 31, 2021, and its consolidated results of operations for the years ended December 31, 2022, 2021 and 2020. In addition to historical data, this discussion contains forward-looking statements about our business operations and financial performance based on current expectations that involve risks, uncertainties and assumptions. Actual results may differ materially from those discussed in the forward-looking statements as a result of various factors. You should read the following analysis of our consolidated financial condition and results of operations in conjunction with the audited annual consolidated financial statements and the statements under "Cautionary Statement Regarding Forward-Looking Information" included elsewhere herein and the “Risk Factors” included in the 2022 Form 10-K.
The following discussion and analysis of our financial condition and results of operations highlights selected information and may not contain all of the information that is important to current or potential investors in our securities. This Recast 2022 Form 10-K updates certain sections of the 2022 Form 10-K and should be read alongside the 2022 Form 10-K in its entirety for a more detailed description of events, trends, uncertainties, risks, and critical accounting estimates affecting us. This Recast 2022 Form 10-K does not reflect events occurring after the February 24, 2023 filing date of the 2022 Form 10-K and does not modify or update the disclosures therein except to reflect the impacts of LDTI. Results for the year ended December 31, 2020 are presented on a pre-LDTI basis. For developments since the filing of the 2022 Form 10-K, refer to our Quarterly Report on Form 10-Q for the quarter ended March 31, 2023, and our Current Reports on Form 8-K filed since the filing of the 2022 Form 10-K.
Index to Item 7
| | | | | |
| Page |
| Executive Summary | |
| |
| Revenues | |
| Benefits and Expenses | |
| Significant Factors Impacting our Results | |
| Corebridge’s Outlook - Macroeconomic, Industry and Regulatory Trends | |
| Use of Non-GAAP Measures | |
| Key Operating Metrics | |
| Consolidated Results of Operations | |
| Business Segment Operations | |
| Individual Retirement | |
| Group Retirement | |
| Life Insurance | |
| Institutional Markets | |
| Corporate and Other | |
| Investments | |
| Overview | |
| Key Investment Strategies | |
| Credit Ratings | |
Future Policy Benefits, Policyholder Contract Deposits and Market Risk Benefits | |
| Liquidity and Capital Resources | |
| Overview | |
| Liquidity and Capital Resources of Corebridge Parent and Intermediate Holding Companies | |
| Liquidity and Capital Resources of Corebridge insurance subsidiaries | |
| Contractual Obligations | |
| Short-Term and Long-Term Debt | |
| Credit Ratings | |
| Off-Balance Sheet Arrangements and Commercial Commitments | |
| Accounting Policies and Pronouncements | |
| Critical Accounting Estimates | |
| Adoption of Accounting Pronouncements | |
| Glossary | |
| Certain Important Terms | |
| Acronyms | |
ITEM 7 | Executive Summary
OVERVIEW
We are one of the largest providers of retirement solutions and insurance products in the United States, committed to helping individuals plan, save for and achieve secure financial futures. We offer a broad set of products and services through our market leading Individual Retirement, Group Retirement, Life Insurance and Institutional Markets businesses, each of which features capabilities and industry experience we believe are difficult to replicate. These four businesses collectively seek to enhance stockholder returns while maintaining our attractive risk profile, which has historically resulted in consistent and strong cash flow generation.
REVENUES
Our revenues come from five principal sources:
•Premiums are principally derived from our traditional life insurance and certain annuity products including PRT transactions and structured settlements with life contingencies. Our premium income is driven by growth in new policies and contracts written and persistency of our in-force policies, both of which are influenced by a combination of factors including our efforts to attract and retain customers and market conditions that influence demand for our products;
•Policy fees are principally derived from our individual retirement, group retirement, universal life insurance, COLI-BOLI and stable value wrap (“SVW”) products. Our policy fees typically vary directly with the underlying account value or benefit base of our annuities. Account value and benefit base are influenced by changes in economic conditions, including changes in levels of equity prices, and changes in levels of interest rates and credit spreads, as well as net flows;
•Net investment income from our investment portfolio varies as a result of the yield, allocation and size of our investment portfolio, which are, in turn, a function of capital market conditions and net flows into our total investments, as well as the expenses associated with managing our investment portfolio;
•Net realized gains (losses), include changes in the Fortitude Re funds withheld embedded derivative, risk management related derivative activities (excluding hedges of certain MRBs), changes in the fair value of embedded derivatives in certain of our insurance products and trading activity within our investment portfolio, including trading activity related to the Fortitude Re modco arrangement. Net realized gains (losses) vary due to the timing of sales of investments as well as changes in the fair value of embedded derivatives in certain of our insurance products and derivatives utilized to hedge certain embedded derivatives; and
•Advisory fee income and other income includes fees from registered investment advisory services, 12b-1 fees (marketing and distribution fees paid by mutual funds), other asset management fee income, and commission-based broker dealer services.
BENEFITS AND EXPENSES
Our benefits and expenses come from six principal sources:
•Policyholder benefits are driven primarily by customer withdrawals and surrenders from traditional products which change in response to changes in capital market conditions and changes in policy reserves, as well as life contingent benefit payments on life and annuity contracts and updates to assumptions related to future policyholder behavior, mortality and longevity;
•Interest credited to policyholder account balances varies in relation to the amount of the underlying account value or benefit base and also includes changes in the fair value of certain embedded derivatives related to our insurance products and amortization of deferred sales inducement assets;
•Amortization of DAC and value of business acquired (“VOBA”) for all contracts except for “other” investment contracts is amortized, on a constant level basis over the expected term of the related contracts, using assumptions consistent with those used in estimating the related liability for future policy benefits, or any other related balances, for those corresponding contracts, as applicable. VOBA is determined at the time of acquisition and is reported with DAC. This value is based on the present value of future pre-tax profits discounted at yields applicable at the time of purchase.
•General operating and other expenses include expenses associated with conducting our business, including salaries, other employee-related compensation and other operating expenses such as professional services or travel; and
•Change in the fair value of market risk benefits, net represents the changes in fair value of MRBs contained within certain insurance contracts (excluding the impact of changes in our own credit risk), including attributed fees, along with the changes in the fair value of derivatives that economically hedge MRBs. Changes in our own credit risk are included in OCI.
•Interest expense represents the charges associated with our external debt obligations, including debt of consolidated investment entities. This expense varies based on the amount of debt on our balance sheet, as well as the rates of interest associated with those obligations. Interest expense related to consolidated investment entities principally relates to variable interest entities
ITEM 7 | Executive Summary
(“VIEs”) for which we are the primary beneficiary; however, creditors or beneficial interest holders of VIEs generally only have recourse to the assets and cash flows of the VIEs and do not have recourse to us except in limited circumstances when we have provided a guarantee to the VIE’s interest holders.
SIGNIFICANT FACTORS IMPACTING OUR RESULTS
The following significant factors have impacted, and may in the future impact, our business, results of operations, financial condition and liquidity.
Impact of Fortitude Re
In 2018, AIG established Fortitude Re, a wholly owned subsidiary of Fortitude Group Holdings, LLC (“Fortitude Holdings”), in a series of reinsurance transactions related to certain of AIG’s legacy operations. In February 2018, AGL, VALIC and USL entered into modco agreements with Fortitude Re, a registered Class 4 and Class E reinsurer in Bermuda. Additionally, AIG Bermuda novated its assumption of certain long-duration contracts from an affiliated entity to Fortitude Re.
In the modco arrangement, the investments supporting the reinsurance agreements, which reflect the majority of the consideration that would be paid to the reinsurer for entering into the transaction, are withheld by, and therefore continue to reside on the balance sheet of, the ceding company (i.e., AGL, VALIC and USL) thereby creating an obligation for the ceding company to pay the reinsurer (i.e., Fortitude Re) at a later date. Additionally, since we maintain ownership of these investments, we reflect our existing accounting for these assets, which consist mostly of available-for-sale securities (e.g., the changes in fair value of available-for-sale securities will be recognized within OCI) on our balance sheet. We have established a funds withheld payable to Fortitude Re while simultaneously establishing a reinsurance asset representing liabilities for the insurance coverage that Fortitude Re has assumed. The funds withheld payable contains an embedded derivative and changes in fair value of this derivative are recognized in Net realized gains (losses) on Fortitude Re funds withheld embedded derivative. This embedded derivative is considered a total return swap with contractual returns that are attributable to various assets, primarily available-for-sale securities, associated with these reinsurance agreements. As the majority of the invested assets supporting the modco are fixed income securities that are available-for-sale, there is a mismatch between the accounting for the embedded derivative as its changes in fair value are recorded through net income while changes in the fair value of the fixed maturity securities available for sale are recorded through OCI.
On July 1, 2020, AGL and USL amended the modco agreements. Under the terms of the amendment, certain business ceded to Fortitude Re was recaptured by the Company, and certain additional business was ceded by the Company to Fortitude Re. We recorded an additional non-recurring $91 million loss related entirely to the amendments to the modco agreements.
On June 2, 2020, AIG completed the Majority Interest Fortitude Sale. Following closing of the Majority Interest Fortitude Sale, AIG contributed $135 million of its proceeds from the Majority Interest Fortitude Sale to USL. On October 1, 2021, AIG contributed its remaining 3.5% interest in Fortitude Re Bermuda to us and we are entitled to a seat on the board of Fortitude Re Bermuda. At March 31, 2022, our ownership interest in Fortitude Re Bermuda was reduced from 3.5% to 2.46% due to a round of equity financing, by third-party investors, in which we did not participate, that closed on March 31, 2022. As of December 31, 2022, $30.8 billion of reserves related to business written by multiple wholly owned AIG subsidiaries, including $26.8 billion of reserves related to Corebridge, had been ceded to Fortitude Re. As of closing of the Majority Interest Fortitude Sale on June 2, 2020, these reinsurance transactions were no longer considered affiliated transactions.
In addition to the loss incurred from the amendments of the Fortitude Re reinsurance agreements, our net income experiences ongoing volatility as a result of the reinsurance agreements, which, as described above, give rise to a funds withheld payable that contains an embedded derivative. However, this net income volatility is almost entirely offset with a corresponding change in OCI, which reflects the fair value change from the investment portfolio supporting the funds withheld payable, which is primarily available- for-sale securities, resulting in minimal impact to our comprehensive income (loss) and equity attributable to Corebridge. Beginning in the fourth quarter of 2021, the Company began to elect the fair value option on the acquisition of certain new fixed maturity securities, which will help reduce this mismatch over time.
ITEM 7 | Executive Summary
Fortitude Re funds withheld impact:
| | | | | | | | | | | | | | | | | | | | | | | | | | | | |
| | | | | | Years Ended December 31, |
| (in millions) | | | | | | | | | | 2022 | | 2021 | | 2020 |
| Net investment income - Fortitude Re funds withheld assets | | | | | | | | | | $ | 891 | | | $ | 1,775 | | | $ | 1,427 | |
| Net realized gains (losses) on Fortitude Re funds withheld assets: | | | | | | | | | | | | | | |
| Net realized gains (losses)on Fortitude Re funds withheld assets | | | | | | | | | | (397) | | | 924 | | | 1,002 | |
| Net realized gains (losses) on Fortitude Re funds withheld embedded derivatives | | | | | | | | | | 6,347 | | | (687) | | | (3,978) | |
| Net realized gains (losses) on Fortitude Re funds withheld assets | | | | | | | | | | 5,950 | | | 237 | | | (2,976) | |
| Income (loss) before income tax benefit (expense) | | | | | | | | | | 6,841 | | | 2,012 | | | (1,549) | |
| Income tax benefit (expense)* | | | | | | | | | | (1,437) | | | (423) | | | 325 | |
| Net income (loss) | | | | | | | | | | 5,404 | | | 1,589 | | | (1,224) | |
| Change in unrealized appreciation (depreciation) of the invested assets supporting the Fortitude Re modco arrangement classified as available for sale* | | | | | | | | | | (5,064) | | | (1,488) | | | 1,165 | |
| Comprehensive income (loss) | | | | | | | | | | $ | 340 | | | $ | 101 | | | $ | (59) | |
* The income tax expense (benefit) and the tax impact on OCI were computed using the U.S. statutory tax rate of 21%.
Various assets supporting the Fortitude Re funds withheld arrangements are reported at amortized cost, and as such, changes in the fair value of these assets are not reflected in the financial statements. However, changes in the fair value of these assets are included in the embedded derivative in the Fortitude Re funds withheld arrangement and the appreciation (depreciation) of the assets is the primary driver of the comprehensive income (loss) reflected above.
For further details on this transaction, see Note 7 to our audited annual consolidated financial statements.
Impact of Variable Annuity Guaranteed Benefit Riders and Hedging
Our Individual Retirement and Group Retirement businesses offer variable annuity products with riders that provide guaranteed benefits. The liabilities are accounted for as market risk benefits and measured at fair value. The fair value of the market risk benefits may fluctuate significantly based on market interest rates, equity prices, credit spreads, market volatility, policyholder behavior and other factors.
In addition to risk-mitigating features in our variable annuity product design, we have an economic hedging program designed to manage market risk from guaranteed annuity benefits, including exposures to changes in interest rates, equity prices, credit spreads and volatility. The hedging program includes all in-force GMWB policies and utilizes derivative instruments, including, but not limited to, equity options, futures contracts and interest rate swap and option contracts, as well as fixed maturity securities.
Differences in Valuation of MRBs and Economic Hedge Target
Our variable annuity hedging program utilizes an economic hedge target, which represents an estimate of the underlying economic risks in our GMWB riders. The economic hedge target differs from the GAAP valuation of the MRBs, creating volatility in our net income (loss) primarily due to the following:
•the MRBs include both the GMWB riders and the GMDB riders while the hedge program is targeting the economic risks of just the GMWB rider.
•The hedge program is designed to offset moves in the GMWB economic liability and therefore has a lower sensitivity to equity market changes than the MRBs.
•the economic hedge target includes 100% of the GMWB rider fees in present value calculations;
•the GAAP valuation reflects those fees attributed to the MRB such that the initial value at contract issue equals zero since the MRB includes GMWB’s and GMDB’s these attributed fees are typically larger than just the GMWB rider fees;
•the economic hedge target uses best estimate actuarial assumptions and excludes explicit risk margins used for GAAP valuation, such as margins for policyholder behavior, mortality and volatility; and
•the economic hedge target excludes our own credit risk changes (non-performance adjustments) used in the GAAP valuation, which will be recognized in OCI. The GAAP valuation has different sensitivities to movements in interest rates and other market factors, and to changes from actuarial assumption updates, than the economic hedge target.
For more information on our valuation methodology for MRBs within policyholder contract deposits, see Note 4 to our audited annual consolidated financial statements.
The market value of the hedge portfolio compared to the economic hedge target at any point in time may be different and is not expected to be fully offsetting. In addition to the derivatives held in conjunction with the variable annuity hedging program, we
ITEM 7 | Executive Summary
generally have cash and invested assets available to cover future claims payable under these guarantees. The primary sources of difference between the change in the fair value of the hedging portfolio and the economic hedge target include:
•basis risk due to the variance between expected and actual fund returns, which may be either positive or negative;
•realized volatility versus implied volatility;
•actual versus expected changes in the hedge target driven by assumptions not subject to hedging, particularly policyholder behavior; and
•risk exposures that we have elected not to explicitly or fully hedge.
The following table presents the impact on pre-tax income (loss) and other comprehensive income (loss) of Variable Annuity MRBs and Hedging for the Individual Retirement and Group Retirement Segments:
| | | | | | | | | | | | | | | | | | | | | | | | | | | | | | | | | | | | | | |
| | Year Ended December 31, 2022 | | Year Ended December 31, 2021 |
| (in millions) | | MRB Liability(*) | | Hedge Assets | | Net | | MRB Liability(*) | | Hedge Assets | | Net |
| Issuances | | $ | (11) | | | $ | — | | | $ | (11) | | | $ | (21) | | | $ | — | | | $ | (21) | |
| Interest accrual and effects of time | | (79) | | | (283) | | | (362) | | | (70) | | | (235) | | | (305) | |
| Attributed fees | | (934) | | | — | | | (934) | | | (880) | | | — | | | (880) | |
| Expected claims | | 84 | | | — | | | 84 | | | 55 | | | — | | | 55 | |
| Effect of changes in interest rates | | 3,328 | | | (2,746) | | | 582 | | | 946 | | | (868) | | | 78 | |
| Effect of changes in interest rate volatility | | (288) | | | 140 | | | (148) | | | (80) | | | 29 | | | (51) | |
| Effect of changes in equity markets | | (1,499) | | | 1,030 | | | (469) | | | 1,617 | | | (942) | | | 675 | |
| Effect of changes in equity index volatility | | 76 | | | (32) | | | 44 | | | (56) | | | 53 | | | (3) | |
| Actual outcome different from model expected outcome | | (203) | | | — | | | (203) | | | (147) | | | — | | | (147) | |
| Effect of changes in future expected policyholder behavior | | 87 | | | — | | | 87 | | | (53) | | | — | | | (53) | |
| Effect of changes in other future expected assumptions | | 16 | | | — | | | 16 | | | 36 | | | — | | | 36 | |
| Foreign exchange Impact | | 7 | | | — | | | 7 | | | 6 | | | — | | | 6 | |
| Total impact on balance before other and changes in our own credit risk | | 584 | | | (1,891) | | | (1,307) | | | 1,353 | | | (1,963) | | | (610) | |
| Other | | — | | | 66 | | | 66 | | | 1 | | | 8 | | | 9 | |
| Effect of changes in our own credit risk | | 1,206 | | | (56) | | | 1,150 | | | 275 | | | 73 | | | 348 | |
| Total income (loss) impact on market risk benefits | | 1,790 | | | (1,881) | | | (91) | | | 1,629 | | | (1,882) | | | (253) | |
| Less: impact on OCI | | 1,206 | | | (527) | | | 679 | | | 275 | | | (122) | | | 153 | |
| Add: fees net of claims and ceded premiums and benefits | | 847 | | | — | | | 847 | | | 851 | | | — | | | 851 | |
| Net impact on pre-tax income (loss) | | $ | 1,431 | | | $ | (1,354) | | | $ | 77 | | | $ | 2,205 | | | $ | (1,760) | | | $ | 445 | |
| Net change in value of economic hedge target and related hedges | | | | | | | | | | | | |
| Net impact on economic gains | | | | | | $ | 714 | | | | | | | $ | 109 | |
* MRB Liability is partially offset by MRB Assets
Year Ended December 31, 2022
•Net impact on pre-tax income of $77 million was primarily driven by increases in interest rates partially offset by decreases in equity markets.
On an economic basis, the changes in the fair value of the hedge portfolio were partially offset by the changes in the economic hedge target. In the year ended December 31, 2022, we had a net mark-to-market gain of approximately $714 million from our hedging activities related to our economic hedge target primarily driven by widening credit spreads and update of actuarial assumptions.
Year Ended December 31, 2021
•Net impact on pre-tax income of $445 million was mostly driven by higher equity markets.
On an economic basis, the changes in the fair value of the hedge portfolio were partially offset by the changes in the economic hedge target. In 2021, we had a net mark-to market gain of approximately $109 million from our hedging activities related to our economic hedge target primarily driven by higher equity markets, partially offset by losses from the review and update of actuarial assumptions.
ITEM 7 | Executive Summary
The following table presents the net increase to consolidated pre-tax income from changes in the fair value of the GMWB embedded derivatives and related hedges, excluding related DAC amortization during 2020:
| | | | | | | | | | | | | | | | |
| | | | | | | | | | Year Ended December 31, |
| (in millions) | | | | | | | | | | 2020 |
Change in fair value of embedded derivatives, excluding the update of actuarial assumptions and NPA(a) | | | | | | | | | | $ | (1,152) | |
| Change in fair value of variable annuity hedging portfolio: | | | | | | | | | | |
Fixed maturity securities(b) | | | | | | | | | | 44 | |
| Interest rate derivative contracts | | | | | | | | | | 1,342 | |
| Equity derivative contracts | | | | | | | | | | (679) | |
| Change in fair value of variable annuity hedging portfolio | | | | | | | | | | 707 | |
| Change in fair value of embedded derivatives excluding the update of actuarial assumptions and NPA, net of hedging portfolio | | | | | | | | | | (445) | |
| Change in fair value of embedded derivatives due to NPA spread | | | | | | | | | | 50 | |
| Change in fair value of embedded derivatives due to change in NPA volume | | | | | | | | | | 404 | |
| Change in fair value of embedded derivatives due to the update of actuarial assumptions | | | | | | | | | | 194 | |
| Total change due to the update of actuarial assumptions and NPA | | | | | | | | | | 648 | |
| Net impact on pre-tax income | | | | | | | | | | 203 | |
| Impact to Consolidated Income Statement line | | | | | | | | | | |
| Net investment income, net of related interest credited to policyholder account balances | | | | | | | | | | 44 | |
| Net realized gains | | | | | | | | | | 159 | |
| Net impact on pre-tax income | | | | | | | | | | 203 | |
| Net change in value of economic hedge target and related hedges | | | | | | | | | | |
| Net impact on economic gains | | | | | | | | | | $ | 295 | |
(a)The non-performance risk adjustment (“NPA”) adjusts the valuation of derivatives to account for our own non-performance risk in the fair value measurement of
all derivative net liability positions.
(b)The impact to OCI was a gain of $217 million for the Year Ended December 31, 2020 due to the impact of decreases in interest rates and tightening credit spreads.
Year Ended December 31, 2020
Net impact on pre-tax income of $203 million resulted from:
•$445 million loss in the fair value of embedded derivatives excluding update of actuarial assumptions and NPA, net of the hedging portfolio was driven by lower interest rates, partially offset by higher equity markets; and
•$648 million gain due to the update of actuarial assumptions and NPA was driven by a widening of the NPA credit spread, the impact of lower interest rates that resulted in NPA volume gains from higher expected GMWB payments and gains from the review and update of actuarial assumptions.
On an economic basis, the changes in the fair value of the hedge portfolio were partially offset by the changes in the economic hedge target. In 2020, we had a net mark-to-market gain of approximately $295 million from our hedging activities related to our economic hedge target primarily driven by gains from higher equity markets and gains from the review and update of actuarial assumptions.
Embedded Derivatives for Fixed Index Annuity and Index Universal Life Products
Fixed index annuity contracts contain indexed interest credits which are accounted for as embedded derivatives and our index universal life insurance products also contain embedded derivatives. Policyholders may elect to rebalance among the various accounts within the product at specified renewal dates. At the end of each index term, we generally have the opportunity to re-price the indexed component by establishing different participation rates or caps on indexed credited rates. The index crediting feature of these products results in the recognition of an embedded derivative that is required to be bifurcated from the host contract and carried at fair value with changes in the fair value of the liabilities recorded in Net realized gains (losses). Option pricing models are used to estimate fair value, taking into account assumptions for future index growth rates, volatility of the index, future interest rates and our ability to adjust the participation rate and the cap on indexed credited rates in light of market conditions and policyholder behavior assumptions.
ITEM 7 | Executive Summary
The following table summarizes the fair values of the embedded derivatives for fixed index annuity and index universal life products:
| | | | | | | | | | | | | | | | | | | | | |
| | December 31, | | | |
| (in millions) | | 2022 | | 2021 | | | | | | | |
| Fixed index annuities | | $ | 4,657 | | | $ | 4,807 | | | | | | | | |
| Index life | | 710 | | | 765 | | | | | | | | |
| | | | | | | | | | | |
Actuarial Assumption Changes
Most of the fixed annuities, fixed index annuities, variable annuity products and universal life insurance products we offer maintain policyholder deposits that are reported as liabilities and classified within either separate account liabilities or policyholder contract deposits. Our products and riders also impact liabilities for future policyholder benefits and unearned revenues and assets for DAC and deferred sales inducements (“DSI”). The valuation of these assets and liabilities (other than deposits) is based on differing accounting methods depending on the product, each of which requires numerous assumptions and considerable judgment. The accounting guidance applied in the valuation of these assets and liabilities includes, but is not limited to, the following: (i) traditional life and limited pay insurance products for which actual experience is reflected in the liability and assumptions are reviewed and updated at least annually, if necessary, with the recognition and parenthetical presentation of any resulting re-measurement gain or loss in Policyholder benefits (except for discount rate changes) in the income statement; (ii) certain product guarantees for which benefit liabilities are accrued over the life of the contract in proportion to actual and future expected policy assessments; (iii) certain product guarantees reported as market risk benefits or index crediting features accounted for as embedded derivatives which are carried at fair value; and (iv) unearned revenue and assets for DAC, VOBA and DSI which are amortized on a constant level basis over the expected term of the related contracts using assumptions consistent with those used in estimating the related liability for future policy benefits, or any other related balances, for those corresponding contracts, as applicable.
At least annually, typically in the third quarter, we conduct a comprehensive review of the underlying assumptions within our actuarially determined assets and liabilities. These assumptions include, but are not limited to, policyholder behavior, mortality, expenses, investment returns and policy crediting rates. Changes in assumptions can result in a significant change to the carrying value of product liabilities and assets and, consequently, the impact could be material to earnings in the period of the change.
For further details of our accounting policies and related judgments pertaining to assumption updates, see “Management’s Discussion and Analysis of Financial Condition and Results of Operations—Accounting Policies and Pronouncements—Critical Accounting Estimates—Estimated Gross Profits to Value Deferred Acquisition Costs and Unearned Revenue for Investment-Oriented Products” and “Management’s Discussion and Analysis of Financial Condition and Results of Operations—Accounting Policies and Pronouncements—Critical Accounting Estimates—Future Policy Benefits for Life and Accident and Health Insurance Contracts.”
ITEM 7 | Executive Summary
The following table presents the increase (decrease) in adjusted pre-tax operating income and pre-tax income resulting from the annual update of actuarial assumptions, which occurs in the third quarter of each year, by financial statement line item as reported in the Consolidated Statements of Income (Loss):
| | | | | | | | | | | | | | | | | | | | | | | | |
| | | | Years Ended December 31, |
| (in millions) | | | | | | 2022* | | 2021* | | 2020 |
| Premiums | | | | | | $ | — | | | $ | (41) | | | $ | — | |
| Policy fees | | | | | | — | | | — | | | (106) | |
| Interest credited to policyholder account balances | | | | | | — | | | — | | | (6) | |
| Amortization of deferred policy acquisition costs | | | | | | — | | | — | | | 225 | |
| Policyholder benefits | | | | | | 29 | | | 89 | | | (246) | |
| Increase (decrease) in adjusted pre-tax operating income | | | | | | 29 | | | 48 | | | (133) | |
| Change in fair value of market risk benefits, net | | | | | | 105 | | | (17) | | | — | |
| Change in DAC related to net realized gains (losses) | | | | | | — | | | — | | | (44) | |
| Net realized gains (losses) | | | | | | (2) | | | — | | | 142 | |
| Increase (decrease) in pre-tax income | | | | | | $ | 132 | | | $ | 31 | | | $ | (35) | |
* The results for the years ended December 31, 2022 and 2021 have been updated to reflect the adoption of LDTI. No updates have been made to the results for the year ended December 31, 2020 as our effective date for LDTI adoption was January 1, 2021.
The following table presents the increase (decrease) in adjusted pre-tax operating income resulting from the annual update in actuarial assumptions, which occurs in the third quarter of each year, by segment and product line:
| | | | | | | | | | | | | | | | | | | | | | | | |
| | | | Years Ended December 31, |
| (in millions) | | | | | | 2022(a) | | 2021(a) | | 2020 |
| Individual Retirement | | | | | | | | | | |
Fixed annuities | | | | | | $ | — | | | $ | — | | | $ | (77) | |
| Variable annuities | | | | | | — | | | — | | | 13 | |
| Fixed index annuities | | | | | | — | | | — | | | (30) | |
| Total Individual Retirement | | | | | | — | | — | | (94) | |
| Group Retirement | | | | | | — | | | — | | | 68 | |
| Life Insurance | | | | | | 25 | | | 48 | | | (108) | |
| Institutional Markets | | | | | | 4 | | | — | | | 1 | |
Total increase (decrease) in adjusted pre-tax operating income from update of assumptions(b) | | | | | | $ | 29 | | | $ | 48 | | | $ | (133) | |
(a) The results for the years ended December 31, 2022 and 2021 have been updated to reflect the adoption of LDTI. No updates have been made to the results for the year ended December 31, 2020 as our effective date for LDTI adoption was January 1, 2021.
(b) Liabilities ceded to Fortitude Re are reported in Corporate and Other. There was no impact to adjusted pre-tax operating income due to the annual update of actuarial assumptions as these liabilities are 100% ceded.
Adoption of Targeted Improvements to the Accounting for Long-Duration Contracts
In August 2018, the FASB issued an accounting standard update with the objective of making targeted improvements to the existing recognition, measurement, presentation and disclosure requirements for long-duration contracts issued by an insurance entity.
The Company adopted targeted improvements to the accounting for long duration contracts (the "standard" or "LDTI") on January 1, 2023, with a transition date of January 1, 2021 (as described in additional detail below).
The Company adopted the standard using the modified retrospective transition method relating to liabilities for traditional and limited payment contracts and DAC. The Company also adopted the standard in relation to MRBs on a full retrospective basis. As of the January 1, 2021 transition date, the impact of the adoption of the standard was a net decrease to beginning AOCI of $2.3 billion and a net increase to beginning Shareholders’ net investment of $1.2 billion.
The net increase in Shareholders’ net investment resulted from:
•the reclassification of the cumulative effect of non-performance adjustments related to our products in Individual Retirement and Group Retirement operating segments that are currently measured at fair value (e.g., living benefit guarantees associated with variable annuities),
Partially offset by:
•a reduction from the difference between the fair value and carrying value of benefits not previously measured at fair value (e.g., death benefit guarantees associated with variable annuities).
The net decrease in AOCI resulted from:
ITEM 7 | Executive Summary
•the reclassification of the cumulative effect of non-performance adjustments discussed above,
•changes to the discount rate which will most significantly impact our Life Insurance and Institutional Markets segments,
Partially offset by:
•the removal of DAC, Unearned revenue reserves, Sales inducement assets and certain future policyholder benefit balances recorded in AOCI related to changes in unrealized appreciation (depreciation) on investments.
Our Strategic Partnership with Blackstone
We believe that our strategic partnership with Blackstone has the potential to yield significant economic and strategic benefits over time. We believe that Blackstone’s ability to originate attractive and privately sourced, fixed-income oriented assets, will be accretive to our businesses and provide us with an enhanced competitive advantage.
Pursuant to the partnership, we initially transferred management of $50 billion of our existing investment portfolio. Beginning in the fourth quarter of 2022, we transferred an additional $2.1 billion to Blackstone. The amount managed by Blackstone will increase to $92.5 billion by the third quarter of 2027.
As of December 31, 2022, the book value of the assets transferred to Blackstone was $48.9 billion. We expect Blackstone to invest these assets primarily in Blackstone-originated investments across a range of asset classes, including private and structured credit, and commercial and residential real estate securitized and whole loans. Blackstone’s preferred credit and lending strategy is to seek to control all significant components of the underwriting and pricing processes with the goal of facilitating bespoke opportunities with historically strong credit protection and attractive risk-adjusted returns. Blackstone seeks to capture enhanced economics to those available in the traditional fixed income markets by going directly to the lending source.
As described above, Blackstone currently manages a portfolio of private and structured credit assets, commercial and residential real estate securitized and whole loans for Corebridge. We believe Blackstone is well-positioned to add value and drive new originations across credit and real estate asset classes. We continue to manage asset allocation and portfolio-level risk management decisions with respect to any assets managed by Blackstone, ensuring that we maintain a consistent level of oversight across our entire investment portfolio considering our asset-liability matching needs, risk appetite and capital positions.
Beginning in 2022, Blackstone started investing for us primarily in Blackstone-originated investments. The investments underlying the original $50 billion mandate with Blackstone are expected to run-off and be reinvested over time. While over time the benefits of the partnership with Blackstone are expected to become accretive to our businesses, we do not expect the partnership to be immediately accretive to earnings. We expect Blackstone’s enhanced asset origination capabilities will enhance the competitiveness and profitability of our products, particularly in spread products such as fixed annuities. As part of our partnership, Blackstone acquired a 9.9% position in our common stock, aligning its economic interests with our stockholders.
Our Investment Management Agreements with BlackRock
Under the BlackRock Agreements, we have completed the transfer of the management of approximately $82.4 billion in book value of liquid fixed income and certain private placement assets in the aggregate to BlackRock as of December 31, 2022. In addition, liquid fixed income assets associated with Fortitude Re portfolio were separately transferred to BlackRock. The BlackRock Agreements provide us with access to market-leading capabilities, including portfolio management, research and tactical strategies in addition to a larger pool of investment professionals. We believe BlackRock’s scale and fee structure make BlackRock an excellent outsourcing partner for certain asset classes and will allow us to further optimize our investment management operating model while improving overall performance.
See “Business—Investment Management—Our Investment Management Agreements with BlackRock.”
Affordable Housing Sale
On December 15, 2021, Corebridge and Blackstone Real Estate Income Trust (“BREIT”), a long-term, perpetual capital vehicle affiliated with Blackstone, completed the acquisition by BREIT of Corebridge’s interests in a U.S. affordable housing portfolio for $4.9 billion, in an all cash transaction, resulting in a pre-tax gain of $3.0 billion. We recognized $186 million of APTOI related to the U.S. affordable housing portfolio, primarily consisting of net investment income of $309 million offset by interest expense of $107 million for the year ended December 31, 2021.
Fair Value Option Bond Securities
We elect the fair value option on certain bond securities. When the fair value option is elected, the realized and unrealized gains and losses on these securities are reported in net investment income.
ITEM 7 | Executive Summary
The following table shows the net investment income reported on fair value option bond securities:
| | | | | | | | | | | | | | | | | | | | | | | | | | | | |
| | | | | | Years Ended December 31, |
| (in millions) | | | | | | | | | | 2022 | | 2021 | | 2020 |
| Net investment income - excluding Fortitude Re funds withheld assets | | | | | | | | | | $ | (30) | | | $ | 17 | | | $ | 66 | |
| Net investment income - Fortitude Re funds withheld assets | | | | | | | | | | (378) | | | 9 | | | 6 | |
| Total | | | | | | | | | | $ | (408) | | | $ | 26 | | | $ | 72 | |
Tax Impact from Separation
Following the IPO, AIG owns a less than 80% interest in Corebridge, resulting in tax deconsolidation of Corebridge Parent and its subsidiaries from the AIG Consolidated Tax Group. In addition, under applicable law, the AGC Group will not be permitted to join in the filing of a U.S. consolidated federal income tax return with our other subsidiaries (collectively, the “Non-Life Group”) for the five-year waiting period. Instead, the AGC Group is expected to file separately as members of the AGC consolidated U.S. federal income tax return during the five-year waiting period. Upon the tax deconsolidation from the AIG Consolidated Tax Group, absent any prudent and feasible tax planning strategies, our net operating losses and foreign tax credit carryforwards generated by the non-life insurance companies will more likely than not expire unutilized. Additionally, after assessing the relative weight of all positive and negative evidence, we concluded that at the time of tax deconsolidation a valuation allowance of $145 million related to the tax attribute carryforwards and other deferred tax assets for the Non-Life Group was necessary. As a result of prior year tax return adjustments, we released $9 million of valuation allowance recorded due to tax deconsolidation. Subsequently, we established an additional valuation allowance of $15 million for the Non-Life Group based on post separation results. Accordingly, an additional valuation allowance of $133 million was established in 2022 with respect to our deferred tax assets. Following the five-year waiting period, the AGC Group is expected to join our U.S. consolidated federal income tax return. Principles similar to the foregoing may apply to state and local income tax liabilities in jurisdictions that conform to federal rules.
Sale of Certain Assets of Our Retail Mutual Funds Business
On February 8, 2021, we announced the execution of a definitive agreement with Touchstone Investments, Inc. (“Touchstone”), an indirect wholly owned subsidiary of Western & Southern Financial Group, to sell certain assets of our retail mutual funds business. This sale consisted of the reorganization of twelve of the retail mutual funds managed by our subsidiary SunAmerica Asset Management LLC (“SAAMCo”) into certain Touchstone funds and was subject to certain conditions, including approval of the fund reorganizations by the retail mutual fund boards of directors/trustees and fund shareholders. The transaction closed on July 16, 2021, at which time we received initial proceeds and recognized a gain on the sale of $103 million. Concurrently, the twelve retail mutual funds managed by SAAMCo, with $6.8 billion in assets, were reorganized into Touchstone funds. Additional consideration has been and may be earned over a three-year period based on asset levels in certain reorganized funds. Six retail mutual funds managed by SAAMCo and not included in the transaction were liquidated. We continue to retain our fund management platform and capabilities dedicated to our variable annuity insurance products.
Separation Costs
In connection with our separation from AIG, we have incurred and expect to continue to incur one-time and recurring expenses. We estimate that our one-time expenses will be between approximately $350 million and $450 million on a pre-tax basis from January 1, 2022. As of December 31, 2022 we have incurred approximately $180 million of one-time expenses. These expenses primarily relate to replicating and replacing functions, systems and infrastructure provided by AIG; rebranding; and accounting advisory, consulting and actuarial fees. In addition to these separation costs, we expect to incur costs related to the evolution of our investments organization to reflect our strategic partnerships with key external managers, our implementation of BlackRock’s “Aladdin” investment management technology platform and our expected reduction in fees for asset management services. We expect to incur the majority of these costs by December 31, 2023.
In addition, as part of Corebridge Forward, we aim to achieve an annual run rate expense reduction of approximately $400 million on a pre-tax basis within two to three years of the IPO and have acted upon or contracted approximately $232 million of exit run rate savings for the year ended December 31, 2022, and expect the majority of the reduction to be achieved within 24 months of the IPO. To achieve this goal, Corebridge Forward is expected to have a one-time expense of approximately $300 million on a pre-tax basis and as of December 31, 2022 the cost to achieve has been approximately $84 million.
COREBRIDGE’S MACROECONOMIC, INDUSTRY AND REGULATORY TRENDS
Our business is affected by industry and economic factors such as interest rates; geopolitical stability (including the armed conflict between Ukraine and Russia and corresponding sanctions imposed by the United States and other countries); credit and equity market conditions; currency exchange rates; regulation; tax policy; competition; and general economic, market and political conditions. We continued to operate under challenging market conditions in 2022 and 2021 characterized by factors such as the impact of COVID-19 and the related governmental and societal responses, interest rate volatility, inflationary pressures, an uneven
ITEM 7 | Executive Summary
global economic recovery and global trade tensions. Responses by central banks and monetary authorities with respect to inflation, growth concerns and other macroeconomic factors have also affected global exchange rates and volatility.
Below is a discussion of certain industry and economic factors impacting our business:
Impact of COVID-19
We are continually assessing the impact on our business, operations and investments of COVID-19 and the resulting ongoing economic and societal disruption. These impacts initially included a global economic contraction, disruptions in financial markets, increased market volatility and declines in certain equity and other asset prices that had negative effects on our investments, our access to liquidity, our ability to generate new sales and the costs associated with claims. Further, significant legislative and regulatory activity has occurred at both the U.S. federal and state levels, as well as globally. We cannot predict what form future legal and regulatory responses to concerns about COVID-19 and related public health issues will take, or how such responses will impact our business.
The most significant impacts relating to COVID-19 have been the impact of interest rate, credit spreads and equity market levels on spread and fee income, deferred acquisition cost amortization and increased mortality. We are actively monitoring the mortality rates and the potential direct and indirect impacts that COVID-19 may have across our businesses. The impact on the results for the year ended December 31, 2022 with respect to COVID-19 is primarily, but not limited to, COVID-19-related mortality. Our estimated reduction in pre-tax income and APTOI impact in the United States and UK from COVID-19 was $85 million, $151 million and $259 million for the years ended December 31, 2022, 2021 and 2020, respectively. The last two quarters saw the fewest national fatalities since the start of the pandemic. Actual data related to cause of death is not always available for all claims paid, and such cause of death data does not always capture the existence of comorbid conditions. As a result, COVID-19 pre-tax income and APTOI impacts are estimates of the total impact of COVID-19 related claim activity based on available data. The regulatory approach to the pandemic and impact on the insurance industry is continuing to evolve and its ultimate impact remains uncertain. Prospectively in the United States, we estimate a reduction in pre-tax income and APTOI of $30 million to $40 million for every 100,000 population deaths.
We have a diverse investment portfolio with material exposures to various forms of credit risk. To date, there has been minimal impact on the value of the portfolio. At this point in time, uncertainty surrounding the duration and severity of the COVID-19 pandemic makes the long-term financial impact difficult to quantify.
COVID-19 continued to have an impact in 2022. Circumstances resulting from the COVID-19 pandemic, in addition to an increase in claims, may also impact utilization of benefits, lapses or surrenders of policies and payments of insurance premiums, all of which have impacted and could further impact the revenues and expenses associated with our products.
See “Risk Factors—Risks Relating to Market Conditions—We are exposed to risk from the COVID-19 pandemic” in the 2022 Form 10-K.
Demographics
We expect our target market of individuals planning for retirement to continue to grow with the size of the U.S. population age 65 and over that is expected to increase by approximately 30% by 2030 from 2020. In addition, we believe that reduced employer-paid retirement benefits will drive an increasing need for our individual retirement solutions. Further, consumers in the United States continue to prefer purchasing life insurance and retirement products through an agent or advisor, which positions us favorably given our broad distribution platform and in-house advisory capabilities. We continue to seek opportunities to develop new products and adapt our existing products to the growing needs of individuals to plan, save for and achieve secure financial futures.
Equity Markets
Our financial results are impacted by the performance of equity markets, which impacts the performance of our alternative investment portfolio, fee income, MRBs and embedded derivatives. For instance, in our variable annuity separate accounts, mutual fund assets and brokerage and advisory assets, we generally earn fee income based on the account value, which fluctuates with the equity markets as a significant amount of these assets are invested in equity funds. The impact of equity market returns, both increases and decreases, is reflected in our results due to the impact on the account value and the fair values of equity-exposed securities in our investment portfolio.
Our hedging costs could also be significantly impacted by changes in the level of equity markets as rebalancing and option costs are tied to the equity market volatility, and we may be required to post additional collateral when equity markets are higher. These hedging costs are mostly offset by our rider fees that are tied to the level of the VIX. As rebalancing and option costs increase or decrease, the rider fees will increase or decrease partially offsetting the hedging costs incurred.
See “Risk Factors—Risks Relating to Market Conditions—We are exposed to risk from equity market declines or volatility” in the 2022 Form 10-K.
ITEM 7 | Executive Summary
Market and other economic factors may result in increased credit impairments, downgrades and losses across single or numerous asset classes due to lower collateral values or deteriorating cash flow and profitability by borrowers could lead to higher defaults on our investment portfolio, especially in geographic, industry or investment sectors where we have higher concentrations of exposure, such as real estate related borrowings. These factors can also cause widening of credit spreads which could reduce investment asset valuations, decrease fee income and increase statutory capital requirements, as well as reduce the availability of investments that are attractive from a risk-adjusted perspective.
See “Risk Factors—Our business is highly dependent on economic and capital market conditions” in the 2022 Form 10-K.
Alternative investments include private equity funds which are generally reported on a one-quarter lag. Accordingly, changes in valuations driven by equity market conditions during the fourth quarter of 2022 may impact the private equity investments in the alternative investments portfolio in the first quarter of 2023.
Impact of Changes in the Interest Rate Environment
Key U.S. benchmark rates continued to rise during 2022 as markets react to inflation measures, geopolitical risk and the Board of Governors of the Federal Reserve System raising short-term interest rates for the first time since 2018. A rising interest rate environment benefits our spread income as we reinvest cash flows from existing business at higher rates and should have a positive impact on sales of spread-based products resulting in an increase in our base net investment spreads.
As of December 31, 2022, increases in key rates have improved yields on new investments, which are now closer to the yield on maturities and redemptions (“run-off yield”) that we are experiencing on our existing portfolios and in some instances are higher than the run-off yield. Furthermore, the impact of interest rate increases is further reflected in our results as these rate increases have also reduced the value of fixed income assets that are held in the variable annuity separate accounts and brokerage and advisory assets, and accordingly, have adversely impacted the fees that are charged on these accounts. We actively manage our exposure to the interest rate environment through portfolio selection and asset-liability management, including spread management strategies for our investment-oriented products and economic hedging of interest rate risk from guarantee features in our variable annuities, but we may not be able to fully mitigate our interest rate risk by matching exposure of our assets relative to our liabilities.
Fluctuations in interest rates may result in changes to certain statutory reserve or capital requirements that are based on formulas or models that consider interest rates or prescribed interest rates, such as cash flow testing. Rising interest rates can have a mixed impact on statutory financials due to higher surrender activity, particularly for fixed annuities, offset by potentially lower reserves for other products under various statutory reserving frameworks.
Regulatory Environment
The insurance and financial services industries are generally subject to close regulatory scrutiny and supervision. Our operations are subject to regulation by a number of different types of domestic and international regulatory authorities, including securities, derivatives and investment advisory regulators. Our insurance subsidiaries are subject to regulation and supervision by the states and jurisdictions in which they do business.
We expect that the domestic and international regulations applicable to us and our regulated entities will continue to evolve for the foreseeable future.
For information regarding our regulation and supervision by different regulatory authorities in the United States and abroad, see “Business—Regulation.”
Annuity Sales and Surrenders
The rising rate environment and our partnership with Blackstone have provided a strong tailwind for fixed annuity sales with sales in the three- to five-year products significantly increasing, however, higher rates has also resulted in an increase in surrenders. Continued rising interest rates could create the potential for increased sales but may also drive higher surrenders relative to what we have already experienced. Fixed annuities have surrender charge periods, generally in the three-to-seven-year range. Fixed index annuities have surrender charge periods, generally in the five-to-ten-year range, and within our Group Retirement segment, certain of our fixed investment options are subject to other withdrawal restrictions, which may help mitigate increased early surrenders in a rising rate environment. In addition, older contracts that have higher minimum interest rates and continue to be attractive to contract holders have driven better than expected persistency in fixed annuities, although the liabilities for such contracts have continued to decrease over time in amount and as a percentage of the total annuity portfolio. We closely monitor surrenders of fixed annuities as contracts with lower minimum interest rates come out of the surrender charge period.
Reinvestment and Spread Management
We actively monitor fixed income markets, including the level of interest rates, credit spreads and the shape of the yield curve. We also frequently review our interest rate assumptions and actively manage the crediting rates used for new and in-force business. Business strategies continue to evolve and we attempt to maintain profitability of the overall business in light of the interest rate
ITEM 7 | Executive Summary
environment. A rising interest rate environment results in improved yields on new investments and improves margins for our business while also making certain products, such as fixed annuities, more attractive to potential customers. However, the rising rate environment has resulted in lower values on general and separate account assets, mutual fund assets and brokerage and advisory assets that hold investments in fixed income assets.
For additional information on our investment and asset-liability management strategies, see “Investments.”
For investment-oriented products, including universal life insurance, and variable, fixed and fixed index annuities, in each of our operating and reportable segments, our spread management strategies include disciplined pricing and product design for new business, modifying or limiting the sale of products that do not achieve targeted spreads, using asset-liability management to match assets to liabilities to the extent practicable and actively managing crediting rates to help mitigate some of the pressure on investment spreads. Renewal crediting rate management is done under contractual provisions that were designed to allow crediting rates to be reset at pre-established intervals in accordance with state and federal laws and subject to minimum crediting rate guarantees. We expect to continue to adjust crediting rates on in-force business, as appropriate, to be responsive to a rising rate environment. As interest rates rise, we may need to raise crediting rates on in-force business for competitive and other reasons, potentially offsetting a portion of the additional investment income resulting from investing in a higher interest rate environment.
Of the aggregate fixed account values of our Individual Retirement and Group Retirement annuity products, 64% and 68% were crediting at the contractual minimum guaranteed interest rate at December 31, 2022 and December 31, 2021, respectively. The percentages of fixed account values of our annuity products that are currently crediting at rates above 1% were 55% and 58% at December 31, 2022 and December 31, 2021, respectively. In the universal life insurance products in our Life Insurance business, 62% and 67% of the account values were crediting at the contractual minimum guaranteed interest rate at December 31, 2022 and December 31, 2021, respectively. These businesses continue to focus on pricing discipline and strategies to manage the minimum guaranteed interest crediting rates offered on new sales in the context of regulatory requirements and competitive positioning.
For additional information on our investment and asset-liability management strategies, see Note 5 to our audited annual consolidated financial statements.
Impact of Currency Volatility
In our life insurance business, we have international locations in the UK and Ireland, whose local currency is the British pound and Euro, respectively. Trends in revenue and expense reported in U.S. dollars can differ significantly from those measured in original currencies. While currency volatility affects financial statement line item components of income and expenses, since our international businesses transact in local currencies, the impact is significantly mitigated.
These currencies may continue to fluctuate, in either direction, and such fluctuations may affect premiums, fees and expenses reported in U.S. dollars, as well as financial statement line item comparability.
Use of Non-GAAP Financial Measures and Key Operating Metrics NON-GAAP FINANCIAL MEASURES
Throughout this MD&A, we present our financial condition and results of operations in the way we believe will be most meaningful and representative of our business results. Some of the measurements we use are “non-GAAP financial measures” under SEC rules and regulations. We believe presentation of these non-GAAP financial measures allows for a deeper understanding of the profitability drivers of our business, results of operations, financial condition and liquidity. These measures should be considered supplementary to our results of operations and financial condition that are presented in accordance with GAAP and should not be viewed as a substitute for GAAP measures. The non-GAAP financial measures we present may not be comparable to similarly named measures reported by other companies. Reconciliations of non-GAAP financial measures for future periods are not provided as we do not currently have sufficient data to accurately estimate the variables and individual adjustments for such reconciliations.
Adjusted revenues exclude Net realized gains (losses) except for gains (losses) related to the disposition of real estate investments, income from non-operating litigation settlements (included in Other income for GAAP purposes) and changes in fair value of securities used to hedge guaranteed living benefits (included in Net investment income for GAAP purposes).
ITEM 7 | Use of Non-GAAP Financial Measures and Key Operating Metrics
The following table presents a reconciliation of Total revenues to Adjusted revenues:
| | | | | | | | | | | | | | | | | | | | | | | | | | | | | | |
| | | | | | Years Ended December 31, |
| (in millions) | | | | | | | | | | 2022 | | 2021 | | 2020 |
Total revenues(a) | | | | | | | | | | $ | 24,697 | | | $ | 23,257 | | | $ | 15,062 | |
| Fortitude Re related items: | | | | | | | | | | | | | | |
| Net investment income on Fortitude Re funds withheld assets | | | | | | | | | | (891) | | | (1,775) | | | (1,427) | |
| Net realized (gains) losses on Fortitude Re funds withheld assets | | | | | | | | | | 397 | | | (924) | | | (1,002) | |
| Net realized (gains) losses on Fortitude Re funds withheld embedded derivatives | | | | | | | | | | (6,347) | | | 687 | | | 3,978 | |
| Subtotal - Fortitude Re related items | | | | | | | | | | (6,841) | | | (2,012) | | | 1,549 | |
| Other non-Fortitude Re reconciling items: | | | | | | | | | | | | | | |
| Changes in fair value of securities used to hedge guaranteed living benefits | | | | | | | | | | (56) | | | (60) | | | (56) | |
| Non-operating litigation reserves and settlements | | | | | | | | | | (25) | | | — | | | (12) | |
| Other (income) - net | | | | | | | | | | (51) | | | (37) | | | (53) | |
Net realized (gains) losses(a)(b) | | | | | | | | | | 231 | | | (687) | | | 916 | |
| Subtotal - Other non-Fortitude Re reconciling items | | | | | | | | | | 99 | | | (784) | | | 795 | |
| Total adjustments | | | | | | | | | | (6,742) | | | (2,796) | | | 2,344 | |
| Adjusted revenues | | | | | | | | | | $ | 17,955 | | | $ | 20,461 | | | $ | 17,406 | |
(a) The results for the years ended December 31, 2022 and 2021 have been updated to reflect the adoption of LDTI. No updates have been made to the results for the year ended December 31, 2020 as our effective date for LDTI adoption was January 1, 2021.
(b) Represents all net realized gains and losses except gains (losses) related to the disposition of real estate investments and earned income (periodic settlements and changes in settlement accruals) on derivative instruments used for non-qualifying (economic) hedging or for asset replication. Earned income for non-qualifying (economic) hedging or for asset replication is reclassified from net realized gains and losses to specific APTOI line items (e.g., net investment income and interest credited to policyholder account balances) based on the economic risk being hedged.
Adjusted pre-tax operating income (“APTOI”) is derived by excluding the items set forth below from income from operations before income tax. These items generally fall into one or more of the following broad categories: legacy matters having no relevance to our current businesses or operating performance; adjustments to enhance transparency to the underlying economics of transactions; and recording adjustments to APTOI that we believe to be common in our industry. We believe the adjustments to pre-tax income are useful for gaining an understanding of our overall results of operations.
APTOI excludes the impact of the following items:
FORTITUDE RELATED ADJUSTMENTS:
The modco reinsurance agreements with Fortitude Re transfer the economics of the invested assets supporting the reinsurance agreements to Fortitude Re. Accordingly, the net investment income on Fortitude Re funds withheld assets and the net realized gains (losses) on Fortitude Re funds withheld assets are excluded from APTOI. Similarly, changes in the Fortitude Re funds withheld embedded derivative are also excluded from APTOI.
As a result of entering into the reinsurance agreements with Fortitude Re we recorded a loss which was primarily attributed to the write-off of DAC, VOBA and deferred cost of reinsurance assets. The total loss and the ongoing results associated with the reinsurance agreement with Fortitude Re have been excluded from APTOI as these are not indicative of our ongoing business operations.
INVESTMENT RELATED ADJUSTMENTS:
APTOI excludes “Net realized gains (losses)”, including changes in the allowance for credit losses on available for sale securities and loans, as well as gains or losses from sales of securities, except for gains (losses) related to the disposition of real estate investments. Net realized gains (losses), except for gains (losses) related to the disposition of real estate investments, are excluded as the timing of sales on invested assets or changes in allowances depend largely on market credit cycles and can vary considerably across periods. In addition, changes in interest rates may create opportunistic scenarios to buy or sell invested assets. Our derivative results, including those used to economically hedge insurance liabilities or are recognized as embedded derivatives at fair value are also included in Net realized gains (losses) and are similarly excluded from APTOI except earned income (periodic settlements and changes in settlement accruals) on derivative instruments used for non-qualifying (economic) hedges or for asset replication. Earned income on such economic hedges is reclassified from Net realized gains and losses to specific APTOI line items based on the economic risk being hedged (e.g., Net investment income and Interest credited to policyholder account balances).
Prior to the adoption of LDTI effective January 1, 2021, our investment-oriented contracts, such as universal life insurance, and fixed, fixed index and variable annuities, were also impacted by net realized gains (losses), and these secondary impacts were also excluded from APTOI. Specifically, the changes in benefit reserves and DAC, VOBA and DSI assets related to net realized gains (losses) were excluded from APTOI.
ITEM 7 | Use of Non-GAAP Financial Measures and Key Operating Metrics
VARIABLE, FIXED INDEX ANNUITIES AND INDEX UNIVERSAL LIFE INSURANCE PRODUCTS ADJUSTMENTS:
Prior to the adoption of LDTI effective January 1, 2021, certain of our variable annuity contracts and fixed index annuity contracts contained GMWBs and were accounted for as embedded derivatives. Fixed index annuity contracts contain indexed interest credits which are accounted for as embedded derivatives, and our index universal life products also contain embedded derivatives. Changes in the fair value of these embedded derivatives, including rider fees attributed to the embedded derivatives are recorded through "Net realized gains (losses)" and are excluded from APTOI.
Changes in the fair value of securities used to hedge these guaranteed living benefits are excluded from APTOI.
MARKET RISK BENEFIT ADJUSTMENTS:
Subsequent to the adoption of LDTI effective January 1, 2021, certain of our variable annuity, fixed annuity and fixed index annuity contracts contain GMWBs and/or GMDBs which are accounted for as MRBs. Changes in the fair value of these MRBs (excluding changes related to our own credit risk), including certain rider fees attributed to the MRBs, along with changes in the fair value of derivatives used to hedge MRBs are recorded through “Change in the fair value of MRBs, net” and are excluded from APTOI.
Changes in the fair value of securities used to economically hedge MRBs are excluded from APTOI.
OTHER ADJUSTMENTS:
Other adjustments represent all other adjustments that are excluded from APTOI and includes the net pre-tax operating income (losses) from noncontrolling interests related to consolidated investment entities. The excluded adjustments include, as applicable:
•restructuring and other costs related to initiatives designed to reduce operating expenses, improve efficiency and simplify our organization;
•non-recurring costs associated with the implementation of non-ordinary course legal or regulatory changes or changes to accounting principles;
•separation costs;
•non-operating litigation reserves and settlements;
•loss (gain) on extinguishment of debt;
•losses from the impairment of goodwill; and
•income and loss from divested or run-off business.
Adjusted after-tax operating income attributable to our common shareholders (“Adjusted After-tax Operating Income” or “AATOI”) is derived by excluding the tax effected APTOI adjustments described above, as well as the following tax items from net income attributable to us:
•changes in uncertain tax positions and other tax items related to legacy matters having no relevance to our current businesses or operating performance; and
•deferred income tax valuation allowance releases and charges.
ITEM 7 | Use of Non-GAAP Financial Measures and Key Operating Metrics
The following tables present a reconciliation of pre-tax income (loss)/net income (loss) attributable to Corebridge to adjusted pre-tax operating income (loss)/adjusted after-tax operating income (loss) attributable to Corebridge:
| | | | | | | | | | | | | | | | | | | | | | | | | | | | | | | | | | | | | | | | | | | | | | | | | | | | | | | | | |
| Years Ended December 31, | | 2022 | | 2021 | | 2020 | | | | |
| (in millions) | | Pre-tax | Total Tax
(Benefit)
Charge | Non-
controlling
Interests | After Tax | | Pre-tax | Total Tax
(Benefit)
Charge | Non-
controlling
Interests | After Tax | | Pre-tax | Total Tax
(Benefit)
Charge | Non-
controlling
Interests | After Tax | | | | | | | | | | |
Pre-tax income/net income, including noncontrolling interest(a) | | $ | 10,491 | $ | 2,012 | $ | — | $ | 8,479 | | $ | 11,254 | $ | 2,082 | $ | — | $ | 9,172 | | $ | 851 | $ | (15) | $ | — | $ | 866 | | | | | | | | | | |
| Noncontrolling interests | | — | — | (320) | (320) | | — | — | (929) | (929) | | — | — | (224) | (224) | | | | | | | | | | |
Pre-tax income/net income attributable to Corebridge(a) | | 10,491 | 2,012 | (320) | 8,159 | | 11,254 | | 2,082 | | (929) | 8,243 | | | 851 | | (15) | | (224) | 642 | | | | | | | | | | | |
| Fortitude Re related items | | | | | | | | | | | | | | | | | | | | | | | | | |
| Net investment income on Fortitude Re funds withheld assets | | (891) | (187) | — | (704) | | (1,775) | (373) | — | (1,402) | | (1,427) | | (300) | | — | | (1,127) | | | | | | | | | | |
| Net realized (gains) losses on Fortitude Re funds withheld assets | | 397 | 83 | — | 314 | | (924) | (194) | — | (730) | | (1,002) | | (210) | | — | | (792) | | | | | | | | | | |
| Net realized losses on Fortitude Re funds withheld embedded derivative | | (6,347) | (1,370) | — | (4,977) | | 687 | 144 | — | 543 | | 3,978 | | 835 | | — | | 3,143 | | | | | | | | | | |
| Net realized losses on Fortitude transactions | | — | — | — | — | | (26) | (5) | — | (21) | | 91 | | 19 | | | 72 | | | | | | | | | | |
| Subtotal Fortitude Re related items | | (6,841) | (1,474) | — | (5,367) | | (2,038) | (428) | — | (1,610) | | 1,640 | 344 | — | 1,296 | | | | | | | | | | |
| Other Reconciling Items: | | | | | | | | | | | | | | | | | | | | | | | | | |
| Changes in uncertain tax positions and other tax adjustments | | — | 95 | — | (95) | | — | 174 | — | (174) | | — | 119 | — | (119) | | | | | | | | | | |
| Deferred income tax valuation allowance (releases) charges | | — | (157) | — | 157 | | — | (26) | — | 26 | | — | — | — | — | | | | | | | | | | |
Changes in fair value of market risk benefits, net(a) | | (958) | (199) | — | (759) | | (447) | (95) | — | (352) | | — | — | — | — | | | | | | | | | | |
| Changes in fair value of securities used to hedge guaranteed living benefits | | (30) | (6) | — | (24) | | (56) | (12) | — | (44) | | (44) | (9) | — | (35) | | | | | | | | | | |
Changes in benefit reserves, DAC, VOBA and DSI related to net realized gains (losses)(a) | | (15) | (3) | — | (12) | | 15 | 3 | — | 12 | | (60) | (13) | — | (47) | | | | | | | | | | |
| Loss on extinguishment of debt | | — | — | — | — | | 219 | 46 | — | 173 | | 10 | 2 | — | 8 | | | | | | | | | | |
Net realized (gains) losses(a)(b) | | 211 | 44 | — | 167 | | (711) | (149) | 68 | (494) | | 895 | 190 | 30 | 735 | | | | | | | | | | |
| Non-operating litigation reserves and settlements | | (25) | (5) | — | (20) | | — | — | — | — | | (12) | (3) | — | (9) | | | | | | | | | | |
| Separation costs | | 180 | 142 | — | 38 | | — | — | — | — | | — | — | — | — | | | | | | | | | | |
| Restructuring and other costs | | 147 | 31 | — | 116 | | 44 | 9 | — | 35 | | 63 | 13 | — | 50 | | | | | | | | | | |
| Non-recurring costs related to regulatory or accounting changes | | 12 | 3 | — | 9 | | 31 | 7 | — | 24 | | 45 | 10 | — | 35 | | | | | | | | | | |
| Net (gain) loss on divestiture | | 1 | — | — | 1 | | (3,081) | (710) | — | (2,371) | | — | — | — | — | | | | | | | | | | |
| Pension expense - non operating | | 1 | — | — | 1 | | 12 | 3 | — | 9 | | — | — | — | — | | | | | | | | | | |
| Noncontrolling interests | | (320) | — | 320 | — | | (861) | — | 861 | — | | (194) | — | 194 | — | | | | | | | | | | |
| Subtotal: Other non-Fortitude Re reconciling items | | (796) | (55) | 320 | (421) | | (4,835) | (750) | 929 | (3,156) | | 703 | 309 | 224 | 618 | | | | | | | | | | |
| Total adjustments | | (7,637) | (1,529) | 320 | (5,788) | | (6,873) | (1,178) | 929 | (4,766) | | 2,343 | 653 | 224 | 1,914 | | | | | | | | | | |
| Adjusted pre-tax operating income(loss)/Adjusted after-tax operating income (loss) attributable to Corebridge common shareholders | | $ | 2,854 | $ | 483 | $ | — | $ | 2,371 | | $ | 4,381 | | $ | 904 | | $ | — | | $ | 3,477 | | | $ | 3,194 | | $ | 638 | | $ | — | | $ | 2,556 | | | | | | | | | | | |
(a) The results for the years ended December 31, 2022 and 2021 have been updated to reflect the adoption of LDTI. No updates have been made to the results for the year ended December 31, 2020 as our effective date for LDTI adoption was January 1, 2021.
(b) Includes all net realized gains and losses except earned income (periodic settlements and changes in settlement accruals) on derivative instruments used for non-qualifying (economic) hedging or for asset replication. Additionally, gains (losses) related to the disposition of real estate investments are also excluded from this adjustment.
ITEM 7 | Use of Non-GAAP Financial Measures and Key Operating Metrics
The following table presents a reconciliation of the GAAP tax rate to the adjusted tax rate:
| | | | | | | | | | | | | | | | | | | | | | | | | | | | | | | | | | | | | | | | | | | | | | | |
| Years Ended December 31, | GAAP | | Non-GAAP
Adjustments | | Adjusted |
| Pre-tax | | | | | | Pre-tax | | | | | | | | |
| (in millions) | Income | | Tax | | Rate | | Adjustments | | Tax | | APTOI | | Tax | | Rate |
| 2022 | | | | | | | | | | | | | | | |
| U.S. federal income tax at statutory rate* | $ | 10,491 | | | $ | 2,203 | | | 21.0 | % | | $ | (7,637) | | | $ | (1,604) | | | $ | 2,854 | | | $ | 599 | | | 21.0 | % |
| Rate Adjustments | | | | | | | | | | | | | | | |
| Uncertain Tax Positions | — | | | 2 | | | 0.0 | | | — | | | — | | | — | | | 2 | | | 0.1 | |
| Reclassifications from accumulated other comprehensive income | — | | | (84) | | | (0.7) | | | — | | | 84 | | | — | | | — | | | 0.0 | |
| Noncontrolling Interest | — | | | (67) | | | (0.6) | | | — | | | 67 | | | — | | | — | | | 0.0 | |
| Dividends received deduction | | | (36) | | | (0.3) | | | — | | | — | | | — | | | (36) | | | (1.3) | |
| Tax deconsolidation and separation costs | | | (104) | | | (1.0) | | | — | | | 104 | | | — | | | — | | | 0.0 | |
| State and local income taxes* | — | | | 24 | | | 0.2 | | | — | | | (35) | | | — | | | (11) | | | (0.4) | |
| Other | — | | | (29) | | | (0.3) | | | — | | | 12 | | | — | | | (17) | | | (0.6) | |
| Adjustments to prior year tax returns | — | | | (48) | | | (0.5) | | | — | | | — | | | — | | | (48) | | | (1.7) | |
| Share based compensation payments excess tax deduction | — | | | (6) | | | (0.1) | | | — | | | — | | | — | | | (6) | | | (0.2) | |
| Valuation allowance | — | | | 157 | | | 1.5 | | | — | | | (157) | | | — | | | — | | | 0.0 | |
| Amount Attributable to Corebridge | $ | 10,491 | | | $ | 2,012 | | | 19.2 | % | | $ | (7,637) | | | $ | (1,529) | | | $ | 2,854 | | | $ | 483 | | | 16.9 | % |
| 2021 | | | | | | | | | | | | | | | |
| U.S. federal income tax at statutory rate* | $ | 11,254 | | | $ | 2,363 | | | 21.0 | % | | $ | (6,873) | | | $ | (1,443) | | | $ | 4,381 | | | $ | 920 | | | 21.0 | % |
| Rate Adjustments | | | | | | | | | | | | | | | |
| Uncertain Tax Positions | — | | | (69) | | | (0.6) | | | — | | | 66 | | | — | | | (3) | | | (0.1) | |
| Reclassifications from accumulated other comprehensive income | — | | | (108) | | | (1.0) | | | — | | | 108 | | | — | | | — | | | 0.0 | |
| Noncontrolling Interest | — | | | (197) | | | (1.7) | | | — | | | 181 | | | — | | | (16) | | | (0.4) | |
| Dividends received deduction | — | | | (37) | | | (0.3) | | | — | | | — | | | — | | | (37) | | | (0.8) | |
| State and local income taxes* | — | | | 105 | | | 0.9 | | | — | | | (55) | | | — | | | 50 | | | 1.1 | |
| Other | — | | | (2) | | | 0.0 | | | — | | | (13) | | | — | | | (15) | | | (0.3) | |
| Adjustments to prior year tax returns | — | | | (3) | | | 0.0 | | | — | | | 4 | | | — | | | 1 | | | 0.0 | |
| Share based compensation payments excess tax deduction | — | | | 4 | | | 0.0 | | | — | | | — | | | — | | | 4 | | | 0.1 | |
| Valuation allowance | — | | | 26 | | | 0.2 | | | — | | | (26) | | | — | | | — | | | — | |
| Amount Attributable to Corebridge | $ | 11,254 | | | $ | 2,082 | | | 18.5 | % | | $ | (6,873) | | | $ | (1,178) | | | $ | 4,381 | | | $ | 904 | | | 20.6 | % |
| 2020 | | | | | | | | | | | | | | | |
| U.S. federal income tax at statutory rate | $ | 851 | | | $ | 178 | | | 21.0 | % | | $ | 2,343 | | | $ | 493 | | | $ | 3,194 | | | $ | 671 | | | 21.0 | % |
| Rate Adjustments: | | | | | | | | | | | | | | | |
| Uncertain Tax Positions | — | | | 17 | | | 2.0 | | | — | | | 4 | | | — | | | 21 | | | 0.7 | |
| Reclassifications from accumulated other comprehensive income | — | | | (100) | | | (11.8) | | | — | | | 100 | | | — | | | — | | | 0.0 | |
| Noncontrolling Interest | — | | | (47) | | | (5.5) | | | — | | | 41 | | | — | | | (6) | | | (0.2) | |
| Dividends received deduction | — | | | (39) | | | (4.6) | | | — | | | — | | | — | | | (39) | | | (1.2) | |
| State and local income taxes | — | | | (4) | | | (0.5) | | | — | | | — | | | — | | | (4) | | | (0.1) | |
| Other | — | | | 1 | | | 0.1 | | | — | | | (3) | | | — | | | (2) | | | (0.1) | |
| Adjustments to prior year tax returns | — | | | (27) | | | (3.2) | | | — | | | 14 | | | — | | | (13) | | | (0.4) | |
| Share based compensation payments excess tax deduction | — | | | 10 | | | 1.2 | | | — | | | — | | | — | | | 10 | | | 0.3 | |
| Valuation allowance | — | | | (4) | | | (0.5) | | | — | | | 4 | | | — | | | — | | | — | |
| Amount Attributable to Corebridge | $ | 851 | | | $ | (15) | | | (1.8) | % | | $ | 2,343 | | | $ | 653 | | | $ | 3,194 | | | $ | 638 | | | 20.0 | % |
* The results for the years ended December 31, 2022 and 2021 have been updated to reflect the adoption of LDTI. No updates have been made to the results for the year ended December 31, 2020 as our effective date for LDTI adoption was January 1, 2021.
Adjusted Book Value is derived by excluding AOCI, adjusted for the cumulative unrealized gains and losses related to Fortitude Re’s funds withheld assets. We believe this measure is useful to investors as it eliminates the asymmetrical impact resulting from changes in fair value of our available-for-sale securities portfolio for which there is largely no offsetting impact for certain related insurance liabilities that are not recorded at fair value with changes in fair value recorded through OCI. It also eliminates asymmetrical impacts where our own credit non-performance risk is recorded through OCI. In addition, we adjust for the cumulative unrealized gains and losses related to Fortitude Re’s funds withheld assets since these fair value movements are economically transferred to Fortitude Re.
ITEM 7 | Use of Non-GAAP Financial Measures and Key Operating Metrics
The following table presents the reconciliation of Book value per common share to Adjusted book value per common share:
| | | | | | | | | | | | | | | | | | | | |
| | December 31, |
| (in millions, except per common share data) | | 2022 | | 2021 | | 2020 |
| Total Corebridge shareholders' equity (a)* | | $ | 9,380 | | | $ | 27,230 | | | $ | 37,232 | |
| Less: Accumulated other comprehensive income* | | (16,863) | | | 8,233 | | | 14,653 | |
| Add: Cumulative unrealized gains and losses related to Fortitude Re funds withheld assets | | (2,806) | | | 2,629 | | | 4,225 | |
| Adjusted Book Value (b) | | $ | 23,437 | | | $ | 21,626 | | | $ | 26,804 | |
| | | | | | |
| Total common shares outstanding (c) | | 645.0 | | | 645.0 | | | 645.0 | |
| | | | | | |
| Book value per common share (a/c)* | | $ | 14.54 | | | $ | 42.22 | | | $ | 57.72 | |
| Adjusted book value per common share (b/c)* | | $ | 36.34 | | | $ | 33.53 | | | $ | 41.56 | |
| | | | | | |
* The results for the years ended December 31, 2022 and 2021 have been updated to reflect the adoption of LDTI. No updates have been made to the results for the year ended December 31, 2020 as our effective date for LDTI adoption was January 1, 2021.
Adjusted Return on Average Equity (“Adjusted ROAE”) is derived by dividing AATOI by average Adjusted Book Value and is used by management to evaluate our recurring profitability and evaluate trends in our business. We believe this measure is useful to investors as it eliminates the asymmetrical impact resulting from changes in fair value of our available-for-sale securities portfolio for which there is largely no offsetting impact for certain related insurance liabilities that are not recorded at fair value with changes in fair value recorded through OCI. It also eliminates asymmetrical impacts where our own credit non-performance risk is recorded through OCI. In addition, we adjust for the cumulative unrealized gains and losses related to Fortitude Re’s funds withheld assets since these fair value movements are economically transferred to Fortitude Re.
The following table presents the reconciliation of Adjusted ROAE:
| | | | | | | | | | | | | | | | | | | | | | | | | | | | |
| | | | | | December 31, |
| (in millions, unless otherwise noted) | | | | | | | | | | 2022 | | 2021 | | 2020 |
| Actual or annualized net income (loss) attributable to Corebridge shareholders (a)* | | | | | | | | | | $ | 8,159 | | | $ | 8,243 | | | $ | 642 | |
| Actual or annualized adjusted after-tax operating income attributable to Corebridge shareholders (b)* | | | | | | | | | | 2,371 | | | 3,477 | | | 2,556 | |
| Average Corebridge shareholders’ equity (c)* | | | | | | | | | | 15,497 | | | 34,441 | | | 34,519 | |
| Less: Average AOCI* | | | | | | | | | | (8,143) | | | 9,105 | | | 11,991 | |
| Add: Average cumulative unrealized gains and losses related to Fortitude Re funds withheld assets | | | | | | | | | | (919) | | | 2,994 | | | 3,598 | |
| Average Adjusted Book Value (d) | | | | | | | | | | $ | 22,721 | | | $ | 28,330 | | | $ | 26,126 | |
| | | | | | | | | | | | | | |
| Return on Average Equity (a/c)* | | | | | | | | | | 52.6 | % | | 23.9 | % | | 1.9 | % |
| Adjusted ROAE (b/d)* | | | | | | | | | | 10.4 | % | | 12.3 | % | | 9.8 | % |
| | | | | | | | | | | | | | |
* The results for the years ended December 31, 2022 and 2021 have been updated to reflect the adoption of LDTI. No updates have been made to the results for the year ended December 31, 2020 as our effective date for LDTI adoption was January 1, 2021.
ITEM 7 | Use of Non-GAAP Financial Measures and Key Operating Metrics
Premiums and deposits is a non-GAAP financial measure that includes direct and assumed premiums received and earned on traditional life insurance policies, group benefit policies and life-contingent payout annuities, as well as deposits received on universal life insurance, investment-type annuity contracts and GICs. We believe the measure of premiums and deposits is useful in understanding customer demand for our products, evolving product trends and our sales performance period over period.
The following table presents the premiums and deposits:
| | | | | | | | | | | | | | | | | | | | | | | | | | | | | | |
| | | | Years Ended December 31, | | |
| (in millions) | | | | | | 2022 | | 2021 | | 2020 | | | | | | |
| Individual Retirement | | | | | | | | | | | | | | | | |
Premiums(e) | | | | | | $ | 235 | | | $ | 195 | | | $ | 151 | | | | | | | |
Deposits(a) | | | | | | 14,900 | | | 13,473 | | | 9,492 | | | | | | | |
Other(b)(e) | | | | | | (15) | | | (11) | | | (9) | | | | | | | |
| Premiums and deposits | | | | | | 15,120 | | | 13,657 | | | 9,634 | | | | | | | |
| Group Retirement | | | | | | | | | | | | | | | | |
| Premiums | | | | | | 19 | | | 22 | | | 19 | | | | | | | |
| Deposits | | | | | | 7,923 | | | 7,744 | | | 7,477 | | | | | | | |
Premiums and deposits(c)(d) | | | | | | 7,942 | | | 7,766 | | | 7,496 | | | | | | | |
| Life Insurance | | | | | | | | | | | | | | | | |
Premiums(e) | | | | | | 1,864 | | | 1,586 | | | 1,526 | | | | | | | |
| Deposits | | | | | | 1,601 | | | 1,635 | | | 1,648 | | | | | | | |
Other(b)(e) | | | | | | 771 | | | 1,007 | | | 873 | | | | | | | |
| Premiums and deposits | | | | | | 4,236 | | | 4,228 | | | 4,047 | | | | | | | |
| Institutional Markets | | | | | | | | | | | | | | | | |
| Premiums | | | | | | 2,913 | | | 3,774 | | | 2,564 | | | | | | | |
| Deposits | | | | | | 1,382 | | | 1,158 | | | 2,284 | | | | | | | |
Other(b) | | | | | | 30 | | | 25 | | | 25 | | | | | | | |
| Premiums and deposits | | | | | | 4,325 | | | 4,957 | | | 4,873 | | | | | | | |
| Total | | | | | | | | | | | | | | | | |
| Premiums | | | | | | 5,031 | | | 5,577 | | | 4,260 | | | | | | | |
| Deposits | | | | | | 25,806 | | | 24,010 | | | 20,901 | | | | | | | |
Other(b) | | | | | | 786 | | | 1,021 | | | 889 | | | | | | | |
| Premiums and deposits | | | | | | $ | 31,623 | | | $ | 30,608 | | | $ | 26,050 | | | | | | | |
(a)Excludes deposits from the assets of our retail mutual funds business that were sold to Touchstone on July 16, 2021, or otherwise liquidated in connection with the sale. Deposits from these retail mutual funds were $259 million and $736 million for the years ended December 31, 2021 and 2020, respectively.
(b)Other principally consists of ceded premiums, in order to reflect gross premiums and deposits.
(c)Excludes client deposits into advisory and brokerage accounts of $2.1 billion, $2.5 billion and $1.4 billion for the years ended December 31, 2022, 2021 and 2020, respectively.
(d)Includes premiums and deposits related to in-plan mutual funds of $3.5 billion, $3.1 billion and $3.0 billion for the years ended December 31, 2022, 2021 and 2020, respectively.
(e)The results for the years ended December 31, 2022 and 2021 have been updated to reflect the adoption of LDTI. No updates have been made to the results for the year ended December 31, 2020 as our effective date for LDTI adoption was January 1, 2021.
Normalized distributions - are defined as dividends paid by the Life Fleet subsidiaries as well as the international insurance subsidiaries, less non-recurring dividends, plus dividend capacity that would have been available to Corebridge absent strategies that resulted in utilization of tax attributes. We believe that presenting normalized distributions is useful in understanding a significant component of our liquidity as a stand-alone company.
The following table presents a reconciliation of Dividends to Normalized distributions:
| | | | | | | | | | | | | | | | | | | | | | | | |
| | | | Years Ended December 31, |
| (in millions) | | | | | | 2022 | | 2021 | | 2020 |
| Subsidiary dividends paid | | | | | | $ | 1,821 | | | $ | 1,564 | | | $ | 540 | |
| Less: Non-recurring dividends | | | | | | — | | | (295) | | | 600 | |
| Tax sharing payments related to utilization of tax attributes | | | | | | 401 | | | 902 | | | 1,026 | |
| Normalized distributions | | | | | | $ | 2,222 | | | $ | 2,171 | | | $ | 2,166 | |
ITEM 7 | Use of Non-GAAP Financial Measures and Key Operating Metrics
Net investment income (APTOI basis) is the sum of base portfolio income and variable investment income.
The following table presents a reconciliation of net investment income (net income basis) to net investment income (APTOI basis):
| | | | | | | | | | | | | | | | | | | | | | | | |
| | | | Years Ended December 31, |
| (in millions) | | | | | | 2022 | | 2021 | | 2020 |
| Net investment income (net income basis) | | | | | | $ | 9,576 | | | $ | 11,672 | | | $ | 10,516 | |
| Net investment (income) on Fortitude Re funds withheld assets | | | | | | (891) | | | (1,775) | | | (1,427) | |
| Change in fair value of securities used to hedge guaranteed living benefits | | | | | | (56) | | | (60) | | | (56) | |
| Other adjustments | | | | | | (50) | | | (30) | | | (55) | |
| Derivative income recorded in net realized investment gains (losses) | | | | | | 179 | | | 110 | | | 106 | |
| Total adjustments | | | | | | (818) | | | (1,755) | | | (1,432) | |
Net investment income (APTOI basis) * | | | | | | $ | 8,758 | | | $ | 9,917 | | | $ | 9,084 | |
*Includes net investment income from Corporate and Other of $473 million, $443 million and $346 million for the years ended December 31, 2022, 2021 and 2020, respectively.
ULSG Net Liability – represents the net liability for ULSG and for universal life policies with similar expected benefit patterns liability adjusted to include the impacts of DAC, unearned revenue reserve (“URR”), and other guaranteed benefits less unrealized gains (losses). We believe that presenting ULSG Net Liability is useful as it provides supplemental information regarding the totality of our exposure to universal life policies with secondary guarantees.
The following table presents a reconciliation of the liability for ULSG and similar features to the ULSG Net Liability:
| | | | | | | | | | | | | | | | | | | | | | |
| | December 31, |
| (in millions) | | 2022 | | 2021 | | 2020 | | |
| Liability for ULSG and similar features* | | $ | 3,109 | | | $ | 4,752 | | | $ | 4,751 | | | |
| Deferred Acquisition Costs* | | (2,581) | | | (2,646) | | | (2,708) | | | |
| Unearned Revenue Reserves* | | 1,726 | | | 1,692 | | | 1,660 | | | |
| Impact of Unrealized Gains (Losses) from Investments* | | 679 | | | (1,145) | | | (1,495) | | | |
| Other Guaranteed Benefits* | | — | | | — | | | 421 | | | |
| Other Ceded Guaranteed Benefits* | | — | | | — | | | (266) | | | |
| ULSG Net Liability | | $ | 2,933 | | | $ | 2,653 | | | $ | 2,363 | | | |
* The results for the years ended December 31, 2022 and 2021 have been updated to reflect the adoption of LDTI. No updates have been made to the results for the year ended December 31, 2020 as our effective date for LDTI adoption was January 1, 2021.
Net insurance liabilities - represents the gross liabilities for our insurance businesses, including the future policy benefits, policyholder contract deposits, other policyholder fund and the separate account liabilities, less reinsurance assets. We believe that presenting net insurance liabilities is useful as it provides supplemental information regarding the totality of our insurance liabilities and customer demand for our products as product trends evolve.
The following table presents a reconciliation of the gross liabilities to the net insurance liabilities:
| | | | | | | | | | | | | | |
| | December 31, |
| (in billions) | | 2022 | | 2021 |
| Future policy benefits for life and accident and health contracts | | $ | 50.5 | | $ | 64.3 |
| Policyholder contract deposits | | 156.1 | | 151.5 |
| Market risk benefit liabilities, at fair value | | 4.7 | | 7.5 |
| Other policyholder funds | | 2.9 | | 2.9 |
| Separate account liabilities | | 84.9 | | | 109.1 | |
Less: Direct liabilities related to the Corporate and Other segment and other balances (a) | | (28.1) | | (33.8) |
Less: Reinsurance assets (b) | | (1.6) | | (2.2) |
| Net insurance liabilities | | $ | 269.4 | | $ | 299.3 |
(a)Direct liabilities related to the Corporate and Other segment consist of $26.3 billion and $33.4 billion of liabilities related to Fortitude Re at December 31, 2022 and December 31, 2021, respectively. Other balances primarily includes unearned revenue reserves which are recorded in other policyholder funds.
(b)Reinsurance assets includes recoverables related to future policy benefits and policyholder contract deposits. Recoverables related to paid claims are excluded.
ITEM 7 | Use of Non-GAAP Financial Measures and Key Operating Metrics
KEY OPERATING METRICS
Assets Under Management and Administration
Assets Under Management (“AUM”) include assets in the general and separate accounts of our subsidiaries that support liabilities and surplus related to our life and annuity insurance products.
Assets Under Administration (“AUA”) include Group Retirement mutual fund assets and other third-party assets that we sell or administer and the notional value of SVW contracts.
Assets Under Management and Administration (“AUMA”) is the cumulative amount of AUM and AUA.
The following table presents a summary of our AUMA:
| | | | | | | | | | | | | | | | | | | | |
| | December 31, |
| (in millions) | | 2022 | | 2021 | | 2020 |
| Individual Retirement | | | | | | |
| AUM | | $ | 136,696 | | $ | 160,244 | | $ | 157,349 |
AUA | | — | | — | | — |
| Total Individual Retirement AUMA | | 136,696 | | 160,244 | | 157,349 |
| Group Retirement | | | | | | |
| AUM | | 78,474 | | 97,232 | | 94,460 |
| AUA | | 36,458 | | 42,610 | | 35,594 |
| Total Group Retirement AUMA | | 114,932 | | 139,842 | | 130,054 |
| Life Insurance | | | | | | |
| AUM | | 27,760 | | 34,355 | | 34,781 |
| AUA | | — | | — | | — |
| Total Life Insurance AUMA | | 27,760 | | 34,355 | | 34,781 |
| Institutional Markets | | | | | | |
| AUM | | 30,686 | | 32,673 | | 30,367 |
| AUA | | 47,078 | | 43,830 | | 43,310 |
| Total Institutional Markets AUMA | | 77,764 | | 76,503 | | 73,677 |
| Total AUMA | | $ | 357,152 | | $ | 410,944 | | $ | 395,861 |
Fee and Spread income and Underwriting Margin
Fee income is defined as policy fees plus advisory fees plus other fee income. For our Institutional Markets segment, its SVW products generate fee income.
Spread income is defined as net investment income less interest credited to policyholder account balances, exclusive of amortization of deferred sales inducement assets. Spread income is comprised of both base spread income and variable investment income. For our Institutional Markets segment, its structured settlements, PRT and GIC products generate spread income, which includes premiums, net investment income, less interest credited and policyholder benefits and excludes the annual assumption update.
Underwriting margin for our Life Insurance segment includes premiums, policy fees, other income, net investment income, less interest credited to policyholder account balances and policyholder benefits and excludes the annual assumption update. For our Institutional Markets segment, its Corporate Markets products generate underwriting margin, which includes premiums, net investment income, policy and advisory fee income, less interest credited and policyholder benefits and excludes the annual assumption update.
Base portfolio income includes interest, dividends and foreclosed real estate income, net of investment expenses and non-qualifying (economic) hedges.
Variable investment income includes call and tender income, commercial mortgage loan prepayments, changes in market value of investments accounted for under the fair value option, interest received on defaulted investments (other than foreclosed real estate), income from alternative investments, affordable housing investments and other miscellaneous investment income, including income of certain partnership entities that are required to be consolidated. Alternative investments include private equity funds which are generally reported on a one-quarter lag.
Base spread income means base portfolio income less interest credited to policyholder account balances, excluding the amortization of deferred sales inducement assets.
ITEM 7 | Use of Non-GAAP Financial Measures and Key Operating Metrics
Base net investment spread means base yield less cost of funds, excluding the amortization of deferred sales inducement assets.
Base yield means the returns from base portfolio income including accretion and impacts from holding cash and short-term investments.
The following table presents a summary of our spread income, fee income and underwriting margin:
| | | | | | | | | | | | | | | | | | | | | | | | |
| | | | Years Ended December 31, |
| (in millions) | | | | | | 2022 | | 2021 | | 2020 |
| Individual Retirement | | | | | | | | | | |
Spread income(a) | | | | | | $ | 2,027 | | $ | 2,599 | | $ | 2,430 |
Fee income(a)(b) | | | | | | 1,192 | | 1,335 | | 1,321 |
Total Individual Retirement(b) | | | | | | 3,219 | | | 3,934 | | 3,751 |
| Group Retirement | | | | | | | | | | |
Spread income(a) | | | | | | 867 | | 1,269 | | 1,088 |
Fee income(a) | | | | | | 720 | | 817 | | 715 |
| Total Group Retirement | | | | | | 1,587 | | | 2,086 | | 1,803 |
| Life Insurance | | | | | | | | | | |
Underwriting margin(a) | | | | | | 1,561 | | 1,614 | | 1,261 |
| Total Life Insurance | | | | | | 1,561 | | | 1,614 | | 1,261 |
Institutional Markets(c) | | | | | | | | | | |
Spread income(a) | | | | | | 285 | | 487 | | 350 |
| Fee income | | | | | | 63 | | 61 | | 62 |
Underwriting margin(a) | | | | | | 77 | | 102 | | 75 |
| Total Institutional Markets | | | | | | 425 | | | 650 | | 487 |
| Total | | | | | | | | | | |
| Spread income | | | | | | 3,179 | | 4,355 | | 3,868 |
| Fee income | | | | | | 1,975 | | 2,213 | | 2,098 |
| Underwriting margin | | | | | | 1,638 | | 1,716 | | 1,336 |
| Total | | | | | | $ | 6,792 | | $ | 8,284 | | $ | 7,302 |
(a) The results for the years ended December 31, 2022 and 2021 have been updated to reflect the adoption of LDTI. No updates have been made to the results for the year ended December 31, 2020 as our effective date for LDTI adoption was January 1, 2021.
(b) Excludes fee income of $54 million and $111 million for the years ended December 31, 2021 and 2020, respectively, related to the assets of our retail mutual funds business that were sold to Touchstone on July 16, 2021, or otherwise liquidated in connection with the sale.
(c) Fee income for Institutional Markets includes only SVW fee income, while underwriting margin includes fee and advisory income on products other than SVW.
ITEM 7 | Use of Non-GAAP Financial Measures and Key Operating Metrics
Net Investment Income (APTOI Basis)
The following table presents a summary of our four insurance operating businesses’ net investment income on an APTOI basis:
| | | | | | | | | | | | | | | | | | | | | | | | |
| | | | Years Ended December 31, |
| (in millions) | | | | | | 2022 | | 2021 | | 2020 |
| Individual Retirement | | | | | | | | | | |
| Base portfolio income | | | | | | $ | 3,725 | | $ | 3,478 | | $ | 3,573 |
| Variable investment income, excluding affordable housing | | | | | | 163 | | 711 | | 403 |
Affordable housing* | | | | | | — | | 145 | | 129 |
| Net investment income | | | | | | 3,888 | | | 4,334 | | 4,105 |
| Group Retirement | | | | | | | | | | |
| Base portfolio income | | | | | | 1,882 | | 1,905 | | 1,924 |
| Variable investment income, excluding affordable housing | | | | | | 118 | | 424 | | 215 |
Affordable housing* | | | | | | — | | 84 | | 74 |
| Net investment income | | | | | | 2,000 | | | 2,413 | | 2,213 |
| Life Insurance | | | | | | | | | | |
| Base portfolio income | | | | | | 1,282 | | 1,246 | | 1,290 |
| Variable investment income, excluding affordable housing | | | | | | 107 | | 316 | | 190 |
Affordable housing* | | | | | | — | | 59 | | 52 |
| Net investment income | | | | | | 1,389 | | | 1,621 | | 1,532 |
| Institutional Markets | | | | | | | | | | |
| Base portfolio income | | | | | | 995 | | 865 | | 827 |
| Variable investment income, excluding affordable housing | | | | | | 54 | | 269 | | 85 |
Affordable housing* | | | | | | — | | 21 | | 19 |
| Net investment income | | | | | | 1,049 | | | 1,155 | | 931 |
| Total | | | | | | | | | | |
| Base portfolio income | | | | | | 7,884 | | 7,494 | | 7,614 |
| Variable investment income, excluding affordable housing | | | | | | 442 | | 1,720 | | 893 |
Affordable housing* | | | | | | — | | 309 | | 274 |
| Net investment income (APTOI basis) - Insurance operations | | | | | | $ | 8,326 | | $ | 9,523 | | $ | 8,781 |
*Affordable housing is a component of variable investment income.
Net Flows
Net flows for annuity products in Individual Retirement and Group Retirement represent premiums and deposits less death, surrender and other withdrawal benefits. Net flows for mutual funds represent deposits less withdrawals. For Group Retirement, client deposits into advisory and brokerage accounts less total client withdrawals from advisory and brokerage accounts are not included in net flows.
The following table presents a summary of our Net Flows:
| | | | | | | | | | | | | | | | | | | | | | | | |
| | | | Years Ended December 31, |
| (in millions) | | | | | | 2022 | | 2021 | | 2020 |
| Individual Retirement | | | | | | | | | | |
| Fixed Annuities | | | | | | $ | (441) | | $ | (2,396) | | $ | (2,504) |
| Fixed Index Annuities | | | | | | 4,521 | | | 4,072 | | | 2,991 | |
| Variable Annuities | | | | | | (1,672) | | | (864) | | | (1,554) | |
| Total Individual Retirement | | | | | | 2,408 | | | 812 | | | (1,067) | |
| Group Retirement | | | | | | (3,111) | | | (3,208) | | | (1,940) | |
Total Net Flows* | | | | | | $ | (703) | | $ | (2,396) | | $ | (3,007) |
*Excludes net flows of $(1.4) billion and $(3.7) billion for the years ended December 31, 2021 and 2020, respectively, related to the retail mutual funds business that was sold to Touchstone on July 16, 2021, or otherwise liquidated in connection with the sale.
ITEM 7 | Consolidated Results of Operations
Consolidated Results of Operations The following section provides a comparative discussion of our consolidated results of operations on a reported basis for the years ended December 31, 2022, 2021 and 2020. For factors that relate primarily to a specific business, see “—Segment Operations.”
| | | | | | | | | | | | | | | | | | | | | | | | |
| | | | Years Ended December 31, |
| (in millions) | | | | | | 2022 | | 2021 | | 2020 |
| Revenues: | | | | | | | | | | |
| Premiums* | | | | | | $ | 5,091 | | | $ | 5,653 | | | $ | 4,341 | |
| Policy fees* | | | | | | 2,914 | | | 3,005 | | | 2,874 | |
| Net investment income | | | | | | 9,576 | | | 11,672 | | | 10,516 | |
Net realized gains (losses)* | | | | | | 6,091 | | | 1,752 | | | (3,741) | |
| Advisory fee and other income | | | | | | 1,025 | | | 1,175 | | | 1,072 | |
| Total revenues | | | | | | 24,697 | | | 23,257 | | | 15,062 | |
| Benefits and expenses: | | | | | | | | | | |
| | | | | | | | | | |
| | | | | | | | | | |
| | | | | | | | | | |
| Policyholder benefits* | | | | | | 6,720 | | | 7,387 | | | 6,602 | |
| Change in the fair value of market risk benefits, net* | | | | | | (958) | | | (447) | | | — | |
| Interest credited to policyholder account balances* | | | | | | 3,732 | | | 3,562 | | | 3,528 | |
| Amortization of deferred policy acquisition costs and value of business acquired* | | | | | | 1,020 | | | 951 | | | 543 | |
| Non-deferrable insurance commissions* | | | | | | 568 | | | 623 | | | 604 | |
| Advisory fee expenses | | | | | | 266 | | | 322 | | | 316 | |
| General operating expenses | | | | | | 2,323 | | | 2,104 | | | 2,027 | |
| Interest expense | | | | | | 534 | | | 389 | | | 490 | |
| (Gain) loss on extinguishment of debt | | | | | | — | | | 219 | | | 10 | |
| Net (gain) loss on divestitures | | | | | | 1 | | | (3,081) | | | — | |
| Net (gains) losses on Fortitude Re transactions | | | | | | — | | | (26) | | | 91 | |
| Total benefits and expenses | | | | | | 14,206 | | | 12,003 | | | 14,211 | |
| Income (loss) before income tax expense (benefit) | | | | | | 10,491 | | | 11,254 | | | 851 | |
Income tax expense (benefit)* | | | | | | 2,012 | | | 2,082 | | | (15) | |
| Net income (loss) | | | | | | 8,479 | | | 9,172 | | | 866 | |
| Less: Net income attributable to noncontrolling interests | | | | | | 320 | | | 929 | | | 224 | |
| Net income (loss) attributable to Corebridge | | | | | | $ | 8,159 | | | $ | 8,243 | | | $ | 642 | |
| | | | | | | | | | |
| | | | | | | | | | |
| | | | | | | | | | |
| | | | | | | | | | |
| | | | | | | | | | |
| | | | | | | | | | |
| | | | | | | | | | |
| | | | | | | | | | |
| | | | | | | | | | |
| | | | | | | | | | |
| | | | | | | | | | |
| | | | | | | | | | |
| | | | | | | | | | |
| | | | | | | | | | |
*The results for the years ended December 31, 2022 and 2021 have been updated to reflect the adoption of LDTI. No updates have been made to the results for the year ended December 31, 2020 as our effective date for LDTI adoption was January 1, 2021. Refer to Note 2 for additional information on the impacts in connection with the adoption of LDTI.
The following table presents certain balance sheet data:
| | | | | | | | | | | |
| (in millions, except per common share data) | December 31, 2022 | | December 31, 2021 |
| Balance sheet data: | | | |
| Total assets* | $ | 360,322 | | | $ | 425,431 | |
| Long-term debt | $ | 7,868 | | | $ | 427 | |
| Debt of consolidated investment entities | $ | 5,958 | | | $ | 6,936 | |
| Total Corebridge shareholders’ equity* | $ | 9,380 | | | $ | 27,230 | |
| Book value per common share* | $ | 14.54 | | | $ | 42.22 | |
| Adjusted book value per common share* | $ | 36.34 | | | $ | 33.53 | |
*The results for the years ended December 31, 2022 and 2021 have been updated to reflect the adoption of LDTI. Refer to Note 2 for additional information on the impacts in connection with the adoption of LDTI.
Financial Highlights
2022 to 2021 Net Income Comparison
Income (loss) before income tax expense (benefit)
We recorded pre-tax income of $10.5 billion in the year ended December 31, 2022 compared to pre-tax income of $11.3 billion in the year ended December 31, 2021. The change in pre-tax income was primarily due to:
ITEM 7 | Consolidated Results of Operations
•the recognition of a $3.1 billion gain on the closing of the affordable housing sale to Blackstone in 2021 and the sale of certain assets of the retail mutual funds business to Touchstone in 2021; and
•lower net investment income of $2.1 billion primarily driven by lower income related to the Fortitude Re funds withheld assets and lower variable investment income. Net investment income in 2021 includes $309 million of investment income from affordable housing investments.
Partially offset by:
•higher realized gains of $4.3 billion primarily driven by higher gains on Fortitude Re funds withheld embedded derivative partially offset by lower net realized gains excluding Fortitude Re funds withheld assets;
•higher favorable change in the fair value of market risk benefits, net of $511 million due to changes in market conditions; and
•the year ended December 31, 2021 reflected a loss on extinguishment of debt of $219 million.
Income tax expense (benefit)
For the year ended December 31, 2022, there was a tax expense of $2.0 billion on income from operations, resulting in an effective tax rate on income from operations of 19.2%. Refer to the reconciliation of the GAAP tax rate to the adjusted tax rate presented in “–– Use of Non-GAAP Financial Measures and Key Operating Metrics” presented herein.
2021 to 2020 Net Income Comparison
Income (loss) before income tax expense (benefit)
The 2020 results are presented on a pre-LDTI basis.
We recorded pre-tax income of $11.3 billion in the year ended December 31, 2021 compared to pre-tax income of $851 million in the year ended December 31, 2020.The change in pre-tax income was primarily due to:
•higher realized gains of $5.5 billion primarily driven by a lower decrease in the fair value of our embedded derivatives related to the Fortitude Re funds withheld assets and higher realized gains on sales of real estate investments and available for sale securities;
•the recognition of a $3.1 billion gain on the closing of the affordable housing sale to Blackstone in 2021 and the sale of certain assets of the retail mutual funds business to Touchstone in 2021;
•increase in net investment income of $1.2 billion primarily driven by higher returns on the alternative investment portfolio due to gains on private equity investments
•favorable change in the fair value of market risk benefits, net of $447 million reflecting changes in market conditions; and
•higher policy fees of $131 million primarily due to higher average variable annuity separate account asset values driven by equity market performance.
Partially offset by:
•higher amortization of DAC of $408 million principally driven by the favorable impact of the review and update of actuarial assumptions in 2020 and equity market performance; and
•higher loss on extinguishment of debt of $209 million primarily due to the extinguishment of debt of certain consolidated investment entities and the partial extinguishment of AIGLH debt.
Income tax expense (benefit)
For the year ended December 31, 2021, there was a tax expense on income from operations of $2.1 billion, resulting in an effective tax rate on income from operations of 18.5%. Refer to the reconciliation of the GAAP tax rate to the adjusted tax rate presented in “–– Use of Non-GAAP Financial Measures and Key Operating Metrics” presented herein.
ITEM 7 | Consolidated Results of Operations
Adjusted pre-tax operating income
The following table presents a reconciliation of pre-tax income (loss) attributable to Corebridge to APTOI:
| | | | | | | | | | | | | | | | | | | | | | | | |
| | | | Years Ended December 31, |
| (in millions) | | | | | | 2022 | | 2021 | | 2020 |
| Pre-tax income (loss) attributable to Corebridge* | | | | | | $ | 10,491 | | | $ | 11,254 | | | $ | 851 | |
| Reconciling items to APTOI: | | | | | | | | | | |
| Fortitude Re related items | | | | | | (6,841) | | | (2,038) | | | 1,640 | |
| Non-Fortitude Re related items* | | | | | | (796) | | | (4,835) | | | 703 | |
| Adjusted pre-tax operating income | | | | | | $ | 2,854 | | $ | 4,381 | | $ | 3,194 |
* The results for the years ended December 31, 2022 and 2021 have been updated to reflect the adoption of LDTI. No updates have been made to the results for the year ended December 31, 2020 as our effective date for LDTI adoption was January 1, 2021.
The following tables presents the impacts in connection with the adoption of LDTI on our previously reported APTOI for the years ended December 31, 2022 and 2021:
| | | | | | | | | | | | | | | | | | | | |
| December 31, 2022 | | As Previously Reported | | Effect of Change | | Updated Balances post-adoption of LDTI |
| (in millions, except per common share data) | | |
| Revenues: | | | | | | |
| Premiums | | $ | 5,115 | | | $ | (2) | | | $ | 5,113 | |
| Policy fees | | 2,972 | | | (58) | | | 2,914 | |
| Total revenues | | 18,015 | | | (60) | | | 17,955 |
| Benefits and expenses: | | | | | | |
| Policyholder benefits | | 7,333 | | | (599) | | | 6,734 | |
| Interest credited to policyholder account balances | | 3,681 | | | 44 | | | 3,725 | |
| Amortization of deferred acquisition costs | | 1,128 | | | (108) | | | 1,020 | |
| Non-deferrable insurance commissions | | 636 | | | (68) | | | 568 | |
| Total benefits and expenses | | 15,512 | | | (731) | | | 14,781 | |
| Adjusted pre-tax operating income | | $ | 2,183 | | | $ | 671 | | | $ | 2,854 | |
ITEM 7 | Consolidated Results of Operations
| | | | | | | | | | | | | | | | | | | | |
| December 31, 2021 | | As Previously Reported | | Effect of Change | | Updated Balances post-adoption of LDTI |
| (in millions, except per common share data) | | |
| Revenues: | | | | | | |
| Premiums | | $ | 5,646 | | | $ | 17 | | | $ | 5,663 | |
| Policy fees | | 3,051 | | | (46) | | | 3,005 | |
| Total revenues | | 20,490 | | | (29) | | | 20,461 |
| Benefits and expenses: | | | | | | |
| Policyholder benefits | | 8,028 | | | (655) | | | 7,373 | |
| Interest credited to policyholder account balances | | 3,569 | | | 11 | | | 3,580 | |
| Amortization of deferred acquisition costs | | 975 | | | (24) | | | 951 | |
| Non-deferrable insurance commissions | | 680 | | | (57) | | | 623 | |
| Total benefits and expenses | | 15,944 | | | (725) | | | 15,219 | |
| Adjusted pre-tax operating income | | $ | 3,685 | | | $ | 696 | | | $ | 4,381 | |
The following table presents total Corebridge’s adjusted pre-tax operating income:
| | | | | | | | | | | | | | | | | | | | | | | | |
| | | | Years Ended December 31, |
| (in millions) | | | | | | 2022 | | 2021 | | 2020 |
Premiums(a) | | | | | | $ | 5,113 | | | $ | 5,663 | | | $ | 4,334 | |
Policy fees(a) | | | | | | 2,914 | | | 3,005 | | | 2,874 | |
| Net investment income | | | | | | 8,758 | | | 9,917 | | | 9,084 | |
Net realized gains(b) | | | | | | 170 | | | 701 | | | 54 | |
| Advisory fee and other income | | | | | | 1,000 | | | 1,175 | | | 1,060 | |
| Total adjusted revenues | | | | | | 17,955 | | 20,461 | | 17,406 |
| | | | | | | | | | |
| | | | | | | | | | |
| | | | | | | | | | |
Policyholder benefits(a) | | | | | | 6,734 | | | 7,373 | | | 6,590 | |
Interest credited to policyholder account balances(a) | | | | | | 3,725 | | | 3,580 | | | 3,552 | |
Amortization of deferred policy acquisition costs and value of business acquired(a) | | | | | | 1,020 | | | 951 | | | 601 | |
Non-deferrable insurance commissions(a) | | | | | | 568 | | | 623 | | | 604 | |
| Advisory fee expenses | | | | | | 266 | | | 322 | | | 316 | |
| General operating expenses | | | | | | 1,984 | | | 2,016 | | | 1,920 | |
| Interest expense | | | | | | 484 | | | 354 | | | 435 | |
| Total benefits and expenses | | | | | | 14,781 | | 15,219 | | 14,018 |
| Noncontrolling interests | | | | | | (320) | | | (861) | | | (194) | |
| Adjusted pre-tax operating income | | | | | | $ | 2,854 | | $ | 4,381 | | $ | 3,194 |
(a) The results for the years ended December 31, 2022 and 2021 have been updated to reflect the adoption of LDTI. No updates have been made to the results for the year ended December 31, 2020 as our effective date for LDTI adoption was January 1, 2021.
(b) Net realized gains (losses) includes the gains (losses) related to the disposition of real estate investments.
2022 to 2021 APTOI Comparison
APTOI decreased $1.5 billion primarily due to:
•lower net investment income of $1.2 billion primarily driven by lower variable investment income reflecting lower alternative investment income and lower yield enhancement income partially offset by higher base portfolio income. Net investment income in 2021 includes $309 million of investment income from affordable housing investments; and
•lower policy fees, net advisory fee and other income, net of advisory fee expenses of $210 million driven by a $51 million decrease from the sale of our retail mutual fund business in 2021, lower average separate account asset values driven by negative equity market performance, higher interest rates and wider credit spreads.
2021 to 2020 APTOI Comparison
The 2020 results are presented on a pre-LDTI basis.
APTOI increased $1.2 billion primarily due to:
•higher net investment income of $833 million primarily driven by higher variable investment income reflecting higher private equity income and higher income on call and tender activity; and
•higher policy fees, advisory fee and other income of $240 million primarily driven by higher average separate account asset values.
Partially offset by:
•higher DAC amortization of $350 million principally impacted by the review and update of actuarial assumptions in 2020 and equity market performance in 2020.
ITEM 7 | Business Segment Operations
Business Segment Operations
Our business operations consist of five reportable segments:
•Individual Retirement – consists of fixed annuities, fixed index annuities, variable annuities and retail mutual funds. On February 8, 2021, we announced the execution of a definitive agreement with Touchstone to sell certain assets of our retail mutual funds business. This Touchstone transaction closed on July 16, 2021. For further information on this sale, see Note 1 to our audited annual consolidated financial statements.
•Group Retirement – consists of record-keeping, plan administrative and compliance services, financial planning and advisory solutions offered in-plan, along with proprietary and limited non-proprietary annuities, advisory and brokerage products offered out-of-plan.
•Life Insurance – primary products in the United States include term life and universal life insurance. The International Life business issues individual and group life insurance in the United Kingdom, and distributes private medical insurance in Ireland.
•Institutional Markets – consists of SVW products, structured settlement and PRT annuities, Corporate Markets products that include COLI-BOLI, private placement variable universal life and private placement variable annuities products and GICs.
•Corporate and Other – consists primarily of:
–corporate expenses not attributable to our other segments;
–interest expense on financial debt;
–results of our consolidated investment entities;
–institutional asset management business, which includes managing assets for non-consolidated affiliates; and
–results of our legacy insurance lines ceded to Fortitude Re.
The following tables summarize adjusted pre-tax operating income (loss) from our segments:
See Note 3 to our audited annual consolidated financial statements.
| | | | | | | | | | | | | | | | | | | | | | | | |
| | | | Years Ended December 31, |
| (in millions) | | | | | | 2022 | | 2021 | | 2020 |
| Individual Retirement* | | | | | | $ | 1,673 | | | $ | 2,289 | | | $ | 1,942 | |
| Group Retirement* | | | | | | 783 | | | 1,249 | | | 975 | |
| Life Insurance* | | | | | | 447 | | | 459 | | | 146 | |
| Institutional Markets* | | | | | | 334 | | | 547 | | | 367 | |
| Corporate and Other | | | | | | (395) | | | (161) | | | (234) | |
| Consolidation and elimination | | | | | | 12 | | | (2) | | | (2) | |
| Adjusted pre-tax operating income | | | | | | $ | 2,854 | | $ | 4,381 | | $ | 3,194 |
* The results for the years ended December 31, 2022 and 2021 have been updated to reflect the adoption of LDTI. No updates have been made to the results for the year ended December 31, 2020 as our effective date for LDTI adoption was January 1, 2021.
ITEM 7 | Business Segment Operations
DISCUSSION OF SEGMENT RESULTS
Individual Retirement
Individual Retirement Results
| | | | | | | | | | | | | | | | | | | | | | | | | | | | |
| | | | | | Years Ended December 31, |
| (in millions) | | | | | | | | | | 2022 | | 2021 | | 2020 |
| Revenues: | | | | | | | | | | | | | | |
Premiums(a) | | | | | | | | | | $ | 235 | | $ | 195 | | $ | 151 |
Policy fees(a) | | | | | | | | | | 741 | | 797 | | 861 |
| Net investment income: | | | | | | | | | | | | | | |
| Base portfolio income | | | | | | | | | | 3,725 | | 3,478 | | 3,573 |
Variable investment income(b) | | | | | | | | | | 163 | | 856 | | 532 |
| Net investment income | | | | | | | | | | 3,888 | | 4,334 | | 4,105 |
Advisory fee and other income(c)(d) | | | | | | | | | | 451 | | | 592 | | 571 |
| Total adjusted revenues | | | | | | | | | | 5,315 | | 5,918 | | 5,688 |
| Benefits and expenses: | | | | | | | | | | | | | | |
| | | | | | | | | | | | | | |
| | | | | | | | | | | | | | |
| | | | | | | | | | | | | | |
Policyholder benefits(a) | | | | | | | | | | 285 | | | 317 | | 411 |
Interest credited to policyholder account balances(a) | | | | | | | | | | 1,916 | | | 1,793 | | 1,751 |
Amortization of deferred policy acquisition costs(a) | | | | | | | | | | 523 | | 451 | | 556 |
| Non-deferrable insurance commissions | | | | | | | | | | 351 | | 396 | | 334 |
| Advisory fee expenses | | | | | | | | | | 141 | | 189 | | 205 |
| General operating expenses | | | | | | | | | | 426 | | 437 | | 427 |
| Interest expense | | | | | | | | | | — | | 46 | | 62 |
| Total benefits and expenses | | | | | | | | | | $ | 3,642 | | | $ | 3,629 | | $ | 3,746 |
| Adjusted pre-tax operating income | | | | | | | | | | $ | 1,673 | | $ | 2,289 | | $ | 1,942 |
(a)The results for the years ended December 31, 2022 and 2021 have been updated to reflect the adoption of LDTI. No updates have been made to the results for the year ended December 31, 2020 as our effective date for LDTI adoption was January 1, 2021.
(b)Includes income from affordable housing of $145 million and $129 million for the years ended December 31, 2021 and 2020, respectively.
(c)Includes advisory fee income from registered investment services, 12b-1 fees (i.e., marketing and distribution fee income), and other asset management fee income.
(d)Includes fee income of $54 million and $111 million for the years ended December 31, 2021 and 2020, respectively, related to assets of the retail mutual funds business that were sold to Touchstone on July 16, 2021, or otherwise liquidated, in connection with the sale.
Individual Retirement Sources of Earnings
The following table presents the sources of earnings of the Individual Retirement segment. We believe providing APTOI using this view is useful for gaining an understanding of our overall results of operations and the significant drivers of our earnings.
| | | | | | | | | | | | | | | | | | | | | | | | | | | | |
| | | | | | Years Ended December 31, |
| (in millions) | | | | | | | | | | 2022 | | 2021 | | 2020 |
Spread income(a)(b) | | | | | | | | | | $ | 2,027 | | $ | 2,599 | | | $ | 2,430 | |
Fee income(a)(c) | | | | | | | | | | 1,192 | | | 1,335 | | | 1,321 | |
Policyholder benefits, net of premiums(a) | | | | | | | | | | (50) | | (122) | | | (260) | |
| Non-deferrable insurance commissions | | | | | | | | | | (351) | | (396) | | | (334) | |
Amortization of DAC and DSI(a) | | | | | | | | | | (578) | | (509) | | | (632) | |
| General operating expenses | | | | | | | | | | (426) | | (437) | | | (427) | |
Other(d) | | | | | | | | | | (141) | | (181) | | | (156) | |
| Adjusted pre-tax operating income | | | | | | | | | | $ | 1,673 | | $ | 2,289 | | $ | 1,942 |
(a)The results for the years ended December 31, 2022 and 2021 have been updated to reflect the adoption of LDTI. No updates have been made to the results for the year ended December 31, 2020 as our effective date for LDTI adoption was January 1, 2021.
(b)Spread income represents net investment income less interest credited to policyholder account balances, exclusive of amortization of DSI of $55 million, $58 million and $76 million for the years ended December 31, 2022, 2021 and 2020, respectively.
(c)Fee income represents policy fees plus advisory fee and other income. Fee income excludes fee income of $54 million and $111 million for the years ended December 31, 2021 and 2020, respectively, related to assets of the retail mutual funds business that were sold to Touchstone on July 16, 2021, or otherwise liquidated, in connection with the sale.
(d)Other primarily represents interest expense and advisory fee expenses. The years ended December 31, 2021 and 2020 include fee income related to assets of the retail mutual funds business that were sold to Touchstone on July 16, 2021, or otherwise liquidated, in connection with the sale.
ITEM 7 | Business Segment Operations
Financial Highlights
2022 to 2021 APTOI Comparison
APTOI decreased $616 million primarily due to:
•lower spread income of $572 million primarily driven by lower variable investment income of $693 million primarily due to lower alternative investment income of $401 million and lower yield enhancement income of $291 million, partially offset by higher base spread income of $121 million; and
•lower fee income of $143 million, primarily due to a decrease in mortality and expense fees of $105 million and other fee income of $87 million due to lower variable annuity separate account asset values driven by a decline in equity markets, higher interest rates and wider credit spreads.
Partially offset by
•lower non-deferrable insurance commissions of $45 million, mostly due to lower variable annuity separate account asset values.
2021 to 2020 APTOI Comparison
The 2020 results are presented on a pre-LDTI basis.
APTOI increased $347 million primarily due to:
•lower DAC amortization and policyholder benefits net of premiums of $261 million, primarily due to the change in the accounting standard applied to 2021 results but not in 2020 results; and
•higher spread income of $169 million primarily driven by higher variable investment income of $324 million reflecting higher private equity income of $257 million partially offset by lower base spread income of $155 million.
Partially offset by
•an increase in non-deferrable insurance commissions of $62 million primarily due to growth in variable annuity separate account asset values.
AUMA
The following table presents Individual Retirement AUMA by product:
| | | | | | | | | | | | | | | | | | | | | | | | | | |
| | | | | | December 31, |
| (in millions) | | | | | | 2022 | | 2021 | | 2020 | | |
| Fixed annuities | | | | | | $ | 51,806 | | | $ | 57,823 | | | $ | 60,538 | | | |
| Fixed index annuities | | | | | | 30,403 | | | 31,809 | | | 27,893 | | | |
| Variable annuities: | | | | | | | | | | | | |
| Variable annuities - General Account | | | | | | 9,443 | | | 12,862 | | | 15,613 | | | |
| Variable annuities - Separate Accounts | | | | | | 45,044 | | | 57,750 | | | 53,305 | | | |
| Variable annuities | | | | | | 54,487 | | | 70,612 | | | 68,918 | | | |
Total* | | | | | | $ | 136,696 | | | $ | 160,244 | | | $ | 157,349 | | | |
*Excludes assets of the retail mutual funds business, that were sold to Touchstone on July 16, 2021, or were otherwise liquidated in connection with the sale. AUA related to these retail mutual funds was $7.8 billion at December 31, 2020.
2022 to 2021 AUMA Comparison
AUMA decreased $23.5 billion driven by lower variable annuities separate account asset values of $12.7 billion, due to declines in the equity markets, higher interest rates and wider credit spreads, as well as outflows from the separate account. A decrease of $10.8 billion in the general account was driven by higher interest rates and wider credit spreads resulting in unrealized losses from fixed maturities securities, partially offset by positive net flows into the general account.
2021 to 2020 AUMA Comparison
AUMA increased $2.9 billion driven by higher variable annuities separate account asset values of $4.4 billion, due to equity market growth. A decrease of $1.5 billion in the general account was driven by higher interest rates resulting in unrealized losses from fixed maturity securities, partially offset by positive net flows into the general account.
ITEM 7 | Business Segment Operations
Spread and Fee Income
The following table presents Individual Retirement spread and fee income:
| | | | | | | | | | | | | | | | | | | | | | | | | | | | |
| | | | | | Years Ended December 31, |
| (in millions) | | | | | | | | | | 2022 | | 2021 | | 2020 |
| Spread income: | | | | | | | | | | | | | | |
| Total spread income | | | | | | | | | | | | | | |
| Base portfolio income | | | | | | | | | | $ | 3,725 | | | $ | 3,478 | | | $ | 3,573 | |
Interest credited to policyholder account balances(a) | | | | | | | | | | (1,861) | | | (1,735) | | | (1,675) | |
| Base spread income | | | | | | | | | | 1,864 | | | 1,743 | | | 1,898 | |
| Variable investment income, excluding affordable housing | | | | | | | | | | 163 | | | 711 | | | 403 | |
| Affordable housing | | | | | | | | | | — | | | 145 | | | 129 | |
Total spread income(b) | | | | | | | | | | $ | 2,027 | | | $ | 2,599 | | | $ | 2,430 | |
| Fee income: | | | | | | | | | | | | | | |
Policy fees(a) | | | | | | | | | | $ | 741 | | | $ | 797 | | | $ | 861 | |
Advisory fees and other income(c) | | | | | | | | | | 451 | | | 538 | | | 460 | |
| Total fee income | | | | | | | | | | $ | 1,192 | | | $ | 1,335 | | | $ | 1,321 | |
(a) The results for the years ended December 31, 2022 and 2021 have been updated to reflect the adoption of LDTI. No updates have been made to the results for the year ended December 31, 2020 as our effective date for LDTI adoption was January 1, 2021.
(b) Excludes amortization of DSI assets of $55 million, $58 million and $76 million for the years ended December 31, 2022, 2021 and 2020, respectively.
(c) Excludes fee income of $54 million and $111 million for the years ended December 31, 2021 and 2020, respectively, related to assets of the retail mutual funds business that were sold to Touchstone on July 16, 2021, or otherwise liquidated, in connection with the sale.
The following table presents Individual Retirement net investment spread:
| | | | | | | | | | | | | | | | | | | | | | | | | | | | |
| | | | | | Years Ended December 31, |
| | | | | | | | | | 2022 | | 2021 | | 2020 |
| Fixed annuities base net investment spread: | | | | | | | | | | | | | | |
Base yield(b) | | | | | | | | | | 4.03 | % | | 3.94 | % | | 4.16 | % |
Cost of funds(a) | | | | | | | | | | 2.69 | | | 2.64 | | | 2.63 | |
| Fixed annuities base net investment spread | | | | | | | | | | 1.34 | | | 1.30 | | | 1.53 | |
| Fixed index annuities base net investment spread: | | | | | | | | | | | | | | |
Base yield(b) | | | | | | | | | | 3.90 | | | 3.78 | | | 3.97 | |
Cost of funds(a) | | | | | | | | | | 1.54 | | | 1.39 | | | 1.28 | |
| Fixed index annuities base net investment spread | | | | | | | | | | 2.36 | | | 2.39 | | | 2.69 | |
| Variable annuities base net investment spread: | | | | | | | | | | | | | | |
Base yield(b) | | | | | | | | | | 3.85 | | | 3.96 | | | 3.86 | |
Cost of funds(a) | | | | | | | | | | 1.43 | | | 1.42 | | | 1.42 | |
| Variable annuities base net investment spread | | | | | | | | | | 2.42 | | | 2.54 | | | 2.44 | |
| Total Individual Retirement base net investment spread: | | | | | | | | | | | | | | |
Base yield(b) | | | | | | | | | | 3.98 | | | 3.89 | | | 4.07 | |
Cost of funds(a) | | | | | | | | | | 2.18 | | | 2.15 | | | 2.15 | |
| Total Individual Retirement base net investment spread | | | | | | | | | | 1.80 | % | | 1.74 | % | | 1.92 | % |
(a) The results for the years ended December 31, 2022 and 2021 have been updated to reflect the adoption of LDTI. No updates have been made to the results for the year ended December 31, 2020 as our effective date for LDTI adoption was January 1, 2021.
(b) Includes returns from base portfolio including accretion and income (loss) from certain other invested assets.
2022 to 2021 Comparison
See “—Financial Highlights”
2021 to 2020 Comparison
See “—Financial Highlights”
ITEM 7 | Business Segment Operations
Premiums and Deposits and Net Flows
For Individual Retirement, premiums primarily represent amounts received on life-contingent payout annuities, while deposits represent sales on investment-oriented products.
Net flows for annuity products in Individual Retirement represent premiums and deposits less death, surrender and other withdrawal benefits.
| | | | | | | | | | | | | | | | | | | | | | | | | | | | |
| Premiums and Deposits | | | | | | Years Ended December 31, |
| (in millions) | | | | | | | | | | 2022 | | 2021 | | 2020 |
| Fixed annuities | | | | | | | | | | $ | 5,695 | | | $ | 3,011 | | | $ | 2,535 | |
| Fixed index annuities | | | | | | | | | | 6,316 | | | 5,621 | | | 4,096 | |
| Variable annuities | | | | | | | | | | 3,109 | | | 5,025 | | | 3,003 | |
Total* | | | | | | | | | | $ | 15,120 | | | $ | 13,657 | | | $ | 9,634 | |
*Excludes deposits of the retail mutual funds business that were sold to Touchstone on July 16, 2021, or otherwise liquidated, in connection with the sale. Deposits from retail mutual funds were $259 million and $736 million for the years ended December 31, 2021 and 2020, respectively.
| | | | | | | | | | | | | | | | | | | | | | | | | | | | |
| Net Flows | | | | | | Years Ended December 31, |
| (in millions) | | | | | | | | | | 2022 | | 2021 | | 2020 |
| Fixed annuities | | | | | | | | | | $ | (441) | | | $ | (2,396) | | | $ | (2,504) | |
| Fixed index annuities | | | | | | | | | | 4,521 | | | 4,072 | | | 2,991 | |
| Variable annuities | | | | | | | | | | (1,672) | | | (864) | | | (1,554) | |
Total* | | | | | | | | | | $ | 2,408 | | | $ | 812 | | | $ | (1,067) | |
* Excludes net flows related to the assets of the retail mutual funds business that were sold to Touchstone on July 16, 2021, or otherwise liquidated, in connection with the sale. Net flows from retail mutual funds were $(1.4) billion and $(3.7) billion for the years ended December 31, 2021 and 2020, respectively. Net flows for retail mutual funds represent deposits less withdrawals.
2022 to 2021 Comparison
Fixed Annuities Net outflows decreased by $2.0 billion over the prior year, primarily due to higher premiums and deposits of $2.7 billion due to competitive pricing, higher interest rates and lower death benefits of $300 million, partially offset by higher surrenders and withdrawals of $1.0 billion.
Fixed Index Annuities Net inflows increased by $449 million primarily due to higher premiums and deposits of $695 million due to competitive pricing and higher interest rates, partially offset by higher surrenders and withdrawals of $194 million and higher death benefits of $51 million.
Variable Annuities Net outflows increased $808 million primarily due to lower premium and deposits of $1.9 billion, due to market volatility, partially offset by lower surrenders and withdrawals of $993 million and lower death benefits of $116 million.
2021 to 2020 Comparison
Fixed Annuities Net flows remained negative but improved by $108 million due to higher premiums and deposits of $476 million, and lower death benefits of $222 million, offset by higher surrenders and withdrawals of $589 million due to higher interest rates. The premium and deposit growth was driven in part due to the prior year impact from distribution channel disruptions related to COVID-19.
Fixed Index Annuities Net flows increased by $1.1 billion primarily due to higher premiums and deposits of $1.5 billion offset by higher surrenders and withdrawals of $365 million and death benefits of $79 million. The premium and deposit growth was driven in part due to fewer disruptions related to COVID-19. The increase in surrenders and withdrawals was due to increased competition and aging of the policies.
Variable Annuities Net flows improved by $690 million primarily due to higher premium and deposits of $2.0 billion offset by higher surrenders and withdrawals of $1.1 billion and higher death benefits of $208 million. The premium and deposit growth was driven in part due to the prior year impact from distribution channel disruptions related to COVID-19. The increase in surrenders and withdrawals was due to an increase in the number of policies coming out of surrender charge, and increase in lapses of policies with guaranteed minimum withdrawal benefits that are out of the money.
Retail Mutual Funds Net flows remained negative but improved by $2.3 billion due to lower surrenders and withdrawals of $2.7 billion partially offset by lower premiums and deposits of $477 million due to investors’ continued preference for passive, low fee investment vehicles, and the distribution channel disruptions related to COVID-19. Retail mutual funds net flows reflect customer activity and in 2021, it excludes $7.0 billion of funds (i) transferred as part of the Touchstone sale or (ii) liquidated. For further information regarding the July 2021 sale of certain assets of our retail mutual funds businesses to Touchstone, see Note 1 to our audited annual consolidated financial statements.
ITEM 7 | Business Segment Operations
Surrenders
The following table presents Individual Retirement surrender rates:
| | | | | | | | | | | | | | | | | | | | | | | | | | | | |
| | | | | | Years Ended December 31, |
| | | | | | | | | | 2022 | | 2021 | | 2020 |
| Fixed annuities | | | | | | | | | | 9.2 | % | | 7.2 | % | | 5.9 | % |
| Fixed index annuities* | | | | | | | | | | 4.8 | | | 4.7 | | | 4.0 | |
| Variable annuities* | | | | | | | | | | 6.5 | | | 7.2 | | | 6.2 | |
* The results for the years ended December 31, 2022 and 2021 have been updated to reflect the adoption of LDTI. No updates have been made to the results for the year ended December 31, 2020 as our effective date for LDTI adoption was January 1, 2021.
The following table presents account values for fixed annuities, fixed index annuities and variable annuities by surrender charge category:
| | | | | | | | | | | | | | | | | | | | | | | | | | | | | | | | | | | | | | | | | | | | | | | | | | | | | | | | |
| | December 31, |
| | 2022 | | 2021 | 2020 |
| (in millions) | | Fixed
Annuities | | Fixed Index
Annuities | | Variable
Annuities | | Fixed
Annuities | | Fixed Index
Annuities | | Variable
Annuities | | Fixed
Annuities | | Fixed Index
Annuities | | Variable Annuities |
| No surrender charge | | $ | 24,889 | | | $ | 2,270 | | | $ | 27,037 | | | $ | 26,165 | | | $ | 1,895 | | | $ | 31,910 | | | $ | 26,921 | | | $ | 1,302 | | | $ | 27,995 | |
| Greater than 0% - 2% | | 1,783 | | | 1,353 | | | 6,962 | | | 2,071 | | | 1,587 | | | 10,276 | | | 2,282 | | | 1,037 | | | 9,972 | |
| Greater than 2% - 4% | | 2,256 | | | 4,532 | | | 5,081 | | | 2,401 | | | 3,958 | | | 9,394 | | | 2,738 | | | 3,149 | | | 11,322 | |
| Greater than 4% | | 18,905 | | | 25,196 | | | 12,082 | | | 16,285 | | | 21,222 | | | 12,435 | | | 16,050 | | | 18,087 | | | 11,977 | |
Non-surrenderable(a) | | 2,453 | | | — | | | 1,155 | | | 2,372 | | | — | | | 1,149 | | | 2,199 | | | — | | | 1,149 | |
Total account value(b) | | $ | 50,286 | | | $ | 33,351 | | | $ | 52,317 | | | $ | 49,294 | | | $ | 28,662 | | | $ | 65,164 | | | $ | 50,190 | | | $ | 23,575 | | | $ | 62,415 | |
(a) The non-surrenderable portion of variable annuities relates to a funding agreement.
(b) Includes payout Immediate Annuities, funding agreements.
Individual Retirement annuities are typically subject to a three- to seven-year surrender charge period, depending on the product. For fixed annuities, the proportion of account value subject to surrender charge at December 31, 2022 increased compared to December 31, 2021 primarily due to growth in business, while the proportion of fixed index annuities was slightly lower mostly due to the aging of the business. The increase in the proportion of account value with no surrender charge for variable annuities as of December 31, 2022 compared to December 31, 2021 was principally due to normal aging of business.
For fixed annuities, the proportion of account value subject to surrender charge at December 31, 2021 increased compared to December 31, 2020. The increase in account value with no surrender charge for variable and fixed index annuities at December 31, 2021 compared to December 31, 2020 was principally due to normal aging of business.
ITEM 7 | Business Segment Operations
Group Retirement
Group Retirement Results
| | | | | | | | | | | | | | | | | | | | | | | | | | | | | | | | | | | |
| | | | Years Ended December 31, | | | | | | | | | |
| (in millions) | | | | | | 2022 | | 2021 | | 2020 | | | | | | | | | | | |
| Revenues: | | | | | | | | | | | | | | | | | | | | | |
| Premiums | | | | | | $ | 19 | | | $ | 22 | | | $ | 19 | | | | | | | | | | | | |
Policy fees(a) | | | | | | 415 | | | 480 | | 443 | | | | | | | | | | | |
| Net investment income: | | | | | | | | | | | | | | | | | | | | | |
| Base portfolio income | | | | | | 1,882 | | | 1,905 | | 1,924 | | | | | | | | | | | |
Variable investment income(b) | | | | | | 118 | | | 508 | | 289 | | | | | | | | | | | |
| Net investment income | | | | | | 2,000 | | 2,413 | | 2,213 | | | | | | | | | | | |
Advisory fee and other income(c) | | | | | | 305 | | | 337 | | 272 | | | | | | | | | | | |
| Total adjusted revenues | | | | | | 2,739 | | | 3,252 | | 2,947 | | | | | | | | | | | |
| Benefits and expenses: | | | | | | | | | | | | | | | | | | | | | |
Policyholder benefits(a) | | | | | | 35 | | | 31 | | 74 | | | | | | | | | | | |
| | | | | | | | | | | | | | | | | | | | | |
| | | | | | | | | | | | | | | | | | | | | |
| | | | | | | | | | | | | | | | | | | | | |
Interest credited to policyholder account balances(a) | | | | | | 1,147 | | | 1,159 | | 1,125 | | | | | | | | | | | |
Amortization of deferred policy acquisition costs(a) | | | | | | 80 | | | 78 | | 15 | | | | | | | | | | | |
Non-deferrable insurance commissions(a) | | | | | | 123 | | | 122 | | 117 | | | | | | | | | | | |
| Advisory fee expenses | | | | | | 124 | | | 133 | | 111 | | | | | | | | | | | |
| General operating expenses | | | | | | 447 | | | 445 | | 488 | | | | | | | | | | | |
| Interest expense | | | | | | — | | | 35 | | 42 | | | | | | | | | | | |
| Total benefits and expenses | | | | | | 1,956 | | | 2,003 | | 1,972 | | | | | | | | | | | |
| Adjusted pre-tax operating income | | | | | | $ | 783 | | | $ | 1,249 | | $ | 975 | | | | | | | | | | | |
(a)The results for the years ended December 31, 2022 and 2021 have been updated to reflect the adoption of LDTI. No updates have been made to the results for the year ended December 31, 2020 as our effective date for LDTI adoption was January 1, 2021.
(b)Includes income from affordable housing of $84 million and $74 million for the years ended December 31, 2021 and 2020, respectively.
(c)Includes advisory fee income from registered investment services, 12b-1 fees (i.e., marketing and distribution fee income), other asset management fee income, and commission-based broker-dealer services.
Group Retirement Sources of Earnings
The following table presents the sources of earnings of the Group Retirement segment. We believe providing APTOI using this view is useful for gaining an understanding of our overall results of operations and the significant drivers of our earnings.
| | | | | | | | | | | | | | | | | | | | | | | | | | |
| | | | Years Ended December 31, |
| (in millions) | | | | | | 2022 | | 2021 | | 2020 | | |
Spread income(a)(b) | | | | | | $ | 867 | | | $ | 1,269 | | | $ | 1,088 | | | |
Fee income(b)(c) | | | | | | 720 | | | 817 | | | 715 | | | |
Policyholder benefits, net of premiums(b) | | | | | | (16) | | | (9) | | | (55) | | | |
Non-deferrable insurance commissions(b) | | | | | | (123) | | | (122) | | | (117) | | | |
Amortization of DAC and DSI(b) | | | | | | (94) | | | (93) | | | (15) | | | |
| General operating expenses | | | | | | (447) | | | (445) | | | (488) | | | |
Other(d) | | | | | | (124) | | | (168) | | | (153) | | | |
| Adjusted pre-tax operating income | | | | | | $ | 783 | | | $ | 1,249 | | | $ | 975 | | | |
(a) Spread income represents net investment income less interest credited to policyholder account balances, exclusive of amortization of DSI of $14 million, $15 million and $0 million for the years ended December 31, 2022, 2021 and 2020, respectively.
(b) The results for the years ended December 31, 2022 and 2021 have been updated to reflect the adoption of LDTI. No updates have been made to the results for the year ended December 31, 2020 as our effective date for LDTI adoption was January 1, 2021.
(c) Fee income represents policy fee and advisory fee and other income.
(d) Other consists of advisory fee expenses and interest expense.
Financial Highlights
2022 to 2021 APTOI Comparison
APTOI decreased $466 million, primarily due to:
•lower spread income of $402 million primarily driven by a decrease in variable investment income of $390 million due to lower income from alternative investments and yield enhancements. In addition, there was lower base spread income of $12 million;
•lower fee income, net of advisory fee expenses of $88 million primarily due to lower fee based assets driven by lower equity markets, higher interest rates and wider credit spreads; and
ITEM 7 | Business Segment Operations
Partially offset by:
•decrease in interest expense on external debt borrowings of $35 million when compared to 2021 due to sale of Affordable Housing in November 2021.
2021 to 2020 APTOI Comparison
The 2020 results are presented on a pre-LDTI basis.
APTOI increased $274 million, primarily due to:
•spread income was $181 million higher due to higher variable investment income of $219 million primarily driven by higher gains on private equity income and higher call and tender income, partially offset by lower base spread income of $38 million driven by decreased reinvestment yields;
•$80 million of higher policy and advisory fee income, net of advisory fee expenses due to an increase in separate account mutual fund, and advisory average assets; and
•lower general operating expenses of $43 million primarily due to decreased regulatory expenses.
Partially offset by:
•favorable impact from the review and update of actuarial assumptions of $68 million in 2020.
AUMA
The following table presents Group Retirement AUMA by product:
| | | | | | | | | | | | | | | | | | | | | | |
| | December 31, |
| (in millions) | | 2022 | | 2021 | | 2020 | | |
| AUMA by asset type: | | | | | | | | |
| In-plan spread based | | $ | 27,473 | | | $ | 32,549 | | | $ | 33,406 | | | |
| In-plan fee based | | 47,838 | | | 60,300 | | | 53,897 | | | |
Total in-plan AUMA(a) | | 75,311 | | | 92,849 | | | 87,303 | | | |
| Out-of-plan proprietary - general account | | 16,769 | | | 19,697 | | | 19,862 | | | |
| Out-of-plan proprietary - separate accounts | | 10,429 | | | 13,466 | | | 12,269 | | | |
Total out-of-plan proprietary annuities(b) | | 27,198 | | | 33,163 | | | 32,131 | | | |
| Advisory and brokerage assets | | 12,423 | | | 13,830 | | | 10,620 | | | |
| Total out-of-plan AUMA | | 39,621 | | | 46,993 | | | 42,751 | | | |
| Total AUMA | | $ | 114,932 | | | $ | 139,842 | | | $ | 130,054 | | | |
(a) Includes $12.5 billion of AUMA at December 31, 2022, $15.1 billion of AUMA at December 31, 2021 and $14.3 billion of AUMA at December 31, 2020 that is associated with our in-plan investment advisory service that we offer to participants at an additional fee.
(b) Includes $4.0 billion of AUMA at December 31, 2022, $4.9 billion of AUMA at December 31, 2021 and $4.3 billion of AUMA at December 31, 2020 in our proprietary advisory variable annuity. Together with our out-of-plan advisory and brokerage assets shown in the table above, we had a total of $16.4 billion of out-of-plan advisory assets at December 31, 2022, $18.7 billion of out-of-plan advisory assets at December 31, 2021 and $14.9 billion of out-of-plan advisory assets at December 31, 2020.
2022 to 2021 AUMA Comparison
In-plan assets decreased by $17.5 billion primarily driven by equity market declines, wider credit spreads and higher interest rates resulting in lower unrealized gains from fixed maturity securities. Out-of-plan proprietary annuity assets decreased by $6.0 billion, declining as a result of the same drivers as described for in-plan assets. The decrease in advisory and brokerage assets of $1.4 billion was driven by equity market declines partially offset by net new client deposit growth.
2021 to 2020 AUMA Comparison
In-plan assets increased by $5.5 billion primarily driven by equity market growth, contributing to an increase in fee based AUMA. Out-of-plan proprietary annuity assets increased by $1.0 billion primarily driven by equity market growth in the period. Increase in advisory and brokerage assets of $3.2 billion, or 30%, was driven by strong net new client deposits, along with favorable equity markets.
ITEM 7 | Business Segment Operations
Spread and Fee Income
The following table presents Group Retirement spread and fee income:
| | | | | | | | | | | | | | | | | | | | | | | | | | |
| | | | Years Ended December 31, |
| (in millions) | | | | | | 2022 | | 2021 | | 2020 | | |
| Spread income: | | | | | | | | | | | | |
| Base portfolio income | | | | | | $ | 1,882 | | | $ | 1,905 | | | $ | 1,924 | | | |
Interest credited to policyholder account balances(a) | | | | | | (1,133) | | | (1,144) | | | (1,125) | | | |
| Base spread income | | | | | | 749 | | | 761 | | | 799 | | | |
| Variable investment income, excluding affordable housing | | | | | | 118 | | | 424 | | | 215 | | | |
| Affordable housing | | | | | | — | | | 84 | | | 74 | | | |
Total spread income(b) | | | | | | $ | 867 | | | $ | 1,269 | | | $ | 1,088 | | | |
| Fee income: | | | | | | | | | | | | |
Policy fees(a) | | | | | | $ | 415 | | | $ | 480 | | | $ | 443 | | | |
| Advisory fees and other income | | | | | | 305 | | | 337 | | | 272 | | | |
| Total fee income | | | | | | $ | 720 | | | $ | 817 | | | $ | 715 | | | |
(a) The results for the years ended December 31, 2022 and 2021 have been updated to reflect the adoption of LDTI. No updates have been made to the results for the year ended December 31, 2020 as our effective date for LDTI adoption was January 1, 2021.
(b) Excludes amortization of DSI assets of $14 million, $15 million and $0 million for the years ended December 31, 2022, 2021 and 2020, respectively.
| | | | | | | | | | | | | | | | | | | | | | | | | | |
| | | | Years Ended December 31, |
| | | | | | 2022 | | 2021 | | 2020 | | |
| Base net investment spread: | | | | | | | | | | | | |
Base yield* | | | | | | 4.04 | % | | 4.11 | % | | 4.26 | % | | |
| Cost of funds | | | | | | 2.60 | | | 2.62 | | | 2.65 | | | |
| Base net investment spread | | | | | | 1.44 | % | | 1.49 | % | | 1.61 | % | | |
* Includes returns from base portfolio, including accretion and income (loss) from certain other invested assets.
2022 to 2021 Comparison
See “—Financial Highlights”
2021 to 2020 Comparison
See “—Financial Highlights”
Premiums and Deposits and Net Flows
For Group Retirement, premiums primarily represent amounts received on life-contingent payout annuities while deposits represent sales on investment-oriented products.
Net flows for annuity products included in Group Retirement represent premiums and deposits less death, surrender and other withdrawal benefits. Net flows for mutual funds represent deposits less withdrawals. For Group Retirement, client deposits into advisory and brokerage accounts less total client withdrawals from advisory and brokerage accounts are not included in net flows. Net new assets into these products contribute to growth in AUA rather than AUM.
| | | | | | | | | | | | | | | | | | | | | | | | | | |
| Premiums and Deposits and Net Flows | | | | Years Ended December 31, |
| (in millions) | | | | | | 2022 | | 2021 | | 2020 | | |
In-plan(a)(b) | | | | | | $ | 5,818 | | | $ | 5,911 | | | $ | 5,412 | | | |
| Out-of-plan proprietary variable annuity | | | | | | 975 | | | 1,288 | | | 1,420 | | | |
| Out-of-plan proprietary fixed and index annuities | | | | | | 1,149 | | | 567 | | | 664 | | | |
Premiums and deposits(c) | | | | | | $ | 7,942 | | | $ | 7,766 | | | $ | 7,496 | | | |
| Net Flows | | | | | | $ | (3,111) | | | $ | (3,208) | | | $ | (1,940) | | | |
(a) In-plan premium and deposits include sales of variable and fixed annuities as well as mutual funds for 403(b), 401(a), 457(b) and 401(k) plans.
(b) Includes inflows related to in-plan mutual funds of $3.5 billion, $3.1 billion and $3.0 billion for the years ended December 31, 2022, 2021 and 2020, respectively.
(c) Excludes client deposits into advisory and brokerage accounts of $2.1 billion, $2.5 billion and $1.4 billion for the years ended December 31, 2022, 2021 and 2020, respectively.
2022 to 2021 Comparison
Net flows remained negative but improved by $97 million primarily due to:
ITEM 7 | Business Segment Operations
•increase in deposits of $176 million mainly driven by higher out-of-plan fixed annuity due to higher interest rates, partially offset by lower out-of-plan variable annuity due to market volatility.
Partially offset by:
•increase in surrenders and withdrawals of $49 million, driven by higher than expected surrenders and partial withdrawals within the fixed and variable annuity segments; and
•increase in death and payout benefit annuity benefits of $30 million.
2021 to 2020 Comparison
Net flows remained negative and declined by $1.3 billion primarily due to:
•higher individual surrenders, withdrawals and death benefits driven mainly by higher customer account values of $1.6 billion.
Partially offset by:
•large group activity which contributed net negative flows of $0.1 billion compared to $0.4 billion of net negative flows in the same period in the prior year.
Surrenders
The following table presents Group Retirement surrender rates:
| | | | | | | | | | | | | | | | | | | | | | | | | | |
| | | | Years Ended December 31, |
| | | | | | 2022 | | 2021 | | 2020 | | |
| Surrenders rates* | | | | | | 9.5 | % | | 8.8 | % | | 8.6 | % | | |
* The results for the years ended December 31, 2022 and 2021 have been updated to reflect the adoption of LDTI. No updates have been made to the results for the year ended December 31, 2020 as our effective date for LDTI adoption was January 1, 2021.
The following table presents account value for Group Retirement annuities by surrender charge category:
| | | | | | | | | | | | | | | | | | | | | | | | | | | | | |
| | December 31, |
| (in millions) | | 2022 | (a) | | 2021 | (a) | | 2020 | (a) |
No surrender charge(b) | | $ | 69,885 | | | | $ | 80,725 | | | | $ | 76,980 | | |
| Greater than 0% - 2% | | 454 | | | | 711 | | | | 561 | | |
| Greater than 2% - 4% | | 435 | | | | 854 | | | | 823 | | |
| Greater than 4% | | 6,281 | | | | 6,139 | | | | 6,077 | | |
| Non-surrenderable | | 945 | | | | 802 | | | | 821 | | |
Total account value(c) | | $ | 78,000 | | | | $ | 89,231 | | | | $ | 85,262 | | |
(a)Excludes mutual fund assets under administration of $24.0 billion, $28.8 billion and $25.0 billion at December 31, 2022, December 31, 2021 and December 31, 2020, respectively.
(b)Group Retirement amounts in this category include general account reserves of approximately $4.5 billion, $4.7 billion and $4.7 billion at December 31, 2022, 2021 and 2020, respectively, which are subject to 20% annual withdrawal limitations at the participant level and general account reserves of $5.8 billion,$5.7 billion and $5.2 billion at December 31, 2022, 2021 and 2020, respectively, which are subject to 20% annual withdrawal limitations at the plan level.
(c)Includes payout immediate annuities and funding agreements.
Group Retirement annuity deposits are typically subject to a five- to seven-year surrender charge period, depending on the product. In addition, for annuity assets held within an employer defined contribution plan, participants can only withdraw funds in certain circumstances without incurring tax penalties (for example, separation from service), regardless of surrender charges. At December 31, 2022, Group Retirement annuities account value with no surrender charge decreased compared to December 31, 2021 primarily due to a decline in assets under management from lower equity markets.
ITEM 7 | Business Segment Operations
Life Insurance
Life Insurance Results
| | | | | | | | | | | | | | | | | | | | | | | | | | |
| | | | Years Ended December 31, |
| (in millions) | | | | | | 2022 | | 2021 | | 2020 | | |
| Revenues: | | | | | | | | | | | | |
Premiums(a) | | | | | | $ | 1,864 | | | $ | 1,586 | | | $ | 1,526 | | | |
Policy fees(a) | | | | | | 1,564 | | | 1,541 | | | 1,384 | | | |
| Net investment income: | | | | | | | | | | | | |
| Base portfolio income | | | | | | 1,282 | | | 1,246 | | | 1,290 | | | |
Variable investment income(b) | | | | | | 107 | | | 375 | | | 242 | | | |
| Net investment income | | | | | | 1,389 | | | 1,621 | | | 1,532 | | | |
| Other income | | | | | | 121 | | | 110 | | | 94 | | | |
| Total adjusted revenues | | | | | | 4,938 | | | 4,858 | | | 4,536 | | | |
| Benefits and expenses: | | | | | | | | | | | | |
Policyholder benefits(a) | | | | | | 3,010 | | | 2,842 | | | 3,219 | | | |
| | | | | | | | | | | | |
| | | | | | | | | | | | |
| | | | | | | | | | | | |
| Interest credited to policyholder account balances | | | | | | 342 | | | 354 | | | 373 | | | |
Amortization of deferred policy acquisition costs(a) | | | | | | 410 | | | 416 | | | 25 | | | |
Non-deferrable insurance commissions(a) | | | | | | 72 | | | 80 | | | 119 | | | |
| Advisory fee expenses | | | | | | 1 | | | — | | | — | | | |
| General operating expenses | | | | | | 656 | | | 682 | | | 624 | | | |
| Interest expense | | | | | | — | | | 25 | | | 30 | | | |
| Total benefits and expenses | | | | | | 4,491 | | | 4,399 | | | 4,390 | | | |
| Adjusted pre-tax operating income | | | | | | $ | 447 | | | $ | 459 | | | $ | 146 | | | |
(a) The results for the years ended December 31, 2022 and 2021 have been updated to reflect the adoption of LDTI. No updates have been made to the results for the year ended December 31, 2020 as our effective date for LDTI adoption was January 1, 2021.
(b) Includes income from affordable housing of $59 million and $52 million for the years ended December 31, 2021 and 2020, respectively.
Life Insurance Sources of Earnings
The following table presents the sources of earnings of the Life Insurance segment. We believe providing APTOI using this view is useful for gaining an understanding of our overall results of operations and the significant drivers of our earnings.
| | | | | | | | | | | | | | | | | | | | | | | | | | |
| | | | Years Ended December 31, |
| (in millions) | | | | | | 2022 | | 2021 | | 2020 | | |
Underwriting margin(a)(b) | | | | | | $ | 1,561 | | | $ | 1,614 | | | $ | 1,261 | | | |
| General operating expenses | | | | | | (656) | | | (682) | | | (624) | | | |
Non-deferrable insurance commissions(b) | | | | | | (72) | | | (80) | | | (119) | | | |
Amortization of DAC(b) | | | | | | (410) | | | (416) | | | (234) | | | |
Impact of annual actuarial assumption update(b) | | | | | | 25 | | | 48 | | | (108) | | | |
Other(c) | | | | | | (1) | | | (25) | | | (30) | | | |
| Adjusted pre-tax operating income (loss) | | | | | | $ | 447 | | | $ | 459 | | | $ | 146 | | | |
(a) Underwriting margin represents premiums, policy fees, net investment income and other income, less policyholder benefits and interest credited to policyholder account balances. Underwriting margin is also exclusive of the impacts from the annual assumption update.
(b) The results for the years ended December 31, 2022 and 2021 have been updated to reflect the adoption of LDTI. No updates have been made to the results for the year ended December 31, 2020 as our effective date for LDTI adoption was January 1, 2021.
(c) Other primarily represents interest expense and advisory fee expenses.
Financial Highlights
2022 to 2021 APTOI Comparison
APTOI decreased $12 million, primarily due to:
•lower underwriting margin of $53 million from:
–lower net investment income, net of interest credited of $220 million driven by $268 million lower variable investment income reflecting lower gains on call and tender income and reduced alternatives performance partially offset by $48 million higher base portfolio income, net of interest credited, driven by lower yields.
partially offset by:
ITEM 7 | Business Segment Operations
–higher premiums and fees, net of policyholder benefits, excluding actuarial assumption updates, of $156 million, driven by favorable mortality; and
•lower favorable impact from the review and update of actuarial assumptions of $23 million.
Partially offset by:
•lower general operating expenses of $26 million.
2021 to 2020 APTOI Comparison
The 2020 results are presented on a pre-LDTI basis.
APTOI increased $313 million, primarily due to:
•$353 million higher underwriting margin driven by lower mortality impacts, and $89 million in higher net investment income primarily driven by $133 million higher variable investment income reflecting higher gains on calls and alternative investments partially offset by $44 million lower base portfolio income driven by reduced bond yields.
Partially offset by:
•lower favorable impact from the review and update of actuarial assumptions of $48 million in 2021 compared to $108 million unfavorable in the prior year.
AUMA
The following table presents Life Insurance AUMA:
| | | | | | | | | | | | | | | | | | | | |
| | December 31, |
| (in millions) | | 2022 | | 2021 | | 2020 |
| Total AUMA | | $ | 27,760 | | | $ | 34,355 | | | $ | 34,781 | |
2022 to 2021 AUMA Comparison
AUMA decreased $6.6 billion in the year ended December 31, 2022 compared to the prior year-end due to net unrealized losses from fixed maturity securities driven by higher rates and a widening of credit spreads.
2021 to 2020 AUMA Comparison
AUMA decreased $0.4 billion in the year ended December 31, 2021 compared to the prior year as net unrealized losses from fixed maturity securities driven by higher rates, were only partially offset by growth in the Life Insurance businesses.
Underwriting Margin
The following table presents Life Insurance underwriting margin:
| | | | | | | | | | | | | | | | | | | | | | | | |
| | | | Years Ended December 31, |
| (in millions) | | | | | | 2022 | | 2021 | | 2020 |
| Premiums* | | | | | | $ | 1,864 | | | $ | 1,586 | | | $ | 1,526 | |
| Policy fees* | | | | | | 1,564 | | | 1,541 | | | 1,384 | |
| Net investment income | | | | | | 1,389 | | | 1,621 | | | 1,532 | |
| Other income | | | | | | 121 | | | 110 | | | 94 | |
| Policyholder benefits* | | | | | | (3,010) | | | (2,842) | | | (3,219) | |
| Interest credited to policyholder account balances | | | | | | (342) | | | (354) | | | (373) | |
| Less: Impact of annual actuarial assumption update* | | | | | | (25) | | | (48) | | | 317 | |
| Underwriting margin | | | | | | $ | 1,561 | | | $ | 1,614 | | | $ | 1,261 | |
* The results for the years ended December 31, 2022 and 2021 have been updated to reflect the adoption of LDTI. No updates have been made to the results for the year ended December 31, 2020 as our effective date for LDTI adoption was January 1, 2021.
2022 to 2021 Comparison
See “—Financial Highlights”
2021 to 2020 Comparison
See “—Financial Highlights”
ITEM 7 | Business Segment Operations
Premiums and Deposits
Premiums and Deposits for Life Insurance represent amounts received on life and health policies. Premiums generally represent amounts received on traditional life products, while deposits represent amounts received on universal life products.
| | | | | | | | | | | | | | | | | | | | | | | | |
| | | | Years Ended December 31, |
| (in millions) | | | | | | 2022 | | 2021 | | 2020 |
| Traditional Life | | | | | | $ | 1,820 | | | $ | 1,804 | | | $ | 1,772 | |
| Universal Life | | | | | | 1,600 | | | 1,635 | | | 1,649 | |
| | | | | | | | | | |
| Total U.S. | | | | | | 3,420 | | | 3,439 | | | 3,421 | |
| International | | | | | | 816 | | | 789 | | | 626 | |
| Premiums and deposits | | | | | | $ | 4,236 | | | $ | 4,228 | | | $ | 4,047 | |
2022 to 2021 Comparison
Premiums and deposits, excluding the effect of foreign exchange, increased $89 million in 2022 compared to the prior year primarily due to growth in international life premiums.
2021 to 2020 Comparison
Premiums and deposits, excluding the effect of foreign exchange, increased $134 million in 2021 compared to the prior year primarily due to growth in international life premiums.
ITEM 7 | Business Segment Operations
Institutional Markets
Institutional Markets Results
| | | | | | | | | | | | | | | | | | | | | | | | | | |
| | | | Years Ended December 31, |
| (in millions) | | | | | | 2022 | | 2021 | | 2020 | | |
| Revenues: | | | | | | | | | | | | |
| Premiums | | | | | | $ | 2,913 | | | $ | 3,774 | | | $ | 2,564 | | | |
| Policy fees | | | | | | 194 | | | 187 | | | 186 | | | |
| Net investment income: | | | | | | | | | | | | |
| Base portfolio income | | | | | | 995 | | | 865 | | | 827 | | | |
Variable investment income(a) | | | | | | 54 | | | 290 | | | 104 | | | |
| Net investment income | | | | | | 1,049 | | | 1,155 | | | 931 | | | |
| Other income | | | | | | 2 | | | 2 | | | 1 | | | |
| Total adjusted revenues | | | | | | 4,158 | | | 5,118 | | | 3,682 | | | |
| Benefits and expenses: | | | | | | | | | | | | |
Policyholder benefits(b) | | | | | | 3,404 | | | 4,183 | | | 2,886 | | | |
| | | | | | | | | | | | |
| | | | | | | | | | | | |
| | | | | | | | | | | | |
| Interest credited to policyholder account balances | | | | | | 320 | | | 274 | | | 303 | | | |
Amortization of deferred policy acquisition costs(b) | | | | | | 7 | | | 6 | | | 5 | | | |
Non-deferrable insurance commissions(b) | | | | | | 20 | | | 22 | | | 31 | | | |
| General operating expenses | | | | | | 73 | | | 77 | | | 79 | | | |
| Interest expense | | | | | | — | | | 9 | | | 11 | | | |
| Total benefits and expenses | | | | | | 3,824 | | | 4,571 | | | 3,315 | | | |
| Adjusted pre-tax operating income | | | | | | $ | 334 | | | $ | 547 | | | $ | 367 | | | |
(a) Includes income from affordable housing of $21 million and $19 million for the years ended December 31, 2021 and 2020, respectively.
(b) The results for the years ended December 31, 2022 and 2021 have been updated to reflect the adoption of LDTI.
Institutional Markets Sources of Earnings
The following table presents the sources of earnings of the Institutional Markets segment. We believe providing APTOI using this view is useful for gaining an understanding of our overall results of operations and the significant drivers of our earnings.
| | | | | | | | | | | | | | | | | | | | | | | | | | |
| | | | Years Ended December 31, |
| (in millions) | | | | | | 2022 | | 2021 | | 2020 | | |
Spread income(a)(e) | | | | | | $ | 285 | | | $ | 487 | | | $ | 350 | | | |
Fee income(b) | | | | | | 63 | | | 61 | | | 62 | | | |
Underwriting margin(c)(e) | | | | | | 77 | | | 102 | | | 75 | | | |
Non-deferrable insurance commissions(e) | | | | | | (20) | | | (22) | | | (31) | | | |
| General operating expenses | | | | | | (73) | | | (77) | | | (79) | | | |
Other(d)(e) | | | | | | 2 | | | (4) | | | (10) | | | |
| Adjusted pre-tax operating income | | | | | | $ | 334 | | | $ | 547 | | | $ | 367 | | | |
(a) Represents spread income on GIC, PRT and structured settlement products.
(b) Represents fee income on SVW products.
(c) Represents underwriting margin from Corporate Markets products, including COLI-BOLI, private placement variable universal life insurance and private placement variable annuity products.
(d) Includes net investment income on SVW products of $5 million, $11 million and $7 million for the years ended December 31, 2022, 2021 and 2020, respectively.
(e) The results for the years ended December 31, 2022 and 2021 have been updated to reflect the adoption of LDTI.
Financial Highlights
2022 to 2021 APTOI Comparison
APTOI decreased $213 million primarily due to:
•lower spread income of $202 million driven by $196 million lower variable investment income including both private equity and call and tender income; and
•lower underwriting margin of $25 million driven by lower variable investment income primarily call and tender income.
2021 to 2020 APTOI Comparison
The 2020 results are presented on a pre-LDTI basis.
APTOI increased $180 million primarily due to:
ITEM 7 | Business Segment Operations
•higher spread income of $137 million due to $153 million higher variable investment income, including both private equity and call and tender income, and $16 million lower base spread; and
•$27 million higher underwriting margin primarily due to higher variable investment income.
AUMA
The following table presents Institutional Markets AUMA:
| | | | | | | | | | | | | | | | | | | | | | | | |
| | December 31, |
| (in millions) | | 2022 | | 2021 | | 2020 | | | | |
| SVW (AUA) | | $ | 47,078 | | $ | 43,830 | | $ | 43,310 | | | | |
| GIC, PRT and Structured settlements (AUM) | | 23,096 | | 23,863 | | 21,910 | | | | |
| All other (AUM) | | 7,590 | | | 8,810 | | | 8,457 | | | | | |
| Total AUMA | | $ | 77,764 | | | $ | 76,503 | | | $ | 73,677 | | | | | |
2022 to 2021 AUMA Comparison
AUMA increased $1.3 billion, primarily due to premiums and deposits of PRT and GIC products of $4.3 billion and net inflows of $2.4 billion into SVW products, partially offset by the impact of the recent interest rate environment on asset valuations across the Institutional Markets businesses of $3.7 billion and benefit payments on the PRT, GIC and structured settlement products of $1.7 billion.
2021 to 2020 AUMA Comparison
AUMA increased $2.8 billion, primarily due to premiums and deposits of PRT and GIC products of $5.0 billion and higher SVW notional driven by growth in underlying assets of $0.8 billion, partially offset by benefit payments, contract maturities and other outflows of $2.7 billion and net outflows from plan sponsors and plan participants of $0.3 billion.
Spread Income, Fee Income and Underwriting Margin
The following table presents Institutional Markets spread income, fee income and underwriting margin:
| | | | | | | | | | | | | | | | | | | | | | | | | | |
| | | | Years Ended December 31, |
| (in millions) | | | | | | 2022 | | 2021 | | 2020 | | |
| Premiums | | | | | | $ | 2,950 | | | $ | 3,810 | | | $ | 2,600 | | | |
| Net investment income | | | | | | $ | 901 | | | $ | 969 | | | $ | 777 | | | |
Policyholder benefits(c) | | | | | | (3,352) | | | (4,126) | | | (2,833) | | | |
| Interest credited to policyholder account balances | | | | | | (213) | | | (166) | | | (195) | | | |
Less: Impact of annual actuarial assumption update(c) | | | | | | (1) | | | — | | | 1 | | | |
Total spread income(a) | | | | | | $ | 285 | | | $ | 487 | | | $ | 350 | | | |
| SVW fees | | | | | | 63 | | | 61 | | | 62 | | | |
| Total fee income | | | | | | $ | 63 | | | $ | 61 | | | $ | 62 | | | |
| Premiums | | | | | | (37) | | | (35) | | | (36) | | | |
| Policy fees (excluding SVW) | | | | | | 131 | | | 126 | | | 124 | | | |
| Net investment income | | | | | | 143 | | | 175 | | | 147 | | | |
| Other income | | | | | | 2 | | | 1 | | | 1 | | | |
| Policyholder benefits | | | | | | (52) | | | (57) | | | (53) | | | |
| Interest credited to policyholder account balances | | | | | | (107) | | | (108) | | | (108) | | | |
| Less: Impact of annual actuarial assumption update | | | | | | (3) | | | — | | | — | | | |
Total underwriting margin(b) | | | | | | $ | 77 | | | $ | 102 | | | $ | 75 | | | |
(a)Represents spread income from GIC, PRT and structured settlement products.
(b)Represents underwriting margin from Corporate Markets products, including COLI-BOLI, private placement variable universal life insurance and private placement variable annuity products.
(c)The results for the years ended December 31, 2022 and 2021 have been updated to reflect the adoption of LDTI.
2022 to 2021 Comparison
See “—Financial Highlights”
2021 to 2020 Comparison
See “—Financial Highlights”
ITEM 7 | Business Segment Operations
Premiums and Deposits
The following table presents the Institutional Markets premiums and deposits:
| | | | | | | | | | | | | | | | | | | | | | | | | | |
| | | | Years Ended December 31, |
| (in millions) | | | | | | 2022 | | 2021 | | 2020 | | |
| PRT | | | | | | $ | 2,749 | | | $ | 3,667 | | | $ | 2,344 | | | |
| GICs | | | | | | 1,000 | | | 1,000 | | | 2,124 | | | |
| Other* | | | | | | 576 | | | 290 | | | 405 | | | |
| Premiums and deposits | | | | | | $ | 4,325 | | | $ | 4,957 | | | $ | 4,873 | | | |
*Other principally consists of structured settlements, Corporate Markets and SVW product.
2022 to 2021 Comparison
Premiums and deposits decreased compared to the prior year period by $632 million, primarily due to lower premiums on new PRT business of $918 million partially offset by higher premiums on sales of structured settlement annuities of $294 million.
2021 to 2020 Comparison
Premiums and deposits increased in 2021 compared to the prior year by $84 million, primarily due to higher sales of PRT of $1.3 billion, partially offset by lower issuance of GICs of $1.1 billion and lower structured settlements of $116 million.
Corporate and Other
Corporate and Other primarily consists of interest expense on financial debt, parent expenses not attributable to other segments, institutional asset management business, which includes managing assets for non-consolidated affiliates, results of our consolidated investment entities, results of our legacy insurance lines ceded to Fortitude Re and intercompany eliminations.
Corporate and Other Results
| | | | | | | | | | | | | | | | | | | | | | | | | | | | |
| | | | Years Ended December 31, |
| (in millions) | | | | | | 2022 | | 2021 | | 2020 | | | | |
| Revenues: | | | | | | | | | | | | | | |
Premiums(a) | | | | | | $ | 82 | | | $ | 86 | | | $ | 74 | | | | | |
| Net investment income | | | | | | 473 | | | 443 | | | 346 | | | | | |
| Net realized gains on real estate investments | | | | | | 170 | | | 701 | | | 54 | | | | | |
| Other income | | | | | | 121 | | | 134 | | | 122 | | | | | |
| Total adjusted revenues | | | | | | 846 | | | 1,364 | | | 596 | | | | | |
| Benefits and expenses: | | | | | | | | | | | | | | |
| Non-deferrable insurance commissions | | | | | | 2 | | | 3 | | | 3 | | | | | |
| General operating expenses: | | | | | | | | | | | | | | |
Corporate and other(a)(b) | | | | | | 241 | | | 220 | | | 179 | | | | | |
Asset management(c) | | | | | | 143 | | | 155 | | | 130 | | | | | |
| Total general operating expenses | | | | | | 384 | | | 375 | | | 309 | | | | | |
| Interest expense: | | | | | | | | | | | | | | |
| Corporate | | | | | | 299 | | | 57 | | | 50 | | | | | |
Asset Management and other(d) | | | | | | 236 | | | 229 | | | 274 | | | | | |
| Total interest expense | | | | | | 535 | | | 286 | | | 324 | | | | | |
| Total benefits and expenses | | | | | | 921 | | | 664 | | | 636 | | | | | |
Noncontrolling interest(e) | | | | | | (320) | | | (861) | | | (194) | | | | | |
| Adjusted pre-tax operating loss before consolidation and eliminations | | | | | | (395) | | | (161) | | | (234) | | | | | |
| Consolidations and eliminations | | | | | | 12 | | | (2) | | | (2) | | | | | |
| Adjusted pre-tax operating loss | | | | | | $ | (383) | | | $ | (163) | | | $ | (236) | | | | | |
(a)Premiums include an expense allowance associated with Fortitude Re which is entirely offset in general and operating expenses – Corporate and other.
(b)General and operating expenses – Corporate and other include expenses incurred by AIG which were not billed to Corebridge. These amounts were $143 million and $103 million for the years ended December 31, 2021 and 2020, respectively. As part of separation in 2022, these expenses are now directly incurred by Corebridge.
(c)General operating expenses – Asset management primarily represent the costs to manage the investment portfolio for affiliates that are not included in the consolidated financial statements of Corebridge.
(d)Interest expense – Asset Management relates to consolidated investment entities, the VIEs, for which we are the primary beneficiary; however, creditors or beneficial interest holders of VIEs generally only have recourse to the assets and cash flows of the VIEs and do not have recourse to us except in limited circumstances when we have provided a guarantee to the VIE’s interest holders. As of December 31, 2021, the VIEs for which Corebridge previously provided guarantees have been terminated. Interest expense on consolidated investment entities was $216 million and $257 million for the years ended December 31, 2021 and 2020, respectively.
(e)Noncontrolling interests represent the third party or Corebridge affiliated interest in internally managed consolidated investment vehicles and are almost entirely offset within net investment income, net realized gains (losses) and interest expense.
ITEM 7 | Business Segment Operations
Corporate and Other Sources of Earnings
The following table presents the sources of earnings of the Corporate and Other segment. We believe providing APTOI using this view is useful for gaining an understanding of our overall results of operations and the significant drivers of our earnings. | | | | | | | | | | | | | | | | | | | | | | | | | | | | |
| | | | Years Ended December 31, |
| (in millions) | | | | | | 2022 | | 2021 | | 2020 | | | | |
| Corporate expenses | | | | | | $ | (160) | | | $ | (143) | | | $ | (103) | | | | | |
| Interest expense on financial debt | | | | | | (299) | | | (57) | | | (50) | | | | | |
| Asset Management | | | | | | 38 | | | 30 | | | (15) | | | | | |
Consolidated investment entities(a) | | | | | | 24 | | | 19 | | | (62) | | | | | |
Other(b)(c) | | | | | | 14 | | | (12) | | | (6) | | | | | |
| Adjusted pre-tax operating income (loss) | | | | | | $ | (383) | | | $ | (163) | | | $ | (236) | | | | | |
(a) Includes $(25) million and $(88) million for the years ended December 31, 2021 and 2020, respectively of APTOI attributable to six transactions AIG entered into between 2012 and 2014 which securitized portfolios of certain debt securities, the majority of which were previously owned by Corebridge. During the year ended December 31, 2021, all six transactions were terminated. See Note 9 to our audited annual consolidated financial statements.
(b) Includes $56 million for the year ended December 31, 2022 related to Corebridge’s ownership interest in Fortitude Re Bermuda, which is recorded using the measurement alternative for equity securities. Our investment in Fortitude Re Bermuda totaled $156 million and $100 million at December 31, 2022 and December 31, 2021, respectively.
(c) Includes $(32) million for the year ended December 31, 2022 related to non-recurring losses associated with the unwind of internal securitizations with AIG as part of separation
Financial Highlights
2022 to 2021 APTOI Comparison
Adjusted pre-tax operating loss of $383 million in 2022 compared to an adjusted pre-tax operating loss of $163 million in 2021, an unfavorable change of $220 million, was primarily due to:
•higher interest expense on financial debt of $242 million primarily due to the issuance of senior unsecured notes, hybrid junior subordinated notes and borrowing under our Three-Year DDTL Facility in 2022 totaling $9.0 billion and the interest expense from the $8.3 billion affiliated promissory note to AIG. We used a portion of the proceeds from the debt issuances to repay the $8.3 billion affiliated promissory note to AIG. For more information on these transactions, see Note 15 to our audited annual consolidated financial statements.
Partially offset by:
•favorable change from other sources of earnings of $26 million primarily due to a $56 million gain related to a change in value of our minority investment in Fortitude Re partially offset by net investment losses from certain legacy investments.
2021 to 2020 APTOI Comparison
Adjusted pre-tax operating loss of $163 million in 2021 compared to an adjusted pre-tax operating loss of $236 million in 2020; this favorable change of $73 million was primarily due to:
•higher income from consolidated investment entities of $81 million primarily from lower interest expense on certain consolidated investment entities which were terminated during 2021 as well as gains in certain consolidated real estate investment funds; and
•higher income from legacy investments held outside of the investment insurance companies.
Partially offset by:
•higher parent expenses of $40 million primarily due to an increase in expenses related to AIG which were not billed to Corebridge.
Investments
OVERVIEW
Our investment strategies are tailored to the specific business needs of each operating unit by targeting an asset allocation mix that supports estimated cash flows of our outstanding liabilities and provides diversification from asset class, sector, issuer and geographic perspectives. The primary objectives are generation of investment income, preservation of capital, liquidity management and growth of surplus. The majority of assets backing our insurance liabilities consist of fixed maturity securities, RMBS, CMBS, CLOs, other ABS and fixed maturity securities issued by government-sponsored entities and corporate entities. At December 31, 2022, for $186.5 billion of invested assets supporting our insurance operating companies, approximately 48% are in corporate debt securities with no one industry representing more than 26%. Mortgage- backed securities (“MBS”), ABS and CLOs represent 29% of our fixed income securities and 99% are investment grade. Approximately 27% is rated BBB, BBB+ or BBB-, of which, 83% is rated BBB or BBB+. At December 31, 2021, for $212.5 billion of invested assets supporting our insurance operating companies, approximately 54% are in corporate debt securities with no one industry representing more than 25%. MBS, ABS and CLOs represent 24% of our fixed income securities and 98% are investment grade.
See “Business—Investment Management” for further information, including current and future management of our investment portfolio.
Key Investment Strategies
Investment strategies are assessed at the segment level and involve considerations that include local and general market conditions, duration and cash flow management, risk appetite and volatility constraints, rating agency and regulatory capital considerations, and tax and legal investment limitations.
In November 2021, we entered into a strategic partnership with Blackstone that we believe has the potential to yield significant economic and strategic benefits over time. We believe that Blackstone’s ability to originate attractive and privately sourced, fixed-income oriented assets, will be accretive to our businesses and provide us with an enhanced competitive advantage.
Pursuant to the partnership, we initially transferred management of $50 billion of our existing investment portfolio. Beginning in the fourth quarter of 2022, we transferred an additional $2.1 billion to Blackstone. The amount managed by Blackstone will increase to $92.5 billion by the third quarter of 2027.
As of December 31, 2022, the book value of the assets transferred to Blackstone was $48.9 billion. We expect Blackstone to invest these assets primarily in Blackstone-originated investments across a range of asset classes, including private and structured credit, and commercial and residential real estate securitized and whole loans. Blackstone’s preferred credit and lending strategy is to seek to control all significant components of the underwriting and pricing processes with the goal of facilitating bespoke opportunities with historically strong credit protection and attractive risk-adjusted returns. Blackstone seeks to capture enhanced economics to those available in the traditional fixed income markets by going directly to the lending source.
As described above, Blackstone currently manages a portfolio of private and structured credit assets, commercial and residential real estate securitized and whole loans for Corebridge. We believe Blackstone is well-positioned to add value and drive new originations across credit and real estate asset classes. We continue to manage asset allocation and portfolio-level risk management decisions with respect to any assets managed by Blackstone, ensuring that we maintain a consistent level of oversight across our entire investment portfolio considering our asset-liability matching needs, risk appetite and capital positions.
Under the investment management agreements with BlackRock, we have completed the transfer of the management of approximately $82.4 billion in book value of liquid fixed income and certain private placement assets in the aggregate to BlackRock as of December 31, 2022. In addition, liquid fixed income assets associated with Fortitude Re portfolio were separately transferred to BlackRock. The investment management agreements contain detailed investment guidelines and reporting requirements. These agreements also contain reasonable and customary representations and warranties, standard of care, expense reimbursement, liability, indemnity and other provisions.
Some of our key investment strategies are as follows:
•our fundamental strategy across the portfolios is to seek investments with characteristics similar to the associated insurance liabilities to the extent practicable;
•we seek to purchase investments that offer enhanced yield through illiquidity premiums, such as private placements and commercial mortgage loans, which also add portfolio diversification. These assets typically afford stronger credit protections through financial covenants, ability to customize structures that meet our insurance liability needs and deeper due diligence;
•we seek investments that provide diversification from local markets. To the extent we purchase these investments, we generally hedge any currency risk using derivatives, which could provide opportunities to earn higher risk-adjusted returns compared to investments in the functional currency;
•we actively manage our assets and liabilities, counterparties and duration. Our liquidity sources are held primarily in the form of cash, short-term investments and publicly traded, investment-grade rated fixed maturity securities that can be readily monetized through sales or repurchase agreements. Certain of our subsidiaries are members of the Federal Home Loan Banks in their respective districts, and we borrow from the FHLB utilizing its funding agreement program. Borrowings from FHLBs are used to supplement liquidity or for other uses deemed appropriate by management. This strategy allows us to both diversify our sources of liquidity and reduce the cost of maintaining sufficient liquidity;
•within the United States, investments are generally split between reserve-backing and surplus portfolios:
–insurance liabilities are backed mainly by investment-grade fixed maturity securities that meet our duration, risk-return, tax liquidity, credit quality and diversification objectives. We assess asset classes based on their fundamental underlying risk factors, including credit (public and private), commercial real estate and residential real estate, regardless of whether such investments are bonds, loans or structured products; and
–surplus investments seek to enhance portfolio returns and generally comprise a mix of fixed maturity investment grade and below-investment-grade securities and various alternative asset classes, including private equity, real estate equity and hedge funds. Over the past few years, hedge fund investments have been reduced with more emphasis given to private equity, real estate and below-investment-grade credit; and
•outside of the United States, fixed maturity securities held by our insurance companies consist primarily of investment-grade securities generally denominated in the currencies of the countries in which we operate.
Asset Liability Management
Our investment strategy is to provide net investment income to back policyholder benefit and deposit liabilities that result in stable distributable earnings and enhance portfolio value, subject to asset-liability management, capital, liquidity and regulatory constraints.
We use asset-liability management as a primary tool to monitor and manage interest and duration risk in our businesses. We maintain a diversified, high to medium quality portfolio of fixed maturity securities issued by corporations, municipalities and other governmental agencies; structured securities collateralized by, among other assets, residential and commercial real estate; and commercial mortgage loans that, to the extent practicable, match the duration characteristics of the liabilities. We seek to diversify the portfolio across asset classes, sectors and issuers to mitigate idiosyncratic portfolio risks. The investment portfolio of each product line is tailored to the specific characteristics of its insurance liabilities, and as a result, duration varies between distinct portfolios. The interest rate environment has a direct impact on the asset liability management profile of the businesses, and changes in the interest rate environment may result in the need to lengthen or shorten the duration of the portfolio. In a rising rate environment, we may shorten the duration of the investment portfolio.
Fixed maturity securities of our domestic operations have an average duration of 7.2 years as of December 31, 2022.
In addition, we seek to enhance surplus portfolio returns through investments in a diversified portfolio of alternative investments. Although these alternative investments are subject to earnings fluctuations, they have historically achieved accumulative returns over time in excess of the fixed maturity portfolio returns.
Investment Portfolio
The following table presents carrying amounts of our total investments:
| | | | | | | | | | | | | | | | | | | | |
| (in millions) | | Excluding Fortitude Re Funds Withheld Assets | | Fortitude Re Funds Withheld Assets | | Total |
| December 31, 2022 | | | | | | |
| Bonds available for sale: | | | | | | |
| U.S. government and government-sponsored entities | | $ | 925 | | $ | 273 | | $ | 1,198 |
| Obligations of states, municipalities and political subdivisions | | 5,195 | | 731 | | 5,926 |
Non-U.S. governments(a) | | 3,977 | | 415 | | 4,392 |
Corporate debt(a) | | 91,939 | | 12,753 | | 104,692 |
| Mortgage-backed, asset-backed and collateralized: | | | | | | |
| RMBS | | 11,122 | | 822 | | 11,944 |
| CMBS | | 9,528 | | 540 | | 10,068 |
| CLO | | 7,994 | | 192 | | 8,186 |
| ABS | | 9,774 | | 613 | | 10,387 |
| Total mortgage-backed, asset-backed and collateralized | | 38,418 | | 2,167 | | 40,585 |
| Total bonds available for sale | | 140,454 | | 16,339 | | 156,793 |
| Other bond securities | | 284 | | | 3,485 | | 3,769 |
| Total fixed maturities | | 140,738 | | 19,824 | | 160,562 |
| Equity securities | | 170 | | — | | 170 |
| Mortgage and other loans receivable: | | | | | | |
| Residential mortgages | | 5,851 | | — | | 5,851 |
| Commercial mortgages | | 29,190 | | 3,272 | | 32,462 |
| Life insurance policy loans | | 1,395 | | 355 | | 1,750 |
| Commercial loans, other loans and notes receivable | | 4,285 | | 218 | | 4,503 |
Total mortgage and other loans receivable(b) | | 40,721 | | 3,845 | | 44,566 |
Other invested assets(c) | | 8,392 | | 2,026 | | 10,418 |
| Short-term investments | | 4,331 | | 69 | | 4,400 |
Total(d) | | $ | 194,352 | | $ | 25,764 | | $ | 220,116 |
| December 31, 2021 | | | | | | |
| Bonds available for sale: | | | | | | |
| U.S. government and government-sponsored entities | | $ | 1,255 | | | $ | 457 | | | $ | 1,712 | |
| Obligations of states, municipalities and political subdivisions | | 7,240 | | | 1,436 | | | 8,676 | |
Non-U.S. governments(a) | | 5,579 | | | 818 | | | 6,397 | |
Corporate debt(a) | | 118,715 | | | 21,348 | | | 140,063 | |
| Mortgage-backed, asset-backed and collateralized: | | | | | | |
| RMBS | | 13,850 | | | 1,108 | | | 14,958 | |
| CMBS | | 10,311 | | | 989 | | | 11,300 | |
| CLO | | 7,163 | | | 239 | | | 7,402 | |
| ABS | | 7,275 | | | 785 | | | 8,060 | |
| Total mortgage-backed, asset-backed and collateralized | | 38,599 | | | 3,121 | | | 41,720 | |
| Total bonds available for sale | | 171,388 | | | 27,180 | | | 198,568 | |
| Other bond securities | | 489 | | | 1,593 | | | 2,082 | |
| Total fixed maturities | | 171,877 | | | 28,773 | | | 200,650 | |
| Equity securities | | 241 | | | 1 | | | 242 | |
| Mortgage and other loans receivable: | | | | | | |
| Residential mortgages | | 4,671 | | | — | | | 4,671 | |
| Commercial mortgages | | 27,176 | | | 2,929 | | | 30,105 | |
| Life insurance policy loans | | 1,452 | | | 380 | | | 1,832 | |
| Commercial loans, other loans and notes receivable | | 2,530 | | | 250 | | | 2,780 | |
Total mortgage and other loans receivable(b) | | 35,829 | | | 3,559 | | | 39,388 | |
Other invested assets(c) | | 8,760 | | | 1,807 | | | 10,567 | |
| Short-term investments | | 5,421 | | | 50 | | | 5,471 | |
Total(d) | | $ | 222,128 | | | $ | 34,190 | | | $ | 256,318 | |
(a) Our credit exposure to the Russian Federation and Ukraine through our fixed maturity securities portfolio, excluding Fortitude Re funds withheld assets, was $29 million and $201 million at December 31, 2022 and December 31, 2021, respectively. The credit exposure to the Russian Federation and Ukraine of our Fortitude Re funds withheld assets fixed maturity securities portfolio was $7 million and $92 million at December 31, 2022 and December 31, 2021, respectively. Exposure to the Russian Federation and Ukraine represents an immaterial percentage of our aggregate credit exposures on our fixed maturity securities.
(b) Net of total allowance for credit losses for $600 million and $496 million at December 31, 2022 and December 31, 2021, respectively.
(c) Other invested assets, excluding Fortitude Re funds withheld assets, include $5.3 billion and $5.1 billion of private equity funds as of December 31, 2022 and December 31, 2021, respectively, which are generally reported on a one-quarter lag.
(d) Includes the consolidation of approximately $9.7 billion and $11.4 billion of consolidated investment entities at December 31, 2022 and December 31, 2021, respectively.
The following table presents carrying amounts of our total investments for our insurance operating subsidiaries excluding the Fortitude Re funds withheld assets:
| | | | | | | | | | | | | | |
| (in millions) | | December 31, 2022 | | December 31, 2021 |
| Bonds available for sale: | | | | |
| U.S. government and government-sponsored entities | | $ | 928 | | $ | 1,260 | |
| Obligations of states, municipalities and political subdivisions | | 5,194 | | 7,240 | |
| Non-U.S. governments | | 3,978 | | 5,578 | |
| Corporate Debt | | 88,876 | | 115,351 | |
| Mortgage-backed, asset-backed and collateralized: | | | | |
| RMBS | | 11,546 | | 14,427 | |
| CMBS | | 9,527 | | 10,312 | |
| CLO | | 8,292 | | 7,521 | |
| ABS | | 9,775 | | 7,274 | |
| Total mortgage-backed, asset-backed and collateralized | | 39,140 | | 39,534 | |
| Total bonds available for sale | | 138,116 | | 168,963 | |
| Other bond securities | | 357 | | 561 | |
| Total fixed maturities | | 138,473 | | 169,524 | |
| Equity securities | | 119 | | 19 |
| Mortgage and other loans receivable: | | | | |
| Residential mortgages | | 4,181 | | 2,727 | |
| Commercial mortgages | | 29,632 | | 27,552 | |
| Commercial loans, other loans and notes receivable | | 4,465 | | 2,659 | |
Total mortgage and other loans receivable(a)(b) | | 38,278 | | 32,938 | |
Other invested assets(d) | | 5,845 | | 5,657 |
| Short-term investments | | 3,781 | | 4,329 | |
Total(c) | | $ | 186,496 | | $ | 212,467 | |
(a) Does not reflect allowance for credit loss on mortgage loans of $509 million and $447 million at December 31, 2022 and December 31, 2021, respectively.
(b) Does not reflect policy loans of $1.4 billion and $1.5 billion at December 31, 2022 and December 31, 2021, respectively.
(c) Excludes approximately $9.7 billion and $11.4 billion of consolidated investment entities as well as $2.7 billion and $2.7 billion of eliminations primarily between the consolidated investment entities and the insurance operating companies at December 31, 2022 and December 31, 2021, respectively.
(d) Alternatives include private equity funds, which are generally reported on a one-quarter lag.
Credit Ratings
At December 31, 2022, nearly all our fixed maturity securities were held by our U.S. entities. 89% of these securities were rated investment grade by one or more of the principal rating agencies.
Moody’s, S&P, Fitch or similar foreign rating services rate a significant portion of our foreign entities’ fixed maturity securities portfolio. Rating services are not available for some foreign-issued securities. Our Investments team, with oversight from credit risk management, closely reviews the credit quality of the foreign portfolio’s non-rated fixed maturity securities.
NAIC Designations of Fixed Maturity Securities
The Securities Valuation Office (“SVO”) of the NAIC evaluates the investments of U.S. insurers for statutory reporting purposes and assigns fixed maturity securities to one of six categories called ‘NAIC Designations.’ In general, NAIC Designations of ‘1,’ highest quality, or ‘2,’ high quality, include fixed maturity securities considered investment grade, while NAIC Designations of ‘3’ through ‘6’ generally include fixed maturity securities referred to as below investment grade. NAIC Designations for non-agency RMBS and CMBS are calculated using third-party modeling results provided through the NAIC. These methodologies result in an improved NAIC Designation for such securities compared to the rating typically assigned by the three major rating agencies. The following tables summarize the ratings distribution of our subsidiaries’ fixed maturity security portfolio by NAIC Designation, and the distribution by composite our credit rating, which is generally based on ratings of the three major rating agencies. As of December 31, 2022 and December 31, 2021, 91% and 92%, respectively, of our fixed maturity security portfolio, excluding Fortitude Re funds withheld assets, were investment grade. The fixed maturity security portfolio of our insurance operating subsidiaries, excluding the Fortitude Re funds withheld assets, was 94% and 94% investment grade as of December 31, 2022 and December 31, 2021, respectively. The remaining
below-investment-grade securities that are not included in consolidated investment entities relate to middle market and high yield bank loans securities.
The following tables present the fixed maturity security portfolio categorized by NAIC Designation, at fair value:
| | | | | | | | | | | | | | | | | | | | | | | | | | | | | | | | | | | | | | |
NAIC Designation Excluding Fortitude Re Funds Withheld Assets (in millions) | | 1 | 2 | Total Investment
Grade | | 3 | 4(a) | 5(a) | 6 | Total Below Investment Grade | | Total |
| December 31, 2022 | | | | | | | | | | | | |
| Other fixed maturity securities | | $ | 44,981 | $ | 45,166 | $ | 90,147 | | $ | 5,058 | $ | 5,915 | $ | 655 | $ | 268 | $ | 11,896 | | $ | 102,043 |
Mortgage-backed, asset-backed
and collateralized | | 33,031 | 5,330 | 38,361 | | 227 | 73 | 3 | | 10 | 313 | | 38,674 |
Total(b) | | $ | 78,012 | $ | 50,496 | $ | 128,508 | | $ | 5,285 | $ | 5,988 | $ | 658 | $ | 278 | $ | 12,209 | | $ | 140,717 |
| Fortitude Re funds withheld assets | | | | | | | | | | | | $ | 19,824 |
| Total fixed maturities | | | | | | | | | | | | $ | 160,541 |
| December 31, 2021 | | | | | | | | | | | | |
| Other fixed maturity securities | | $ | 59,367 | $ | 60,131 | $ | 119,498 | | $ | 5,743 | $ | 6,698 | $ | 803 | $ | 58 | $ | 13,302 | | $ | 132,800 |
Mortgage-backed, asset-backed
and collateralized | | 35,241 | 3,402 | 38,643 | | 146 | 88 | 20 | 180 | 434 | | 39,077 |
| Total | | $ | 94,608 | $ | 63,533 | $ | 158,141 | | $ | 5,889 | $ | 6,786 | $ | 823 | $ | 238 | $ | 13,736 | | $ | 171,877 |
| Fortitude Re funds withheld assets | | | | | | | | | | | | $ | 28,773 |
| Total fixed maturities | | | | | | | | | | | | $ | 200,650 |
(a)Includes $2.8 billion and $142 million of consolidated CLOs that are rated NAIC 4 and 5, respectively, as of December 31, 2022 and $3.4 billion and $50 million of NAIC 4 and 5 securities, respectively, as of December 31, 2021. These are assets of consolidated investment entities and do not represent direct investment of Corebridge’s insurance subsidiaries.
(b)Excludes $21 million of fixed maturity securities for which no NAIC Designation is available at December 31, 2022.
The following table presents the fixed maturity security portfolio categorized by NAIC Designation, at fair value, for our insurance operating subsidiaries excluding the Fortitude Re funds withheld assets:
| | | | | | | | | | | | | | |
| (in millions) | | December 31, 2022 | | December 31, 2021 |
| NAIC 1 | | $ | 78,518 | | $ | 95,321 |
| NAIC 2 | | 50,946 | | 63,937 |
| NAIC 3 | | 4,860 | | 5,683 |
| NAIC 4 | | 3,224 | | 3,433 |
| NAIC 5 and 6 | | 904 | | 1,150 |
Total(a)(b) | | $ | 138,452 | | $ | 169,524 |
(a) Excludes approximately $3.4 billion and $3.7 billion of consolidated investment entities and $1.2 billion and $1.4 billion of eliminations primarily related to the consolidated investment entities and the insurance operating subsidiaries at December 31, 2022 and December 31, 2021, respectively.
(b) Excludes $21 million of fixed maturity securities for which no NAIC Designation is available at December 31, 2022.
Composite Corebridge Credit Ratings
With respect to our fixed maturity securities, the credit ratings in the table below and in subsequent tables reflect: (i) a composite of the ratings of the three major rating agencies, or when agency ratings are not available, the rating assigned by the NAIC SVO (100% of total fixed maturity securities), or (ii) our equivalent internal ratings when these investments have not been rated by any of the major rating agencies or the NAIC. The “Non-rated” category in those tables consists of fixed maturity securities that have not been rated by any of the major rating agencies, the NAIC or us.
The following tables present the fixed maturity security portfolio categorized by composite Corebridge credit rating (as described below), at fair value:
| | | | | | | | | | | | | | | | | | | | | | | | | | | | | | | | | | | | | | | | | | | | | | | | | | |
Composite Corebridge Credit Rating Excluding Fortitude Re Funds Withheld Assets (in millions) | | AAA/AA/A | | BBB | | Total Investment Grade | | BB | | B | | CCC and Lower | | Total Below Investment Grade (a)(b) | | Total |
| December 31, 2022 | | | | | | | | | | | | | | | | |
| Other fixed maturity securities | | $ | 46,059 | | $ | 44,068 | | $ | 90,127 | | $ | 5,081 | | $ | 5,910 | | $ | 925 | | $ | 11,916 | | $ | 102,043 |
Mortgage-backed, asset-backed
and collateralized | | 29,367 | | 5,768 | | 35,135 | | 336 | | 273 | | 2,930 | | 3,539 | | 38,674 |
Total(c) | | $ | 75,426 | | $ | 49,836 | | $ | 125,262 | | $ | 5,417 | | $ | 6,183 | | $ | 3,855 | | $ | 15,455 | | $ | 140,717 |
| Fortitude Re funds withheld assets | | | | | | | | | | | | | | | | $ | 19,824 |
| Total fixed maturities | | | | | | | | | | | | | | | | $ | 160,541 |
| December 31, 2021 | | | | | | | | | | | | | | | | |
| Other fixed maturity securities | | $ | 61,496 | | $ | 58,049 | | $ | 119,545 | | $ | 5,767 | | $ | 5,014 | | $ | 2,474 | | $ | 13,255 | | $ | 132,800 |
Mortgage-backed, asset-backed
and collateralized | | 30,363 | | 3,876 | | 34,239 | | 375 | | 359 | | 4,104 | | 4,838 | | 39,077 |
Total | | $ | 91,859 | | $ | 61,925 | | $ | 153,784 | | $ | 6,142 | | $ | 5,373 | | $ | 6,578 | | $ | 18,093 | | $ | 171,877 |
| Fortitude Re funds withheld assets | | | | | | | | | | | | | | | | $ | 28,773 | |
| Total fixed maturities | | | | | | | | | | | | | | | | $ | 200,650 | |
(a) Includes $3.0 billion and $4.1 billion at December 31, 2022 and December 31, 2021, respectively, of certain RMBS that had experienced deterioration in credit quality since its origination but prior to Corebridge’s acquisition. These securities are currently rated as investment grade under the NAIC SVO framework. For additional discussion on Purchased Credit Impaired Securities, see Note 5 to our audited annual consolidated financial statements.
(b) Includes $3.4 billion of consolidated CLOs as of December 31, 2022 and $3.7 billion as of December 31, 2021. These are assets of consolidated investment entities and do not represent direct investment of Corebridge’s insurance subsidiaries.
(c) Excludes $21 million of fixed maturity securities for which no NAIC Designation is available at December 31, 2022.
The following table presents the fixed maturity security portfolio categorized by composite Corebridge credit rating (as described below), at fair value for our insurance operating subsidiaries:
| | | | | | | | | | | | | | | | | | | | | | | | | | | | | | | | | | | | | | | | | | | | | | | | | | |
Composite Corebridge Credit Rating For Our Insurance Operating Subsidiaries (in millions) | | AAA/AA/A | | BBB | | Total Investment Grade | | BB | | B | | CCC and Lower | | Total Below Investment Grade | | Total |
| December 31, 2022 | | | | | | | | | | | | | | | | |
| Other fixed maturity securities | | $ | 46,060 | | $ | 44,410 | | $ | 90,470 | | $ | 4,577 | | $ | 3,236 | | $ | 700 | | $ | 8,513 | | $ | 98,983 |
Mortgage-backed, asset-backed
and collateralized | | 29,869 | | 5,886 | | 35,755 | | 401 | | 276 | | 3,037 | | 3,714 | | 39,469 |
| Total fixed maturities* | | $ | 75,929 | | $ | 50,296 | | $ | 126,225 | | $ | 4,978 | | $ | 3,512 | | $ | 3,737 | | $ | 12,227 | | $ | 138,452 |
| December 31, 2021 | | | | | | | | | | | | | | | | |
| Other fixed maturity securities | | $ | 61,502 | | $ | 58,375 | | $ | 119,877 | | $ | 5,410 | | $ | 3,300 | | $ | 853 | | $ | 9,563 | | $ | 129,440 |
Mortgage-backed, asset-backed
and collateralized | | 31,056 | | 3,962 | | 35,018 | | 455 | | 365 | | 4,246 | | 5,066 | | 40,084 |
| Total fixed maturities | | $ | 92,558 | | | $ | 62,337 | | | $ | 154,895 | | | $ | 5,865 | | | $ | 3,665 | | | $ | 5,099 | | | $ | 14,629 | | | $ | 169,524 | |
* Excludes $21 million of fixed maturity securities for which no NAIC Designation is available at December 31, 2022.
For a discussion of credit risks associated with Investments, see “Business—Investment Management—Credit Risk.”
The following tables present the composite Corebridge credit ratings of our fixed maturity securities calculated based on their fair value: | | | | | | | | | | | | | | | | | | | | | | | | | | | | | | | | | | | | | | |
| | Available for Sale | | Other Fixed Maturity Securities, at Fair Value | | Total |
Excluding Fortitude Funds Withheld Assets (in millions) | | December 31, 2022 | | December 31, 2021 | | December 31, 2022 | | December 31, 2021 | | December 31, 2022 | | December 31, 2021 |
| Rating: | | | | | | | | | | | | |
| Other fixed maturity securities* | | | | | | | | | | | | |
| AAA | | $ | 2,493 | | $ | 3,516 | | $ | — | | $ | — | | $ | 2,493 | | $ | 3,516 |
| AA | | 17,600 | | 23,214 | | 16 | | — | | 17,616 | | 23,214 |
| A | | 25,950 | | 34,766 | | — | | — | | 25,950 | | 34,766 |
| BBB | | 44,065 | | 58,045 | | 3 | | 4 | | 44,068 | | 58,049 |
| Below investment grade | | 11,855 | | 11,677 | | 7 | | 7 | | 11,862 | | 11,684 |
| Non-rated | | 73 | | 1,571 | | 2 | | — | | 75 | | 1,571 |
| Total | | $ | 102,036 | | $ | 132,789 | | $ | 28 | | $ | 11 | | $ | 102,064 | | $ | 132,800 |
| Mortgage-backed, asset- | | | | | | | | | | | | |
| backed and collateralized | | | | | | | | | | | | |
| AAA | | $ | 11,418 | | $ | 13,002 | | $ | 22 | | $ | 26 | | $ | 11,440 | | $ | 13,028 |
| AA | | 11,737 | | 12,173 | | 90 | | 83 | | 11,827 | | 12,256 |
| A | | 6,009 | | 4,957 | | 91 | | 122 | | 6,100 | | 5,079 |
| BBB | | 5,736 | | 3,820 | | 32 | | 56 | | 5,768 | | 3,876 |
| Below investment grade | | 3,391 | | 4,634 | | 21 | | 151 | | 3,412 | | 4,785 |
| Non-rated | | 127 | | 13 | | — | | 40 | | 127 | | 53 |
| Total | | $ | 38,418 | | $ | 38,599 | | $ | 256 | | $ | 478 | | $ | 38,674 | | $ | 39,077 |
| Total | | | | | | | | | | | | |
| AAA | | $ | 13,911 | | $ | 16,518 | | $ | 22 | | $ | 26 | | $ | 13,933 | | $ | 16,544 |
| AA | | 29,337 | | 35,387 | | 106 | | 83 | | 29,443 | | 35,470 |
| A | | 31,959 | | 39,723 | | 91 | | 122 | | 32,050 | | 39,845 |
| BBB | | 49,801 | | 61,865 | | 35 | | 60 | | 49,836 | | 61,925 |
| Below investment grade | | 15,246 | | 16,311 | | 28 | | 158 | | 15,274 | | 16,469 |
| Non-rated | | 200 | | 1,584 | | 2 | | 40 | | 202 | | 1,624 |
| Total | | $ | 140,454 | | $ | 171,388 | | $ | 284 | | $ | 489 | | $ | 140,738 | | $ | 171,877 |
| | | | | | | | | | | | | | | | | | | | | | | | | | | | | | | | | | | | | | |
| | Available for Sale | | Other Fixed Maturity Securities, at Fair Value | | Total |
Fortitude Re Funds Withheld Assets (in millions) | | December 31, 2022 | | December 31, 2021 | | December 31, 2022 | | December 31, 2021 | | December 31, 2022 | | December 31, 2021 |
| Rating: | | | | | | | | | | | | |
| Other fixed maturity securities* | | | | | | | | | | | | |
| AAA | | $ | 439 | | $ | 720 | | $ | 22 | | | $ | 31 | | | $ | 461 | | $ | 751 |
| AA | | 3,272 | | 5,444 | | 706 | | 227 | | 3,978 | | 5,671 |
| A | | 4,022 | | 6,359 | | 168 | | 109 | | 4,190 | | 6,468 |
| BBB | | 5,734 | | 9,873 | | 935 | | 384 | | 6,669 | | 10,257 |
| Below investment grade | | 705 | | 1,663 | | 420 | | 305 | | 1,125 | | 1,968 |
| Non-rated | | — | | — | | 2 | | — | | 2 | | — |
| Total | | $ | 14,172 | | $ | 24,059 | | $ | 2,253 | | $ | 1,056 | | $ | 16,425 | | $ | 25,115 |
Mortgage-backed, asset-
backed and collateralized | | | | | | | | | | | | |
| AAA | | $ | 222 | | $ | 517 | | $ | 88 | | $ | 31 | | $ | 310 | | $ | 548 |
| AA | | 727 | | 945 | | 478 | | 314 | | 1,205 | | 1,259 |
| A | | 289 | | 367 | | 146 | | 59 | | 435 | | 426 |
| BBB | | 348 | | 447 | | 459 | | 60 | | 807 | | 507 |
| Below investment grade | | 581 | | 838 | | 60 | | 72 | | 641 | | 910 |
| Non-rated | | — | | 7 | | 1 | | 1 | | 1 | | 8 |
| Total | | $ | 2,167 | | $ | 3,121 | | $ | 1,232 | | $ | 537 | | $ | 3,399 | | $ | 3,658 |
| Total | | | | | | | | | | | | |
| AAA | | $ | 661 | | $ | 1,237 | | $ | 110 | | $ | 62 | | $ | 771 | | $ | 1,299 |
| AA | | 3,999 | | 6,389 | | 1,184 | | 541 | | 5,183 | | 6,930 |
| A | | 4,311 | | 6,726 | | 314 | | 168 | | 4,625 | | 6,894 |
| BBB | | 6,082 | | 10,320 | | 1,394 | | 444 | | 7,476 | | 10,764 |
| Below investment grade | | 1,286 | | 2,501 | | 480 | | 377 | | 1,766 | | 2,878 |
| Non-rated | | — | | 7 | | 3 | | 1 | | 3 | | 8 |
| Total | | $ | 16,339 | | $ | 27,180 | | $ | 3,485 | | $ | 1,593 | | $ | 19,824 | | $ | 28,773 |
| | | | | | | | | | | | | | | | | | | | | | | | | | | | | | | | | | | | | | |
| | Available for Sale | | Other Fixed Maturity Securities, at Fair Value | | Total |
Total (in millions) | | December 31, 2022 | | December 31, 2021 | | December 31, 2022 | | December 31, 2021 | | December 31, 2022 | | December 31, 2021 |
| Rating: | | | | | | | | | | | | |
| Other fixed maturity securities* | | | | | | | | | | | | |
| AAA | | $ | 2,932 | | $ | 4,236 | | $ | 22 | | $ | 31 | | | $ | 2,954 | | $ | 4,267 |
| AA | | 20,872 | | 28,658 | | 722 | | 227 | | 21,594 | | 28,885 |
| A | | 29,972 | | 41,125 | | 168 | | 109 | | 30,140 | | 41,234 |
| BBB | | 49,799 | | 67,918 | | 938 | | 388 | | 50,737 | | 68,306 |
| Below investment grade | | 12,560 | | 13,340 | | 427 | | 312 | | 12,987 | | 13,652 |
| Non-rated | | 73 | | 1,571 | | 4 | | — | | 77 | | 1,571 |
| Total | | $ | 116,208 | | $ | 156,848 | | $ | 2,281 | | $ | 1,067 | | $ | 118,489 | | $ | 157,915 |
| Mortgage-backed, asset-backed and collateralized | | | | | | | | | | | | |
| AAA | | $ | 11,640 | | $ | 13,519 | | $ | 110 | | $ | 57 | | $ | 11,750 | | $ | 13,576 |
| AA | | 12,464 | | 13,118 | | 568 | | 397 | | 13,032 | | 13,515 |
| A | | 6,298 | | 5,324 | | 237 | | 181 | | 6,535 | | 5,505 |
| BBB | | 6,084 | | 4,267 | | 491 | | 116 | | 6,575 | | 4,383 |
| Below investment grade | | 3,972 | | 5,472 | | 81 | | 223 | | 4,053 | | 5,695 |
| Non-rated | | 127 | | 20 | | 1 | | 41 | | 128 | | 61 |
| Total | | $ | 40,585 | | $ | 41,720 | | $ | 1,488 | | $ | 1,015 | | $ | 42,073 | | $ | 42,735 |
| Total | | | | | | | | | | | | |
| AAA | | $ | 14,572 | | $ | 17,755 | | $ | 132 | | $ | 88 | | $ | 14,704 | | $ | 17,843 |
| AA | | 33,336 | | 41,776 | | 1,290 | | 624 | | 34,626 | | 42,400 |
| A | | 36,270 | | 46,449 | | 405 | | 290 | | 36,675 | | 46,739 |
| BBB | | 55,883 | | 72,185 | | 1,429 | | 504 | | 57,312 | | 72,689 |
| Below investment grade | | 16,532 | | 18,812 | | 508 | | 535 | | 17,040 | | 19,347 |
| Non-rated | | 200 | | 1,591 | | 5 | | 41 | | 205 | | 1,632 |
| Total | | $ | 156,793 | | $ | 198,568 | | $ | 3,769 | | $ | 2,082 | | $ | 160,562 | | $ | 200,650 |
* Consists of assets including U.S. government and government sponsored entities, obligations of states, municipalities and political subdivisions, non-U.S. governments, and corporate debt.
The following table presents the fair value of our aggregate credit exposures to non-U.S. governments for our fixed maturity securities:
| | | | | | | | | | | | | | | | | | | | | | | | | | | | | | | | | | | | | | |
| | December 31, 2022 | | December 31, 2021 |
| (in millions) | | Excluding Fortitude Re Funds Withheld Assets | | Fortitude Re Funds Withheld Assets | | Total | | Excluding Fortitude Re Funds Withheld Assets | | Fortitude Re Funds Withheld Assets | | Total |
| Indonesia | | $ | 381 | | $ | 34 | | $ | 415 | | $ | 472 | | $ | 50 | | $ | 522 |
| Chile | | 343 | | 19 | | 362 | | 443 | | 28 | | 471 |
| United Arab Emirates | | 298 | | 12 | | 310 | | 372 | | 19 | | 391 |
| Qatar | | 218 | | 87 | | 305 | | 276 | | 113 | | 389 |
| Mexico | | 239 | | 27 | | 266 | | 299 | | 74 | | 373 |
| Saudi Arabia | | 200 | | 22 | | 222 | | 258 | | 29 | | 287 |
| Panama | | 150 | | 29 | | 179 | | 206 | | 34 | | 240 |
| France | | 149 | | 17 | | 166 | | 225 | | 36 | | 261 |
| Israel | | 159 | | 7 | | 166 | | 199 | | 8 | | 207 |
| China | | 149 | | 13 | | 162 | | 177 | | 30 | | 207 |
| Other | | 1,691 | | 170 | | 1,861 | | 2,652 | | 414 | | 3,066 |
| Total* | | $ | 3,977 | | $ | 437 | | $ | 4,414 | | $ | 5,579 | | $ | 835 | | $ | 6,414 |
* Includes bonds available for sale and other bond securities.
Investments in Corporate Debt Securities
The following table presents the industry categories of our available-for-sale corporate debt securities:
| | | | | | | | | | | | | | | | | | | | | | | | | | | | | | | | | | | | | | |
| | December 31, 2022 | | December 31, 2021 |
| | Fair Value | | Fair Value |
| (in millions) | | Excluding Fortitude Re Funds Withheld Assets | | Fortitude Re Funds Withheld Assets | | Total | | Excluding Fortitude Re Funds Withheld Assets | | Fortitude Re Funds Withheld Assets | | Total |
| Industry Category: | | | | | | | | | | | | |
| Financial institutions | | $ | 23,751 | | $ | 2,699 | | $ | 26,450 | | $ | 29,317 | | $ | 4,231 | | $ | 33,548 |
| Utilities | | 13,579 | | 2,708 | | 16,287 | | 17,194 | | 4,161 | | 21,355 |
| Communications | | 5,718 | | 767 | | 6,485 | | 7,653 | | 1,555 | | 9,208 |
| Consumer noncyclical | | 12,466 | | 1,525 | | 13,991 | | 16,870 | | 2,906 | | 19,776 |
| Capital goods | | 4,491 | | 462 | | 4,953 | | 5,869 | | 884 | | 6,753 |
| Energy | | 7,361 | | 1,126 | | 8,487 | | 9,626 | | 1,797 | | 11,423 |
| Consumer cyclical | | 6,820 | | 581 | | 7,401 | | 8,605 | | 946 | | 9,551 |
| Basic materials | | 3,285 | | 467 | | 3,752 | | 4,210 | | 820 | | 5,030 |
| Other | | 14,468 | | 2,418 | | 16,886 | | 19,371 | | 4,048 | | 23,419 |
| Total* | | $ | 91,939 | | $ | 12,753 | | $ | 104,692 | | $ | 118,715 | | $ | 21,348 | | $ | 140,063 |
* 89% and 90% of investments were rated investment grade at December 31, 2022 and December 31, 2021, respectively.
Our investments in the energy category, as a percentage of total investments in available-for-sale fixed maturities, were 8% and 8% at December 31, 2022 and December 31, 2021, respectively. While the energy investments are primarily investment grade and are actively managed, the category continues to experience volatility that could adversely affect credit quality and fair value.
Investments in RMBS
The following table presents our RMBS available-for-sale securities:
| | | | | | | | | | | | | | | | | | | | | | | | | | |
| | December 31, 2022 | | December 31, 2021 |
| (in millions) | | Fair Value | | Percent of Total | | Fair Value | | Percent of Total |
| Agency RMBS | | $ | 4,478 | | 40% | | $ | 5,909 | | 43% |
| AAA | | 4,345 | | | | 5,736 | | |
| AA | | 133 | | | | 173 | | |
| A | | — | | | | — | | |
| BBB | | — | | | | — | | |
| Below investment grade | | — | | | | — | | |
| Non-rated | | — | | | | — | | |
| Alt-A RMBS | | 2,641 | | 24% | | 3,523 | | 25% |
| AAA | | 24 | | | | 4 | | |
| AA | | 689 | | | | 828 | | |
| A | | 35 | | | | 40 | | |
| BBB | | 41 | | | | 63 | | |
| Below investment grade | | 1,852 | | | | 2,588 | | |
| Non-rated | | — | | | | — | | |
| Subprime RMBS | | 1,217 | | 11% | | 1,522 | | 11% |
| AAA | | — | | | | — | | |
| AA | | 68 | | | | 37 | | |
| A | | 65 | | | | 99 | | |
| BBB | | 51 | | | | 61 | | |
| Below investment grade | | 1,033 | | | | 1,325 | | |
| Non-rated | | — | | | | — | | |
| Prime non-agency | | 1,471 | | 13% | | 1,851 | | 13% |
| AAA | | 331 | | | | 290 | | |
| AA | | 803 | | | | 838 | | |
| A | | 136 | | | | 207 | | |
| BBB | | 57 | | | | 191 | | |
| Below investment grade | | 144 | | | | 325 | | |
| Non-rated | | — | | | | — | | |
| Other housing related | | 1,315 | | 12% | | 1,045 | | 8% |
| AAA | | 795 | | | | 319 | | |
| AA | | 230 | | | | 497 | | |
| A | | 206 | | | | 196 | | |
| BBB | | 77 | | | | 23 | | |
| Below investment grade | | 6 | | | | 8 | | |
| Non-rated | | 1 | | | | 2 | | |
| Total RMBS excluding Fortitude Re funds withheld assets | | 11,122 | | 100 | % | | 13,850 | | 100% |
| Total RMBS Fortitude Re funds withheld assets | | 822 | | | | 1,108 | | |
Total RMBS(a)(b) | | $ | 11,944 | | | | $ | 14,958 | | |
(a) Includes $3.0 billion and $4.1 billion at December 31, 2022 and December 31, 2021, respectively, of certain RMBS that had experienced deterioration in credit quality since their origination but prior to Corebridge’s acquisition. These securities are currently rated as investment grade under the NAIC SVO framework. For additional discussion on Purchased Credit Impaired Securities, see Note 5 to our audited annual consolidated financial statements.
(b) The weighted average expected life was 6 years at December 31, 2022 and 5 years at December 31, 2021.
Our underwriting principles for investing in RMBS, other ABS and CLOs take into consideration the quality of the originator, the manager, the servicer, security credit ratings, underlying characteristics of the mortgages, borrower characteristics and the level of credit enhancement in the transaction.
Investments in CMBS
The following table presents our CMBS available for sale securities:
| | | | | | | | | | | | | | | | | | | | | | | | | | |
| | December 31, 2022 | | December 31, 2021 |
| (in millions) | | Fair Value | | Percent of Total | | Fair Value | | Percent of Total |
| CMBS (traditional) | | $ | 8,085 | | 85 | % | | $ | 8,333 | | 81 | % |
| AAA | | 3,875 | | | | 4,447 | | |
| AA | | 2,642 | | | | 2,675 | | |
| A | | 732 | | | | 446 | | |
| BBB | | 564 | | | | 408 | | |
| Below investment grade | | 272 | | | | 357 | | |
| Non-rated | | — | | | | — | | |
| Agency | | 1,017 | | 11 | % | | 1,309 | | 13 | % |
| AAA | | 484 | | | | 619 | | |
| AA | | 525 | | | | 676 | | |
| A | | — | | | | — | | |
| BBB | | 8 | | | | 14 | | |
| Below investment grade | | — | | | | — | | |
| Non-rated | | — | | | | — | | |
| Other | | 426 | | 4 | % | | 669 | | 6 | % |
| AAA | | 105 | | | | 91 | | |
| AA | | 131 | | | | 143 | | |
| A | | 97 | | | | 309 | | |
| BBB | | 93 | | | | 116 | | |
| Below investment grade | | — | | | | 1 | | |
| Non-rated | | — | | | | 9 | | |
| Total excluding Fortitude Re funds withheld assets | | 9,528 | | 100 | % | | 10,311 | | 100 | % |
| Total Fortitude Re funds withheld assets | | 540 | | | | 989 | | |
| Total | | $ | 10,068 | | | | $ | 11,300 | | |
The fair value of CMBS holdings decreased slightly during the year ended December 31, 2022. The majority of our investments in CMBS are in tranches that contain substantial protection features through collateral subordination. The majority of CMBS holdings are traditional conduit transactions, broadly diversified across property types and geographical areas.
Investments in ABS/CLOs
The following table presents our ABS/CLO available for sale securities by collateral type:
| | | | | | | | | | | | | | | | | | | | | | | | | | |
| | December 31, 2022 | | December 31, 2021 |
| (in millions) | | Fair Value | | Percent of Total | | Fair Value | | Percent of Total |
| CDO - bank loan (CLO) | | $ | 7,893 | | 44 | % | | $ | 6,318 | | 44 | % |
| AAA | | 1,056 | | | | 1,078 | | |
| AA | | 4,049 | | | | 3,599 | | |
| A | | 2,384 | | | | 1,494 | | |
| BBB | | 400 | | | | 142 | | |
| Below investment grade | | 4 | | | | 5 | | |
| Non-rated | | — | | | | — | | |
| CDO - other | | 100 | | 1 | % | | 845 | | 6 | % |
| AAA | | — | | | | — | | |
| AA | | 100 | | | | 824 | | |
| A | | — | | | | | — | | |
| BBB | | — | | | | | — | | |
| Below investment grade | | — | | | | 21 | | |
| Non-rated | | — | | | | — | | |
| ABS | | 9,775 | | 55 | % | | 7,275 | | 50 | % |
| AAA | | 403 | | | | 418 | | |
| AA | | 2,367 | | | | 1,883 | | |
| A | | 2,354 | | | | 2,166 | | |
| BBB | | 4,445 | | | | 2,802 | | |
| Below investment grade | | 80 | | | | 4 | | |
| Non-rated | | 126 | | | | 2 | | |
| Total excluding Fortitude Re funds withheld assets | | 17,768 | | 100 | % | | 14,438 | | 100 | % |
| Total Fortitude Re funds withheld assets | | 805 | | | | 1,024 | | |
| Total | | $ | 18,573 | | | | $ | 15,462 | | |
Unrealized Losses of Fixed Maturity Securities
The following tables show the aging of the unrealized losses on available-for-sale fixed maturity securities, the extent to which the fair value is less than amortized cost or cost, and the number of respective items in each category:
| | | | | | | | | | | | | | | | | | | | | | | | | | | | | | | | | | | | | | | | | | | | | | | | | | |
| December 31, 2022 | | Less Than or Equal to 20% of Cost(b) | | Greater Than 20% to 50% of Cost(b) | | Greater Than 50% of Cost(b) | | Total |
Aging(a) (dollars in millions) | | Cost(c) | Unrealized Loss | Items(d) | | Cost(c) | Unrealized Loss | Items(d) | | Cost(c) | Unrealized Loss | Items(d) | | Cost(c) | Unrealized Loss | Items(d) |
| Investment-grade bonds | | | | | | | | | | | | | | | | |
| 0-6 months | | $ | 58,919 | | $ | 5,036 | | 6,736 | | | $ | 30,974 | | $ | 9,161 | | 2,999 | | | $ | 447 | | $ | 238 | | 25 | | | $ | 90,340 | | $ | 14,435 | | 9,760 | |
| 7-11 months | | 22,018 | | 2,112 | | 2,197 | | | 3,126 | | 836 | | 159 | | | 21 | | 13 | | 1 | | | 25,165 | | 2,961 | | 2,357 | |
| 12 months or more | | 7,759 | | 942 | | 716 | | | 9,398 | | 2,667 | | 690 | | | 20 | | 11 | | 3 | | | 17,177 | | 3,620 | | 1,409 | |
| Total | | 88,696 | | 8,090 | | 9,649 | | | 43,498 | | 12,664 | | 3,848 | | | 488 | | 262 | | 29 | | | 132,682 | | 21,016 | | 13,526 | |
| Below-investment-grade bonds | | | | | | | | | | | | | | | | |
| 0-6 months | | 5,310 | | 354 | | 1,492 | | | 823 | | 235 | | 222 | | | 39 | | 28 | | 17 | | | 6,172 | | 617 | | 1,731 | |
| 7-11 months | | 3,544 | | 182 | | 1,201 | | | 95 | | 24 | | 51 | | | 7 | | 5 | | 7 | | | 3,646 | | 211 | | 1,259 | |
| 12 months or more | | 3,395 | | 225 | | 1,017 | | | 321 | | 87 | | 73 | | | 9 | | 8 | | 9 | | | 3,725 | | 320 | | 1,099 | |
| Total | | 12,249 | | 761 | | 3,710 | | | 1,239 | | 346 | | 346 | | | 55 | | 41 | | 33 | | | 13,543 | | 1,148 | | 4,089 | |
| Total bonds | | | | | | | | | | | | | | | | |
| 0-6 months | | 64,229 | | 5,390 | | 8,228 | | | 31,797 | | 9,396 | | 3,221 | | | 486 | | 266 | | 42 | | | 96,512 | | 15,052 | | 11,491 | |
| 7-11 months | | 25,562 | | 2,294 | | 3,398 | | | 3,221 | | 860 | | 210 | | | 28 | | 18 | | 8 | | | 28,811 | | 3,172 | | 3,616 | |
| 12 months or more | | 11,154 | | 1,167 | | 1,733 | | | 9,719 | | 2,754 | | 763 | | | 29 | | 19 | | 12 | | | 20,902 | | 3,940 | | 2,508 | |
| Total excluding Fortitude Re funds withheld assets | | $ | 100,945 | | $ | 8,851 | | 13,359 | | | $ | 44,737 | | $ | 13,010 | | 4,194 | | | $ | 543 | | $ | 303 | | 62 | | | $ | 146,225 | | $ | 22,164 | | 17,615 | |
| Total Fortitude Re funds withheld assets | | | | | | | | | | | | | | $ | 18,296 | | $ | 3,593 | | 1,057 | |
| Total | | | | | | | | | | | | | | $ | 164,521 | | $ | 25,757 | | 18,672 | |
| | | | | | | | | | | | | | | | | | | | | | | | | | | | | | | | | | | | | | | | | | | | | | | | | | |
| December 31, 2021 | | Less Than or Equal to 20% of cost(b) | | Greater than 20% to 50% of cost(b) | | Greater than 50% of cost(b) | | Total |
Aging(a) (dollars in millions) | | Cost(c) | Unrealized loss | Items(d) | | Cost(c) | Unrealized loss | Items(d) | | Cost(c) | Unrealized loss | Items(d) | | Cost(c) | Unrealized loss | Items(d) |
| Investment-grade bonds | | | | | | | | | | | | | | | | |
| 0-6 months | | $ | 22,675 | | $ | 476 | | 2,549 | | | $ | 14 | | $ | 5 | | 3 | | | $ | 1 | | $ | 1 | | 1 | | | $ | 22,690 | | $ | 482 | | 2,553 | |
| 7-11 months | | 1,398 | | 69 | | 196 | | | 4 | | 1 | | 2 | | | 1 | | 1 | | 1 | | | 1,403 | | 71 | | 199 | |
| 12 months or more | | 4,932 | | 276 | | 684 | | | 28 | | 8 | | 9 | | | — | | — | | — | | | 4,960 | | 284 | | 693 | |
| Total | | 29,005 | | 821 | | 3,429 | | | 46 | | 14 | | 14 | | | 2 | | 2 | | 2 | | | 29,053 | | 837 | | 3,445 | |
| Below-investment-grade bonds | | | | | | | | | | | | | | | | |
| 0-6 months | | 3,902 | | 76 | | 1,385 | | | 11 | | 4 | | 12 | | | 4 | | 3 | | 7 | | | 3,917 | | 83 | | 1,404 | |
| 7-11 months | | 972 | | 23 | | 440 | | | 20 | | 5 | | 6 | | | 1 | | 1 | | 1 | | | 993 | | 29 | | 447 | |
| 12 months or more | | 1,624 | | 66 | | 417 | | | 202 | | 51 | | 26 | | | 51 | | 35 | | 18 | | | 1,877 | | 152 | | 461 | |
| Total | | 6,498 | | 165 | | 2,242 | | | 233 | | 60 | | 44 | | | 56 | | 39 | | 26 | | | 6,787 | | 264 | | 2,312 | |
| Total bonds | | | | | | | | | | | | | | | | |
| 0-6 months | | 26,577 | | 552 | | 3,934 | | | 25 | | 9 | | 15 | | | 5 | | 4 | | 8 | | | 26,607 | | 565 | | 3,957 | |
| 7-11 months | | 2,370 | | 92 | | 636 | | | 24 | | 6 | | 8 | | | 2 | | 2 | | 2 | | | 2,396 | | 100 | | 646 | |
| 12 months or more | | 6,556 | | 342 | | 1,101 | | | 230 | | 59 | | 35 | | | 51 | | 35 | | 18 | | | 6,837 | | 436 | | 1,154 | |
| Total excluding Fortitude Re funds withheld assets | | $ | 35,503 | | $ | 986 | | 5,671 | | | $ | 279 | | $ | 74 | | 58 | | | $ | 58 | | $ | 41 | | 28 | | | $ | 35,840 | | $ | 1,101 | | 5,757 | |
| Total Fortitude Re funds withheld assets | | | | | | | | | | | | | | $ | 4,856 | | $ | 174 | | 556 | |
| Total | | | | | | | | | | | | | | $ | 40,696 | | $ | 1,275 | | 6,313 | |
(a)Represents the number of consecutive months that fair value has been less than amortized cost or cost by any amount.
(b)Represents the percentage by which fair value is less than amortized cost or cost at December 31, 2022 and December 31, 2021.
(c)For bonds, represents amortized cost net of allowance.
(d)Item count is by CUSIP by subsidiary.
The allowance for credit losses was $7 million and $5 million for investment grade bonds, and $141 million and $73 million for below-investment-grade bonds as of December 31, 2022 and December 31, 2021, respectively.
Change in Unrealized Gains and Losses on Investments
The change in net unrealized gains and losses on investments in 2022 was primarily attributable to a decrease in the fair value of fixed maturity securities. For 2022, net unrealized losses related to fixed maturity securities were $40.4 billion due to an increase in interest rates.
The change in net unrealized gains and losses on investments in 2021 was primarily attributable to movements in interest rates and spreads. For 2021, net unrealized losses related to fixed maturity securities were $7.5 billion due primarily to an increase in interest rates.
For further discussion of our investment portfolio, see Notes 4 and 5 to the audited annual consolidated financial statements.
Commercial Mortgage Loans
At December 31, 2022 and December 31, 2021, we had direct commercial mortgage loan exposure of $33.0 billion and $30.5 billion, respectively. At December 31, 2022 and December 31, 2021, we had an allowance for credit losses of $531 million and $423 million, respectively.
The following tables present the commercial mortgage loan exposure by location and class of loan based on amortized cost:
| | | | | | | | | | | | | | | | | | | | | | | | | | | | | | | | | | | | | | | | | | | | | | | | | | | | | |
| Number of Loans(a) | Class | Total | | Percent of Total |
| Excluding Fortitude Re Funds Withheld Assets (dollars in millions) | | Apartments | | Offices | | Retail | | Industrial | | Hotel | | Others | |
| December 31, 2022 | | | | | | | | | | | | | | | | | |
| State: | | | | | | | | | | | | | | | | | |
| New York | 72 | | $ | 1,355 | | $ | 3,820 | | $ | 282 | | $ | 357 | | $ | 71 | | $ | — | | | $ | 5,885 | | 20 | % |
| California | 51 | | 507 | | 653 | | 112 | | 1,129 | | 611 | | 13 | | 3,025 | | 10 | % |
| New Jersey | 59 | | 1,829 | | 143 | | 322 | | 436 | | 7 | | 22 | | 2,759 | | 9 | % |
| Texas | 41 | | 692 | | 687 | | 137 | | 155 | | 143 | | — | | 1,814 | | 6 | % |
| Massachusetts | 16 | | 465 | | 328 | | 470 | | 15 | | — | | — | | 1,278 | | 4 | % |
| Florida | 51 | | 344 | | 119 | | 212 | | 151 | | 355 | | — | | 1,181 | | 4 | % |
| Illinois | 20 | | 487 | | 353 | | 3 | | 41 | | — | | 20 | | 904 | | 3 | % |
| Ohio | 19 | | 80 | | 7 | | 83 | | 408 | | — | | — | | 578 | | 2 | % |
| Pennsylvania | 16 | | 77 | | 94 | | 189 | | 190 | | 24 | | — | | 574 | | 2 | % |
| District of Columbia | 6 | | 369 | | — | | — | | — | | 11 | | — | | 380 | | 1 | % |
| Other States | 114 | | 1,719 | | 333 | | 550 | | 652 | | 255 | | 19 | | 3,528 | | 12 | % |
| Foreign | 90 | | 4,212 | | 1,423 | | 327 | | 1,264 | | 284 | | 216 | | 7,726 | | 27 | % |
Total(b) | 555 | | $ | 12,136 | | $ | 7,960 | | $ | 2,687 | | $ | 4,798 | | $ | 1,761 | | $ | 290 | | $ | 29,632 | | 100 | % |
Fortitude Re funds
withheld assets | | | | | | | | | | | | | | | $ | 3,361 | | |
| Total Commercial Mortgages | | | | | | | | | | | | | | | $ | 32,993 | | |
| December 31, 2021 | | | | | |
| State: | | | | | | | | | | | | | | | | | |
| New York | 66 | | $ | 1,857 | | $ | 3,645 | | $ | 254 | | $ | 359 | | $ | 71 | | $ | — | | | $ | 6,186 | | 23 | % |
| California | 45 | | 363 | | 813 | | 172 | | 449 | | 633 | | 13 | | 2,443 | | 9 | |
| New Jersey | 35 | | 1,782 | | 22 | | 344 | | 201 | | 8 | | 22 | | 2,379 | | 9 | |
| Texas | 38 | | 458 | | 811 | | 150 | | 158 | | 143 | | — | | 1,720 | | 6 | |
| Massachusetts | 11 | | 425 | | 203 | | 485 | | 16 | | — | | — | | 1,129 | | 4 | |
| Florida | 48 | | 271 | | 152 | | 217 | | 165 | | 261 | | — | | 1,066 | | 4 | |
| Illinois | 15 | | 468 | | 348 | | 9 | | 45 | | — | | 21 | | 891 | | 3 | |
| Ohio | 18 | | 83 | | 7 | | 88 | | 160 | | — | | — | | 338 | | 1 | |
| Pennsylvania | 19 | | 78 | | 105 | | 337 | | 66 | | 25 | | — | | 611 | | 2 | |
| District of Columbia | 7 | | 344 | | 53 | | — | | — | | 12 | | — | | 409 | | 1 | |
| Other States | 113 | | 1,323 | | 433 | | 656 | | 394 | | 305 | | — | | 3,111 | | 11 | |
| Foreign | 56 | | 3,925 | | 1,228 | | 714 | | 845 | | 315 | | 245 | | 7,272 | | 27 | |
Total(b) | 471 | | $ | 11,377 | | $ | 7,820 | | $ | 3,426 | | $ | 2,858 | | $ | 1,773 | | $ | 301 | | $ | 27,555 | | 100 | % |
Fortitude Re funds
withheld assets | | | | | | | | | | | | | | | $ | 2,973 | | |
| Total Commercial Mortgages | | | | | | | | | | | | | | | $ | 30,528 | | |
(a) Reflects updated loan count as of December 31, 2022.
(b) Does not reflect allowance for credit losses.
The following tables present debt service coverage ratios and loan-to-value ratios for commercial mortgages:
| | | | | | | | | | | | | | | | | | | | | | | | | | |
| | Debt Service Coverage Ratios(a) |
| (in millions) | | >1.20X | | 1.00X - 1.20X | | <1.00X | | Total |
| December 31, 2022 | | | | | | | | |
Loan-to-value ratios(b) | | | | | | | | |
| Less than 65% | | $ | 18,524 | | $ | 2,817 | | $ | 628 | | $ | 21,969 |
| 65% to 75% | | 4,497 | | 429 | | 435 | | 5,361 |
| 76% to 80% | | 314 | | — | | 46 | | 360 |
| Greater than 80% | | 1,338 | | 154 | | 450 | | 1,942 |
Total commercial mortgages excluding Fortitude Re(c) | | $ | 24,673 | | $ | 3,400 | | $ | 1,559 | | $ | 29,632 |
| Total commercial mortgages including Fortitude Re | | | | | | | | $ | 3,361 |
| Total commercial mortgages | | | | | | | | $ | 32,993 |
| December 31, 2021 | | |
Loan-to-value ratios(b) | | | | | | | | |
| Less than 65% | | $ | 15,526 | | $ | 3,081 | | $ | 1,736 | | $ | 20,343 |
| 65% to 75% | | 4,629 | | 1,044 | | 341 | | 6,014 |
| 76% to 80% | | 237 | | — | | 52 | | 289 |
| Greater than 80% | | 758 | | 45 | | 106 | | 909 |
Total commercial mortgages excluding Fortitude Re(c) | | $ | 21,150 | | $ | 4,170 | | $ | 2,235 | | $ | 27,555 |
| Total commercial mortgages including Fortitude Re | | | | | | | | $ | 2,973 |
| Total commercial mortgages | | | | | | | | $ | 30,528 |
(a)The debt service coverage ratio compares a property’s net operating income to its debt service payments, including principal and interest. Our weighted average debt service coverage ratio was 1.9X and 1.9X at December 31, 2022 and December 31, 2021, respectively. The debt service coverage ratios have been updated within the last three months.
(b)The loan-to-value ratio compares the current unpaid principal balance of the loan to the estimated fair value of the underlying property collateralizing the loan. Our weighted average loan-to-value ratio was 59% and 57% at December 31, 2022 and December 31, 2021, respectively. The loan-to-value ratios have been updated within the last three to nine months.
(c)Does not reflect allowance for credit losses.
Residential Mortgage Loans
At December 31, 2022 and December 31, 2021, we had direct residential mortgage loan exposure of $5.9 billion and $4.7 billion, respectively.
The following tables present credit quality performance indicators for residential mortgages by year of vintage:
| | | | | | | | | | | | | | | | | | | | | | | | | | | | | | | | | | | | | | | | | | | | |
| December 31, 2022 | | | | | | | | | | | | | | |
| (in millions) | | 2022 | | 2021 | | 2020 | | 2019 | | 2018 | | Prior | | Total |
FICO:(a) | | | | | | | | | | | | | | |
| 780 and greater | | $ | 294 | | $ | 2,141 | | $ | 652 | | $ | 229 | | $ | 76 | | $ | 437 | | $ | 3,829 |
| 720 - 779 | | 536 | | 711 | | 167 | | 75 | | 32 | | 134 | | 1,655 |
| 660 - 719 | | 163 | | 79 | | 28 | | 16 | | 9 | | 47 | | 342 |
| 600 - 659 | | 2 | | 4 | | 2 | | 1 | | 2 | | 13 | | 24 |
| Less than 600 | | — | | — | | — | | 1 | | — | | 5 | | 6 |
Total residential mortgages(b)(c) | | $ | 995 | | $ | 2,935 | | $ | 849 | | $ | 322 | | $ | 119 | | $ | 636 | | $ | 5,856 |
| | | | | | | | | | | | | | | | | | | | | | | | | | | | | | | | | | | | | | | | | | | | |
| December 31, 2021 | | | | | | | | | | | | | | |
| (in millions) | | 2021 | | 2020 | | 2019 | | 2018 | | 2017 | | Prior | | Total |
FICO:(a) | | | | | | | | | | | | | | |
| 780 and greater | | $ | 1,398 | | $ | 678 | | $ | 284 | | $ | 100 | | $ | 107 | | $ | 325 | | $ | 2,892 |
| 720 - 779 | | 1,118 | | 225 | | 83 | | 41 | | 36 | | 94 | | 1,597 |
| 660 - 719 | | 44 | | 39 | | 20 | | 11 | | 13 | | 33 | | 160 |
| 600 - 659 | | 1 | | 1 | | 2 | | 3 | | 2 | | 6 | | 15 |
| Less than 600 | | — | | — | | — | | 1 | | 1 | | 6 | | 8 |
Total residential mortgages(b)(c) | | $ | 2,561 | | $ | 943 | | $ | 389 | | $ | 156 | | $ | 159 | | $ | 464 | | $ | 4,672 |
(a)Fair Isaac Corporation (“FICO”) is the credit quality indicator used to evaluate consumer credit risk for residential mortgage loan borrowers and have been updated within the last three months.
(b)There are no residential mortgage loans under Fortitude Re funds withheld assets.
(c)Does not include allowance for credit losses.
For additional discussion on commercial mortgage loans, see Note 6 of the Notes to the audited annual consolidated financial statements.
For additional discussion on credit losses, see Note 5 of the Notes to the audited annual consolidated financial statements.
Net Realized Gains and Losses
| | | | | | | | | | | | | | | | | | | | | | | | | | | | | | | | | | | | | | | | | | | | | | | | | | | | | | | | |
| Years Ended December 31, | | 2022 | | 2021 | | 2020 |
| (in millions) | | Excluding Fortitude
Re Funds
Withheld
Assets | | Fortitude
Re Funds
Withheld
Assets | | Total | | Excluding
Fortitude
Re Funds
Withheld
Assets | | Fortitude
Re Funds
Withheld
Assets | | Total | | Excluding
Fortitude
Re Funds
Withheld
Assets | | Fortitude
Re Funds
Withheld
Assets | | Total |
| Sales of fixed maturity securities | | $ | (325) | | | $ | (232) | | | $ | (557) | | | $ | 103 | | | $ | 647 | | | $ | 750 | | | $ | (78) | | | $ | 660 | | | $ | 582 | |
| | | | | | | | | | | | | | | | | | |
Change in allowance for credit losses on
fixed maturity securities | | (115) | | | (31) | | | (146) | | | 8 | | | 3 | | | 11 | | | (186) | | | 17 | | | (169) | |
Change in allowance for credit losses on
loans | | (76) | | | (44) | | | (120) | | | 133 | | | 8 | | | 141 | | | (61) | | | 3 | | | (58) | |
Foreign exchange transactions, net of related hedges(a) | | 695 | | | 61 | | | 756 | | | 310 | | | 20 | | | 330 | | | 89 | | | (5) | | | 84 | |
Variable annuity embedded derivatives, net of related hedges(a)(b) | | — | | | — | | | — | | | — | | | — | | | — | | | 159 | | | — | | | 159 | |
Fixed index annuity and index life embedded derivatives, net of related hedges(a) | | (117) | | | — | | | (117) | | | (3) | | | — | | | (3) | | | (766) | | | — | | | (766) | |
All other derivatives and hedge accounting(b) | | (43) | | | (181) | | | (224) | | | (6) | | | 9 | | | 3 | | | (94) | | | 423 | | | 329 | |
Sales of alternative investments and real
estate investments | | 179 | | | 43 | | | 222 | | | 794 | | | 237 | | | 1,031 | | | 158 | | | (96) | | | 62 | |
Other | | (57) | | | (13) | | | (70) | | | 176 | | | — | | | 176 | | | 14 | | | — | | | 14 | |
| Net realized gains (losses) – excluding Fortitude Re funds withheld embedded derivative | | 141 | | | (397) | | | (256) | | | 1,515 | | | 924 | | | 2,439 | | | (765) | | | 1,002 | | | 237 | |
| Net realized gains (losses) on Fortitude Re funds withheld embedded derivative | | — | | | 6,347 | | | 6,347 | | | — | | | (687) | | | (687) | | | — | | | (3,978) | | | (3,978) | |
| Net realized gains (losses) | | $ | 141 | | | $ | 5,950 | | | $ | 6,091 | | | $ | 1,515 | | | $ | 237 | | | $ | 1,752 | | | $ | (765) | | | $ | (2,976) | | | $ | (3,741) | |
(a) The results for the years ended December 31, 2022 and 2021 have been updated to reflect the adoption of LDTI. No updates have been made to the results for the year ended December 31, 2020 as our effective date for LDTI adoption was January 1, 2021.
(b) There is no 2022 or 2021 activity for Variable Annuity Embedded Derivatives, net of related hedges, and certain Index Annuity Embedded Derivatives, net of related hedges, because guaranteed benefit riders on annuity contracts are accounted for as MRBs after the adoption of LDTI effective on January 1, 2021. Derivative activity related to hedging certain MRBs is recorded in Change in the fair value of MRBs, net. For additional disclosures about MRBs, see Note 13.
Higher Net realized gains excluding Fortitude Re funds withheld assets in 2022 compared to the prior year were due primarily to higher derivative gains, which were partially offset by losses in sales of securities versus lower gains in the prior periods.
Variable annuity embedded derivatives, net of related hedges, reflected higher gains in 2022 compared to the prior year. Fair value gains or losses in the hedging portfolio are typically not fully offset by increases or decreases in liabilities due to the non-performance or ‘‘own credit’’ risk adjustment used in the valuation of the variable annuities with GMWB embedded derivative, which are not hedged as part of our economic hedging program.
Net realized gains (losses) on Fortitude Re funds withheld assets primarily reflect increases in the valuation of the modified coinsurance and funds withheld assets. Increases in the valuation of these assets result in losses to Corebridge as the appreciation on the assets must under those reinsurance arrangements be transferred to Fortitude Re.
For further discussion of our investment portfolio, see Note 5 to our audited annual consolidated financial statements.
Other Invested Assets
We seek to enhance returns through investment in a diversified portfolio of alternative asset classes, including private equity, real estate equity and hedge funds.
The following table presents the carrying value of our other invested assets by type:
| | | | | | | | | | | | | | | | | | | | | | | | | | |
| | December 31, 2022 | | December 31, 2021 |
| (in millions) | | Excluding Fortitude Re Funds Withheld Assets | Fortitude Re Funds Withheld Assets | Total | | Excluding Fortitude Re Funds Withheld Assets | Fortitude Re Funds Withheld Assets | Total |
Alternative investments(a)(b) | | $ | 6,121 | $ | 1,893 | $ | 8,014 | | $ | 5,921 | $ | 1,606 | $ | 7,527 |
Investment real estate(c) | | 1,698 | 133 | 1,831 | | 2,148 | 201 | 2,349 |
All other investments(d) | | 573 | — | 573 | | 691 | — | 691 |
| Total | | $ | 8,392 | $ | 2,026 | $ | 10,418 | | $ | 8,760 | $ | 1,807 | $ | 10,567 |
(a)At December 31, 2022, included hedge funds of $884 million and private equity funds of $7.1 billion. At December 31, 2021, included hedge funds of $1.0 billion and private equity funds of $6.5 billion. Amounts include Fortitude Re funds withheld assets. Private equity funds are generally reported on a one-quarter lag.
(b)At December 31, 2022, 77% of our hedge fund portfolio is available for redemption in 2022. The remaining 23% will be available for redemption between 2023 and 2028. At December 31, 2021, approximately 73% of our hedge fund portfolio is available for redemption in 2022. The remaining 27% will be available for redemption between 2023 and 2028.
(c)Net of accumulated depreciation of $616 million and $493 million at December 31, 2022 and December 31, 2021, respectively. The accumulated depreciation related to the investment real estate held by affordable housing partnerships is $124 million and $123 million at December 31, 2022 and December 31, 2021, respectively.
(d)Includes Corebridge’s ownership interest in Fortitude Holdings, which is recorded using the measurement alternative for equity securities. Our investment in Fortitude Holdings totaled $156 million and $100 million at December 31, 2022 and December 31, 2021, respectively.
Derivatives and Hedge Accounting
We use derivatives and other financial instruments as part of our financial risk management programs and as part of our investment operations. Interest rate derivatives (such as interest rate swaps) are used to manage interest rate risk associated with embedded derivatives and MRBs contained in insurance contract liabilities and fixed maturity securities as well as other interest rate sensitive assets and liabilities. Foreign exchange derivatives (principally foreign exchange forwards and swaps) are used to economically mitigate risk associated with foreign denominated investments, net capital exposures and foreign currency transactions. Equity derivatives are used to mitigate financial risk embedded in certain insurance liabilities and economically hedge certain investments. We use credit derivatives to manage our credit exposures. The derivatives are effective economic hedges of the exposures that they are meant to offset. In addition to hedging activities, we also enter into derivative instruments with respect to investment operations, which may include, among other things, CDSs and purchases of investments with embedded derivatives, such as equity linked notes and convertible bonds.
We designated certain derivatives entered into with related parties as fair value hedges of available-for-sale investment securities held by our insurance subsidiaries. The fair value hedges include foreign currency forwards and cross-currency swaps designated as hedges of the change in fair value of foreign currency denominated available-for-sale securities attributable to changes in foreign exchange rates. We also designated certain interest rate swaps entered into with related parties as fair value hedges of fixed rate GICs and commercial mortgage loans attributable to changes in benchmark interest rates.
Credit risk associated with derivative counterparties exists for a derivative contract when that contract has a positive fair value to us. The maximum potential exposure may increase or decrease during the life of the derivative commitments as a function of maturity and market conditions. All derivative transactions must be transacted within counterparty limits.
We utilize various credit enhancements, including letters of credit, guarantees, collateral, credit triggers, credit derivatives, margin agreements and subordination, to reduce the credit risk related to outstanding financial derivative transactions. We require credit enhancements in connection with specific transactions based on, among other things, the creditworthiness of the counterparties and the transaction size and maturity. Furthermore, we enter into certain agreements that have the benefit of set-off and close-out netting provisions, such as ISDA Master Agreements. These provisions provide that, in the case of an early termination of a transaction, we can set off receivables from a counterparty against payables to the same counterparty arising out of all covered transactions. As a result, where a legally enforceable netting agreement exists, the fair value of the transaction with the counterparty represents the net sum of estimated fair values.
For additional information on embedded derivatives, see Notes 4 and 10 of the Notes to the audited annual consolidated financial statements.
The following table presents the notional amounts of our derivatives and the fair value of derivative assets and liabilities in the Consolidated Balance Sheets:
| | | | | | | | | | | | | | | | | | | | | | | | | | | | | | | | | | | | | | |
| | December 31, 2022 | | December 31, 2021 |
| | Gross Derivative Assets | | Gross Derivative Liabilities | | Gross Derivative Assets | | Gross Derivative Liabilities |
| (in millions) | | Notional Amount | Fair Value | | Notional Amount | Fair Value | | Notional Amount | Fair Value | | Notional Amount | Fair Value |
Derivatives designated as hedging instruments(a) | | | | | | | | | | | | |
| Interest rate contracts | | $ | 155 | $ | 202 | | $ | 1,798 | $ | 77 | | $ | 352 | $ | 274 | | $ | 980 | $ | 14 |
| Foreign exchange contracts | | 3,166 | 523 | | 3,095 | 162 | | 3,705 | 244 | | 2,518 | 49 |
Derivatives not designated as hedging instruments(a) | | | | | | | | | | | | |
| Interest rate contracts | | 23,916 | 481 | | 16,263 | 1,859 | | 21,811 | 1,078 | | 21,129 | 1,377 |
| Foreign exchange contracts | | 4,357 | 643 | | 6,126 | 428 | | 3,883 | 405 | | 5,112 | 307 |
| Equity contracts | | 26,041 | 417 | | 9,962 | 27 | | 60,192 | 4,670 | | 38,734 | 4,071 |
| Credit contracts | | — | — | | — | — | | — | 1 | | — | — |
Other contracts(b) | | 47,128 | 15 | | 48 | — | | 43,839 | 13 | | 133 | — |
| Total derivatives, excluding Fortitude Re funds withheld | | $ | 104,763 | | $ | 2,281 | | | $ | 37,292 | | $ | 2,553 | | | $ | 133,782 | | $ | 6,685 | | | $ | 68,606 | | $ | 5,818 | |
| Total derivatives, Fortitude Re fund withheld | | $ | 4,382 | $ | 971 | | $ | 6,096 | $ | 782 | | $ | 8,602 | $ | 582 | | $ | 2,932 | $ | 195 |
| Total derivatives, gross | | 109,145 | 3,252 | | 43,388 | 3,335 | | 142,384 | 7,267 | | 71,538 | 6,013 |
Counterparty netting(c) | | | (2,547) | | | | (2,547) | | | | (5,785) | | | | (5,785) | |
Cash collateral(d) | | | (406) | | | | (691) | | | | (798) | | | | (37) | |
Total derivatives on Consolidated Balance Sheets(e) | | | $ | 299 | | | $ | 97 | | | $ | 684 | | | $ | 191 |
(a)Fair value amounts are shown before the effects of counterparty netting adjustments and offsetting cash collateral.
(b)Consists primarily of SVWs and contracts with multiple underlying exposures.
(c)Represents netting of derivative exposures covered by a qualifying master netting agreement.
(d)Represents cash collateral posted and received that is eligible for netting.
(e)Freestanding derivatives only, excludes embedded derivatives. Derivative instrument assets and liabilities are recorded in Other assets and Other liabilities, respectively. Fair value of assets related to bifurcated embedded derivatives were both zero at December 31, 2022 and December 31, 2021. Fair value of liabilities related to bifurcated embedded derivatives was $6.7 billion and $13.6 billion, respectively, at December 31, 2022 and December 31, 2021. A bifurcated embedded derivative is generally presented with the host contract in the Consolidated Balance Sheets. Embedded derivatives are primarily related to guarantee features in fixed index annuities and index universal life contracts, which include equity and interest rate components and the funds withheld arrangement with Fortitude Re. For additional information, see Note 7.
For additional information, see Note 10 of the Notes to the audited annual consolidated financial statements.
ITEM 7 | Future Policy Benefits, Policyholder Contract Deposits and Market Risk Benefits
Future Policy Benefits, Policyholder Contract Deposits and Market Risk Benefits
SIGNIFICANT REINSURANCE AGREEMENTS, VARIABLE ANNUITY GUARANTEED BENEFITS AND HEDGING RESULTS, AND ACTUARIAL UPDATES
The following section provides discussion of our significant reinsurance agreements, variable annuity guaranteed benefits and hedging results and actuarial updates regarding our business segments.
Significant Reinsurance Agreements
In the first quarter of 2018, AIG entered into a series of reinsurance transactions with Fortitude Re related to certain run-off operations (i.e., non-core insurance lines for which policies are still in force until they lapse or otherwise terminate but new policies are no longer issued). As of December 31, 2022 and December 31, 2021, approximately $26.8 billion and $34.1 billion, respectively, of liabilities from our run-off lines (i.e., certain annuities written prior to April 2012, along with exposures to whole life, LTC and exited accident and health product lines) related to business written by multiple wholly owned AIG subsidiaries had been ceded to Fortitude Re under these reinsurance transactions. We currently own a less than 3% indirect interest in Fortitude Re.
Refer to “Significant Factors Impacting Our Results” for additional information on the Fortitude Re reinsurance agreements.
Effective July 1, 2016, AGL entered into an agreement to cede approximately $5 billion of statutory reserves for certain whole life policies to an unaffiliated reinsurer. Effective December 31, 2016, AGL recaptured term and universal life reserves of $16 billion from AGC, subject to the NAIC’s Model Regulation “Valuation of Life Insurance Policies” (“Regulation XXX”) and NAIC Actuarial Guideline 38 (“Guideline AXXX”) and ceded approximately $14 billion of such statutory reserves to the same unaffiliated reinsurer under an amendment to the July 1, 2016 agreement.
For a summary of significant reinsurers, see “Accounting Policies and Pronouncements—Critical Accounting Estimates—Reinsurance Recoverable.”
For a summary of statutory permitted practices, see “Notes to Consolidated Financial Statements—Statutory Financial Data and Restrictions—Statutory Permitted Accounting Practice.”
Variable Annuity Guaranteed Benefits and Hedging Results
Our Individual Retirement and Group Retirement businesses offer variable annuity products with GMWB riders that provide guaranteed living benefit features. The liabilities are accounted for as MRBs measured at fair value. The fair value of the MRBs may fluctuate significantly based on market interest rates, equity prices, credit spreads, market volatility, policyholder behavior and other factors.
In addition to risk-mitigating features in our variable annuity product design, we have an economic hedging program designed to manage market risk from GMWB, including exposures to changes in interest rates, equity prices, credit spreads and volatility. The hedging program includes all in-force GMWB policies and utilizes derivative instruments, including but not limited to equity options, futures contracts and interest rate swap and swaption contracts, as well as fixed maturity securities with a fair value election.
For additional discussion of market risk management related to these product features, see “—Quantitative and Qualitative Disclosures about Market Risk.”
Differences in Valuation of MRBs and Economic Hedge Target
Our variable annuity hedging program utilizes an economic hedge target, which represents an estimate of the underlying economic risks in our GMWB riders. The economic hedge target differs from the GAAP valuation of the MRBs, creating volatility in our net income (loss) primarily due to the following:
•the MRBs include both the GMWB riders and the GMDB riders while the hedge program is targeting the economic risks of just the GMWB rider.
•the economic hedge target includes 100% of GMWB rider fees in present value calculations; the GAAP valuation reflects those fees attributed to the MRBs such that the initial value at contract issue equals zero since the MRB includes GMWBs and GMDBs these attributed fees are typically larger than just the GMWB rider fees;
•the economic hedge target uses best estimate actuarial assumptions and excludes explicit risk margins used for GAAP valuation, such as margins for policyholder behavior, mortality and volatility; and
ITEM 7 | Future Policy Benefits, Policyholder Contract Deposits and Market Risk Benefits
•the economic hedge target excludes our own credit risk changes (non-performance adjustments) used in the GAAP valuation, which are recognized in OCI. The GAAP valuation has different sensitivities to movements in interest rates and other market factors, and to changes from actuarial assumption updates, than the economic hedge target.
For more information on our valuation methodology for MRBs, see Note 4 to our audited annual consolidated financial statements.
The market value of the hedge portfolio compared to the economic hedge target at any point in time may be different and is not expected to be fully offsetting. In addition to the derivatives held in conjunction with the variable annuity hedging program, we generally have cash and invested assets available to cover future claims payable under these guarantees. The primary sources of difference between the change in the fair value of the hedging portfolio and the economic hedge target include:
•basis risk due to the variance between expected and actual fund returns, which may be either positive or negative;
•realized volatility versus implied volatility;
•actual versus expected changes in the hedge target driven by assumptions not subject to hedging, particularly policyholder behavior; and
•risk exposures that we have elected not to explicitly or fully hedge.
The following table presents a reconciliation between the fair value of the GAAP MRBs and the value of our economic hedge target:
| | | | | | | | | | | | | | | |
| At December 31, |
| (in millions) | 2022 | | 2021 | | |
| Reconciliation of market risk benefits and economic hedge target: | | | | | |
| Market risk benefits liability, net | $ | 1,657 | | | $ | 3,447 | | |
| Exclude non-performance risk adjustment | (479) | | | (1,686) | | | |
| Market risk benefits liability, excluding NPA | 1,178 | | | 1,761 | | |
| Adjustments for risk margins and differences in valuation | (281) | | | 1,047 | | | |
| Economic hedge target liability | $ | 897 | | | $ | 2,808 | | |
Impact on Pre-tax Income (Loss)
The impact on our pre-tax income (loss) of variable annuity guaranteed benefits and related hedging results includes changes in the fair value of MRBs and changes in the fair value of related derivative hedging instruments, and along with attributed rider fees and net of benefits associated with MRBs are together recognized in Change in the fair value of market risk benefits, net, with the exception of our own credit risk changes, which are recognized in OCI. Changes in the fair value of market risk benefits, net are excluded from APTOI of Individual Retirement and Group Retirement.
The change in the fair value of the MRBs and the change in the value of the hedging portfolio are not expected to be fully offsetting, primarily due to the differences in valuation between the economic hedge target, the GAAP MRBs and the fair value of the hedging portfolio, as discussed above. When corporate credit spreads widen, the change in the NPA spread generally reduces the fair value of the MRBs liabilities, resulting in a gain in AOCI, and when corporate credit spreads tighten, the change in the NPA spread generally increases the fair value of the MRBs liabilities, resulting in a loss in AOCI. In addition to changes driven by credit market-related movements in the NPA spread, the NPA balance also reflects changes in business activity and in the net amount at risk from the underlying guaranteed living benefits.
Change in Economic Hedge Target
The decrease in the economic hedge target liability in 2022 was primarily driven by higher interest rates and widening credit spreads, offset by lower equity markets. The decrease in the economic hedge target liability in 2021 was primarily driven by higher interest rates and higher equity markets, partially offset by losses from the review and update of assumptions. The increase in the economic hedge target liability in 2020 was primarily due to lower interest rates and tighter credit spreads, offset by gains from the review and update of actuarial assumptions and higher equity markets.
Update of Actuarial Assumptions and Models
Our life insurance companies review and update actuarial assumptions at least annually, generally in the third quarter.
ITEM 7 | Future Policy Benefits, Policyholder Contract Deposits and Market Risk Benefits
Prior to the adoption of the Targeted Improvements to the Accounting for Long-Duration Contracts Standard
Investment-oriented products
We reviewed and updated estimated gross profit assumptions used to amortize DAC and related items (which may include VOBA, DSI and unearned revenue reserves) and assessments used to accrue guaranteed benefit reserves at least annually. Estimated gross profit projections included assumptions for investment-related returns and spreads (including investment expenses), product-related fees and expenses, mortality gains and losses, policyholder behavior and other factors. In estimating future gross profits, lapse assumptions required judgment and could have a material impact on DAC amortization. If the assumptions used for estimated gross profits changed significantly, DAC and related reserves were recalculated using the new projections, and any resulting adjustment was included in income. Updating such projections may have resulted in acceleration of amortization in some products and deceleration of amortization in other products.
We also reviewed assumptions related to their respective GMWB living benefits that were accounted for as embedded derivatives and measured at fair value. The fair value of these embedded derivatives was based on actuarial assumptions, including policyholder behavior, as well as capital market assumptions.
Traditional long-duration products
For traditional long-duration products discussed below, which included whole life insurance, term life insurance, accident and health insurance, PRT group annuities, and life-contingent single premium immediate annuities and structured settlements, a “lock-in” principle applies. The assumptions used to calculate the benefit liabilities and DAC were set when a policy is issued and did not change with changes in actual experience unless a loss recognition event occurred. A loss recognition event occurred when current liabilities together with expected future premiums were not sufficient to provide for all future benefits, expenses and DAC amortization, net of reinsurance. A loss recognition event was driven by observed changes in actual experience or estimates differing significantly from “locked-in” assumptions. Underlying assumptions, including interest rates, were reviewed periodically and updated as appropriate for loss recognition testing purposes. Reserves for contracts in loss recognition have primarily been reinsured to Fortitude Re.
Subsequent to the adoption of the Targeted Improvements to the Accounting for Long-Duration Contracts Standard
Investment-oriented products
We review and update assessments used to value our universal life product with secondary guarantees at least annually. These benefit reserves are also adjusted to reflect the changes in the fair value of available-for-sale securities with an offset to OCI. DAC and related items (which may include VOBA, DSI and unearned revenue reserves) are amortized on a constant level basis.
We also review assumptions related to variable annuities, fixed annuities, and fixed index annuities guaranteed benefits that are accounted for as MRBs or embedded derivatives and measured at fair value. The fair value of these MRBs or embedded derivatives is based on actuarial assumptions, including policyholder behavior, as well as capital market assumptions.
Traditional long-duration products
For traditional long-duration products discussed below, which includes whole life insurance, term life insurance, accident and health insurance, PRT, and life-contingent single premium immediate annuities and structured settlements, cash flow assumptions are reviewed at least annually to determine any changes in the liability for future policy benefits. DAC and related items (which may include VOBA) are amortized on a constant level basis.
The net impacts to pre-tax income and APTOI because of the update of actuarial assumptions for the years ended December 31, 2022, 2021 and 2020 are shown in the following tables.
ITEM 7 | Future Policy Benefits, Policyholder Contract Deposits and Market Risk Benefits
The following table presents the increase (decrease) in adjusted pre-tax operating income and pre-tax income resulting from the annual update of actuarial assumptions, by line item as reported in Results of Operations:
| | | | | | | | | | | | | | | | | | | | | | | | | | |
| | Years Ended December 31, |
| (in millions) | | 2022* | | | | | | 2021* | | 2020 | | |
| Premiums | | $ | — | | | | | | | $ | (41) | | | $ | — | | | |
| Policy fees | | — | | | | | | — | | (106) | | |
| Interest credited to policyholder account balances | | — | | | | | | — | | (6) | | |
| Amortization of deferred policy acquisition costs | | — | | | | | | — | | 225 | | |
| Policyholder benefits | | 29 | | | | | | 89 | | (246) | | |
| Increase (decrease) in adjusted pre-tax operating income | | 29 | | | | | | 48 | | (133) | | |
| Change in the fair value of market risk benefits, net | | 105 | | | | | | (17) | | — | | |
| Change in DAC related to net realized gains (losses) | | — | | | | | | — | | (44) | | |
| Net realized gains | | (2) | | | | | | — | | 142 | | |
| Increase (decrease) in pre-tax income | | $ | 132 | | | | | | | $ | 31 | | | $ | (35) | | | |
* The results for the years ended December 31, 2022 and 2021 have been updated to reflect the adoption of LDTI. No updates have been made to the results for the year ended December 31, 2020 as our effective date for LDTI adoption was January 1, 2021.
The following table presents the increase (decrease) in adjusted pre-tax operating income resulting from the annual update of actuarial assumptions, by segment and product line:
| | | | | | | | | | | | | | | | | | | | | | | | | | |
| | | Years Ended December 31, |
| (in millions) | | | | 2022(a) | | 2021(a) | | 2020 | | | | |
| Individual Retirement | | | | | | | | | | | | |
| Fixed Annuities | | | | $ | — | | | $ | — | | | $ | (77) | | | | | |
| Variable Annuities | | | | — | | — | | 13 | | | | |
| Fixed Index Annuities | | | | — | | — | | (30) | | | | |
| Total Individual Retirement | | | | — | | — | | (94) | | | | |
| Group Retirement | | | | — | | — | | 68 | | | | |
| Life Insurance | | | | 25 | | 48 | | (108) | | | | |
| Institutional Markets | | | | 4 | | — | | 1 | | | | |
Increase (decrease) in adjusted pre-tax operating income(b) | | | | $ | 29 | | | $ | 48 | | | $ | (133) | | | | | |
(a) The results for the years ended December 31, 2022 and 2021 have been updated to reflect the adoption of LDTI. No updates have been made to the results for the year ended December 31, 2020 as our effective date for LDTI adoption was January 1, 2021.
(b) Liabilities ceded to Fortitude Re are reported in Corporate and Other. There was no impact to adjusted pre-tax operating income due to the annual update of actuarial assumptions as these liabilities are 100% ceded.
Update of Actuarial Assumptions Impact to Consolidated pre-tax income (loss)
Corebridge recognized a $132 million favorable, $31 million favorable, and $35 million unfavorable impact to pre-tax income for 2022, 2021, and 2020, respectively, attributable to the annual actuarial assumption review. For 2022, the assumption update impacts were driven by updates to the relationship between projected equity growth and interest rates, and updates to premium and withdrawal assumption for annuities, partially offset by updated investments spreads on Life Insurance products. For 2021, the assumption update impacts were mainly due to updated lapse and mortality expectations for annuities, along with updates to mortality assumptions on traditional life products and updated universal life product reserving methodology. For 2020, the assumption update impacts were mainly due to, updated lapse offset by embedded derivative and spread expectations for annuities. These changes reduce the DAC asset and extend the DAC amortization period to capture most of the estimated gross profits. Assumptions left unchanged were deemed to be consistent with management’s best estimate at the time of the review.
Update of Actuarial Assumptions Impact to Consolidated APTOI
Corebridge recognized a $29 million favorable, $48 million favorable, and $133 million unfavorable impact to adjusted pre-tax operating income for the years ended December 31, 2022, 2021, and 2020, respectively, attributable to the annual actuarial assumption review. For 2022, the assumption update impacts were primarily driven by modeling refinements to reflect actual versus expected asset data related to calls and capital gains for the Life Insurance business. For 2021, the assumption update impacts were primarily driven by updates to mortality assumptions on traditional life products and updated universal life product reserving methodology. For 2020, the assumption update impacts were driven primarily by changes to earned rates causing spread
ITEM 7 | Future Policy Benefits, Policyholder Contract Deposits and Market Risk Benefits
compression, partially offset by favorable updates to full surrender assumptions on fixed annuities, and in Life Insurance primarily due to mortality modeling enhancements.
ITEM 7 | Liquidity and Capital Resources
Liquidity and Capital Resources
OVERVIEW
Liquidity is defined as cash and unencumbered assets that can be monetized in a short period of time at a reasonable cost. In addition to the on-balance-sheet liquid assets, liquidity resources include availability under committed bank credit facilities.
Capital refers to the long-term financial resources available to support the operation of our businesses, fund business growth, and cover financial and operational needs that arise from adverse circumstances.
We aim to manage our liquidity and capital resources prudently through a well-defined risk management framework that involves various target operating thresholds as well as minimum requirements during periods of stress.
We believe that we have sufficient liquidity and capital resources to satisfy future requirements and meet our obligations to policyholders, customers, creditors and debtholders, including those arising from reasonably foreseeable contingencies or events.
For a discussion regarding risks associated with liquidity and capital, see “Risk Factors—Risks Relating to Our Investment Portfolio, Liquidity, Capital and Credit” in the 2022 Form 10-K.
LIQUIDITY AND CAPITAL RESOURCES OF COREBRIDGE PARENT AND INTERMEDIATE HOLDING COMPANIES
As of December 31, 2022 and December 31, 2021, Corebridge Parent and its non-regulated intermediate holding companies (“Corebridge Hold Cos.”) had $4.0 billion and $2.0 billion, respectively, in liquidity sources. These liquidity sources were primarily held in the form of cash and short-term investments and included a $2.5 billion committed revolving credit facility as of December 31, 2022. Corebridge Hold Cos.’ primary sources of liquidity are dividends, distributions, loans and other payments from subsidiaries and credit facilities. Corebridge Hold Cos.’ primary uses of liquidity are for debt service, capital and liability management, and operating expenses.
Corebridge Parent expects to maintain liquidity that is sufficient to cover one year of its expenses. We expect the Corebridge Hold Cos. may access the debt and preferred equity markets from time to time to meet funding requirements as needed.
We utilize our capital resources to support our businesses, with the majority of capital held by our insurance businesses. Corebridge Hold Cos. intend to manage capital between Corebridge Hold Cos. and our insurance companies through internal, Board-approved policies as well as management standards. In addition, AIG has an unconditional capital maintenance agreement in place with AGC. Nevertheless, regulatory and other legal restrictions could limit our ability to transfer capital freely, either to or from our subsidiaries.
As of December 31, 2022, Corebridge Parent and certain of our subsidiaries were parties to several letter of credit agreements with various financial institutions which issue letters of credit from time to time in support of our insurance companies. Letters of credit issued in support of our subsidiaries (primarily, insurance companies) totaled $272 million and $361 million at December 31, 2022 and 2021, respectively.
The following table presents Corebridge Hold Cos.’ liquidity sources:
| | | | | | | | | | | | | | | | | | | | |
| | Years Ended December 31, |
| (in millions) | | 2022 | | 2021 | | 2020 |
| Cash and short-term investments | | $ | 1,495 | | | $ | 1,016 | | | $ | 1,699 | |
| Total Corebridge Hold Cos. liquidity | | 1,495 | | | 1,016 | | | 1,699 | |
Available capacity under uncommitted borrowing facilities with AIG* | | — | | | 1,025 | | | 1,075 | |
| Available capacity under committed, revolving credit facility | | 2,500 | | | — | | | — | |
| Total Corebridge Hold Cos. liquidity sources | | $ | 3,995 | | | $ | 2,041 | | | $ | 2,774 | |
* The uncommitted borrowing facilities with AIG were terminated on September 19, 2022, for further information, see Note 15.
HOLD COS. LIQUIDITY AND CAPITAL RESOURCES HIGHLIGHTS
SOURCES
During the year ended December 31, 2022, Corebridge Hold Cos. received $1.8 billion in dividends from subsidiaries. During 2021, Corebridge Parent received $1.6 billion in dividends from subsidiaries of which $295 million were non-cash transactions. During 2020, Corebridge Parent received $540 million in dividends from subsidiaries.
On April 5, 2022, Corebridge Parent issued $6.5 billion aggregate principal amount of senior unsecured notes.
On August 23, 2022, Corebridge Parent issued $1.0 billion aggregate principal amount of fixed-to-fixed reset rate junior subordinated notes.
ITEM 7 | Liquidity and Capital Resources
On September 15, 2022, Corebridge Parent borrowed an aggregate principal amount of $1.5 billion under the Three-Year DDTL Facility.
For further information, see “Short-term and Long-term debt” below.
USES
Debt Reduction
In 2022, we repaid the $8.3 billion promissory note issued in November 2021 to AIG. During the year 2021, $216 million aggregate principal amount of AIGLH notes and junior subordinated debentures categorized as general borrowings and guaranteed by AIG were repurchased through cash tender offers for an aggregate purchase price of $312 million. AIG Global Real Estate repaid a $253 million affiliated note and AIGLH repaid $249 million under the unsecured borrowing facilities from AIG during the year ended December 31, 2021. In 2021, AIG Property Company Limited repaid the loan and interest of $9 million to AIG Europe S.A. In 2020, AIGLH repaid $108 million under the unsecured borrowing facilities.
We made interest payments on our debt instruments totaling $264 million, $55 million and $50 million during the years ended December 31, 2022, 2021 and 2020, respectively.
Dividends
Year Ended December 31, 2022
During the year ended December 31, 2022, Corebridge paid cash dividends of $876 million, including two quarterly cash dividends payments of $0.23 per share on Corebridge Common Stock totaling $296 million since the IPO.
Year Ended December 31, 2021
During 2021, Corebridge paid cash dividends of $1.0 billion to AIG.
During 2021, Corebridge made non-cash distributions of $12.2 billion to AIG consisting of:
•$8.3 billion for which Corebridge issued a promissory note to AIG in the amount of $8.3 billion in November 2021. In 2022 we repaid the principal balance of this promissory note to AIG. For additional information on the $8.3 billion note repayment, see “Short-term and Long-term debt” below;
•$3.8 billion in connection with the sale of Corebridge’s affordable housing assets; and
•$38 million in AIG common stock.
During 2021, Corebridge paid dividends of $34 million in cash to its Class B shareholder.
During 2021, Cap Corp made a return of capital payment of $536 million to AIG from excess funds and sale of four subsidiaries.
Year Ended December 31, 2020
During 2020, Corebridge paid dividends of $472 million in cash to AIG.
Tax Sharing Payments
We paid a net amount of $10 million, $31 million and $34 million during the years ended December 31, 2022, 2021 and 2020, respectively, in tax sharing payments in cash to AIG. In addition, in December 2021, Corebridge Hold Cos. made tax sharing payments of $373 million to AIG in connection with the sale of Corebridge’s affordable housing assets. The tax sharing payments relating to tax years where we were part of the AIG Consolidated Tax Group may be subject to further adjustment in future periods. In anticipation of future tax sharing payments from AIG, Corebridge Parent made net tax sharing payments to our U.S. insurance companies of $120 million during the year ended December 31, 2022.
LIQUIDITY AND CAPITAL RESOURCES OF COREBRIDGE INSURANCE SUBSIDIARIES
Insurance Companies
We believe that our insurance companies have sufficient liquidity and capital resources to satisfy reasonably foreseeable future liquidity requirements and meet their obligations, including those arising from reasonably foreseeable contingencies or events; through cash from operations; and, to the extent necessary, monetization of invested assets. Our insurance companies’ liquidity resources are primarily held in the form of cash; short-term investments; and publicly traded, investment grade-rated fixed maturity securities.
The liquidity of each of our material insurance companies is monitored through various internal liquidity risk measures. The primary sources of liquidity are premiums, deposits, fees, reinsurance recoverables, investment income and maturities. The primary uses of
ITEM 7 | Liquidity and Capital Resources
liquidity are paid losses, reinsurance payments, benefit claims, surrenders, withdrawals, interest payments, dividends, expenses, investment purchases and collateral requirements.
Certain of our U.S. insurance companies are members of the FHLBs in their respective districts. Our borrowings from FHLBs are non-puttable and are used to supplement liquidity or for other uses deemed appropriate by management. Our U.S. insurance companies had $4.6 billion, $3.6 billion and $3.6 billion which were due to FHLBs in their respective districts at December 31, 2022, 2021 and 2020, respectively, under funding agreements which were reported in policyholder contract deposits. These investment contracts do not have mortality or morbidity risk. Proceeds from funding agreements are generally invested in investments intended to generate spread income. In addition, our U.S. insurance companies had no outstanding borrowings in the form of cash advances from FHLBs at December 31, 2022.
Certain of our U.S. insurance companies have securities lending programs that lend securities from their investment portfolios to supplement liquidity or for other uses deemed appropriate by management. Under these programs, these U.S. insurance companies lend securities to financial institutions and receive cash as collateral equal to 102% of the fair value of the loaned securities. Cash collateral received is kept in cash or invested in short-term investments or used for short-term liquidity purposes.
The aggregate amount of securities that a U.S. insurance company can lend under its program at any time is limited to 5% of its general account statutory-basis admitted assets. Our U.S. insurance companies had $3.3 billion of securities subject to these agreements at December 31, 2021 and $3.4 billion of liabilities to borrowers for collateral received at December 31, 2021. As of December 31, 2022 we had no loans outstanding under these programs.
In December 2021, our U.S. insurance companies distributed dividends of $295 million to Corebridge in connection with the sale of Corebridge’s affordable housing assets.
Our U.S. insurance companies distributed tax sharing payments of $1.0 billion, $1.5 billion and $1.7 billion to AIG, Inc. in the years ended December 31, 2022, 2021 and 2020, respectively. In addition, in December 2021, subsidiaries of our U.S. insurance companies distributed tax sharing payments of $130 million, in connection with the sale of Corebridge’s affordable housing assets. In anticipation of future tax sharing payments from AIG, Corebridge Parent made net tax sharing payments to our U.S. insurance companies of $120 million during the year ended December 31, 2022. After the tax deconsolidation, which occurred at the IPO, we made additional tax sharing payments to AIG and the IRS for approximately $151 million primarily due to the realization of previously deferred gains from intercompany transactions as well as an acceleration of payments due under the Tax Cut and Jobs Act, which would have been paid over an eight year period. These tax sharing payments do not impact total tax or our equity, as deferred tax liabilities have been established for these items.
We manage our combined insurance subsidiary capital to a minimum target Life Fleet RBC ratio of 400%. AGC serves as an affiliate reinsurance company for the Life Fleet covering (i) AGL’s life insurance policies issued between January 1, 2017 and December 31, 2019 subject to Regulation XXX and AXXX and (ii) life insurance policies issued between January 1, 2020 and December 31, 2021 subject to Principle Based Reserving requirements. AGC’s RBC ratio includes the full statutory reserves associated with the above regulations which are in excess of economic reserves. The surplus of AGC is composed predominantly of holding company stock. Given that AGC has no primary operations outside of this internal reinsurance, we believe that excluding AGC from the Life Fleet RBC ratio calculation presents a more accurate view of the overall capital position of our U.S. operating entities. We manage the capital for our Life Fleet RBC ratio targeting above 400%. Although not yet filed, our Life Fleet RBC ratio is expected to be above our minimum target Life Fleet RBC ratio of 400% as of December 31, 2022.
The following table presents normalized distributions: | | | | | | | | | | | | | | | | | | | | | | | | |
| | | | Years Ended December 31, |
| (in millions) | | | | | | 2022 | | 2021 | | 2020 |
| Subsidiary dividends paid | | | | | | $ | 1,821 | | | $ | 1,564 | | | $ | 540 | |
| Less: Non-recurring dividends | | | | | | — | | | (295) | | | 600 | |
| Tax sharing payments related to utilization of tax attributes | | | | | | 401 | | | 902 | | | 1,026 | |
| Normalized distributions | | | | | | $ | 2,222 | | | $ | 2,171 | | | $ | 2,166 | |
Corebridge Parent used $876 million from these dividends to pay shareholder dividends. The remaining dividend proceeds were kept at Corebridge Parent.
In 2020, dividends paid were reduced by $615 million, which together with a contribution of $135 million from AIG in June 2020, were used to fund a special investment account that is used to mitigate the adverse impact to surplus in the event of a recapture of the reinsurance treaties with Fortitude Re. Excluding the requirement to fund the special investment account, in 2020 dividends paid to Corebridge would have been $1.2 billion.
ITEM 7 | Liquidity and Capital Resources
Dividend Restrictions
Payments of dividends to us by our U.S. insurance subsidiaries are subject to certain restrictions imposed by laws and regulations of their respective states. With respect to our domestic insurance subsidiaries, the payment of a dividend may require formal notice to the insurance department of the state in which the particular insurance subsidiary is domiciled, and prior approval of such insurance regulator is required when the amount of the dividend is above certain regulatory thresholds. See “Business — U.S. Regulation — State Insurance Regulation.” Other foreign jurisdictions may restrict the ability of our foreign insurance subsidiaries to pay dividends.
To our knowledge, no Corebridge insurance company is currently on any regulatory or similar “watch list” with regard to solvency.
Analysis of Sources and Uses of Cash
Our primary sources and uses of liquidity are summarized as follows:
| | | | | | | | | | | | | | | | | | | | |
| | Years Ended December 31, |
| (in millions) | | 2022 | | 2021 | | 2020 |
| Sources: | | | | | | |
| Operating activities, net | | $ | 2,621 | | $ | 2,405 | | $ | 3,327 |
| | | | | | |
| Net changes in policyholder account balances | | 5,860 | | 2,962 | | 4,593 |
| Issuance of long-term debt | | 7,451 | | — | | — |
| Issuance of debt of consolidated investment entities | | 946 | | 4,683 | | 2,314 |
| Contributions from noncontrolling interests | | 146 | | 296 | | 317 |
| Financing other, net | | 299 | | 81 | | 184 |
| Issuance of short-term debt | | 1,512 | | 345 | | — |
| Net change in securities lending and repurchase agreements | | — | | 9 | | 646 |
| Effect of exchange rate changes on cash and restricted cash | | — | | — | | 7 |
| Total Sources | | 18,835 | | 10,781 | | 11,388 |
| | | | | | |
| Uses: | | | | | | |
| Investing activities, net | | (7,253) | | (1,967) | | (7,909) |
| Repayments of debt of consolidated investment entities | | (1,228) | | (5,125) | | (2,451) |
| Repayments of long-term debt | | — | | (568) | | (11) |
| Repayments of short-term debt | | (8,312) | | (248) | | — |
| Distributions to AIG | | — | | (1,543) | | (472) |
| Distributions to noncontrolling interests | | (477) | | (1,611) | | (454) |
| Dividends paid on common stock | | (876) | | — | | — |
| Net change in securities lending and repurchase agreements | | (647) | | — | | — |
| | | | | | |
| Distributions to Class B shareholder | | — | | (34) | | — |
| Effect of exchange rate changes on cash and restricted cash | | (10) | | (2) | | — |
| Total Uses | | (18,803) | | (11,098) | | (11,297) |
| Net increase (decrease) in cash and cash equivalents | | $ | 32 | | $ | (317) | | $ | 91 |
Operating Activities
Cash inflows from operating activities primarily include insurance premiums, fees and investment income. Cash outflows from operating activities primarily include benefit payments and general operating expenses. Operating cash flow will fluctuate based on the timing of premiums received and benefit payments to policyholders, as well as other core business activities.
Investing Activities
Cash inflows from investing activities primarily include sales and maturities of underlying assets, mainly fixed maturities available for sale and principal payments on mortgage and other loans. The primary cash outflows for investing activities relate to the purchases of new securities, mainly fixed maturities available for sale.
Financing Activities
Cash inflows from financing activities primarily include policyholder deposits on investment-type contracts, issuances of debt and inflows from the settlement of securities lending and repurchase agreements. Cash outflows primarily relate to policyholder withdrawal activity on investment-type contracts, repayments of debt of consolidated investment entities, repayments of short and long-term debt cash distributions to AIG, Inc. and noncontrolling interests and outflows for the settlement of securities lending and repurchase agreements.
ITEM 7 | Liquidity and Capital Resources
CONTRACTUAL OBLIGATIONS
The following tables summarize contractual obligations in total, and by remaining maturity:
| | | | | | | | | | | | | | | | | | | | | | | | | | |
| December 31, 2022 | | | | Payments due by Period |
| (in millions) | | Total Payments | | 2023 | | 2024 - 2025 | | Thereafter |
Hybrid junior subordinated notes | | $ | 1,000 | | | $ | — | | | $ | — | | | $ | 1,000 | |
| Three-Year DDTL Facility* | | 1,500 | | | 1,500 | | | — | | | — | |
| Interest payments on short-term debt | | 45 | | | 45 | | | — | | | — | |
| Insurance and investment contract liabilities | | 294,416 | | | 25,101 | | | 44,953 | | | 224,362 | |
Senior unsecured notes | | 6,500 | | | — | | | 1,000 | | | 5,500 | |
| Long-term debt issued by Corebridge subsidiaries | | 427 | | | — | | | 101 | | | 326 | |
| Interest payments on long-term debt | | 5,646 | | | 356 | | | 694 | | | 4,596 | |
| Total | | $ | 309,534 | | | $ | 27,002 | | | $ | 46,748 | | | $ | 235,784 | |
* On September 15, 2022, Corebridge Parent borrowed an aggregate principal amount of $1.5 billion under the Three-Year DDTL Facility through October 20, 2022. We continued this borrowing through June 21, 2023. We have the ability to further continue this borrowing through February 25, 2025.
Insurance and Investment Contract Liabilities
We expect liquidity needs related to insurance and investment contract liabilities to be funded through cash flows generated from maturities and sales of invested assets, including various investment-type products with contractually scheduled maturities, including periodic payments. These liabilities also include benefit and claim liabilities, of which a significant portion represents policies and contracts that do not have stated contractual maturity dates and may not result in any future payment obligations. For these policies and contracts (i) we are not currently making payments until the occurrence of an insurable event, such as death or disability, (ii) payments are conditional on survivorship or (iii) payment may occur due to a surrender or other non-scheduled event beyond our control.
We have made significant assumptions to determine the estimated undiscounted cash flows of these contractual policy benefits. These assumptions include mortality, morbidity, future lapse rates, expenses, investment returns and interest crediting rates, offset by expected future deposits and premiums on in-force policies. Due to the significance of the assumptions, the periodic amounts presented could be materially different from actual required payments. The amounts presented in the table above are undiscounted and exceed the future policy benefits and policyholder contract deposits included in the audited annual Consolidated Balance Sheets.
We believe that our insurance companies have adequate financial resources to meet the payments required under these obligations. These subsidiaries have substantial liquidity in the form of cash and short-term investments. In addition, our insurance companies maintain significant levels of investment grade-rated fixed maturity securities, including substantial holdings in government and corporate bonds, and could seek to monetize those holdings in the event operating cash flows are insufficient.
Indemnification Arrangements
We are subject to indemnity arrangements which may be triggered by declines in asset values; specified business contingencies; the realization of contingent liabilities; litigation developments; or breaches of representations, warranties or covenants provided by us. These arrangements are typically subject to time limitations, defined by contract or by operation of law, such as by prevailing statutes of limitations. Depending on the specific terms of the arrangements, the maximum potential obligation may or may not be subject to contractual limitations. We have recorded liabilities for certain of these arrangements where it is possible to estimate them. These liabilities are not material in the aggregate. We are unable to develop a reasonable estimate of the maximum potential payout under some of these arrangements. Overall, we believe the likelihood that we will have to make any material payments under these arrangements is remote.
ITEM 7 | Liquidity and Capital Resources
SHORT-TERM AND LONG-TERM DEBT
We expect to repay the short-term and long-term debt maturities and interest accrued on these borrowings through cash flows generated from invested assets, future cash flows from operations, and future debt and other financing arrangements.
The following tables provide the rollforward of our total debt outstanding:
| | | | | | | | | | | | | | | | | | | | | | | | | | | | | | | | | | | | | | |
| (in millions) | | Maturity
Date(s) | | Balance at December 31, 2021 | | Issuances | | Maturities
and Repayments | | Other Changes | | Balance at December 31, 2022 |
Short-term debt issued by Corebridge: | | | | | | | | | | | | |
Affiliated senior promissory note with AIG | | 2022 | | $ | 8,317 | | | $ | — | | | $ | (8,300) | | | $ | (17) | | * | $ | — | |
| Affiliated note with AIG Life (United Kingdom) | | 2022 | | — | | | 12 | | | (12) | | | — | | | — | |
Three-Year DDTL Facility | | 2023 | | — | | | 1,500 | | | — | | | — | | | 1,500 | |
| Total short-term debt | | | | 8,317 | | | 1,512 | | | (8,312) | | | (17) | | | 1,500 | |
| Long-term debt issued by Corebridge: | | | | | | | | | | | | |
| Senior unsecured notes | | 2025-2052 | | — | | | 6,500 | | | — | | | — | | | 6,500 | |
Hybrid junior subordinated notes | | 2052 | | — | | | 1,000 | | | — | | | — | | | 1,000 | |
| Long-term debt issued by Corebridge subsidiaries: | | | | | | | | | | | | |
| AIGLH notes | | 2025-2029 | | 200 | | | — | | | — | | | — | | | 200 | |
| AIGLH junior subordinated debentures | | 2030-2046 | | 227 | | | — | | | — | | | — | | | 227 | |
| Total long-term debt | | | | 427 | | | 7,500 | | | — | | | — | | | 7,927 | |
| Debt issuance costs | | | | — | | | (59) | | | — | | | — | | | (59) | |
| Total long-term debt, net of debt issuance costs | | | | 427 | | | 7,441 | | | — | | | — | | | 7,868 | |
Total debt, net of issuance costs | | | | $ | 8,744 | | | $ | 8,953 | | | $ | (8,312) | | | $ | (17) | | | $ | 9,368 | |
* Represents accrued interest which has been paid-in-kind and thus added to the total outstanding balance.
SENIOR UNSECURED NOTES AND DELAYED DRAW TERM LOAN
On February 25, 2022, Corebridge Parent entered into an 18-Month Delayed Draw Term Loan Agreement (the “18-Month DDTL Facility”) among Corebridge Parent, as borrower, the lenders party thereto and the administrative agent thereto, and a Three-Year DDTL Facility among Corebridge Parent, as borrower, the lenders party thereto and the administrative agent thereto.
The 18-Month DDTL Facility and Three-Year DDTL Facility provided us with committed delayed draw term loan facilities in the aggregate principal amount of $6.0 billion and $3.0 billion, respectively. On April 5, 2022, Corebridge Parent issued $6.5 billion of senior unsecured notes consisting of: $1.0 billion aggregate principal amount of its 3.50% Senior Notes due 2025, $1.25 billion aggregate principal amount of its 3.65% Senior Notes due 2027, $1.0 billion aggregate principal amount of its 3.85% Senior Notes due 2029, $1.5 billion aggregate principal amount of its 3.90% Senior Notes due 2032, $500 million aggregate principal amount of its 4.35% Senior Notes due 2042 and $1.25 billion aggregate principal amount of its 4.40% Senior Notes due 2052.
On April 6, 2022, in connection with the issuance of the senior unsecured notes of Corebridge Parent, (i) the commitments under the 18-Month DDTL Facility were terminated in full and (ii) the commitments under the Three-Year DDTL Facility were reduced from $3.0 billion to $2.5 billion. On August 25, 2022, in connection with the issuance of the hybrid junior subordinated notes, the commitments under the Three-Year DDTL Facility were further reduced from $2.5 billion to $1.5 billion
On September 15, 2022, Corebridge Parent borrowed an aggregate principal amount of $1.5 billion under the Three-Year DDTL Facility. For the current interest period, the Three-Year DDTL Facility will end on June 21, 2023, unless prior to that date Corebridge Parent elects to continue the loan, or a portion of it, for an additional interest period. For the current interest period, the Three-Year DDTL Facility bears interest at a rate per annum equal to the Adjusted Term SOFR Rate (as defined in the Three-Year DDTL Agreement) plus the Applicable Rate (as defined in the Three-Year DDTL Agreement) of 1.000%, which is based on the then-applicable credit ratings of our senior unsecured long-term indebtedness. The Three-Year DDTL Facility matures on February 25, 2025.
HYBRID JUNIOR SUBORDINATED NOTES
On August 23, 2022, Corebridge Parent issued $1.0 billion aggregate principal amount of 6.875% fixed-to-fixed reset rate hybrid junior subordinated notes due 2052. Subject to certain redemption provisions and other terms of the hybrid junior subordinated notes, the interest rate and interest payment date reset every five years based on the average of the yields on five-year U.S. Treasury securities, as of the most recent interest rate determination on a reset plus a spread, payable semi-annually.
ITEM 7 | Liquidity and Capital Resources
AFFILIATED NOTE
In November 2021, Corebridge issued an $8.3 billion senior promissory note to AIG. We used the net proceeds from the senior unsecured notes, the net proceeds from the hybrid junior subordinated notes and a portion of the borrowing of the Three-Year DDTL Facility, discussed above, to repay the principal balance and accrued interest of this note to AIG. The interest rate per annum was equal to LIBOR plus 100 basis points and accrued semi-annually in arrears on March 1 and September 1 of each year, beginning on March 1, 2022.
REVOLVING CREDIT AGREEMENT
On May 12, 2022, Corebridge Parent entered into the Revolving Credit Agreement (the “Credit Agreement”).
The Credit Agreement provides for a five-year total commitment of $2.5 billion, consisting of standby letters of credit and/or revolving credit borrowings without any limits on the type of borrowings. Under circumstances described in the Credit Agreement, the aggregate commitments may be increased by up to $500 million, for a total commitment under the Credit Agreement of $3.0 billion. Loans under the Credit Agreement will mature on May 12, 2027. Under the Credit Agreement, the applicable rate, commitment fee and letter of credit fee are determined by reference to the credit ratings of Corebridge Parent’s senior, unsecured, long-term indebtedness. Borrowings bear interest at a rate per annum equal to (i) in the case of U.S. dollar borrowings, Term SOFR plus an applicable credit spread adjustment plus an applicable rate or an alternative base rate plus an applicable rate; (ii) in the case of Sterling borrowings, SONIA plus an applicable credit spread adjustment plus an applicable rate; (iii) in the case of Euro borrowings, European Union interbank Offer Rate plus an applicable rate; and (iv) in the case of Japanese Yen, Tokyo Interbank Offered Rate plus an applicable rate. The alternative base rate is equal to the highest of (a) the New York Federal Reserve Bank Rate plus 0.50%, (b) the rate of interest in effect as quoted by The Wall Street Journal as the “Prime Rate” in the United States and (c) Term SOFR plus a credit spread adjustment of 0.100% plus an additional 1.00%.
The Credit Agreement requires Corebridge Parent to maintain a specified minimum consolidated net worth and subjects Corebridge to a specified limit on consolidated total debt to consolidated total capitalization, subject to certain limitations and exceptions. In addition, the Credit Agreement contains certain customary affirmative and negative covenants, including limitations with respect to the incurrence of certain types of liens and certain fundamental changes. Amounts due under the Credit Agreement may be accelerated upon an “event of default,” as defined in the Credit Agreement, such as failure to pay amounts owed thereunder when due, breach of a covenant, material inaccuracy of a representation, or occurrence of bankruptcy or insolvency, subject in some cases to cure periods.
For additional information on debt outstanding and revolving credit facilities, see Note 15 to the audited annual Consolidated Financial Statements.
DEBT OF CONSOLIDATED INVESTMENT ENTITIES
Our non-financial debt includes debt of consolidated investment entities and such debt does not represent our contractual obligation and is non-recourse to Corebridge. This non-financial debt includes notes and bonds payables supported by cash and investments held by us and certain of our non-insurance subsidiaries for the repayment of those obligations.
| | | | | | | | | | | | | | | | | | | | |
| (in millions) | Balance at December 31, 2021 | Issuances | Maturities
and Repayments | Effect of Foreign Exchange | Other Changes(c) | Balance at December 31, 2022 |
Debt of consolidated investment entities – not guaranteed by Corebridge(a)(b) | $ | 6,936 | | $ | 946 | | $ | (1,228) | | $ | (66) | | $ | (630) | | $ | 5,958 | |
(a)At December 31, 2022, includes debt of consolidated investment entities related to real estate investments of $1.4 billion and other securitization vehicles of $4.6 billion.
(b)In relation to the debt of consolidated investment entities (“VIEs”) not guaranteed by Corebridge, creditors or beneficial interest holders of VIEs generally only have recourse to the assets and cash flows of the VIEs and do not have recourse to us.
(c)Other changes reflects the deconsolidation of two consolidated investment entities.
ITEM 7 | Liquidity and Capital Resources
CREDIT RATINGS
Credit ratings estimate a company’s ability to meet its obligations and may directly affect the cost and availability of financing to that company.
The following table presents the credit ratings of Corebridge Parent as of the date of this filing:
| | | | | | | | | | | | | | | | | | |
| Hybrid Junior Subordinated Long-Term Debt | Senior Unsecured Long-Term Debt |
| Moody’s(a) | S&P(b) | Fitch(c) | Moody’s(a) | S&P(b) | Fitch(c) |
| Baa3 (Stable) | BBB- (Stable) | BBB- (Stable) | Baa2 (Stable) | BBB+ (Stable) | BBB+ (Stable) |
(a)Moody’s appends numerical modifiers 1, 2 and 3 to the generic rating categories to show relative position within the rating categories.
(b)S&P ratings may be modified by the addition of a plus or minus sign to show relative standing within the major rating categories.
(c)Fitch ratings may be modified by the addition of a plus or minus sign to show relative standing within the major rating categories.
These credit ratings are current opinions of the rating agencies. They may be changed, suspended or withdrawn at any time by the rating agencies because of changes in, or unavailability of, information or based on other circumstances. Ratings may also be withdrawn at our request.
We are party to some agreements that contain “ratings triggers.” Depending on the ratings maintained by one or more rating agencies, these triggers could result in (i) the termination or limitation of credit availability or a requirement for accelerated repayment, (ii) the termination of business contracts or (iii) a requirement to post collateral for the benefit of counterparties.
In the event of a downgrade of our long-term debt ratings or our insurance subsidiaries’ IFS ratings, we or certain of our subsidiaries would be required to post additional collateral under some derivative and other transactions, or certain of the counterparties of such other of our subsidiaries would be permitted to terminate such transactions early.
The actual amount of collateral that we or certain of our subsidiaries would be required to post to counterparties in the event of such downgrades, or the aggregate amount of payments that we could be required to make, depends on market conditions, the fair value of outstanding affected transactions and other factors prevailing at the time of the downgrade.
INSURER FINANCIAL STRENGTH RATINGS
IFS ratings estimate an insurance company’s ability to pay its obligations under an insurance policy.
The following table presents the ratings of our primary insurance subsidiaries as of the date of this filing:
| | | | | | | | | | | | | | |
| A.M. Best | S&P | Fitch | Moody’s |
| American General Life Insurance Company | A | A+ | A+ | A2 |
| The Variable Annuity Life Insurance Company | A | A+ | A+ | A2 |
| The United States Life Insurance Company in the City of New York | A | A+ | A+ | A2 |
These IFS ratings are current opinions of the rating agencies. They may be changed, suspended or withdrawn at any time by the rating agencies as a result of changes in, or unavailability of, information or based on other circumstances.
OFF-BALANCE SHEET ARRANGEMENTS AND COMMERCIAL COMMITMENTS
The following tables summarize Off-Balance Sheet Arrangements and Commercial Commitments in total, and by remaining maturity:
| | | | | | | | | | | | | | | | | | | | | | | | | | |
| December 31, 2022 | | | | Amount of Commitment Expiring |
| (in millions) | | Total Amounts Committed | | 2023 | | 2024 -2025 | | Thereafter |
| Commitments: | | | | | | | | |
Investment commitments(a) | | $ | 4,440 | | | $ | 1,794 | | | $ | 2,042 | | | $ | 604 | |
| Commitments to extend credit | | 6,108 | | | 2,036 | | | 2,986 | | | 1,086 | |
Total(b) | | $ | 10,548 | | | $ | 3,830 | | | $ | 5,028 | | | $ | 1,690 | |
(a)Includes commitments to invest in private equity funds, hedge funds and other funds and commitments to purchase and develop real estate in the United States and abroad. The commitments to invest in private equity funds, hedge funds and other funds are called at the discretion of each fund, as needed for funding new investments or expenses of the fund. The expiration of these commitments is estimated in the table above based on the expected life cycle of the related fund, consistent with past trends of requirements for funding. Investors under these commitments are primarily insurance and real estate subsidiaries.
(b)We have no guarantees related to liquid facilities or indebtedness.
ITEM 7 | Accounting Policies and Pronouncements
Accounting Policies and Pronouncements
CRITICAL ACCOUNTING ESTIMATES
The preparation of financial statements in accordance with GAAP requires the application of accounting policies that often involve a significant degree of judgment. On a regular basis, we review estimates and assumptions used in the preparation of financial statements. Actual results may differ from these estimates under different assumptions or conditions. For a detailed discussion of our significant accounting policies and accounting pronouncements, see Note 2 to our audited annual consolidated financial statements.
| | |
| The accounting policies that we believe are most dependent on the application of estimates and assumptions, which are critical accounting estimates, are related to the determination of: |
•fair value measurements of certain financial assets and liabilities; •valuation of MRBs related to guaranteed benefit features of variable annuity products, fixed annuity products, and fixed index annuity products; •valuation of embedded derivative liabilities for fixed index annuity and index universal life products; •valuation of future policy benefit liabilities and recognition of remeasurement gains and losses; •reinsurance assets, including the allowance for credit losses; •goodwill impairment; •allowance for credit losses primarily on loans and available for sale fixed maturity securities; •income tax assets and liabilities, including recoverability of our net deferred tax asset and the predictability of future tax operating profitability of the character necessary to realize the net deferred tax asset. •prior to the adoption of LDTI, valuation of liabilities for guaranteed benefit features of variable annuity products, fixed annuity and fixed index annuity products, including the valuation of embedded derivatives; •prior to the adoption of LDTI, estimated gross profits to value DAC and URR for investment-oriented products, such as universal life insurance, variable and fixed annuities, and fixed index annuities; and •prior to the adoption of LDTI, valuation of future policy benefit liabilities and timing and extent of loss recognition; |
These accounting estimates require the use of assumptions about matters, some of which are highly uncertain at the time of estimation. To the extent actual experience differs from the assumptions used, our business, results of operations, financial condition and liquidity could be materially affected.FAIR VALUE MEASUREMENTS OF CERTAIN FINANCIAL ASSETS AND FINANCIAL LIABILITIES
We carry certain of our financial instruments at fair value. We define the fair value of a financial instrument as the amount that would be received from the sale of an asset or paid to transfer a liability in an orderly transaction between market participants at the measurement date.
For additional information about the measurement of fair value of financial assets and financial liabilities and our accounting policy regarding the incorporation of credit risk in fair value measurements, see Note 4 to our audited annual consolidated financial statements.
The following table presents the fair value of fixed maturity and equity securities by source of value determination:
| | | | | | | | | | | | | | | | | | | | | | | |
| | December 31, 2022 | | December 31, 2021 | | |
| (in millions) | | Fair Value | Percent of Total | | Fair Value | Percent of Total | | | |
Fair value based on external sources(a) | | $ | 142,853 | 88.9% | | $ | 180,841 | 90.0% | | | |
| Fair value based on internal sources | | 17,848 | 11.1% | | 20,039 | 10.0% | | | |
Total fixed maturity and equity securities(b) | | $ | 160,701 | 100.0% | | $ | 200,880 | 100.0% | | | |
(a)Includes $14.9 billion and $18.8 billion as of December 31, 2022 and December 31, 2021, respectively, for which the primary source is broker quotes.
(b)Includes available for sale and other securities.
Level 3 Assets and Liabilities
Assets and liabilities recorded at fair value in the Consolidated Balance Sheets are measured and classified in a hierarchy for disclosure purposes consisting of three levels based on the observability of inputs available in the marketplace used to measure the fair value.
For additional information, see Note 4 to our audited annual consolidated financial statements.
ITEM 7 | Accounting Policies and Pronouncements
The following table presents the amount of assets and liabilities measured at fair value on a recurring basis and classified as Level 3:
| | | | | | | | | | | | | | | | | | | | |
| | December 31, 2022 | | December 31, 2021 |
| (in millions) | | Amount | Percent of Total | | Amount | Percent of Total |
| Assets* | | $ | 24,983 | 6.9% | | $ | 26,030 | 6.1% |
| Liabilities* | | $ | 11,386 | 3.3% | | $ | 21,072 | 5.3% |
*The results for the years ended December 31, 2022 and 2021 have been updated to reflect the adoption of LDTI.
Level 3 fair value measurements are based on valuation techniques that use at least one significant input that is unobservable. We consider unobservable inputs to be those for which market data is not available and that are developed using the best information available about the assumptions that market participants would use when valuing the asset or liability. Our assessment of the significance of a particular input to the fair value measurement in its entirety requires judgment.
We classify fair value measurements for certain assets and liabilities as Level 3 when they require significant unobservable inputs in their valuation, including contractual terms, prices and rates, yield curves, credit curves, measures of volatility, prepayment rates, default rates, mortality rates, policyholder behavior, and correlations of such inputs.
For a discussion of the valuation methodologies for assets and liabilities measured at fair value, and a discussion of transfers of Level 3 assets and liabilities, see Note 4 to our audited annual consolidated financial statements.
MARKET RISK BENEFITS
Annuity products offered by our Individual Retirement and Group Retirement segments offer guaranteed benefit features (“GMxBs”). These guaranteed features include GMDBs that are payable in the event of death and GMWBs that guarantee lifetime withdrawals regardless of fixed account and separate account value performance.
For additional information on these features, see Note 13 to our audited annual consolidated financial statements.
GMxBs are recognized as MRBs and can be assets or liabilities, and represent the expected value of benefits in excess of the projected account value, with changes in fair value of MRBs recognized in the consolidated Statements of Income (Loss) and the portion of the fair value change attributable to our own credit risk recognized in OCI.
The Company’s exposure to the guaranteed amounts is equal to the amount by which the contract holder’s account balance is below the amount provided by the guaranteed feature. A deferred annuity contract may include more than one type of GMxB; for example, it may have both a GMDB and a GMWB. However, a policyholder can generally only receive payout from one guaranteed feature on a contract containing a death benefit and a living benefit, i.e., the features are generally mutually exclusive (except a surviving spouse who has a rider to potentially collect both a GMDB upon their spouse’s death and a GMWB during his or her lifetime). A policyholder cannot purchase more than one living benefit on one contract. Declines in the equity markets, increased volatility and a low interest rate environment increase the Company’s exposure to potential benefits under the guaranteed features, leading to an increase in the liabilities for those benefits.
For sensitivity analysis which includes the sensitivity of liabilities for guaranteed benefit features to changes in the assumptions for interest rates, equity returns, volatility, and mortality, see —“Valuation of Market Risk Benefits and Embedded Derivatives for Fixed Index Annuity and Index Universal Life Products.”
For additional discussion of market risk management related to these product features, see "Quantitative and Qualitative Disclosures about Market Risk."
ITEM 7 | Accounting Policies and Pronouncements
The valuation methodology and assumptions used to measure our GMxBs is presented in the following table:
| | | | | |
Fair Value Methodology | Guaranteed minimum benefits on annuity products are MRBs that are required to be measured at fair value with changes in the fair value of the liabilities recorded in changes in the fair value of MRBs, except for changes related to the Company’s own credit risk which are recorded in AOCI. The fair value of these benefits is based on assumptions that a market participant would use in valuing these MRBs. The Company applies a non-option-based approach for variable products, and an option-based approach for fixed index and fixed products. Under the non-option-based approach, a portion of actual fees (i.e., attributed fees) is determined such that the present value of expected benefits less attributed fees is zero at issue. This calculated ratio is locked in and utilized in each policy valuation going forward and results in an MRB value of zero at policy issue. Under the option-based approach, the MRB value at issue represents the present value of expected benefits after account value exhaustion. There is no calculated attributed fee ratio under this approach; as such, the calculated MRB liability at inception requires an equal and offsetting adjustment to the underlying host contract. Consistent with the non-option-based approach, this results in no gains or losses recognized upon policy issuance. The fair value of the MRBs, which are Level 3 assets and liabilities, is based on a risk-neutral framework and incorporates actuarial and capital market assumptions related to projected cash flows over the expected lives of the contracts. For additional information on how we value for MRBs, see Note 13 to our audited annual consolidated financial statements and for information on fair value measurement of these MRBs, including how we incorporate our own non-performance risk, see Note 4 to our audited annual consolidated financial statements. |
| Key Assumptions | Key assumptions include: •interest rates; •equity market returns; •market volatility; •credit spreads; •equity / interest rate correlation; •policyholder behavior, including mortality, lapses, withdrawals and benefit utilization estimates of future policyholder behavior are subject to judgment and based primarily on our historical experience; •in applying asset growth assumptions for the valuation of MRBs, we use market-consistent assumptions calibrated to observable interest rate and equity option prices; For the fixed index annuity GMxB liability, policyholder funds are projected assuming growth equal to current option values for the current crediting period followed by option budgets for all subsequent crediting periods. Policyholder fund growth projected assuming credited rates are expected to be maintained at a target pricing spread, subject to guaranteed minimums. |
VALUATION OF EMBEDDED DERIVATIVES FOR FIXED INDEX ANNUITY AND INDEX UNIVERSAL LIFE PRODUCTS
Fixed index annuity and life products provide growth potential based in part on the performance of market indices. Certain fixed index annuity products offer optional guaranteed benefit features similar to those offered on variable annuity products. Policyholders may elect to rebalance among the various accounts within the product at specified renewal dates. At the end of each index term, we generally have the opportunity to re-price the index component by establishing different participation rates or caps on index credited rates. The index crediting feature of these products results in the recognition of an embedded derivative that is required to be bifurcated from the host contract and carried at fair value with changes in the fair value of the liabilities recorded in Net realized gains (losses). Option pricing models are used to estimate fair value, taking into account assumptions for future index growth rates, volatility of the index, future interest rates, and our ability to adjust the participation rate and the cap on index credited rates in light of market conditions and policyholder behavior assumptions.
For additional discussion of market risk management related to these product features, see “Quantitative and Qualitative Disclosures about Market Risk” included herein.
ITEM 7 | Accounting Policies and Pronouncements
The following table summarizes the sensitivity of changes in certain assumptions for MRBs, Liability for future policyholder benefits, net of reinsurance and embedded derivatives related to index-linked interest credited features, measured as the related hypothetical impact for the on December 31, 2022 balances and the resulting hypothetical impact on pre-tax income and OCI, before hedging:
| | | | | | | | | | | | | | | | | | | | | | | | | | | | | | | | | | | |
| December 31, 2022 | | Market Risk Benefits Related to Guaranteed Benefits | | Liability for Future Policyholder Benefits Net of Reinsurance | | Embedded Derivatives Related to Index-Linked Interest Credited Features | | Pre-Tax Income | | OCI | |
| (in millions) | | | | | | | | | | | |
| Assumptions: | | | | | | | | | | | |
Equity Return(a) | | | | | | | | | | | |
| Effect of an increase by 20% | | $ | 1,111 | | | $ | — | | | $ | (506) | | | $ | 675 | | | $ | (70) | | |
| Effect of a decrease by 20% | | $ | (1,296) | | | $ | — | | | $ | 277 | | | $ | (1,087) | | | $ | 68 | | |
Interest Rate(b) | | | | | | | | | | | |
| Effect of an increase by 1% | | $ | 1,573 | | | $ | 1,992 | | | $ | 397 | | | $ | 2,073 | | | $ | 1,889 | | |
| Effect of a decrease by 1% | | $ | (2,084) | | | $ | (2,429) | | | $ | (501) | | | $ | (2,711) | | | $ | (2,303) | | |
(a)Represents the net impact of a 20% increase or decrease in the S&P 500 index.
(b)Represents the net impact of a 1% parallel shift in the yield curve.
The sensitivity ranges of 20% and 1% are included for illustrative purposes only and do not reflect the changes in net investment spreads, equity return, volatility, interest rate, mortality or lapse used by us in our fair value analyses to value other applicable liabilities. Changes different from those illustrated may occur in any period and by different products.
The analysis of MRBs and embedded derivatives is a dynamic process that considers all relevant factors and assumptions described above. We estimate each of the above factors individually, without the effect of any correlation among the key assumptions. An assessment of sensitivity associated with changes in any single assumption would not necessarily be an indicator of future results. The effects on pre-tax income in the sensitivity analysis table above do not reflect the related effects from our economic hedging program, which utilizes derivative and other financial instruments and is designed so that changes in value of those instruments move in the opposite direction of changes in the guaranteed benefit MRBs and embedded derivative liabilities.
For a further discussion on guaranteed benefit product features and the related hedging program, see “—Quantitative and Qualitative Disclosures about Market Risk” included herein and Notes 4, 10 and 13 to our audited annual consolidated financial statements.
FUTURE POLICY BENEFITS FOR LIFE AND ACCIDENT AND HEALTH INSURANCE CONTRACTS
Long-duration traditional products primarily include whole life insurance, term life insurance, and certain payout annuities for which the payment period is life-contingent, which include certain of our single premium immediate annuities, including PRT business and structured settlements. In addition, these products also include accident and health, and LTC insurance. The LTC block is in run-off and has been fully reinsured with Fortitude Re.
Updating Net Premium Ratio (“NPR”) - Remeasurement gains and losses: Generally, future policy benefits are payable over an extended period of time and related liabilities are calculated as the present value of future benefits less the present value of future net premiums (portion of the gross premium required to provide for all benefits and expenses). The assumptions used to calculate the benefit liabilities are initially set when a policy is issued and an NPR is established. Prior to January 1, 2021, assumptions were set when a policy was issued and did not change with changes in actual experience unless a loss recognition event occurred. A loss recognition event occurred when current liabilities together with expected future premiums were not sufficient to provide for all future benefits, expenses and DAC amortization, net of reinsurance. A loss recognition event was driven by observed changes in actual experience or estimates differing significantly from “locked-in” assumptions. Liabilities were accreted using investment return assumptions.
Subsequent to the adoption of the Targeted Improvements to the Accounting for Long-Duration Contracts Standard, benefit liabilities are subsequently remeasured periodically to reflect changes in policy assumptions and actual versus expected experience and are recognized as remeasurement gains and losses, a component of policyholder benefits. The assumptions include mortality, morbidity and persistency. These assumptions are typically consistent with pricing inputs at policy issuance. Liabilities are accreted using an upper-medium grade (low credit risk) fixed income instrument yield that is locked-in at policy issuance. The liabilities are remeasured at the balance sheet date using a current upper-medium grade yield with changes in the liabilities reported in AOCI.
For universal life policies with secondary guarantees: We recognize certain liabilities in addition to policyholder account balances. For universal life policies with secondary guarantees, as well as other universal life policies for which profits followed by losses are expected at contract inception, a liability is recognized based on a benefit ratio of (a) the present value of total expected payments, in
ITEM 7 | Accounting Policies and Pronouncements
excess of the account value, over the life of the contract, divided by (b) the present value of total expected assessments over the life of the contract. Universal life account balances are reported in Policyholder contract deposits, while these additional liabilities related to universal life products are reported within Future policy benefits in the Consolidated Balance Sheets. These additional liabilities are also adjusted to reflect the effect of unrealized gains or losses on fixed maturity securities available for sale on accumulated assessments, with related changes recognized through Other comprehensive income (loss). The policyholder behavior assumptions for these liabilities include mortality, lapses and premium persistency. The capital market assumptions used for the liability for universal life secondary guarantees include discount rates and net earned rates.
REINSURANCE RECOVERABLE
The estimation of reinsurance recoverable involves a significant amount of judgment. Reinsurance assets include reinsurance recoverables on future policy benefits and policyholder contract deposits that are estimated as part of our insurance liability valuation process and, consequently, are subject to significant judgments and uncertainties.
We assess the collectability of reinsurance recoverable balances on a regular basis, through either historical trends of disputes and credit events or financial analysis of the credit quality of the reinsurer. We record adjustments to reflect the results of these assessments through an allowance for credit losses and disputes on uncollectable reinsurance that reduces the carrying amount of reinsurance. This estimate requires significant judgment for which key considerations include:
•paid and unpaid amounts recoverable;
•whether the balance is in dispute or subject to legal collection;
•the relative financial health of the reinsurer as determined by the Obligor Risk Ratings (“ORRs”) we assign to each reinsurer based upon our financial reviews; reinsurers that are financially troubled (i.e., in run-off, have voluntarily or involuntarily been placed in receivership, are insolvent, are in the process of liquidation or otherwise subject to formal or informal regulatory restriction) are assigned ORRs that are expected to generate significant allowance; and
•whether collateral and collateral arrangements exist.
An estimate of the reinsurance recoverables’ lifetime expected credit losses is established utilizing a probability of default and loss given default method, which reflects the reinsurer’s ORR rating. The allowance for credit losses excludes disputed amounts. An allowance for disputes is established for a reinsurance recoverable using the losses incurred model for contingencies.
At December 31, 2022 and December 31, 2021, the allowance for credit losses and disputes on reinsurance recoverable was $84 million and $101 million, respectively or less than 1% of the reinsurance recoverable.
Fortitude Re
In February 2018, AGL, VALIC and USL entered into modco reinsurance agreements with Fortitude Re a registered Class 4 and Class E reinsurer in Bermuda.
These reinsurance transactions between us and Fortitude Re were structured as modco. In modco reinsurance agreements, the investments supporting the reinsurance agreements and which reflect the majority of the consideration that would be paid to the reinsurer for entering into the transaction, are withheld by, and therefore continue to reside on the balance sheet of, the ceding company (i.e., AGL, VALIC, USL) thereby creating an obligation for the ceding company to pay the reinsurer (i.e., Fortitude Re) at a later date. Additionally, as we maintain ownership of these investments, we intend to maintain our existing accounting for these assets (e.g., the changes in fair value of available for sale securities will be recognized within OCI). We have established a funds withheld payable to Fortitude Re while simultaneously establishing a reinsurance asset representing liabilities for the insurance coverage that Fortitude Re has assumed. The funds withheld payable contains an embedded derivative and changes in fair value of the embedded derivative related to the funds withheld payable are recognized in earnings through Net realized gains (losses). This embedded derivative is considered a total return swap with contractual returns that are attributable to various assets and liabilities associated with these reinsurance agreements.
For additional information on reinsurance, see Notes 2 and 7 to our audited annual consolidated financial statements.
ITEM 7 | Accounting Policies and Pronouncements
ALLOWANCE FOR CREDIT LOSSES AND GOODWILL IMPAIRMENT
Allowance for Credit Losses
Available for sale securities
If we intend to sell a fixed maturity security, or it is more likely than not that we will be required to sell a fixed maturity security, before recovery of its amortized cost basis and the fair value of the security is below amortized cost, an impairment has occurred and the amortized cost is written down to current fair value, with a corresponding charge to realized losses. No allowance is established in these situations and any previously recorded allowance is reversed. When assessing our intent to sell a fixed maturity security, or whether it is more likely than not that we will be required to sell a fixed maturity security before recovery of its amortized cost basis, management evaluates relevant facts and circumstances including, but not limited to, decisions to reposition our investment portfolio, sales of securities to meet cash flow needs and sales of securities to take advantage of favorable pricing.
For fixed maturity securities for which a decline in the fair value below the amortized cost is due to credit related factors, an allowance is established for the difference between the estimated recoverable value and amortized cost with a corresponding charge to realized losses. The allowance for credit losses is limited to the difference between amortized cost and fair value. The estimated recoverable value is the present value of cash flows expected to be collected, as determined by management. The difference between fair value and amortized cost that is not associated with credit related factors is presented in unrealized appreciation (depreciation) of fixed maturity securities on which an allowance for credit losses was previously recognized (a separate component of AOCI). Accrued interest is excluded from the measurement of the allowance for credit losses.
Commercial and residential mortgage loans
At the time of origination or purchase, an allowance for credit losses is established for mortgage and other loan receivables and is updated each reporting period. Changes in the allowance for credit losses are recorded in realized gains (losses).
This allowance reflects the risk of loss, even when that risk is remote, and reflects losses expected over the remaining contractual life of the loan. The allowance for credit losses considers available relevant information about the collectability of cash flows, including information about past events, current conditions, and reasonable and supportable forecasts of future economic conditions. We revert to historical information when we determine that we can no longer reliably forecast future economic assumptions.
The allowances for the commercial mortgage loans and residential mortgage loans in our portfolio are estimated utilizing a probability of default and loss given default model. Loss rate factors are determined based on historical data and adjusted for current and forecasted information. The loss rates are applied based on individual loan attributes and considering such data points as loan-to-value ratios, FICO scores, and debt service coverage.
The estimate of credit losses also reflects management’s assumptions on certain macroeconomic factors that include, but are not limited to, gross domestic product growth, employment, inflation, housing price index, interest rates and credit spreads.
For additional information on the methodology and significant inputs, by investment type, that we use to determine the amount of impairment and allowances for loan losses, see Notes 5 and 6 to our audited annual consolidated financial statements.
GOODWILL IMPAIRMENT
In 2022, 2021 and 2020 we elected to bypass the qualitative assessment of whether goodwill impairment may exist in our reporting units with the largest goodwill balances and, instead performed quantitative assessments that supported a conclusion that the fair value of the reporting units tested exceeded their book value. To determine fair value, we primarily use a discounted expected future cash flow analysis that estimates and discounts projected future distributable earnings. Such analysis is principally based on our business projections that inherently include judgments regarding business trends.
For a discussion of goodwill impairment, see “Risk Factors—Risks Relating to Estimates and Assumptions” in the 2022 Form 10-K and Note 11 to our audited annual consolidated financial statements.
INCOME TAXES
Deferred income taxes represent the tax effect of differences between the amounts recorded in our Consolidated Financial Statements and the tax basis of assets and liabilities. Our assessment of net deferred income taxes represents management’s best estimate of the tax consequences of various events and transactions, which can themselves be based on other accounting estimates, resulting in incremental uncertainty in the estimation process.
Recoverability of Net Deferred Tax Asset
The evaluation of the recoverability of our deferred tax asset and the need for a valuation allowance requires us to weigh all positive and negative evidence to reach a conclusion that it is more likely than not that all or some portion of the deferred tax asset will not be realized. The weight given to the evidence is commensurate with the extent to which it can be objectively verified. The more negative
ITEM 7 | Accounting Policies and Pronouncements
evidence that exists, the more positive evidence is necessary and the more difficult it is to support a conclusion that a valuation allowance is not needed.
We consider a number of factors to reliably estimate future taxable income so we can determine the extent of our ability to realize net operating losses, foreign tax credits, realized capital loss and other carryforwards. These factors include forecasts of future income for each of our businesses, which incorporate forecasts of future statutory income for our insurance companies, and actual and planned business and operational changes, both of which include assumptions about future macroeconomic and our specific conditions and events.
Recent events, including the IPO, multiple changes in target interest rates by the Board of Governors of the Federal Reserve System and significant market volatility, continued to impact actual and projected results of our business operations as well as our views on potential effectiveness of certain prudent and feasible tax planning strategies. In order to demonstrate the predictability and sufficiency of future taxable income necessary to support the realizability of the net operating losses and foreign tax credit carryforwards, we have considered forecasts of future income for each of our businesses, including assumptions about future macro-economic and our specific conditions and events, and any impact these conditions and events may have on our prudent and feasible tax planning strategies.
For a discussion of our framework for assessing the recoverability of our deferred tax asset, see Note 22 to our audited annual consolidated financial statements.
Uncertain Tax Positions
Our accounting for income taxes, including uncertain tax positions, represents management’s best estimate of various events and transactions, and requires judgment. FASB Interpretation No. 48, “Accounting for Uncertainty in Income Taxes” now incorporated into Accounting Standards Codification, 740, “Income Taxes” prescribes a recognition threshold and measurement attribute for the financial statement recognition and measurement of an income tax position taken or expected to be taken in a tax return. The standard also provides guidance on derecognition, classification, interest and penalties and additional disclosures. We determine whether it is more likely than not that a tax position will be sustained, based on technical merits, upon examination by the relevant taxing authorities before any part of the benefit can be recognized in the financial statements. A tax position is measured at the largest amount of benefit that is greater than 50% likely to be realized upon settlement.
We classify interest expense and penalties recognized on income taxes as a component of income taxes.
For an additional discussion, see Note 22 to our audited annual consolidated financial statements.
PRIOR TO ADOPTION OF LDTI, VALUATION OF LIABILITIES FOR GUARANTEED BENEFIT FEATURES OF VARIABLE ANNUITY, FIXED ANNUITY AND FIXED INDEX ANNUITY PRODUCTS, INCLUDING EMBEDDED DERIVATIVES
Variable annuity products offered by our Individual Retirement and Group Retirement segments offer guaranteed benefit features. These guaranteed features include GMDB that are payable in the event of death and living benefits that guarantee lifetime withdrawals regardless of fixed account and separate account value performance. Living benefit features primarily include GMWB.
For additional information on these features, see Note 13 to our audited annual consolidated financial statements.
The liability for GMDB, which was recorded in future policy benefits, represented the expected value of benefits in excess of the projected account value, with the excess recognized ratably through Policyholder benefits over the accumulation period based on total expected assessments. The liabilities for variable annuity GMWB, which were recorded in Policyholder contract deposits, were accounted for as embedded derivatives measured at fair value, with changes in the fair value of the liabilities recorded in net realized gains (losses).
Certain of our fixed annuity and fixed index annuity contracts, which are not offered through separate accounts, contain optional GMWB benefits. Different versions of these GMWB riders contain different guarantee provisions. The liability for GMWB benefits in fixed annuity and fixed index annuity contracts for which the rider guarantee was considered to be clearly and closely related to the host contract were recorded in future policy benefits. This GMWB liability represented the expected value of benefits in excess of the projected account value, with the excess recognized ratably over the accumulation period based on total expected assessments, through Policyholder benefits. For rider guarantees in certain fixed index annuity contracts that were linked to equity indices that were considered to be embedded derivatives that were not clearly and closely related to the host contract, the GMWB liability was recorded in Policyholder contract deposits and measured at fair value, with changes in the fair value of the liabilities recorded in net realized gains (losses).
Our exposure to the guaranteed amounts is equal to the amount by which the contract holder’s account balance is below the amount provided by the guaranteed feature. A deferred annuity contract may include more than one type of guaranteed benefit feature; for example, it may have both a GMDB and a GMWB. However, a policyholder can generally only receive payout from one guaranteed feature on a contract containing a death benefit and a living benefit, i.e., the features are generally mutually exclusive (except a
ITEM 7 | Accounting Policies and Pronouncements
surviving spouse who has a rider to potentially collect both a GMDB upon their spouse’s death and a GMWB during his or her lifetime). A policyholder cannot purchase more than one living benefit on one contract. Declines in the equity markets, increased volatility and a low interest rate environment increased our exposure to potential benefits under the guaranteed features, leading to an increase in the liabilities for those benefits.
The reserving methodology and assumptions used to measure the liabilities of our two largest guaranteed benefit features are presented in the following table:
| | | | | |
Guaranteed Benefit Feature | Reserving Methodology and Key
Assumptions |
GMDB and Fixed Annuity and Certain Fixed Index Annuity GMWB | We determined the GMDB liability at each balance sheet date by estimating the expected value of death benefits in excess of the projected account balance and recognizing the excess ratably over the accumulation period based on total expected assessments. For certain fixed and fixed index annuity products, we determined the GMWB liability at each balance sheet date by estimating the expected withdrawal benefits once the projected account balance has been exhausted ratably over the accumulation period based on total expected assessments. These GMWB features were deemed to not be embedded derivatives as the GMWB feature was determined to be clearly and closely related to the host contract. The present value of the total expected excess payments (e.g., payments in excess of account value) over the life of contract divided by the present value of total expected assessments was referred to as the benefit ratio. The magnitude and direction of the change in reserves may have varied over time based on the emergence of the benefit ratio and the level of assessments. |
Key assumptions and projections included: •interest credited that varied by year of issuance and products; •actuarial determined assumptions for mortality rates that were based upon industry and our historical experience modified to allow for variations in policy features and experience anomalies; •actuarial determined assumptions for lapse rates that were based upon industry and our historical experience modified to allow for variations in policy features and experience anomalies; •investment returns, based on stochastically generated scenarios; and •asset returns that included a reversion to the mean methodology, similar to that applied for DAC In applying separate account asset growth assumptions for the Variable Annuity GMDB liability, we used a reversion to the mean methodology, the same as that applied to DAC. For the fixed index annuity GMWB liability, policyholder funds were projected assuming growth equal to current Option Values for the current crediting period followed by Option Budgets for all subsequent crediting periods. For the fixed annuity GMWB liability, policyholder fund growth projected assuming credited rates were expected to be maintained at a target pricing spread, subject to guaranteed minimums. For a description of this methodology, see “—Prior to the Adoption of LDTI, Estimated Gross Profits to Value deferred Acquisition Costs and Unearned Revenue For Investment-Oriented Products.” |
| Variable Annuity and Certain Fixed Index Annuity GMWB | GMWB living benefits on variable annuities and GMWB living benefits linked to equity indices on fixed index annuities were embedded derivatives that were required to be bifurcated from the host contract and carried at fair value with changes in the fair value of the liabilities recorded in realized gains (losses). The fair value of these embedded derivatives was based on assumptions that a market participant would use in valuing these embedded derivatives. The fair value of the embedded derivatives, which are Level 3 liabilities, was based on a risk-neutral framework and incorporated actuarial and capital market assumptions related to projected cash flows over the expected lives of the contracts. Key assumptions included: •interest rates; •equity market returns; •market volatility; •credit spreads; •equity / interest rate correlation; •policyholder behavior, including mortality, lapses, withdrawals and benefit utilization. Estimates of future policyholder behavior are subjective and based primarily on our historical experience; •in applying asset growth assumptions for the valuation of GMWBs, we used market-consistent assumptions calibrated to observable interest rate and equity option prices; and •allocation of fees between the embedded derivative and host contract. |
PRIOR TO ADOPTION OF LDTI, ESTIMATED GROSS PROFITS TO VALUE DEFERRED ACQUISITION COSTS AND UNEARNED REVENUE FOR INVESTMENT-ORIENTED PRODUCTS
Policy acquisition costs and policy issuance costs that were incremental and directly related to the successful acquisition of new or renewal of existing insurance contracts related to universal life insurance and investment-type products, for example, variable, fixed, and fixed index annuities (collectively, investment-oriented products) were generally deferred and amortized, with interest, in relation to the incidence of estimated gross profits to be realized over the expected lives of the contracts, except in instances where significant negative gross profits are expected in one or more periods. Investment oriented products have a long duration and a disclosed crediting interest rate. Total gross profits included both actual gross profits and estimates of gross profits for future periods. Estimated gross profits included current and projected interest rates, net investment income and spreads, net realized gains and losses, fees,
ITEM 7 | Accounting Policies and Pronouncements
surrender rates, mortality experience and equity market returns and volatility. In estimating future gross profits, lapse assumptions required judgment and could have a material impact on DAC amortization. For fixed index annuity contracts, the future spread between investment income and interest credited to policyholders was a significant judgment, particularly in a low interest rate environment.
We regularly evaluated our assumptions used for estimated gross profits. If the assumptions used for estimated gross profits changed, DAC and related reserves, including VOBA, DSI, guaranteed benefit reserves and URR, were recalculated using the new assumptions, and any resulting adjustment is included in income. Updating such assumptions may have resulted in acceleration of amortization in some products and deceleration of amortization in other products.
PRIOR TO ADOPTION OF LDTI,FUTURE POLICY BENEFITS FOR LIFE AND ACCIDENT AND HEALTH INSURANCE CONTRACTS
For long-duration traditional business, a “lock-in” principle applies. Generally, future policy benefits were payable over an extended period of time and related liabilities were calculated as the present value of future benefits less the present value of future net premiums (portion of the gross premium required to provide for all benefits and expenses). The assumptions used to calculate the benefit liabilities and DAC were set when a policy was issued and did not change with changes in actual experience unless a loss recognition event occured. The assumptions included mortality, morbidity, persistency, maintenance expenses and investment returns. These assumptions were typically consistent with pricing inputs. The assumptions also included margins for adverse deviation, principally for key assumptions such as mortality and interest rates used to discount cash flows, to reflect uncertainty given that actual experience might deviate from these assumptions. Establishing margins at contract inception required management judgment. The extent of the margin for adverse deviation may have varied depending on the uncertainty of the cash flows, which were affected by the volatility of the business and the extent of our experience with the product.
Loss recognition occured if observed changes in actual experience or estimates resulted in projected future losses under loss recognition testing. To determine whether loss recognition existed, we determined whether a future loss was expected based on updated current best estimate assumptions. If loss recognition existed, the assumptions as of the loss recognition test date were locked-in and used in subsequent valuations and the net reserves continued to be subject to loss recognition testing. Because of the long-term nature of many of our liabilities subject to the “lock-in” principle, small changes in certain assumptions may have caused large changes in the degree of reserve balances. In particular, changes in estimates of future invested asset returns had a large effect on the degree of reserve balances.
Groupings for loss recognition testing were consistent with our manner of acquiring, servicing and measuring the profitability of the business and were applied by product groupings that span across issuance years, including traditional life, payout annuities and LTC insurance. Once loss recognition had been recorded for a block of business, the old assumption set was replaced, and the assumption set used for the loss recognition would then be subject to the lock-in principle. Our policy was to perform loss recognition testing net of reinsurance. The business ceded to Fortitude Re was grouped separately. Since 100% of the risk had been ceded, no additional loss recognition events were expected to occur unless this business was recaptured.
Key judgments made in loss recognition testing included the following:
•to determine investment returns used in loss recognition tests, we projected future cash flows on the assets supporting the liabilities. The duration of these assets was generally comparable to the duration of the liabilities and such assets are primarily comprised of a diversified portfolio of high to medium quality fixed maturity securities, and may have also included, to a lesser extent, alternative investments. Our projections included a reasonable allowance for investment expenses and expected credit losses over the projection horizon. A critical assumption in the projection of expected investment income was the assumed net rate of investment return at which excess cash flows were to be reinvested;
•for mortality assumptions, base future assumptions took into account industry and our historical experience, as well as expected mortality changes in the future. The latter judgment was based on a combination of historical mortality trends and industry observations, public health and demography specialists that were consulted by our actuaries and published industry information; and
•for surrender rates, key judgments involved the correlation between expected increases/decreases in interest rates and increases/decreases in surrender rates. To support this judgment, we compared crediting rates on our products to expected rates on competing products under different interest rate scenarios.
Significant unrealized appreciation on investments in a low interest rate environment may have caused DAC to be adjusted and additional future policy benefit liabilities to be recorded through a charge directly to AOCI (“changes related to unrealized appreciation of investments”). These charges were included, net of tax, with the change in net unrealized appreciation or depreciation of investments. In applying changes related to unrealized appreciation of investments, the Company overlayed unrealized gains and other changes related to unrealized appreciation of investments onto loss recognition tests.
ITEM 7 | Accounting Policies and Pronouncements
ADOPTION OF ACCOUNTING PRONOUNCEMENTS
See Note 2 to our audited annual consolidated financial statements for a complete discussion of adoption of accounting pronouncements.
Glossary
AIG Consolidated Tax Group — the U.S. federal income tax group of which AIG is the common parent.
Credit support annex — a legal document generally associated with an ISDA Master Agreement that provides for collateral postings which could vary depending on ratings and threshold levels.
Deferred policy acquisition costs — deferred costs that are incremental and directly related to the successful acquisition of new business or renewal of existing business.
Deferred sales inducement — represents enhanced crediting rates or bonus payments to contract holders on certain annuity and investment contract products that meet the criteria to be deferred and amortized over the life of the contract.
Fee income — is defined as policy fees plus advisory fees plus other fee income. For our Institutional Markets segment, its SVW products generate fee income.
Financial debt — represents the sum of short-term debt and long-term debt, net of debt issuance costs, not including (x) Debt of consolidated investment entities—not guaranteed by Corebridge; (y) debt supported by assets and issued for purposes of earning spread income, such as GICs and FABNs; and (z) operating debt utilized to fund daily operations, i.e., self-liquidating forms of financing such as securities lending, reverse repurchase and captive reinsurance reserve financing arrangements.
Financial leverage ratio — the ratio of financial debt to the sum of financial debt plus Adjusted Book Value plus non-redeemable noncontrolling interests.
Guaranteed investment contract — a contract whereby the issuer provides a guaranteed repayment of principal and a fixed or floating interest rate for a predetermined period of time.
Guaranteed minimum death benefit — a benefit that guarantees the annuity beneficiary will receive a certain value upon death of the annuitant. The GMDB feature may provide a death benefit of either (a) total deposits made to the contract, less any partial withdrawals plus a minimum return (and in rare instances, no minimum return); (b) return of premium whereby the benefit is the greater of the current account value or premiums paid less any partial withdrawals; (c) rollups whereby the benefit is the greater of current account value or premiums paid (adjusted for withdrawals) accumulated at contractually specified rates up to specified ages; or (d) the highest contract value attained, typically on any anniversary date less any subsequent withdrawals following the contract anniversary.
Guaranteed minimum withdrawal benefit — a type of living benefit that guarantees that withdrawals from the contract may be taken up to a contractually guaranteed amount, even if the account value subsequently falls to zero, provided that during each contract year total withdrawals do not exceed an annual withdrawal amount specified in the contract. Once the account value is depleted under the conditions of the GMWB, the policy continues to provide a protected income payment.
ISDA Master Agreement — an agreement between two counterparties, which may have multiple derivative transactions with each other governed by such agreement, that generally provides for the net settlement of all or a specified group of these derivative transactions, as well as pledged collateral, through a single payment, in a single currency, in the event of a default on, or affecting any, one derivative transaction or a termination event affecting all, or a specified group of, derivative transactions.
Liabilities Related to Unrealized Appreciation of Investments — an adjustment to benefit liabilities for investment-oriented products is recognized to reflect the application of the benefit ratio to the accumulated assessments that would have been recorded if fixed maturity securities available for sale were sold.
Loan-to-value ratio — principal amount of loan amount divided by appraised value of collateral securing the loan.
Market risk benefit — is an amount that a policyholder would receive in addition to the account balance upon the occurrence of a specific event or circumstance, such as death, annuitization, or periodic withdrawal that involves protection from capital market risk.
Master netting agreement — an agreement between two counterparties who have multiple derivative contracts with each other that provides for the net settlement of all contracts covered by such agreement, as well as pledged collateral, through a single payment, in a single currency, in the event of default on or upon termination of any one such contract.
Non-performance Risk Adjustment — adjusts the valuation of derivatives and MRBs to account for non-performance risk in the fair value measurement of all MRBs and derivative net liability positions.
Noncontrolling interests — the portion of equity ownership in a consolidated subsidiary not attributable to the controlling parent company.
Policy fees — an amount added to a policy premium, or deducted from a policy cash value or contract holder account, to reflect the cost of issuing a policy, establishing the required records and sending premium notices and other related expenses.
Reinsurance — the practice whereby one insurer, the reinsurer, in consideration of a premium paid to that insurer, agrees to indemnify another insurer, the ceding company, for part or all of the liability of the ceding company under one or more policies or contracts of insurance which it has issued.
Risk-based capital — a formula designed to measure the adequacy of an insurer’s statutory surplus compared to the risks inherent in its business.
Spread income — is defined as net investment income less interest credited to policyholder account balances, exclusive of amortization of deferred sales inducement assets. Spread income is comprised of both base spread income and variable investment income. For our Institutional Markets segment, its structured settlements, PRT and GIC products generate spread income, which includes premiums, net investment income, less interest credited and policyholder benefits and excludes the annual assumption update.
Surrender charge — a charge levied against an investor for the early withdrawal of funds from a life insurance or annuity contract, or for the cancellation of the agreement.
Surrender rate — represents annualized surrenders and withdrawals as a percentage of account value and Group Retirement mutual fund assets under administration.
Underwriting margin — for our Life Insurance segment includes premiums, policy fees, other income, net investment income, less interest credited to policyholder account balances and policyholder benefits and excludes the annual assumption update. For our Institutional Markets segment, its Corporate Markets products generate underwriting margin, which includes premiums, net investment income, policy and advisory fee income, less interest credited and policyholder benefits and excludes the annual assumption update.
Value of business acquired — present value of projected future gross profits from in-force policies of acquired businesses.
ITEM 7 | Certain Important Terms
Certain Important Terms
We use the following capitalized terms in this report
“AGC” means AGC Life Insurance Company, a Missouri insurance company;
“AGC Group” means AGC and its directly owned life insurance subsidiaries;
“AGL” means American General Life Insurance Company, a Texas insurance company;
“AGREIC” means AIG Global Real Estate Investment Corporation;
“AHAC” means American Home Assurance Company, a consolidated subsidiary of AIG;
“AIG” means AIG, Inc. and its subsidiaries, other than Corebridge and Corebridge’s subsidiaries, unless the context refers to AIG, Inc. only;
“AIG Bermuda” means AIG Life of Bermuda, Ltd, a Bermuda insurance company;
“AIG Group” means American International Group, Inc. and its subsidiaries, including Corebridge Parent and Corebridge Parent’s subsidiaries;
“AIG, Inc.” means American International Group, Inc., a Delaware corporation;
“AIGLH” means AIG Life Holdings, Inc., a Texas corporation;
“AIG Life (United Kingdom)” means AIG Life Ltd, a U.K. insurance company, and its subsidiary;
“AIGM” means AIG Markets, Inc., a consolidated subsidiary of AIG;
“AIGT” means AIG Technologies, inc., a New Hampshire corporation;
“AIRCO” means American International Reinsurance Company, LTD., a consolidated subsidiary of AIG;
“AMG” means AIG Asset Management (U.S.), LLC;
“Argon” means Argon Holdco LLC, a wholly owned subsidiary of Blackstone Inc.;
“BlackRock” means BlackRock Financial Management, Inc.;
“Blackstone” means Blackstone Inc. and its subsidiaries;
“Blackstone IM” means Blackstone ISG-1 Advisors L.L.C.;
“Cap Corp” means AIG Capital Corporation, a Delaware corporation;
“Corebridge”, “we,” “us,” “our” or the “Company” means Corebridge and its subsidiaries after giving effect to the transactions described under “The Reorganization Transactions,” unless the context refers to Corebridge Parent.
“Corebridge FD” means Corebridge Financial Distributors;
“Corebridge Parent” means Corebridge Financial, Inc. (formerly known as SAFG Retirement Services, Inc.), a Delaware corporation;
“Eastgreen” means Eastgreen Inc.;
“Fortitude Re” means Fortitude Reinsurance Company Ltd., a Bermuda insurance company. AIG formed Fortitude Re in 2018 and sold substantially all of its ownership interest in Fortitude Re’s parent company in two transactions in 2018 and 2020 so that we currently own a less than a 3% indirect interest in Fortitude Re. In February 2018, AGL, VALIC and USL entered into modco reinsurance agreements with Fortitude Re and AIG Bermuda novated its assumption of certain long-duration contracts from an affiliated entity to Fortitude Re. In the modco agreements, the investments supporting the reinsurance agreements, which reflect the majority of the consideration that would be paid to the reinsurer for entering into the transaction, are withheld by, and therefore continue to reside on the balance sheet of, the ceding company (i.e., AGL, VALIC and USL), thereby creating an obligation for the ceding company to pay the reinsurer (i.e., Fortitude Re) at a later date;
“Fortitude Re Bermuda” means FGH Parent, L.P., a Bermuda exempted limited partnership and the indirect parent of Fortitude Re;
ITEM 7 | Certain Important Terms
“Fortitude Re Embedded Derivative” means the embedded derivative contained within the funds withheld payable to Fortitude Re. Because we maintain ownership of the investments supporting our reinsurance agreements with Fortitude Re, we reflect our existing accounting for these assets, which consist primarily of available-for-sale securities, on our balance sheet. We have established a funds withheld payable to Fortitude Re while simultaneously establishing a reinsurance asset representing liabilities for the insurance coverage that Fortitude Re has assumed. The funds withheld payable contains an embedded derivative and changes in fair value of this derivative are recognized in Net realized gains (losses) on Fortitude Re funds withheld embedded derivative. This embedded derivative is considered a total return swap with contractual returns that are attributable to various assets, primarily available-for-sale securities, associated with these reinsurance agreements.
“Laya” means Laya Healthcare Limited, an Irish insurance intermediary, and its subsidiary;
“Lexington” means Lexington Insurance Company, an AIG subsidiary;
“Majority Interest Fortitude Sale” means the sale by AIG of substantially all of its interests in Fortitude Re's parent company to Carlyle FRL, L.P., an investment fund advised by an affiliate of The Carlyle Group Inc., and T&D United Capital Co., Ltd., a subsidiary of T&D Holdings, Inc., under the terms of a membership interest purchase agreement entered into on November 25, 2019 by and among AIG; Fortitude Group Holdings, LLC; Carlyle FRL, L.P.; The Carlyle Group Inc.; T&D United Capital Co., Ltd.; and T&D Holdings, Inc. We currently own less than a 3% indirect interest in Fortitude Re;
“NUFIC” means National Union Fire Insurance Company of Pittsburgh, PA, a consolidated subsidiary of AIG;
“NYDFS” means New York State Department of Financial Services;
“NYSE” means the New York Stock Exchange;
“Reorganization” means the transactions described under “The Reorganization Transactions”;
“USL” means The United States Life Insurance Company in the City of New York, a New York insurance company;
“VALIC” means The Variable Annuity Life Insurance Company, a Texas insurance company; and
“VALIC Financial Advisors” means VALIC Financial Advisors, Inc., a Texas corporation;
Acronyms
•“AATOI” — adjusted after-tax operating income attributable to our common stockholders;
•“ABS” — asset-backed securities;
•“APTOI” — adjusted pre-tax operating income;
•“AUA” — assets under administration;
•“AUM” — assets under management;
•“AUMA” — assets under management and administration;
•“BMA” — Bermuda Monetary Authority;
•“CDO” — collateralized debt obligations;
•“CDS” — credit default swap;
•“CLO” — collateral loan obligations;
•“CMBS” — commercial mortgage-backed securities;
•“DAC” — deferred policy acquisition costs;
•“DSI” — deferred sales inducement;
•“FABN”— funding-agreement back notes;
•“FASB” — the Financial Accounting Standards Board;
•“GAAP” — accounting principles generally accepted in the United States of America;
•“GIC” — guaranteed investment contract;
•“GMDB” — guaranteed minimum death benefits;
•“GMWB” — guaranteed minimum withdrawal benefits;
•“ISDA” — the International Swaps and Derivatives Association, Inc.;
•“MBS” — mortgage-backed securities;
•“MRB” — market risk benefits;
•“NAIC” — National Association of Insurance Commissioners;
•“NPA” — Non-performance Risk Adjustment
•“PRT” — pension risk transfer;
•“RBC” — Risk-Based Capital;
•“RMBS” — residential mortgage-backed securities;
•“S&P” — Standard & Poor’s Financial Services LLC;
•“SEC” — the U.S. Securities and Exchange Commission;
•“SVW” — stable value wrap;
•“URR” — unearned revenue reserve;
•“VIE” — variable interest entity;
•“VIX” — volatility index; and
•“VOBA” — value of business acquired.
ITEM 7A | Quantitative and Qualitative Disclosures about Market Risk
ITEM 7A | Quantitative and Qualitative Disclosures about Market Risk
The following provides information regarding the Company’s market risk. For further discussion of the Company’s risk management practices, see “Business—Our Segments—Individual Retirement—Risk Management,” “Business—Our Segments—Group Retirement—Risk Management,” “Business—Our Segments—Life Insurance—Risk Management,” “Business—Our Segments—Institutional Markets—Risk Management” and “Business—Our Segments—Investment Management—Risk Management.”
Market risk is the risk of adverse impact due to systemic movements in one or more of the following market risk drivers: equity and commodity prices, residential and commercial real estate values, interest rates, credit spreads, foreign exchange, inflation, and their respective levels of volatility.
We are engaged in a variety of insurance, investment and other financial services businesses that expose us to market risk, directly and indirectly. We are exposed to market risks primarily within our insurance and capital markets activities, on both the asset and the liability sides of our balance sheet through on- and off-balance sheet exposures. Many of the market risk exposures, including exposures to changes in levels of interest rates and equity prices, are generally long-term in nature. Examples of liability-related market risk exposures include interest rate sensitive surrenders in the fixed annuity and universal life product portfolios. Also, we have equity market risk sensitive surrenders in the variable annuity product portfolio. These interactive asset-liability types of risk exposures are regularly monitored in accordance with the risk governance framework.
The scope and magnitude of our market risk exposures are managed under a robust framework that contains defined risk limits and minimum standards for managing market risk. The market risk management framework focuses on quantifying the financial repercussions to us of changes in the above-mentioned market risk drivers.
Risk Management and Mitigation In addition to an established governance framework, we rely on a variety of tools and techniques to manage market risk-exposures. Our market risk mitigation framework incorporates the following primary elements:
Product design – Product design is the first step in managing insurance liability exposure to market risks.
Asset/liability management – We manage assets using an approach that is liability driven. Asset portfolios are managed to target durations based on liability characteristics and the investment objectives of that portfolio within defined ranges. Where liability cash flows exceed the maturity of available assets, we may support such liabilities with derivatives, interest rate curve mismatch strategies or equity and alternative investments.
Hedging – Our hedging strategies include the use of derivatives to offset certain changes in the economic value of MRBs and embedded derivatives associated with the variable annuity, fixed index annuity and index universal life liabilities, within established thresholds. These hedging programs are designed to provide additional protection against large and consolidated movements in levels of interest rates, equity prices, credit spreads and market volatility under multiple scenarios.
Currency matching – We manage our foreign currency exchange rate exposures within our risk tolerance levels. In general, investments backing specific liabilities are currency matched. This is achieved through investments in currency matching assets or the use of derivatives.
Management of portfolio concentration risk – We perform regular monitoring and management of key rate, foreign exchange, equity prices and other risk concentrations to support efforts to improve portfolio diversification to mitigate exposures to individual markets and sources of risk.
ITEM 7A | Quantitative and Qualitative Disclosures about Market Risk
Market Risk Sensitivities The following table provides estimates of sensitivity to changes in yield curves and equity prices on our financial instruments and excludes approximately $70.0 billion as of December 31, 2022, of insurance liabilities. We believe that the interest rate sensitivities of these insurance and other liabilities serve as an offset to the net interest rate risk of the financial assets presented in the table below. In addition, the table excludes $23.6 billion of interest rate sensitive assets and $0.1 million of equity investments supporting the Fortitude Re funds withheld arrangements as the contractual returns related to the assets are transferred to Fortitude Re, as well as $26.6 billion of related funds withheld payable.
December 31, 2022(a)
| | | | | | | | | | | | | | | | | | | | | | | | | | |
| December 31, | | Balance Sheet Exposure | | Economic Effect | | Economic Effect |
| (dollars in millions) | | 2022 | | | | 2022 | | | | 2022 | | |
| Sensitivity factor | | | | | | 100 bps parallel increase
in all yield curves | | 100 bps parallel decrease
in all yield curves |
| Interest rate sensitive assets: | | | | | | | | | | | | |
| Fixed maturity securities | | $ | 139,363 | | | | $ | (9,474) | | | | $ | 10,966 | | |
Mortgage and other loans receivable(b) | | 38,520 | | | | (1,630) | | | | 1,772 | | |
| Derivatives: | | | | | | | | | | | | |
| Interest rate contracts | | (84) | | | | (652) | | | | 1,284 | | |
| Total interest rate sensitive assets | | $ | 177,799 | | | (a) | $ | (11,756) | | | | $ | 14,022 | | |
| Interest rate sensitive liabilities: | | | | | | | | | | | | |
Policyholder contract deposits - Investment-type contracts(b) | | $ | (134,874) | | | | $ | 6,552 | | | | $ | (8,693) | | |
Market risk benefits and embedded derivatives(c) | | (9,348) | | | | 1,970 | | | | (2,585) | | |
Short-term and long-term debt(b) | | (9,368) | | | | 469 | | | | (531) | | |
| Total interest rate sensitive liabilities | | $ | (153,590) | | | | $ | 8,991 | | | | $ | (11,809) | | |
| Sensitivity factor: | | | | | | 20% decline in stock prices | | 20% increase in stock prices |
| Derivatives: | | | | | | | | | | | | |
Derivative contracts(c) | | $ | (84) | | | | $ | 552 | | | | | $ | 366 | | | |
| Equity investments: | | | | | | | | | | | | |
| Common equity | | 142 | | | | (28) | | | | 28 | | |
| Total derivatives and equity investments | | $ | 58 | | | | $ | 524 | | | | $ | 394 | | |
Market risk benefits and embedded derivatives(c) | | $ | (9,348) | | | | $ | (1,008) | | | | $ | 594 | | |
| Total liability | | $ | (9,348) | | | | $ | (1,008) | | | | $ | 594 | | |
(a)At December 31, 2022, the analysis covers $177.8 billion of $205.1 billion interest rate sensitive assets. As indicated above, excluded were $19.8 billion and $3.8 billion of fixed maturity securities and loans, respectively, supporting the Fortitude Re funds withheld arrangements. In addition, $2.7 billion of loans and $1.6 billion of assets across various asset categories were excluded due to modeling limitations.
(b)The economic effect is the difference between the estimated fair value and the effect of a 100 bps parallel increase or decrease in all yield curves on the estimated fair value. The estimated fair values for Mortgage and other loans receivable, Policyholder contract deposits (Investment-type contracts) and Short-term and long-term debt were $38.4 billion, $132.0 billion and $8.7 billion at December 31, 2022, respectively.
(c)The balance sheet exposures for derivatives and variable annuity and other embedded derivatives are also reflected under “Interest rate sensitive assets” and “interest rate sensitive liabilities” above and are not additive.
We manage our foreign currency exchange rate exposures within the approved risk tolerance levels. In general, investments backing specific liabilities are currency matched. This is achieved through investments in matching currency assets or through the use of derivatives.
The sensitivity analysis is an estimate and should not be viewed as predictive of our future financial condition or financial performance. We cannot ensure that actual financial impacts in any particular period will not exceed the amounts indicated above.
Interest rate sensitivity is defined as change in value with respect to a 100 basis point parallel shift up or down in the interest rate environment, calculated as: scenario value minus base value, where base value is the value under the yield curves as of the period end and scenario value is the value reflecting a 100 basis point parallel increase or decline in all yield curves.
Our interest rate risk is evaluated without considering effects of correlation of changes in levels of interest rate with other key market risks or other assumptions used for calculating the values of financial assets and liabilities. This scenario does not measure changes in values resulting from non-parallel shifts in the yield curves, which could produce different results.
Equity sensitivity is defined as change in value with respect to a 20% increase or decline in equity prices and scenario value is the value reflecting a 20% increase or decrease in equity prices.
ITEM 7A | Quantitative and Qualitative Disclosures about Market Risk
Our equity price risk is evaluated without considering effects of correlation of changes in equity prices with other key market risks or other assumptions used for calculating the values of financial assets and liabilities. These scenarios do not reflect the impact of basis risk, such as projections about the future performance of the underlying contract holder funds and actual fund returns, which is used as a basis for developing our hedging strategy.
For illustrative purposes, sensitivities are modeled based on a 100 basis point parallel increase or decline in yield curves, and a 20% increase or decline in equity prices. The estimated results presented in the table above should not be taken as a prediction, but only as a demonstration of the potential effects of such events.
Item 8 | Financial Statements and Supplementary Data
COREBRIDGE FINANCIAL, INC.
REFERENCE TO FINANCIAL STATEMENTS AND SCHEDULES | | | | | | | | |
| Financial Statements |
| |
| Consolidated Balance Sheets at December 31, 2022 and 2021 | |
| Consolidated Statement of Income (Loss) for the years ended December 31, 2022, 2021 and 2020 | |
| Consolidated Statements of Comprehensive Income (Loss) for the years ended December 31, 2022, 2021 and 2020 | |
| Consolidated Statements of Equity for the years ended December 31, 2022, 2021 and 2020 | |
| Consolidated Statements of Cash Flows for the years ended December 31, 2022, 2021 and 2020 | |
| Notes to Consolidated Financial Statements |
| Overview and Basis of Presentation | |
| Summary of Significant Accounting Policies | |
| Segment Information | |
| Fair Value Measurements | |
| Investments | |
| Lending Activities | |
| Reinsurance | |
| Deferred Policy Acquisition Costs | |
| Variable Interest Entities | |
| Derivatives and Hedge Accounting | |
| Goodwill and Other Intangible Assets | |
| Insurance Liabilities | |
| Market Risk Benefits | |
| Separate Account Assets and Liabilities | |
| Debt | |
| Contingencies, Commitments and Guarantees | |
| Equity and Redeemable Noncontrolling Interest | |
| Earnings Per Common Share | |
| Statutory Financial Data and Restrictions | |
| Share-Based Compensation Plans | |
| Employee Benefits | |
| Income Taxes | |
| Related Parties | |
| | |
| Schedules |
| Summary of Investments – Other than Investments in Related Parties at December 31, 2022 | |
| Condensed Financial Information of Registrant at December 31, 2022 and 2021 and for the years ended December 31, 2022, 2021 and 2020 | |
| Supplementary Insurance Information at December 31, 2022 and 2021 and for the years ended December 31, 2022, 2021 and 2020 | |
| Reinsurance at December 31, 2022 and 2021 and for the years ended December 31, 2022, 2021 and 2020 | |
ITEM 8 | Report of Independent Registered Public Accounting Firm
Report of Independent Registered Public Accounting Firm To the Board of Directors and Shareholders of Corebridge Financial, Inc.
Opinion on the Financial Statements
We have audited the accompanying consolidated balance sheets of Corebridge Financial, Inc. and its subsidiaries (the “Company”) as of December 31, 2022 and 2021 and the related consolidated statements of income (loss), of comprehensive income (loss), of equity and of cash flows for each of the three years in the period ended December 31, 2022, including the related notes and financial statement schedules listed in the accompanying index (collectively referred to as the “consolidated financial statements”). In our opinion, the consolidated financial statements present fairly, in all material respects, the financial position of the Company as of December 31, 2022 and 2021, and the results of its operations and its cash flows for each of the three years in the period ended December 31, 2022 in conformity with accounting principles generally accepted in the United States of America.
Change in Accounting Principle
As discussed in Note 1 to the consolidated financial statements, the Company changed the manner in which it accounts for long-duration insurance contracts in 2023.
Basis for Opinion
These consolidated financial statements are the responsibility of the Company’s management. Our responsibility is to express an opinion on the Company’s consolidated financial statements based on our audits. We are a public accounting firm registered with the Public Company Accounting Oversight Board (United States) (PCAOB) and are required to be independent with respect to the Company in accordance with the U.S. federal securities laws and the applicable rules and regulations of the Securities and Exchange Commission and the PCAOB.
We conducted our audits of these consolidated financial statements in accordance with the standards of the PCAOB. Those standards require that we plan and perform the audit to obtain reasonable assurance about whether the consolidated financial statements are free of material misstatement, whether due to error or fraud.
Our audits included performing procedures to assess the risks of material misstatement of the consolidated financial statements, whether due to error or fraud, and performing procedures that respond to those risks. Such procedures included examining, on a test basis, evidence regarding the amounts and disclosures in the consolidated financial statements. Our audits also included evaluating the accounting principles used and significant estimates made by management, as well as evaluating the overall presentation of the consolidated financial statements. We believe that our audits provide a reasonable basis for our opinion.
Critical Audit Matters
The critical audit matters communicated below are matters arising from the current period audit of the consolidated financial statements that were communicated or required to be communicated to the audit committee and that (i) relate to accounts or disclosures that are material to the consolidated financial statements and (ii) involved our especially challenging, subjective, or complex judgments. The communication of critical audit matters does not alter in any way our opinion on the consolidated financial statements, taken as a whole, and we are not, by communicating the critical audit matters below, providing separate opinions on the critical audit matters or on the accounts or disclosures to which they relate.
Adoption of the New Accounting Standard for Long-Duration Contracts
As described above and in Notes 2, 4, 12 and 13 to the consolidated financial statements, the Company has adopted the new accounting standard relating to targeted improvements to the accounting for long-duration insurance contracts (the “LDTI standard”). The Company adopted the LDTI standard on January 1, 2023 with a transition date of January 1, 2021, on a modified retrospective basis, except for market risk benefits (MRBs) which used a full retrospective basis. The consolidated financial statements as of and for the years ended December 31, 2022 and 2021 have been adjusted to reflect the effects of applying the standard. The impact of the adoption of the LDTI standard resulted in a decrease to beginning total equity of $1.2 billion. The impact of adopting the standard also resulted in adjustments of $1,170 million and $144 million to total equity as of December 31, 2022 and 2021, respectively, and of $10 million and $888 million to net income for the years then ended (collectively referred to as the “adoption adjustments”). The adoption adjustments include changes related to MRBs and changes to the discount rate used to measure the liability for future policy benefits. The current discount rate assumption for the liability for future policy benefits is updated quarterly and is derived from market observable yields on upper medium grade fixed income instruments. The method for constructing and applying the locked-in discount rate assumptions on newly issued business is determined based on factors such as product characteristics and the expected timing of cash flows. Management employs conversion and interpolation methodologies when necessary. Certain variable annuity and fixed index annuity contracts contain MRBs related to guaranteed benefit features that management separates from the host contracts and accounts for at fair value. The fair value of MRBs contained in certain variable annuity and fixed index annuity contracts is measured based on policyholder behavior and capital market assumptions related to projected cash flows over the expected lives of the contracts. The projected cash flows incorporate best estimate assumptions for policyholder behavior (including mortality, lapses, withdrawals and benefit utilization), along with an explicit risk margin to reflect a market participant’s estimates of projected cash flows and policyholder behavior. Estimating the underlying cash flows for these products involves judgments regarding the capital market assumptions related to expected market rates of return, market volatility, option budgets, credit spreads, correlations of certain market variables, fund performance and discount rates. The portion of fees attributable to the fair value of expected benefit payments is included within the fair value
ITEM 8 | Report of Independent Registered Public Accounting Firm
measurement of these MRBs. Option pricing models are used to estimate the fair value of embedded derivatives (EDs) in fixed index annuity contracts, taking into account the capital market assumptions for future index growth rates, volatility of the index, future interest rates, option budgets, and management’s ability to adjust the participation rate and the cap on fixed index credited rates in light of market conditions and policyholder behavior assumptions. As of December 31, 2022 the fair value of market risk benefit assets and market risk benefit liabilities was $796 million and $4,736 million, respectively which includes, MRBs related to individual retirement variable and fixed index annuities. As of December 31, 2022 the EDs related to the fixed index annuity contracts with guaranteed product features included in policyholder contract deposits were $1,078 million.
The principal considerations for our determination that performing procedures relating to the adoption of the LDTI standard is a critical audit matter are (i) the significant judgment by management when adopting the LDTI standard and determining the adoption adjustments, (ii) a high degree of auditor judgment, subjectivity and effort in performing procedures and evaluating management’s assumptions (collectively the “significant assumptions”) relating to (a) the discount rate assumption for the liability for future policy benefits, (b) the individual retirement variable annuity policyholder behavior assumptions related to lapses, benefit utilization, an explicit risk margin, and capital market assumptions related to long-term equity volatilities used in determining the attributed fee at policy inception date in the valuation of MRBs, (c) the individual retirement variable annuity and fixed index annuity policyholder behavior assumptions related to lapses and benefit utilization, along with an explicit risk margin, as well as capital market assumptions related to long-term equity volatilities and individual retirement fixed index annuity option budget assumptions used in the valuation of MRBs, (d) the individual retirement fixed index annuity policyholder behavior assumptions related to lapses, benefit utilization, along with an explicit risk margin, as well as capital market assumptions related to the option budget assumptions used in the valuation of the EDs, and (iii) the audit effort involved the use of professionals with specialized skills and knowledge.
Addressing the matter involved performing procedures and evaluating audit evidence in connection with forming our overall opinion on the consolidated financial statements. These procedures included, among others, (i) evaluating management’s process for adopting the LDTI standard and for determining the adoption adjustments, (ii) testing the relevance and reliability of the external data used by management to develop the discount rate assumption for the liability for future policy benefit, (iii) testing the completeness and accuracy of the data used by management to develop and update the significant assumptions on a sample basis, and (iv) the use of professionals with specialized skill and knowledge to assist in (a) evaluating the reasonableness of the current discount rate assumption based on the consideration of the Company’s experience, industry trends, and market conditions, as applicable, and (b) evaluating the reasonableness of the aforementioned significant assumptions used to determine the attributed fee at policy inception, the fair value of MRBs and the fair value of the EDs associated with index credits based on the consideration of the Company’s historical and actual experience, industry trends, and market conditions, as applicable.
Valuation of Certain Level 3 Fixed Maturity Securities
As described in Note 4 to the consolidated financial statements, as of December 31, 2022, the total fair value of the Company’s level 3 fixed maturity securities, including bonds available for sale and other bond securities, was $21.7 billion, comprised of residential mortgage backed securities, commercial mortgage backed securities, collateralized loan obligations, other asset-backed securities, and fixed maturity securities issued by corporations (including private placements), states, municipalities, and other governmental agencies. As the volume or level of market activity for these securities is limited, management determines fair value either by requesting brokers who are knowledgeable about the particular security to provide a price quote, which according to management is generally non-binding, or by employing market accepted valuation models. In both cases, certain inputs used by management to determine fair value may not be observable in the market. For certain private placement securities, fair value is determined by management based on discounted cash flow models using discount rates based on credit spreads, yields or price levels of comparable securities, adjusted for illiquidity and structure. For other level 3 fixed maturity securities, such assumptions may include loan delinquencies and defaults, loss severity, and prepayments. As disclosed by management, fair value estimates are subject to management review to ensure valuation models and related inputs are reasonable.
The principal considerations for our determination that performing procedures relating to the valuation of certain level 3 fixed maturity securities is a critical audit matter are (i) the significant judgment by management to determine the fair value of these securities, which in turn led to a high degree of auditor subjectivity and judgment in performing the audit procedures relating to the aforementioned assumptions that are used to determine the fair value, (ii) the significant audit effort and judgment in evaluating the audit evidence related to the valuation and (iii) the audit effort involved the use of professionals with specialized skill and knowledge.
Addressing the matter involved performing procedures and evaluating audit evidence in connection with forming our overall opinion on the consolidated financial statements. These procedures included testing the effectiveness of controls relating to the valuation of level 3 fixed maturity securities, including controls related to (i) management’s review over the pricing function and (ii) identifying and resolving pricing exceptions. These procedures also included, among others, obtaining independent third party vendor pricing, where available, and the involvement of professionals with specialized skill and knowledge to assist in developing an independent range of prices for a sample of securities. Developing the independent range of prices involved testing the completeness and accuracy of data provided by management on a sample basis and evaluating management’s assumptions noted above. The independent third party vendor pricing and the independently developed ranges were compared to management’s recorded fair value estimates.
Valuation of Embedded Derivatives for Variable Annuity and Fixed Index Annuity Products and Valuation of Certain Guaranteed Benefit Features for Universal Life Products (as accounted for in the original issuance)
As described in Notes 4 and 12 (not presented herein) to the consolidated financial statements (appearing under Item 8 of the Company’s 2022 Annual Report on Form 10-K), certain fixed index annuity and variable annuity contracts contain embedded derivatives that are
ITEM 8 | Report of Independent Registered Public Accounting Firm
bifurcated from the host contracts and accounted for separately at fair value in policyholder contract deposits. As disclosed in the original issuance, as of December 31, 2022, the fair value of these embedded derivatives was $5.7 billion and $0.7 billion for fixed index annuity and variable annuities with guaranteed minimum withdrawal benefits, respectively. The fair value of embedded derivatives contained in certain variable annuity and fixed index annuity contracts is measured based on policyholder behavior and capital market assumptions related to projected cash flows over the expected lives of the contracts. The policyholder behavior assumptions for these liabilities include mortality, lapses, withdrawals, and benefit utilization, along with an explicit risk margin to reflect a market participant’s estimates of projected cash flows. Estimates of future policyholder behavior assumptions are subjective and based primarily on the Company’s historical experience. The capital market assumptions related to the embedded derivatives for variable annuity contracts involve judgments regarding expected market rates of return, market volatility, credit spreads, correlations of certain market variables, fund performance, and discount rates. Unobservable inputs used for valuing the embedded derivative include long-term equity volatilities which represent the volatility beyond the period for which observable equity volatilities are available. With respect to embedded derivatives for fixed index annuity contracts, option pricing models are used to estimate fair value, taking into account the capital market assumptions. Such models use option budget assumptions which estimate the expected long-term cost of options used to hedge exposures associated with equity price changes. The option budget determines the future costs of the options, which impacts the growth in account value and the valuation of embedded derivatives. Additional policyholder liabilities are also established for universal life policies with secondary guarantees, as well as other universal life policies for which profits followed by losses are expected at contract inception. As disclosed in the original issuance, as of December 31, 2022, the liability for universal life secondary guarantees and similar features was $2.8 billion, which is included within future policy benefits. The policyholder behavior assumptions for these liabilities include mortality, lapses and premium persistency. The capital market assumptions used for the liability for universal life secondary guarantees include discount rates and net earned rates. As described above and in Note 2, subsequent to the original issuance of the December 31, 2022 consolidated financial statements, the Company adopted the new accounting standard relating to targeted improvements to existing recognition, measurement, presentation and disclosure requirements for long-duration insurance contracts on a modified retrospective basis, except for MRBs which used a full retrospective basis. As a result of the adoption of this standard, certain EDs described above are now measured at fair value and presented separately on the balance sheet as market risk benefit assets and market risk benefit liabilities.
The principal considerations for our determination that performing procedures relating to the valuation of embedded derivatives for variable annuity and fixed index annuity products and valuation of certain guaranteed benefit features for universal life products (as accounted for in the original issuance) is a critical audit matter are (i) the significant judgment by management in developing the aforementioned policyholder behavior assumptions, as well as long-term equity volatilities and option budget assumptions, which in turn led to a high degree of auditor subjectivity and judgment in performing the audit procedures related to the significant assumptions used in the estimate, (ii) the significant audit effort and judgment in evaluating the audit evidence relating to the significant assumptions used by management in the valuation of the embedded derivatives and additional policyholder liabilities, and (iii) the audit effort involved the use of professionals with specialized skill and knowledge.
Addressing the matter involved performing procedures and evaluating audit evidence in connection with forming our overall opinion on the consolidated financial statements. These procedures included testing the effectiveness of controls relating to the development of assumptions used in the valuation of embedded derivatives for variable annuity and fixed index annuity products and valuation of certain guaranteed benefit features for universal life products. These procedures also included, among others, the involvement of professionals with specialized skill and knowledge to assist in performing an evaluation of the appropriateness of management’s methodology and the reasonableness of management’s judgments used in developing policyholder behavior, as well as long-term volatilities and option budget assumptions used in estimating the valuation of guaranteed benefit features. These procedures considered the consistency of the assumptions across products, in relation to prior periods, and in relation to management’s historical experience or observed industry practice, and the continued appropriateness of unchanged assumptions. Procedures were performed to test the completeness and accuracy of data used by management on a sample basis.
Valuation of Deferred Policy Acquisition Costs for Universal Life and Individual Retirement Variable Annuity Products (as accounted for in the original issuance)
As described in Note 8 (not presented herein) to the consolidated financial statements (appearing under Item 8 of the Company’s 2022 Annual Report on Form 10-K), as of December 31, 2022, a portion of the $11.0 billion deferred policy acquisition costs (DAC) for investment-oriented products are associated with universal life and individual retirement variable annuity products (as accounted for in the original issuance). Policy acquisition costs and policy issuance costs related to investment-oriented products are deferred and amortized, with interest, in relation to the incidence of estimated gross profits to be realized over the estimated lives of the contracts. Estimated gross profits are affected by a number of factors, including current and expected interest rates, net investment income and spreads, net realized gains and losses, fees, surrender rates, mortality experience, policyholder behavior experience, equity market returns, and volatility. If the assumptions used for estimated gross profits change, DAC is recalculated using the new assumptions, including actuarial assumptions related to mortality, lapse, benefit utilization, and premium persistency, and any resulting adjustment is included in income. DAC for investment-oriented products is reviewed by management for recoverability, which involves estimating the future profitability of the current business. If actual profitability is substantially lower than previously estimated profitability, DAC may be subject to an impairment charge. As described above and in Note 2, subsequent to the original issuance of the December 31, 2022 consolidated financial statements, the Company adopted the new accounting standard relating to targeted improvements to existing recognition, measurement, presentation and disclosure requirements for long-duration insurance contracts on a modified retrospective basis, except for MRBs which used a full retrospective basis. As a result of the adoption of this standard, in the reissued financial statements DAC is amortized on a constant level basis over the expected term of the related contracts.
ITEM 8 | Report of Independent Registered Public Accounting Firm
The principal considerations for our determination that performing procedures relating to the valuation of DAC for universal life and individual retirement variable annuity products (as accounted for in the original issuance) is a critical audit matter are (i) the significant judgment by management to determine the policyholder behavior assumptions related to mortality, lapse, benefit utilization, and premium persistency, which in turn led to a high degree of auditor subjectivity and judgment in performing the audit procedures related to the significant assumptions used in the estimate, (ii) the significant audit effort and judgment in evaluating the audit evidence relating to management’s policyholder behavior assumptions, and (iii) the audit effort involved the use of professionals with specialized skill and knowledge.
Addressing the matter involved performing procedures and evaluating audit evidence in connection with forming our overall opinion on the consolidated financial statements. These procedures included testing the effectiveness of controls relating to the amortization and recoverability of DAC for universal life and individual retirement variable annuity products, including controls over the development of significant assumptions. These procedures also included, among others, the involvement of professionals with specialized skill and knowledge to assist in evaluating the appropriateness of management’s methodology and the reasonableness of management’s policyholder behavior assumptions related to mortality, lapse, benefit utilization, and premium persistency, which are used in the calculation of estimated gross profits. The evaluation of the reasonableness of the assumptions included consideration of the consistency of the assumptions across products in relation to prior periods and in relation to management’s historical experience or observed industry practice. Procedures were performed to test the completeness and accuracy of data used by management in developing the assumptions on a sample basis.
/s/ PricewaterhouseCoopers LLP
New York, New York
February 24, 2023, except as it relates to the change in the manner in which the Company accounts for long-duration insurance contracts discussed in Note 1 to the consolidated financial statements, as to which the date is June 5, 2023
We have served as the Company's auditor since 2020.
Corebridge Financial, Inc.
Consolidated Balance Sheets
| | | | | | | | | | | |
| (in millions, except for share data) | December 31, 2022 | | December 31, 2021 |
| Assets: | | | |
| Investments: | | | |
| Fixed maturity securities: | | | |
Bonds available for sale, at fair value, net of allowance for credit losses of $148 in 2022 and $78 in 2021 (amortized cost: 2022 - $181,274; 2021 - $182,593)* | $ | 156,793 | | | $ | 198,568 | |
| Other bond securities, at fair value (See Note 5)* | 3,769 | | | 2,082 | |
| Equity securities, at fair value (See Note 5)* | 170 | | | 242 | |
Mortgage and other loans receivable, net of allowance for credit losses of $600 in 2022 and $496 in 2021* | 44,566 | | | 39,388 | |
Other invested assets (portion measured at fair value: 2022 - $7,879; 2021 - $7,104)* | 10,418 | | | 10,567 | |
Short-term investments, including restricted cash of $69 in 2022 and $57 in 2021 (portion measured at fair value: 2022 - $1,357; 2021 - $1,455)* | 4,400 | | | 5,471 | |
| Total investments | 220,116 | | | 256,318 | |
| Cash* | 552 | | | 537 | |
| Accrued investment income* | 1,813 | | | 1,760 | |
Premiums and other receivables, net of allowance for credit losses and disputes of $1 in 2022 and $1 in 2021 | 916 | | | 884 | |
Reinsurance assets - Fortitude Re, net of allowance for credit losses and disputes of $0 in 2022 and $0 in 2021 | 26,844 | | | 34,102 | |
Reinsurance assets - other, net of allowance for credit losses and disputes of $84 in 2022 and $101 in 2021 | 2,517 | | | 3,101 | |
| Deferred income taxes | 8,831 | | | 4,796 | |
| Deferred policy acquisition costs and value of business acquired | 10,563 | | | 10,598 | |
| Market risk benefit assets, at fair value | 796 | | | 610 | |
Other assets, including restricted cash of $12 in 2022 and $7 in 2021 (portion measured at fair value: 2022 - $299; 2021 - $684)* | 2,521 | | | 3,614 | |
| Separate account assets, at fair value | 84,853 | | | 109,111 | |
| Total assets | $ | 360,322 | | | $ | 425,431 | |
| Liabilities: | | | |
| Future policy benefits for life and accident and health insurance contracts | $ | 50,518 | | | $ | 64,270 | |
Policyholder contract deposits (portion measured at fair value: 2022 - $5,464; 2021 - $5,702) | 156,058 | | | 151,545 | |
| Market risk benefit liabilities, at fair value | 4,736 | | | 7,499 | |
| Other policyholder funds | 2,885 | | | 2,879 | |
Fortitude Re funds withheld payable (portion measured at fair value: 2022 - $1,262; 2021 - $7,974) | 26,551 | | | 35,144 | |
Other liabilities (portion measured at fair value: 2022 - $97; 2021 - $191)* | 9,076 | | | 10,231 | |
| Short-term debt | 1,500 | | | 8,317 | |
| Long-term debt | 7,868 | | | 427 | |
Debt of consolidated investment entities (portion measured at fair value: 2022 - $6; 2021 - $5)* | 5,958 | | | 6,936 | |
| Separate account liabilities | 84,853 | | | 109,111 | |
| Total liabilities | $ | 350,003 | | | $ | 396,359 | |
Contingencies, commitments and guarantees (See Note 16) | | | |
| | | |
| Redeemable noncontrolling interest | — | | | 83 | |
| | | |
| Corebridge Shareholders' equity: | | | |
Common stock, $0.01 par value; 2,500,000,000 shares authorized; 645,000,000 shares issued | 6 | | | — | |
Common stock class A, $0.01 par value; 2,252,500,000 shares authorized; 581,145,000 shares issued | — | | | 5 | |
Common stock class B, $0.01 par value; 247,500,000 shares authorized; 63,855,000 shares issued | — | | | 1 | |
| Additional paid-in capital | 8,030 | | | 8,054 | |
| Retained earnings | 18,207 | | | 10,937 | |
| | | |
| Accumulated other comprehensive income (loss) | (16,863) | | | 8,233 | |
| Total Corebridge Shareholders' equity | 9,380 | | | 27,230 | |
| Non-redeemable noncontrolling interests | 939 | | | 1,759 | |
| Total equity | 10,319 | | | 28,989 | |
| Total liabilities, redeemable noncontrolling interest and equity | $ | 360,322 | | | $ | 425,431 | |
| | | |
*See Note 9 for details of balances associated with variable interest entities.
See accompanying Notes to Consolidated Financial Statements.
Corebridge Financial, Inc. Consolidated Statements of Income (Loss)
| | | | | | | | | | | | | | | | | | | | | | | | |
| | | | Years Ended December 31, |
| (in millions, except per common share data) | | | | | | 2022 | | 2021 | | 2020 |
| Revenues: | | | | | | | | | | |
| Premiums | | | | | | $ | 5,091 | | | $ | 5,653 | | | $ | 4,341 | |
| Policy fees | | | | | | 2,914 | | | 3,005 | | | 2,874 | |
| Net investment income: | | | | | | | | | | |
| Net investment income - excluding Fortitude Re funds withheld assets | | | | | | 8,685 | | | 9,897 | | | 9,089 | |
| Net investment income - Fortitude Re funds withheld assets | | | | | | 891 | | | 1,775 | | | 1,427 | |
| Total net investment income | | | | | | 9,576 | | | 11,672 | | | 10,516 | |
| Net realized gains (losses): | | | | | | | | | | |
| Net realized gains (losses) - excluding Fortitude Re funds withheld assets and embedded derivative | | | | | | 141 | | | 1,515 | | | (765) | |
| Net realized gains (losses) on Fortitude Re funds withheld assets | | | | | | (397) | | | 924 | | | 1,002 | |
| Net realized gains (losses) on Fortitude Re funds withheld embedded derivative | | | | | | 6,347 | | | (687) | | | (3,978) | |
| Total net realized gains (losses) | | | | | | 6,091 | | | 1,752 | | | (3,741) | |
| Advisory fee income | | | | | | 475 | | | 597 | | | 553 | |
| Other income | | | | | | 550 | | | 578 | | | 519 | |
| Total revenues | | | | | | 24,697 | | | 23,257 | | | 15,062 | |
| Benefits and expenses: | | | | | | | | | | |
Policyholder benefits (including remeasurement (gains) losses of $298 and $233 for the years ended December 31, 2022 and 2021, respectively) | | | | | | 6,720 | | | 7,387 | | | 6,602 | |
| Change in the fair value of market risk benefits, net | | | | | | (958) | | | (447) | | | — | |
| Interest credited to policyholder account balances | | | | | | 3,732 | | | 3,562 | | | 3,528 | |
| Amortization of deferred policy acquisition costs and value of business acquired | | | | | | 1,020 | | | 951 | | | 543 | |
| Non-deferrable insurance commissions | | | | | | 568 | | | 623 | | | 604 | |
| Advisory fee expenses | | | | | | 266 | | | 322 | | | 316 | |
| General operating expenses | | | | | | 2,323 | | | 2,104 | | | 2,027 | |
| Interest expense | | | | | | 534 | | | 389 | | | 490 | |
| (Gain) loss on extinguishment of debt | | | | | | — | | | 219 | | | 10 | |
| Net (gain) loss on divestitures | | | | | | 1 | | | (3,081) | | | — | |
| Net (gain) loss on Fortitude Re transactions | | | | | | — | | (26) | | 91 |
| Total benefits and expenses | | | | | | 14,206 | | | 12,003 | | | 14,211 | |
| Income (loss) before income tax expense (benefit) | | | | | | 10,491 | | | 11,254 | | | 851 | |
| Income tax expense (benefit): | | | | | | | | | | |
| Current | | | | | | 878 | | 1,946 | | 1,724 |
| Deferred | | | | | | 1,134 | | 136 | | (1,739) |
| Income tax expense (benefit) | | | | | | 2,012 | | | 2,082 | | | (15) | |
| Net income (loss) | | | | | | 8,479 | | | 9,172 | | | 866 | |
| Less: | | | | | | | | | | |
| Net income (loss) attributable to noncontrolling interests | | | | | | 320 | | | 929 | | | 224 | |
| Net income (loss) attributable to Corebridge | | | | | | $ | 8,159 | | | $ | 8,243 | | | $ | 642 | |
| | | | | | | | | | |
| Income (loss) per common share attributable to Corebridge common shareholders: | | | | | | | | | | |
| Basic: | | | | | | | | | | |
| Common stock | | | | | | $ | 12.63 | | | N/A | | N/A |
| Common stock Class A | | | | | | N/A | | $ | 13.18 | | | $ | 1.00 | |
| Common stock Class B | | | | | | N/A | | $ | 9.14 | | | $ | 1.00 | |
| Diluted: | | | | | | | | | | |
| Common stock | | | | | | $ | 12.60 | | | N/A | | N/A |
| Common stock Class A | | | | | | N/A | | $ | 13.18 | | | $ | 1.00 | |
| Common stock Class B | | | | | | N/A | | $ | 9.14 | | | $ | 1.00 | |
| | | | | | | | | | |
| Weighted averages shares outstanding: | | | | | | | | | | |
| Common stock - Basic | | | | | | 646.1 | | | N/A | | N/A |
| Common stock - Diluted | | | | | | 647.4 | | | N/A | | N/A |
| Common stock Class A - Basic and diluted | | | | | | N/A | | 581.1 | | | 581.1 | |
| Common stock Class B - Basic and diluted | | | | | | N/A | | 63.9 | | | 63.9 | |
See accompanying Notes to Consolidated Financial Statements.
Corebridge Financial, Inc.
Consolidated Statements of Comprehensive Income (Loss)
| | | | | | | | | | | | | | | | | | | | | |
| | | Years Ended December 31, |
| (in millions) | | | | | 2022 | | 2021 | | 2020 |
| Net income | | | | | $ | 8,479 | | | $ | 9,172 | | | $ | 866 | |
| Other comprehensive income (loss), net of tax | | | | | | | | | |
| Change in unrealized appreciation (depreciation) of fixed maturity securities on which allowance for credit losses was taken | | | | | (61) | | | 31 | | | (62) | |
| Change in unrealized appreciation (depreciation) of all other investments | | | | | (31,695) | | | (5,638) | | | 5,337 | |
| Change in fair value of market risk benefits attributable to changes in our own credit risk | | | | | 1,294 | | | 179 | | | — | |
| Change in the discount rates used to measure traditional and limited payment long-duration insurance contracts | | | | | 5,298 | | | 1,356 | | | — | |
| Change in cash flow hedges | | | | | 157 | | | — | | | — | |
| Change in foreign currency translation adjustments | | | | | (101) | | | (20) | | | 57 | |
| Change in retirement plan liabilities | | | | | 2 | | | 1 | | | (2) | |
| Other comprehensive income (loss) | | | | | (25,106) | | | (4,091) | | | 5,330 | |
| Comprehensive income (loss) | | | | | (16,627) | | | 5,081 | | | 6,196 | |
| Less: | | | | | | | | | |
| Comprehensive income attributable to noncontrolling interests | | | | | 310 | | | 929 | | | 230 | |
| Comprehensive income (loss) attributable to Corebridge | | | | | $ | (16,937) | | | $ | 4,152 | | | $ | 5,966 | |
See accompanying Notes to Consolidated Financial Statements.
Corebridge Financial, Inc.
Consolidated Statements of Equity
| | | | | | | | | | | | | | | | | | | | | | | | | | | | | | | | |
| (in millions) | Common Stock | Common
Stock
Class A | Common
Stock
Class B | Additional
Paid-In
Capital | Retained
Earnings | Shareholders'
Net Investment | Accumulated
Other
Comprehensive
Income (Loss) | Total
Corebridge
Shareholders'
Equity | Non-
Redeemable
Noncontrolling
Interests | Total
Shareholders'
Equity |
| | | | | | | | | | |
| Balance, January 1 2020 | $ | — | | $ | 5 | | $ | 1 | | $ | — | | $ | — | | $ | 22,470 | | $ | 9,329 | | $ | 31,805 | | $ | 1,874 | | $ | 33,679 | |
| Cumulative effect of change in accounting principle, net of tax | — | | — | | — | | — | | — | | (246) | | — | | (246) | | — | | (246) | |
| Change in net investment | — | | — | | — | | — | | — | | (296) | | — | | (296) | | — | | (296) | |
| Net income attributable to Corebridge or noncontrolling interests | — | | — | | — | | — | | — | | 642 | | — | | 642 | | 224 | | 866 | |
| Other comprehensive income, net of tax | — | | — | | — | | — | | — | | — | | 5,324 | | 5,324 | | 6 | | 5,330 | |
| Changes in noncontrolling interests due to divestitures and acquisitions | — | | — | | — | | — | | — | | — | | — | | — | | 633 | | 633 | |
| Contributions from noncontrolling interests | — | | — | | — | | — | | — | | — | | — | | — | | 268 | | 268 | |
| Distributions to noncontrolling interests | — | | — | | — | | — | | — | | — | | — | | — | | (454) | | (454) | |
| Other | — | | — | | — | | — | | — | | 3 | | — | | 3 | | (2) | | 1 | |
| | | | | | | | | | |
| Balance, December 31, 2020 | $ | — | | $ | 5 | | $ | 1 | | $ | — | | $ | — | | $ | 22,573 | | $ | 14,653 | | $ | 37,232 | | $ | 2,549 | | $ | 39,781 | |
| | | | | | | | | | |
| | | | | | | | | | |
| Cumulative effect of change in accounting principle, net of tax | | — | | — | | — | | — | | 1,192 | | (2,349) | | (1,157) | | — | | (1,157) | |
| Change in net investment | — | | — | | — | | — | | — | | (13,004) | | — | | (13,004) | | — | | (13,004) | |
| Net income attributable to Corebridge or noncontrolling interests | — | | — | | — | | — | | — | | 8,243 | | — | | 8,243 | | 929 | | 9,172 | |
| Other comprehensive loss, net of tax | — | | — | | — | | — | | — | | — | | (4,091) | | (4,091) | | — | | (4,091) | |
| Changes in noncontrolling interests due to divestitures and acquisitions | — | | — | | — | | — | | — | | — | | — | | — | | (373) | | (373) | |
| Contributions from noncontrolling interests | — | | — | | — | | — | | — | | — | | — | | — | | 264 | | 264 | |
| Distributions to noncontrolling interests | — | | — | | — | | — | | — | | — | | — | | — | | (1,611) | | (1,611) | |
| Other | — | | — | | — | | — | | — | | (13) | | 20 | | 7 | | 1 | | 8 | |
| Reorganization transactions | | — | | — | | 8,054 | | 10,937 | | (18,991) | | — | | — | | — | | — | |
| Balance, December 31, 2021 | $ | — | | $ | 5 | | $ | 1 | | $ | 8,054 | | $ | 10,937 | | $ | — | | $ | 8,233 | | $ | 27,230 | | $ | 1,759 | | $ | 28,989 | |
| | | | | | | | | | |
| | | | | | | | | | |
| | | | | | | | | | |
| Net income attributable to Corebridge or noncontrolling interests | — | | — | | — | | — | | 8,159 | | — | | — | | 8,159 | | 320 | | 8,479 | |
| Dividends on common stock | — | | — | | — | | — | | (876) | | — | | — | | (876) | | — | | (876) | |
| Other comprehensive loss, net of tax | — | | — | | — | | — | | — | | — | | (25,096) | | (25,096) | | (10) | | (25,106) | |
| Changes in noncontrolling interests due to divestitures and acquisitions | — | | — | | — | | — | | — | | — | | — | | — | | (104) | | (104) | |
| Contributions from noncontrolling interests | — | | — | | — | | — | | — | | — | | — | | — | | 155 | | 155 | |
| Distributions to noncontrolling interests | — | | — | | — | | — | | — | | — | | — | | — | | (1,181) | | (1,181) | |
| Other | — | | — | | — | | (24) | | (13) | | — | | — | | (37) | | — | | (37) | |
| Reorganization transactions | $ | 6 | | $ | (5) | | $ | (1) | | $ | — | | $ | — | | $ | — | | $ | — | | $ | — | | $ | — | | $ | — | |
| Balance, December 31, 2022 | $ | 6 | | $ | — | | $ | — | | $ | 8,030 | | $ | 18,207 | | $ | — | | $ | (16,863) | | $ | 9,380 | | $ | 939 | | $ | 10,319 | |
See accompanying Notes to Consolidated Financial Statements.
Corebridge Financial, Inc.
Consolidated Statements of Cash Flows
| | | | | | | | | | | | | | | | | |
| Years Ended December 31, |
| (in millions) | 2022 | | 2021 | | 2020 |
| Cash flows from operating activities: | | | | | |
| Net income | $ | 8,479 | | $ | 9,172 | | $ | 866 |
| Adjustments to reconcile net income to net cash provided by operating activities: | | | | | |
| Non-cash revenues, expenses, gains and losses included in income (loss): | | | | | |
| Net (gain) loss on Fortitude Re transactions | — | | (26) | | | 20 | |
| Net (gains) losses on sales of securities available for sale and other assets | 377 | | (1,737) | | | (747) | |
| Net (gain) loss on divestitures | 1 | | (3,081) | | — |
| Loss on extinguishment of debt | — | | 219 | | 10 |
| Unrealized gains in earnings - net | 864 | | (556) | | (343) |
| Change in the fair value of market risk benefits in earnings, net | (1,481) | | (1,427) | | — |
| Equity in (income) loss from equity method investments, net of dividends or distributions | (97) | | 33 | | 70 |
| Depreciation and other amortization | 585 | | 413 | | 325 |
| Impairments of assets | 25 | | 32 | | 80 |
| General operating and other expenses | — | | 122 | | 82 |
| Changes in operating assets and liabilities: | | | | | |
| Insurance liabilities | 996 | | 1,536 | | 1,972 |
| Premiums and other receivables and payables - net | 40 | | 156 | | 575 |
| Funds held relating to Fortitude Re Reinsurance contracts | (8,497) | | (1,160) | | 2,351 |
| Reinsurance assets and funds held under reinsurance treaties | 1,086 | | 307 | | 271 |
| Capitalization of deferred policy acquisition costs | (1,059) | | (1,058) | | | (889) | |
| Current and deferred income taxes - net | 912 | | 169 | | | (1,930) | |
| Other, net | 390 | | (709) | | 614 |
| Total adjustments | (5,858) | | (6,767) | | 2,461 |
| Net cash provided by operating activities | 2,621 | | 2,405 | | 3,327 |
| Cash flows from investing activities: | | | | | |
| Proceeds from (payments for) | | | | | |
| sales or distributions of: | | | | | |
| Available-for-sale securities | 10,566 | | 10,762 | | 11,929 |
| Other securities | 2,181 | | 318 | | 405 |
| Other invested assets | 1,888 | | 4,615 | | 1,787 |
| Divestitures, net | — | | 1,084 | | — |
| Maturities of fixed maturity securities available for sale | 9,621 | | 20,420 | | 15,507 |
| Principal payments received on mortgage and other loans receivable | 7,814 | | 6,646 | | 5,961 |
| Purchases of: | | | | | |
| Available-for-sale securities | (19,499) | | (36,641) | | | (35,635) | |
| Other securities | (3,694) | | (1,591) | | | (117) | |
| Other invested assets | (1,662) | | (2,498) | | | (1,962) | |
| Mortgage and other loans receivable | (14,203) | | (7,930) | | | (5,486) | |
| Acquisition of businesses, net of cash and restricted cash acquired | (107) | | — | | — |
| Net change in short-term investments | 883 | | 3,439 | | | (1,237) | |
| Net change in derivative assets and liabilities | (754) | | (507) | | | 1,234 | |
| Other, net | (287) | | (84) | | | (295) | |
| Net cash used in investing activities | (7,253) | | (1,967) | | | (7,909) | |
| Cash flows from financing activities: | | | | | |
| Proceeds from (payments for): | | | | | |
| Policyholder contract deposits | 26,582 | | 25,443 | | 22,438 |
| Policyholder contract withdrawals | (20,722) | | (22,481) | | | (17,845) | |
| Issuance of long-term debt | 7,451 | | — | | — |
| Issuance of short-term debt | 1,512 | | 345 | | — |
| Issuance of debt of consolidated investment entities | 946 | | 4,683 | | 2,314 |
| Repayments of long-term debt | — | | (568) | | | (11) | |
| Repayments of short-term debt | (8,312) | | (248) | | | — | |
| Maturities and repayments of debt of consolidated investment entities | (1,228) | | (5,125) | | | (2,451) | |
| Dividends paid on common stock | (876) | | — | | | — | |
| | | | | |
| Distributions to Class B shareholder | — | | (34) | | | — | |
| Distributions to AIG | — | | (1,543) | | | (472) | |
| Distributions to noncontrolling interests | (477) | | (1,611) | | | (454) | |
| Contributions from noncontrolling interests | 146 | | 296 | | 317 |
| Net change in securities lending and repurchase agreements | (647) | | 9 | | 646 |
| Other, net | 299 | | 81 | | 184 |
| Net cash provided by (used in) financing activities | 4,674 | | (753) | | | 4,666 | |
| Effect of exchange rate changes on cash and restricted cash | (10) | | (2) | | 7 |
| Net increase (decrease) in cash and restricted cash | 32 | | (317) | | 91 |
| Cash and restricted cash at beginning of year | 601 | | 918 | | 827 |
| Change in cash of businesses held for sale | — | | — | | — |
| Cash and restricted cash at end of year | $ | 633 | | $ | 601 | | $ | 918 |
See accompanying Notes to Consolidated Financial Statements.
Corebridge Financial, Inc.
Consolidated Statements of Cash Flows (continued)
| | | | | | | | | | | | | | | | | |
| Supplementary Disclosure of Consolidated Cash Flow Information | | | | | |
| | | | | |
| Years Ended December 31, |
| (in millions) | 2022 | | 2021 | | 2020 |
| Cash | $ | 552 | | | $ | 537 | | | $ | 654 | |
| Restricted cash included in short-term investments* | 69 | | | 57 | | | 58 | |
| Restricted cash included in other assets* | 12 | | | 7 | | | 206 | |
Total cash and restricted cash shown in the Consolidated Statements of Cash Flows | $ | 633 | | | $ | 601 | | | $ | 918 | |
| | | | | |
| Cash paid during the period for: | | | | | |
| Interest | $ | 472 | | | $ | 364 | | | $ | 279 | |
| Taxes | 1,101 | | | 1,913 | | | 1,915 | |
| Non-cash investing activities: | | | | | |
| Fixed maturity securities, designated available for sale, received in connection with pension risk transfer transactions | (1,121) | | | (2,284) | | | (1,140) | |
| Fixed maturity securities, designated available for sale, received in connection with reinsurance transactions | (108) | | | (161) | | | (424) | |
| Fixed maturity securities, designated available for sale, transferred in connection with reinsurance transactions | 204 | | | 647 | | | 706 | |
| Corebridge distribution of AIG common stock to AIG | — | | | 38 | | | — | |
| Fixed maturity securities, designated as fair value option, transferred to repay debt of consolidated investment entities | — | | | 1,257 | | | — | |
| Fixed maturity securities, designated available for sale, transferred to repay debt of consolidated investment entities | 458 | | | 605 | | | — | |
| Investment assets transferred in conjunction with fund establishment | 19 | | | 85 | | | — | |
| Investment assets received in conjunction with fund establishment | (49) | | | (85) | | | (532) | |
| Real estate investments transferred in conjunction with fund establishment | 305 | | | — | | | — |
| Equity securities distributed in lieu of cash to non-consolidated Corebridge affiliate | 94 | | | — | | | — |
| Other invested assets securities distributed in lieu of cash to non-consolidated Corebridge affiliate | 694 | | | — | | | — |
| Minority ownership acquired in Fortitude Holdings | — | | | (100) | | | — | |
| Divestiture of certain Cap Corp legal entities | — | | | 56 | | | — | |
| Consideration received from divested businesses | — | | | 3,740 | | | — | |
| Fixed maturity securities, designated available for sale, transferred to non-consolidated Corebridge affiliate | — | | | 423 | | | — | |
| Fixed maturity securities, designated available for sale, transferred from a non-consolidated Corebridge affiliate | — | | | (423) | | | — | |
| Non-cash financing activities: | | | | | |
| Interest credited to policyholder contract deposits included in financing activities | 3,676 | | | 3,642 | | | 3,786 | |
| Fee income debited to policyholder contract deposits included in financing activities | (1,694) | | | (1,690) | | | (1,710) | |
| Equity interest in funds sold to Corebridge affiliates | — | | | — | | | 532 | |
| Repayments of debt of consolidated investment entities utilizing fixed maturity securities | (474) | | | (1,862) | | | — | |
| | | | | |
| Issuance of short-term debt by AIG | — | | | 8,300 | | | — | |
| Short-term debt forgiven by AIG | — | | | (96) | | | — | |
| Non-cash capital contributions | — | | | 728 | | | 85 | |
| Non-cash capital distributions | — | | | (12,197) | | | (44) | |
| Distribution in lieu of cash, in equity securities, to non-consolidated Corebridge affiliate | (94) | | | — | | | — | |
| Distribution in lieu of cash, in Other invested assets securities, to non-consolidated Corebridge affiliate | (694) | | | — | | | — | |
| Extinguishment of debt in exchange for partnership interest | (172) | | | — | | | — | |
| Redemption of NCI in exchange for partnership interest | (104) | | | — | | | — | |
*Primarily includes funds held for tax sharing payments to Corebridge Parent, security deposits.
See accompanying Notes to Consolidated Financial Statements.
ITEM 8 | Notes to Consolidated Financial Statements | 1. Overview and Basis of Presentation
1. Overview and Basis of Presentation
OVERVIEW
Corebridge Financial, Inc. (“Corebridge Parent”) is a leading provider of retirement solutions and life insurance products in the United States. Our primary business operations consist of life and annuity products that include term life insurance, universal life insurance, variable universal life insurance and whole life insurance, accident and health insurance, single- and flexible-premium deferred fixed and variable annuities, fixed index deferred annuities, single-premium immediate and delayed-income annuities, group annuities, private placement variable annuities, structured settlements, corporate- and bank-owned life insurance, guaranteed investment contracts (‘‘GICs’’) funding agreements, stable value wrap products and pension risk transfer. Our institutional asset management business includes managing assets for non-consolidated affiliates. Corebridge Parent common stock, par value $0.01 per share, is listed on the New York Stock Exchange (NYSE:CRBG). The terms “Corebridge,” “we,” “us,” “our” or the “Company” mean Corebridge Parent and its consolidated or combined subsidiaries, unless the context refers to Corebridge Parent only.
These financial statements present the consolidated and combined results of operations, financial condition and cash flows of the Company. On September 19, 2022, we completed an initial public offering (the “IPO”) in which American International Group, Inc. (“AIG Parent”) sold 80,000,000 shares of Corebridge Parent common stock to the public. As of December 31, 2022, AIG owns 77.7% of the outstanding common stock of Corebridge Parent. AIG Parent is a publicly traded entity, listed on the New York Stock Exchange (NYSE:AIG). The term “AIG” means AIG Parent and its consolidated subsidiaries, unless the context refers to AIG Parent only.
Prior to the IPO, we underwent a reorganization (the “Reorganization”) to ensure that we held all of AIG’s life and retirement business and substantially all of its investment management operations. The Reorganization was completed on December 31, 2021. As of December 31, 2022, subsidiaries of Corebridge Parent include: AGC Life Insurance Company (“AGC”), American General Life Insurance Company (“AGL”), The Variable Annuity Life Insurance Company (“VALIC”), The United States Life Insurance Company in the City of New York (“USL”), AIG Life of Bermuda, Ltd. (“AIG Bermuda”), AIG Life Ltd. (“AIG Life (United Kingdom)”) and its subsidiary, Laya Healthcare Ltd. (“Laya”), and SAFG Capital LLC and its subsidiaries.
These financial statements include the results of Corebridge Parent, its controlled subsidiaries (generally through a greater than 50% ownership of voting rights and voting interests) and variable interest entities (“VIEs”) of which we are the primary beneficiary. Equity investments in entities that we do not consolidate, including corporate entities in which we have significant influence and partnership and partnership-like entities in which we have more than minor influence over the operating and financial policies, are accounted for under the equity method unless we have elected the fair value option.
We adopted the Financial Accounting Standards Board’s (the “FASB”) targeted improvements to the accounting for long-duration contracts (the “standard” or “LDTI”) on January 1, 2023 with a transition date of January 1, 2021 (“the transition date”). In accordance with the transition guidance in the standard, we have updated our Consolidated Financial Statements for the periods ended December 31, 2022 and 2021, and for the years ending December 31, 2022 and 2021 presented herein to reflect LDTI. For additional detail, see Note 2 to our audited annual consolidated financial statements.
BASIS OF PRESENTATION
The financial statements presented for periods on or after December 31, 2021, the date on which the Reorganization was completed, are presented on a consolidated basis, and include the financial position, results of operations and cash flows of the Company. The financial statements for the periods prior to December 31, 2021 are presented on a combined basis, and reflect the historical combined financial position, results of operations and cash flows of Corebridge, AIG Capital Corporation (“Cap Corp”), AIG Life (United Kingdom) and Laya, as the operations were under common control of AIG and reflect the historical combined financial position, results of operations and cash flows of those legal entities.
The Reorganization, completed on December 31, 2021, included the contribution of various subsidiaries of AIG into Corebridge. AIG Life (UK) was contributed to Corebridge on May 1, 2021. Effective May 1, 2021, Corebridge subscribed for an ordinary share in Laya, and Laya redeemed the only other share then in issue which was held by AIG, resulting in Corebridge being the sole shareholder of Laya. The annual consolidated financial statements as of December 31, 2021 included the results of operations, financial condition and cash flows of Laya and AIG Life Ltd. Accordingly, the contribution of these entities to Corebridge did not result in the need to restate prior periods in accordance with the accounting treatment for common control transactions.
On October 1, 2021, two Cap Corp subsidiaries were sold to a Corebridge affiliate. On October 29, 2021, a Cap Corp subsidiary was sold to a Corebridge affiliate. On December 31, 2021, certain direct and indirect subsidiaries of Cap Corp were transferred to a newly created holding company and subsidiary of Cap Corp, SAFG Capital LLC (‘‘SAFG Capital’’). On December 31, 2021, Cap Corp’s interest in SAFG Capital was distributed from Cap Corp to AIG and AIG subsequently contributed its interest to Corebridge. Cap Corp and certain of its subsidiaries remain consolidated subsidiaries of AIG. The contribution of SAFG Capital to the Company was treated as a common control transaction with the Company being the receiving entity, and the subsidiaries not contributed were treated as common control transactions with the Company being the transferring entity, both during the year ended December 31, 2021.
ITEM 8 | Notes to Consolidated Financial Statements | 1. Overview and Basis of Presentation
In connection with the Reorganization, we and AIG entered into agreements under which we purchased AIG Technologies, Inc. (“AIGT”) and Eastgreen, Inc. (“Eastgreen”) from AIG on February 28, 2022 for total consideration of $107 million. AIGT provides data processing, technology and infrastructure services to Corebridge and AIG entities in the United States, including management of AIG hardware and networks. AIGT utilizes two data centers to provide its services. The real estate related to the two data centers is owned by Eastgreen. To the extent needed, AIGT will continue to provide services to AIG for a transition period.
The accompanying financial statements have been prepared in accordance with accounting principles generally accepted in the United States (‘‘GAAP’’). All material intercompany accounts and transactions between consolidated or combined entities have been eliminated. The balance sheet as of December 31, 2021 includes the attribution of certain assets and liabilities that have historically been held at AIG or certain of its subsidiaries not included in the historically combined Corebridge financial statements. Similarly, certain assets attributable to shared services managed at AIG have been excluded. The Company’s consolidated financial statements reflect certain corporate expenses allocated to the Company by AIG for certain corporate functions and for shared services provided by AIG. These expenses have been allocated to the Company based on direct usage or benefit where specifically identifiable, with the remainder allocated based upon other reasonable allocation measures. The Company considers the expense methodology and results to be reasonable for all periods presented.
Our historical financial results included in the Company’s financial statements do not necessarily reflect the financial condition, results of operations or cash flows we would have achieved as a stand-alone company during the periods presented or those we will achieve in the future. The Company has recorded affiliated transactions with certain AIG subsidiaries that are not subsidiaries of Corebridge which have not been eliminated in the consolidated or combined financial statements of the Company. The accompanying financial statements reflect all normal recurring adjustments, including eliminations of material intercompany accounts and transactions, necessary in the opinion of management for a fair statement of our financial position, results of operations and cash flows for the periods presented.
SIGNIFICANT TRANSACTIONS
Strategic Partnership with Blackstone
On November 2, 2021, Argon Holdco LLC (“Argon”), a wholly owned subsidiary of Blackstone, Inc. (“Blackstone”), acquired a 9.9% equity stake in Corebridge and Corebridge entered into a long-term asset management relationship with Blackstone.
Pursuant to the partnership, we initially transferred management of $50 billion of our existing investment portfolio. Beginning in the fourth quarter of 2022, we transferred an additional $2.1 billion to Blackstone. The amount managed by Blackstone will increase to $92.5 billion by the third quarter of 2027. As of December 31, 2022, the book value of the assets managed by Blackstone was $48.9 billion.
Pursuant to the Stockholders’ Agreement that we entered into with AIG Parent and Argon at the time of acquisition of Argon’s equity stake in Corebridge, Argon may not sell its ownership interest in Corebridge, subject to certain exceptions. These exceptions, among others, permit Argon to sell 25%, 67% and 75% of its shares after the first, second and third anniversaries, respectively, of the IPO, with the transfer restrictions terminating in full on the fifth anniversary of the IPO. Additionally, until Argon no longer owns at least 50% of its initial investment in Corebridge, it will have the right to designate for nomination for election one member of the Corebridge board of directors.
On November 1, 2021, Corebridge Parent declared a dividend payable to AIG in the amount of $8.3 billion. In connection with that dividend, Corebridge Parent issued a promissory note to AIG Parent in the amount of $8.3 billion. The promissory note to AIG Parent was paid in full during 2022.
On December 15, 2021, Corebridge and Blackstone Real Estate Income Trust (“BREIT”), a long-term, perpetual capital vehicle affiliated with Blackstone, completed the acquisition by BREIT of Corebridge’s interests in a U.S. affordable housing portfolio for $4.9 billion, in an all cash transaction, subject to certain adjustments, resulting in a pre-tax gain of $3.0 billion.
Sale of Certain Assets of Our Retail Mutual Funds Business
On February 8, 2021, we announced the execution of a definitive agreement with Touchstone Investments, Inc. (“Touchstone”), an indirect wholly owned subsidiary of Western & Southern Financial Group, to sell certain assets of our retail mutual funds business. This sale consisted of the reorganization of twelve of the retail mutual funds managed by our subsidiary SunAmerica Asset Management, LLC (“SAAMCo”) into certain Touchstone funds. The transaction closed on July 16, 2021, at which time we received initial proceeds and recognized a gain on the sale of $103 million. Concurrently, the twelve retail mutual funds managed by SAAMCo, with $6.8 billion in assets, were reorganized into Touchstone funds. Additional consideration has been and may be earned over a three-year period based on asset levels in certain reorganized funds. Six retail mutual funds managed by SAAMCo and not included in the transaction were liquidated. We continue to retain our fund management platform and capabilities dedicated to our variable annuity insurance products.
ITEM 8 | Notes to Consolidated Financial Statements | 1. Overview and Basis of Presentation
FORTITUDE HOLDINGS
Reinsurance agreements
AIG established Fortitude Reinsurance Company, Ltd. (‘‘Fortitude Re’’), a wholly owned subsidiary of Fortitude Group Holdings, LLC (‘‘Fortitude Holdings’’), in 2018 in a series of reinsurance transactions related to certain of AIG’s legacy operations. In February 2018, AGL, VALIC, and USL entered into modified coinsurance (‘‘modco’’) agreements with Fortitude Re, a registered Class 4 and Class E reinsurer in Bermuda. As these reinsurance transactions are structured as modco, Corebridge continues to reflect the invested assets, which consist mostly of available for sale securities, supporting Fortitude Re’s obligations, in Corebridge’s financial statements. Additionally, AIG Bermuda novated its assumption of certain long-duration contracts from an affiliated entity to Fortitude Re.
On July 1, 2020, AGL and USL amended the modco agreements. Under the terms of the amendment, certain business ceded to Fortitude Re was recaptured by the Company and certain additional business was ceded by the Company to Fortitude Re. We recorded an additional $91 million loss associated with this amendment.
Sale of Fortitude Holdings by AIG
In November 2018, AIG sold a 19.9% ownership interest in Fortitude Holdings to TC Group Cayman Investments Holdings, L.P. (‘‘TCG’’), an affiliate of Carlyle. On June 2, 2020, AIG completed the sale of a majority of the interests in Fortitude Holdings to Carlyle FRL, L.P. (‘‘Carlyle FRL’’), an investment fund advised by an affiliate of The Carlyle Group Inc. (‘‘Carlyle’’), and T&D United Capital Co., Ltd. (‘‘T&D’’), a subsidiary of T&D Holdings, Inc., under the terms of a membership interest purchase agreement entered into on November 25, 2019 by and among AIG, Fortitude Holdings, Carlyle FRL, Carlyle, T&D and T&D Holdings, Inc. (the ‘‘Majority Interest Fortitude Sale’’). As a result of completion of the Majority Interest Fortitude Sale, Carlyle FRL purchased from AIG a 51.6% ownership interest in Fortitude Holdings and T&D purchased from AIG a 25% ownership interest in Fortitude Holdings; AIG retained a 3.5% ownership interest in Fortitude Holdings and one seat on its Board of Managers. On October 1, 2021, AIG, Inc. contributed its remaining 3.5% ownership interest in Fortitude Group Holdings, LLC to Corebridge.
As of December 31, 2022, and 2021, respectively, approximately $26.8 billion and $34.1 billion of liabilities related to business written by Corebridge, had been ceded to Fortitude Re under these reinsurance transactions. As of closing of the Majority Interest Fortitude Sale, these reinsurance transactions are no longer considered affiliated transactions.
Following closing of the Majority Interest Fortitude Sale in the second quarter of 2020, AIG contributed $135 million of its proceeds from the Majority Interest Fortitude Sale to USL.
For further details on this transaction see Note 7.
USE OF ESTIMATES
The preparation of financial statements in accordance with GAAP requires the application of accounting policies that often involve a significant degree of judgment. Accounting policies that we believe are most dependent on the application of estimates and assumptions are considered our critical accounting estimates and are related to the determination of:
•fair value measurements of certain financial assets and liabilities;
•valuation of market risk benefits (“MRBs”) related to guaranteed benefit features of variable annuity products, fixed annuity products and fixed index annuity products;
•valuation of embedded derivative liabilities for fixed index annuity and index universal life products;
•valuation of future policy benefit liabilities and recognition of remeasurement gains and losses;
•reinsurance assets, including the allowance for credit losses;
•goodwill impairment;
•allowance for credit losses primarily on loans and available for sale fixed maturity securities;
•income tax assets and liabilities, including recoverability of our net deferred tax asset and the predictability of future tax operating profitability of the character necessary to realize the net deferred tax asset.
•prior to the adoption of LDTI, valuation of liabilities for guaranteed benefit features of variable annuity products, fixed annuity and fixed index annuity products, including the valuation of embedded derivatives;
•prior to the adoption of LDTI, estimated gross profits to value DAC and URR for investment-oriented products, such as universal life insurance, variable and fixed annuities, and fixed index annuities; and
•prior to the adoption of LDTI, valuation of future policy benefit liabilities and timing and extent of loss recognition;
These accounting estimates require the use of assumptions about matters, some of which are highly uncertain at the time of estimation. To the extent actual experience differs from the assumptions used, our consolidated financial condition, results of operations and cash flows could be materially affected.
ITEM 8 | Notes to Consolidated Financial Statements | 2. Summary of Significant Accounting Policies
2. Summary of Significant Accounting Policies The following list identifies our significant accounting policies presented in other Notes to these Consolidated Financial Statements, with a reference to the Note where a detailed description can be found:
Note 5. Investments
•Fixed maturity and equity securities
•Other invested assets
•Short-term investments
•Net investment income
•Net realized gains (losses)
•Allowance for credit losses/Other-than-temporary impairments
Note 6. Lending Activities
•Mortgage and other loans receivable – net of allowance
Note 7. Reinsurance
•Reinsurance assets – net of allowance
Note 8. Deferred Policy Acquisition Costs
•Deferred policy acquisition costs
•Value of business acquired
•Deferred sales inducements
•Amortization of deferred policy acquisition costs
•Non-deferrable insurance commissions
Note 9. Variable Interest Entities
Note 10. Derivatives and Hedge Accounting
•Derivative assets and liabilities, at fair value
Note 11. Goodwill and Other Intangible Assets
Note 12. Insurance Liabilities
•Future policy benefits
•Policyholder contract deposits
•Other policyholder funds
Note 13. Market Risk Benefits
Note 14. Separate Account Assets and Liabilities
Note 15. Debt
•Short-term and Long-term debt
•Debt of consolidated investment entities
Note 16. Contingencies, Commitments and Guarantees
•Legal contingencies
Note 18. Earnings Per Common Share
Note 22. Income Taxes
ITEM 8 | Notes to Consolidated Financial Statements | 2. Summary of Significant Accounting Policies
OTHER SIGNIFICANT ACCOUNTING POLICIES
Insurance revenues include premiums and policy fees. All premiums and policy fees are presented net of reinsurance, as applicable. Premiums from long-duration life products, other than universal and variable life contracts, are recognized as revenues when due. Premiums from individual and group annuity contracts that are life contingent are recognized as revenues when due.
For limited payment contracts, premiums are due over a significantly shorter period than the period over which benefits are provided. Prior to the adoption of LDTI effective on January 1, 2021, the difference between the gross premium received and the net premium was deferred and recognized in premiums in a constant relationship to insurance in-force, or for annuities, the amount of expected future policy benefits. This Deferred Profit Liability (“DPL”) was recorded in the Consolidated Balance Sheets in Other policyholder funds. After January 1, 2021, the difference between the gross premium received and recorded as revenue and the net premium is deferred and recognized in Policyholder benefits in a constant relationship to insurance in-force, or for annuities, the amount of expected future policy benefits. This DPL is recorded in the Consolidated Balance Sheets in Future policy benefits for life and accident and health insurance contracts.
Premiums on short-duration accident and health policies are earned primarily on a pro rata basis over the term of the related coverage. The reserve for unearned premiums includes the portion of premiums written relating to the unexpired terms of coverage. This unearned revenue reserve (“URR”) is recorded in the Consolidated Balance Sheets in Other policyholder funds.
Prior to the adoption of LDTI effective on January 1, 2021, reinsurance premiums ceded under yearly renewable term (“YRT”) reinsurance agreements were recognized as a reduction in revenues over the period the reinsurance coverage was utilized in proportion to the risks to which the premiums relate, while premiums ceded under modified coinsurance (“modco”) treaties were recognized when due. After January 1, 2021, all reinsurance premiums ceded are recognized when due, following a ceded net premium ratio (“NPR”) methodology that also accrues a proportionate amount of estimated benefits.
Reinsurance premiums for assumed business are estimated based on information received from ceding companies and reinsurers. Any subsequent differences that arise regarding such estimates are recorded in the periods in which they are determined.
Amounts received as payment for investment-oriented contracts such as universal life, variable annuities, fixed annuities, and fixed index annuities, are reported as deposits to Policyholder contract deposits or Separate account liabilities, as applicable. Revenues from these contracts are recorded in policy fees and consist of policy charges for the cost of insurance, policy administration charges, surrender charges and amortization of URR. Policy fees are recognized as revenues in the period in which they are assessed against policyholders, unless the fees are designed to compensate Corebridge for services to be provided in the future. Prior to the adoption of LDTI effective on January 1, 2021, fees deferred as unearned revenue were amortized in relation to the incidence of estimated gross profits (“EGPs”) to be realized over the estimated lives of the contracts. After January 1, 2021, fees deferred as unearned revenue are amortized on a constant level basis over the estimated lives of the contracts, consistent with the amortization of deferred acquisition costs. This URR is recorded in the Consolidated Balance Sheets in Other policyholder funds.
Advisory fee income includes fees from registered investment services.
Other income includes 12b-1 fees (i.e. marketing and distribution fee income), other asset management fee income, and commission-based broker dealer services.
Advisory fee expense includes primarily sub-advisory fee expenses.
Cash represents cash on hand and demand deposits.
Short-term investments include highly liquid securities and other investments with remaining maturities of one year or less, but greater than three months, at the time of purchase. Securities included within short-term investments are stated at estimated fair value, while other investments included within short-term investments are stated at amortized cost, which approximates estimated fair value.
Premiums and other receivables – net of allowance include premium balances receivable, amounts due from agents and brokers and policyholders, and other receivables.
Other assets consist of deferred sales inducement assets, prepaid expenses, deposits, other deferred charges, other fixed assets, capitalized software costs, goodwill, intangible assets other than goodwill, restricted cash and derivative assets.
Capitalized software costs represent costs directly related to obtaining, developing or upgrading internal use software, are capitalized and amortized using the straight-line method over a period generally not exceeding ten years.
Real estate includes the cost of buildings and furniture and fixtures which is depreciated principally using the straight-line basis over their estimated useful lives (maximum of 40 years for buildings, 10 years for furniture and fixtures and 5 years for office equipment). Expenditures for maintenance and repairs are charged to income as incurred and expenditures for improvements are capitalized and depreciated. We periodically assess the carrying amount of our real estate for purposes of determining any asset impairment.
ITEM 8 | Notes to Consolidated Financial Statements | 2. Summary of Significant Accounting Policies
Separate accounts represent funds for which investment income and investment gains and losses accrue directly to the policyholders who bear the investment risk. Each account has specific investment objectives and the assets are carried at fair value. The assets of each account are legally segregated and are not subject to claims that arise from any of our other businesses. The liabilities for these accounts are equal to the account assets. Separate accounts may also include deposits for funds held under stable value wrap funding agreements, although the majority of stable value wrap sales are measured based on the notional amount included in assets under management and do not include the receipt of funds.
For a more detailed discussion of separate accounts, see Note 12.
Other liabilities consist of other funds on deposit, other payables, securities sold under agreements to repurchase, securities sold but not yet purchased and derivative liabilities.
Securities sold but not yet purchased represent sales of securities not owned at the time of sale. The obligations arising from such transactions are recorded on a trade-date basis and carried at fair value. Fair values of securities sold but not yet purchased are based on current market prices.
Foreign currency: Financial statement accounts expressed in foreign currencies are translated into U.S. dollars. Functional currency assets and liabilities are translated into U.S. dollars generally using rates of exchange prevailing at the balance sheet date of each respective subsidiary and the related translation adjustments are recorded as a separate component of Accumulated other comprehensive income, net of any related taxes, in Shareholders’ Equity. Income statement accounts expressed in functional currencies are translated using average exchange rates during the period. Functional currencies are generally the currencies of the local operating environment. Financial statement accounts expressed in currencies other than the functional currency of a consolidated entity are remeasured into that entity’s functional currency resulting in exchange gains or losses recorded in income, except for remeasurement gains or losses attributable to available-for-sale securities which are included in Accumulated other comprehensive income (“AOCI”).
Non-redeemable noncontrolling interest is the portion of equity (net assets) and net income (loss) in a subsidiary not attributable, directly or indirectly, to Corebridge.
Redeemable noncontrolling interest represents noncontrolling interest holders in certain consolidated investment entities where the noncontrolling interest holder has the ability to redeem its interest in the consolidated investment entity at its option.
ACCOUNTING STANDARDS ADOPTED DURING 2022
Reference Rate Reform
In March 2020, the FASB issued an accounting standard that provides temporary optional guidance to ease the potential burden in accounting for reference rate reform. The standard allows us to account for certain contract modifications that result from the discontinuation of the London Interbank Offered Rate (“LIBOR”) or another reference rate as a continuation of the existing contract without additional analysis. This standard was set to expire on December 31, 2022, but was extended to December 31, 2024, after which application of the guidance will no longer be permitted. During this period, this standard may be elected and applied prospectively as reference reforms occur.
Where permitted by the guidance, we have accounted for contract modifications stemming from the discontinuation of LIBOR or another reference rate as a continuation of the existing contract. As part of our implementation efforts, we have and will continue to assess our operational readiness and current and alternative reference rates’ merits, limitations, risks and suitability for our investment and insurance processes. The adoption of the standard has not had, and is not expected to have, a material impact on our reported consolidated financial condition, results of operations, cash flows and required disclosures.
ADOPTION OF LONG DURATION TARGETED IMPROVEMENTS
Targeted Improvements to the Accounting for Long-Duration Contracts
In August 2018, the FASB issued an accounting standard update with the objective of making targeted improvements to the existing recognition, measurement, presentation and disclosure requirements for long-duration contracts issued by an insurance entity.
The Company adopted the standard on January 1, 2023 using the modified retrospective transition method relating to liabilities for traditional and limited payment contracts and deferred policy acquisition costs. The Company also adopted the standard in relation to MRBs on a full retrospective basis. As of the January 1, 2021 transition date, the impact of the adoption of the standard was a net decrease to beginning Accumulated other comprehensive income (loss) (“AOCI”) of $2.3 billion and a net increase to beginning Shareholders’ net investment of $1.2 billion primarily driven by (1) changes related to MRBs in our Individual Retirement and Group Retirement segments, including the impact of non-performance risk adjustments which reclassified the portion of the changes in fair value attributable to non-performance risk from Shareholders' net investment to AOCI, (2) changes to the discount rate used to measure the liability for future policy benefits which most significantly impacted our Life Insurance and Institutional Markets segments, and (3) the removal of balances recorded in AOCI related to changes in unrealized appreciation (depreciation) on investments. The
ITEM 8 | Notes to Consolidated Financial Statements | 2. Summary of Significant Accounting Policies
consolidated financial statements as of and for the years ended December 31, 2022 and 2021 have been adjusted to reflect the effects of applying the standard.
The accounting for Fortitude Re reinsurance assets, including the discount rates, continued to be calculated using the same methodology and assumptions as the direct policies, and therefore have been recalculated on an LDTI basis. The accounting for reinsurance transactions between the Company and Fortitude Re structured as modco remained unchanged.
Market risk benefits: The standard requires the measurement of all MRBs (e.g., living benefit and death benefit guarantees associated with variable annuities) associated with deposit (or account balance) contracts at fair value at each reporting period. Changes in fair value compared to prior periods are recorded and presented separately within the income statement, with the exception of our own credit risk changes (non-performance adjustments), which are recognized in Other comprehensive income (loss) (“OCI”). MRBs impacted both Shareholders’ net investment and AOCI upon transition.
The accounting for MRBs primarily impacted our Individual Retirement and Group Retirement segments. For additional disclosures about MRBs, see Note 13.
Discount rate assumption: The standard requires the discount rate assumption for the liability for future policy benefits to be updated at the end of each reporting period using an upper-medium grade (low credit risk) fixed income instrument yield that maximizes the use of observable market inputs. Upon transition, the Company had an adjustment to AOCI due to the fact that the market upper-medium grade (low credit risk) interest rates as of the transition date differed from reserve interest accretion rates.
Following adoption of the standard, the impact of changes to discount rates are recognized through OCI. Changes resulting from updating the discount rate each reporting period primarily impact term life insurance and other traditional life insurance products, as well as pension risk transfer (“PRT”) and structured settlement products. For additional information on the discount rate assumption under accounting for Long-Duration Contracts Standard, see Note 12.
Removal of balances related to changes in unrealized appreciation (depreciation) on investments: Under the standard, the majority of balances recorded in AOCI related to changes in unrealized appreciation (depreciation) on investments were eliminated.
In addition to the above, the standard also:
•Requires the review and, if necessary, update of future policy benefit assumptions at least annually for traditional and limited pay long duration contracts, with the recognition and parenthetical presentation of any resulting re-measurement gain or loss in Policyholder benefits (except for discount rate changes as noted above) in the Consolidated Statements of Income (Loss). For additional information, see Note 13.
•Simplifies the amortization of DAC to a constant level basis over the expected term of the related contracts and no longer requires an impairment test. For additional information, see Note 8.
•Increases disclosures of disaggregated rollforwards of several balances, including but not limited to liabilities for future policy benefits, deferred acquisition costs, account balances, MRBs, separate account liabilities and information about significant inputs, judgments and methods used in measurement and changes thereto and impact of those changes.
ITEM 8 | Notes to Consolidated Financial Statements | 2. Summary of Significant Accounting Policies
The following table presents the impacts in connection with the adoption of LDTI, effective as of January 1, 2021 as well as cross references to the applicable notes herein for additional information: | | | | | | | | | | | | | | | | | | | | |
| | Balance, Beginning of Year
| | Cumulative Effect Adjustment as of January 1, 2021 | | Updated balances post-adoption of LDTI |
| (in millions) | | | |
| | | | | | |
| | | | | | |
Reinsurance assets - Fortitude Re, net of allowance for credit losses and disputes(a) | | $ | 29,158 | | | $ | 7,666 | | | $ | 36,824 | |
Reinsurance assets - other, net of allowance for credit losses and disputes(a) | | 2,707 | | | 433 | | | 3,140 | |
| Deferred income taxes | | 3,640 | | | 310 | | | 3,950 | |
Deferred policy acquisition costs and value of business acquired(b) | | 7,363 | | | 3,137 | | | 10,500 | |
Market risk benefit assets(c) | | — | | | 338 | | | 338 | |
Other assets(d) | | 3,428 | | | 396 | | | 3,824 | |
| Total assets | | $ | 410,155 | | | $ | 12,280 | | | $ | 422,435 | |
Future policy benefits for life and accident and health insurance(e) | | $ | 54,660 | | | $ | 10,522 | | | $ | 65,182 | |
Policyholder contract deposits(e) | | 154,892 | | | (6,471) | | | 148,421 | |
Market risk benefit liabilities(c) | | — | | | 8,739 | | | 8,739 | |
Other policyholder funds(f) | | 2,492 | | | 248 | | | 2,740 | |
Other liabilities(g) | | 9,954 | | | 399 | | | 10,353 | |
| Total liabilities | | $ | 370,323 | | | $ | 13,437 | | | $ | 383,760 | |
Shareholders’ net investment(h) | | $ | 22,579 | | | $ | 1,192 | | | $ | 23,771 | |
Accumulated other comprehensive income(h) | | 14,653 | | | (2,349) | | | 12,304 | |
| Total Corebridge Shareholders' net investment | | 37,232 | | | (1,157) | | | 36,075 | |
| Total equity | | 39,781 | | | (1,157) | | | 38,624 | |
| Total liabilities, redeemable noncontrolling interest and shareholder’s net investment | | $ | 410,155 | | | $ | 12,280 | | | $ | 422,435 | |
(a) Refer to Note 7 for additional information on the transition impacts associated with LDTI.
(b) Refer to Note 8 for additional information on the transition impacts associated with LDTI.
(c) Refer to Note 13 for additional information on the transition impacts associated with LDTI.
(d) Other assets include deferred sales inducement assets. Refer to Note 8 for additional information on the transition impacts associated with LDTI.
(e) Refer to Note 12 for additional information on the transition impacts associated with LDTI.
(f) Other policyholder funds include URR. Refer to Note 12 for additional information on the transition impacts associated with LDTI.
(g) Other liabilities include deferred cost of reinsurance liabilities. Refer to Note 7 for additional information on the transition impacts associated with LDTI.
(h) Includes a correction of $158 million to increase shareholders' net investment and decrease AOCI.
The following table presents the impacts in connection with the adoption of LDTI, effective as of January 1, 2021 on our previously reported Consolidated Balance Sheets as of December 31, 2022 and 2021: | | | | | | | | | | | | | | | | | | | | |
| December 31, 2022 | | As Previously Reported | | Effect of Change | | Updated balances post-adoption of LDTI |
| (in millions) | | | |
| | | | | | |
| | | | | | |
| Reinsurance assets - Fortitude Re, net of allowance for credit losses and disputes | | $ | 27,794 | | | $ | (950) | | | $ | 26,844 | |
| Reinsurance assets - other, net of allowance for credit losses and disputes | | 2,980 | | | (463) | | | 2,517 | |
| Deferred income taxes | | 9,162 | | | (331) | | | 8,831 | |
| Deferred policy acquisition costs and value of business acquired | | 13,179 | | | (2,616) | | | 10,563 | |
| Market risk benefit assets | | — | | | 796 | | | 796 | |
| Other assets | | 2,852 | | | (331) | | | 2,521 | |
| Total assets | | $ | 364,217 | | | $ | (3,895) | | | $ | 360,322 | |
| Future policy benefits for life and accident and health insurance | | $ | 57,266 | | | $ | (6,748) | | | $ | 50,518 | |
| Policyholder contract deposits | | 158,966 | | | (2,908) | | | 156,058 | |
| Market risk benefits liabilities | | — | | | 4,736 | | | 4,736 | |
| Other policyholder funds | | 3,331 | | | (446) | | | 2,885 | |
| Other liabilities | | 8,775 | | | 301 | | | 9,076 | |
| Total liabilities | | $ | 355,068 | | | $ | (5,065) | | | $ | 350,003 | |
| Retained earnings | | $ | 16,121 | | | $ | 2,086 | | | $ | 18,207 | |
| Accumulated other comprehensive income | | (15,947) | | | (916) | | | (16,863) | |
| Total Corebridge Shareholders' equity | | 8,210 | | | 1,170 | | | 9,380 | |
| Total equity | | 9,149 | | | 1,170 | | | 10,319 | |
Total liabilities, redeemable noncontrolling interest and equity | | $ | 364,217 | | | $ | (3,895) | | | $ | 360,322 | |
ITEM 8 | Notes to Consolidated Financial Statements | 2. Summary of Significant Accounting Policies
| | | | | | | | | | | | | | | | | | | | |
| December 31, 2021 | | As Previously Reported | | Effect of Change | | Updated balances post-adoption of LDTI |
| (in millions) | | | |
| | | | | | |
| | | | | | |
| Reinsurance assets - Fortitude Re, net of allowance for credit losses and disputes | | $ | 28,472 | | | $ | 5,630 | | | $ | 34,102 | |
| Reinsurance assets - other, net of allowance for credit losses and disputes | | 2,932 | | | 169 | | | 3,101 | |
| Deferred income taxes | | 4,837 | | | (41) | | | 4,796 | |
| Deferred policy acquisition costs and value of business acquired | | 8,058 | | | 2,540 | | | 10,598 | |
| Market risk benefit assets | | — | | | 610 | | | 610 | |
| Other assets | | 3,303 | | | 311 | | | 3,614 | |
| Total assets | | 416,212 | | | 9,219 | | | 425,431 | |
| Future policy benefits for life and accident and health insurance | | 57,751 | | | 6,519 | | | 64,270 | |
| Policyholder contract deposits | | 156,846 | | | (5,301) | | | 151,545 | |
| Market risk benefits liabilities | | — | | | 7,499 | | | 7,499 | |
| Other policyholder funds | | 2,849 | | | 30 | | | 2,879 | |
| Other liabilities | | 9,903 | | | 328 | | | 10,231 | |
| Total liabilities | | 387,284 | | | 9,075 | | | 396,359 | |
| Retained earnings | | 8,859 | | | 2,078 | | | 10,937 | |
| Accumulated other comprehensive income | | 10,167 | | | (1,934) | | | 8,233 | |
| Total Corebridge Shareholders' equity | | 27,086 | | | 144 | | | 27,230 | |
| Total equity | | 28,845 | | | 144 | | | 28,989 | |
Total liabilities, redeemable noncontrolling interest and equity | | $ | 416,212 | | | $ | 9,219 | | | $ | 425,431 | |
The following table presents the impacts in connection with the adoption of LDTI on our previously reported Consolidated Statements of Income (Loss) for the years ended December 31, 2022 and 2021:
| | | | | | | | | | | | | | | | | | | | |
| December 31, 2022 | | As Previously Reported | | Effect of Change | | Updated balances post-adoption of LDTI |
| (in millions, except per common share data) | | | |
| | | | | | |
| Premiums | | $ | 5,093 | | | $ | (2) | | | $ | 5,091 | |
| Policy fees | | 2,972 | | | (58) | | | 2,914 | |
| Total net realized gains (losses) | | 8,013 | | | (1,922) | | | 6,091 | |
| Total revenues | | 26,679 | | | (1,982) | | | 24,697 | |
| Benefits and expenses: | | | | | | |
| Policyholder benefits | | 7,332 | | | (612) | | | 6,720 | |
| Change in the fair value of market risk benefits, net | | — | | | (958) | | | (958) | |
| Interest credited to policyholder account balances | | 3,696 | | | 36 | | | 3,732 | |
| Amortization of deferred acquisition costs and value of business acquired | | 1,431 | | | (411) | | | 1,020 | |
| Non-deferrable insurance commissions | | 636 | | | (68) | | | 568 | |
| | | | | | |
| Total benefits and expenses | | 16,219 | | | (2,013) | | | 14,206 | |
| Income (loss) before income tax expense (benefit) | | 10,460 | | | 31 | | | 10,491 | |
| Income tax expense (benefit): | | 1,991 | | | 21 | | | 2,012 | |
| Net income (loss) | | 8,469 | | | 10 | | | 8,479 | |
| Net income (loss) attributable to Corebridge | | $ | 8,149 | | | 10 | | | $ | 8,159 | |
| Income (loss) per common share attributable to Corebridge common shareholders: | | | | | | |
| Common stock - Basic | | $ | 12.61 | | | $ | 0.02 | | | $ | 12.63 | |
| Common stock - Diluted | | $ | 12.59 | | | $ | 0.01 | | | $ | 12.60 | |
ITEM 8 | Notes to Consolidated Financial Statements | 2. Summary of Significant Accounting Policies
| | | | | | | | | | | | | | | | | | | | |
| December 31, 2021 | | As Previously Reported | | Effect of Change | | Updated balances post-adoption of LDTI |
| (in millions, except per common share data) | | | |
| | | | | | |
| Premiums | | $ | 5,637 | | | $ | 16 | | | $ | 5,653 | |
| Policy fees | | 3,051 | | | (46) | | | 3,005 | |
| Total net realized gains (losses) | | 1,855 | | | (103) | | | 1,752 | |
| Total revenues | | 23,390 | | | (133) | | | 23,257 | |
| Benefits and expenses: | | | | | | |
| | | | | | |
| | | | | | |
| | | | | | |
| Policyholder benefits | | 8,050 | | | (663) | | | 7,387 | |
| Change in the fair value of market risk benefits, net | | — | | | (447) | | | (447) | |
| Interest credited to policyholder account balances | | 3,549 | | | 13 | | | 3,562 | |
| Amortization of deferred acquisition costs and value of business acquired | | 1,057 | | | (106) | | | 951 | |
| Non-deferrable insurance commissions | | 680 | | | (57) | | | 623 | |
| | | | | | |
| Total benefits and expenses | | 13,263 | | | (1,260) | | | 12,003 | |
| Income (loss) before income tax expense (benefit) | | 10,127 | | | 1,127 | | | 11,254 | |
| Income tax expense (benefit): | | 1,843 | | | 239 | | | 2,082 | |
| Net income (loss) | | 8,284 | | | 888 | | | 9,172 | |
| Net income (loss) attributable to Corebridge | | $ | 7,355 | | | $ | 888 | | | $ | 8,243 | |
| Income (loss) per common share attributable to Corebridge common shareholders: | | | | | | |
| | | | | | |
| | | | | | |
| Basic: | | | | | | |
| Common stock Class A | | $ | 11.80 | | | $ | 1.38 | | | $ | 13.18 | |
| Common stock Class B | | $ | 7.77 | | | $ | 1.37 | | | $ | 9.14 | |
| Diluted: | | | | | | |
| Common stock Class A | | $ | 11.80 | | | $ | 1.38 | | | $ | 13.18 | |
| Common stock Class B | | $ | 7.77 | | | $ | 1.37 | | | $ | 9.14 | |
The following table presents the impacts in connection with the adoption of LDTI on our previously reported Consolidated Statements of Comprehensive Income (Loss) for the years ended December 31, 2022 and 2021:
| | | | | | | | | | | | | | | | | | | | |
| December 31, 2022 | | As Previously Reported | | Effect of Change | | Updated balances post-adoption of LDTI |
| (in millions) | | | |
| | | | | | |
| Net income | | $ | 8,469 | | | $ | 10 | | | $ | 8,479 | |
| Other comprehensive income (loss), net of tax | | | | | | |
| Change in unrealized appreciation (depreciation) of fixed maturity securities on which allowance for credit losses was taken | | (54) | | | (7) | | | (61) | |
| Change in unrealized appreciation (depreciation) of all other investments | | (26,128) | | | (5,567) | | | (31,695) | |
| Change in fair value of market risk benefits attributable to changes in our own credit risk | | — | | | 1,294 | | | 1,294 | |
| Change in the discount rates used to measure traditional and limited payment long-duration insurance contracts | | — | | | 5,298 | | | 5,298 | |
| Other comprehensive income (loss) | | (26,124) | | | 1,018 | | | (25,106) | |
| Comprehensive income (loss) | | (17,655) | | | 1,028 | | | (16,627) | |
| | | | | | |
| | | | | | |
| Comprehensive income (loss) attributable to Corebridge | | $ | (17,965) | | | $ | 1,028 | | | $ | (16,937) | |
ITEM 8 | Notes to Consolidated Financial Statements | 2. Summary of Significant Accounting Policies
| | | | | | | | | | | | | | | | | | | | |
| December 31, 2021 | | As Previously Reported | | Effect of Change | | Updated balances post-adoption of LDTI |
| (in millions) | | | |
| | | | | | |
| Net income | | $ | 8,284 | | | $ | 888 | | | $ | 9,172 | |
| Other comprehensive income (loss), net of tax | | | | | | |
| Change in unrealized appreciation (depreciation) of fixed maturity securities on which allowance for credit losses was taken | | 22 | | | 9 | | | 31 | |
| Change in unrealized appreciation (depreciation) of all other investments | | (4,509) | | | (1,129) | | | (5,638) | |
| Change in fair value of market risk benefits attributable to changes in our own credit risk | | — | | | 179 | | | 179 | |
| Change in the discount rates used to measure traditional and limited payment long-duration insurance contracts | | — | | | 1,356 | | | 1,356 | |
| Other comprehensive income (loss) | | (4,506) | | | 415 | | | (4,091) | |
| Comprehensive income (loss) | | 3,778 | | | 1,303 | | | 5,081 | |
| | | | | | |
| | | | | | |
| Comprehensive income (loss) attributable to Corebridge | | $ | 2,849 | | | $ | 1,303 | | | $ | 4,152 | |
The following table presents the impacts in connection with the adoption of LDTI on our previously reported Consolidated Statement of Cash Flows for the years ended December 31, 2022 and 2021:
| | | | | | | | | | | | | | | | | | | | |
| December 31, 2022 | | As Previously Reported | | Effect of Change | | Updated balances post-adoption of LDTI |
| (in millions) | | | |
| Cash flows from operating activities: | | | | | | |
| Net income | | $ | 8,469 | | | $ | 10 | | | $ | 8,479 | |
| Adjustments to reconcile net income to net cash provided by operating activities: | | | | | | |
| Noncash revenues, expenses, gains and losses included in income (loss): | | | | | | |
| Unrealized gains in earnings - net | | (1,621) | | | 2,485 | | | 864 | |
| Change in the fair value of market risk benefits in earnings, net | | — | | | (1,481) | | | (1,481) | |
| Depreciation and other amortization | | 1,021 | | | (436) | | | 585 | |
| Changes in operating assets and liabilities: | | | | | | |
| Insurance liabilities | | 2,064 | | | (1,068) | | | 996 | |
| Premiums and other receivables and payables - net | | 68 | | | (28) | | | 40 | |
| Reinsurance assets and funds held under reinsurance treaties | | 409 | | | 677 | | | 1,086 | |
| Capitalization of deferred policy acquisition costs | | (991) | | | (68) | | | (1,059) | |
| Current and deferred income taxes - net | | 890 | | | 22 | | | 912 | |
| Other, net | | 577 | | | (187) | | | 390 | |
| Total adjustments | | (5,774) | | | (84) | | | (5,858) | |
| Net cash provided by operating activities | | $ | 2,695 | | | $ | (74) | | | $ | 2,621 | |
| Cash flows from financing activities: | | | | | | |
| Policyholder contract deposits | | $ | 26,508 | | | $ | 74 | | | $ | 26,582 | |
| | | | | | |
| Net cash provided by financing activities | | $ | 4,600 | | | $ | 74 | | | $ | 4,674 | |
ITEM 8 | Notes to Consolidated Financial Statements | 2. Summary of Significant Accounting Policies
| | | | | | | | | | | | | | | | | | | | |
| December 31, 2021 | | As Previously Reported | | Effect of Change | | Updated balances post-adoption of LDTI |
| (in millions) | | | |
| Cash flows from operating activities: | | | | | | |
| Net income | | $ | 8,284 | | | $ | 888 | | | $ | 9,172 | |
| Adjustments to reconcile net income to net cash provided by operating activities: | | | | | | |
| Noncash revenues, expenses, gains and losses included in income (loss): | | | | | | |
| Unrealized gains in earnings - net | | (1,573) | | | 1,017 | | | (556) | |
| Change in the fair value of market risk benefits in earnings, net | | — | | | (1,427) | | | (1,427) | |
| Depreciation and other amortization | | 562 | | | (149) | | | 413 | |
| Changes in operating assets and liabilities: | | | | | | |
| Insurance liabilities | | 2,161 | | | (625) | | | 1,536 | |
| Premiums and other receivables and payables - net | | 226 | | | (70) | | | 156 | |
| Reinsurance assets and funds held under reinsurance treaties | | 155 | | | 152 | | | 307 | |
| Capitalization of deferred policy acquisition costs | | (1,000) | | | (58) | | | (1,058) | |
| Current and deferred income taxes - net | | (70) | | | 239 | | | 169 | |
| Other, net | | (686) | | | (23) | | | (709) | |
| Total adjustments | | (5,823) | | | (944) | | | (6,767) | |
| Net cash provided by operating activities | | $ | 2,461 | | | $ | (56) | | | $ | 2,405 | |
| Cash flows from financing activities: | | | | | | |
| Policyholder contract deposits | | $ | 25,387 | | | $ | 56 | | | $ | 25,443 | |
| | | | | | |
| Net cash provided by financing activities | | $ | (809) | | | $ | 56 | | | $ | (753) | |
FUTURE APPLICATION OF ACCOUNTING STANDARDS
Troubled Debt Restructuring and Vintage Disclosures
In March 2022, the FASB issued an accounting standard update that eliminates the accounting guidance for troubled debt restructurings for creditors and amends the guidance on ‘‘vintage disclosures’’ to require disclosure of current-period gross write-offs by year of origination. The standard also updates the requirements for accounting for credit losses by adding enhanced disclosures for creditors related to loan refinancings and restructurings for borrowers experiencing financial difficulty. Because the Company has already adopted the current expected credit loss (“CECL”) model, the amendments in this standard are effective for fiscal years beginning after December 15, 2022, including interim periods within those years. We do not expect the standard to have a material impact on our reported consolidated financial condition, results of operations, cash flows or required disclosures.
Fair Value Measurement
On June 30, 2022, the FASB issued an accounting standards update to address diversity in practice by clarifying that a contractual sale restriction should not be considered in the measurement of the fair value of an equity security. It also requires entities with investments in equity securities subject to contractual sale restrictions to disclose certain qualitative and quantitative information about such securities. The guidance is effective for public companies for fiscal years beginning after December 15, 2023 and interim period within those years, with early adoption permitted. For entities other than investment companies, the accounting standards update applies prospectively, with any adjustments resulting from adoption recognized in earnings on the date of adoption. We are assessing the impact of this standard.
We report our results of operations consistent with the manner in which our chief operating decision makers review the business to assess performance and allocate resources.
We report our results of operations as five reportable segments:
•Individual Retirement – consists of fixed annuities, fixed index annuities, variable annuities and retail mutual funds. On February 8, 2021, we announced the execution of a definitive agreement with Touchstone to sell certain assets of our retail mutual funds business. This Touchstone transaction closed on July 16, 2021. For further information on this sale, see Note 1 to our audited annual consolidated financial statements.
•Group Retirement – consists of record-keeping, plan administrative and compliance services, financial planning and advisory solutions offered in-plan, along with proprietary and limited non-proprietary annuities, advisory and brokerage products offered out-of-plan.
ITEM 8 | Notes to Consolidated Financial Statements | 3. Segment Information
•Life Insurance – primary products in the United States include term life and universal life insurance. The International Life business issues individual and group life insurance in the United Kingdom, and distributes private medical insurance in Ireland.
•Institutional Markets – consists of stable value wrap (“SVW”) products, structured settlement and PRT annuities, guaranteed investment contracts (“GICs”) and Corporate Markets products that include corporate- and bank-owned life insurance (“COLI-BOLI”), private placement variable universal life and private placement variable annuity products.
•Corporate and Other – consists primarily of:
–corporate expenses not attributable to our other segments;
–interest expense on financial debt;
–results of our consolidated investment entities;
–institutional asset management business, which includes managing assets for non-consolidated affiliates; and
–results of our legacy insurance lines ceded to Fortitude Re.
We evaluate segment performance based on adjusted revenues and adjusted pre-tax operating income (loss) (“APTOI”). Adjusted revenues are derived by excluding certain items from total revenues. APTOI is derived by excluding certain items from income from operations before income tax. These items generally fall into one or more of the following broad categories: legacy matters having no relevance to our current businesses or operating performance; adjustments to enhance transparency to the underlying economics of transactions; and adjustments that we believe to be common to the industry. Legal entities are attributed to each segment based upon the predominance of activity in that legal entity.
APTOI excludes the impact of the following items:
Fortitude-related adjustments:
The modco reinsurance agreements with Fortitude Re transfer the economics of the invested assets supporting the reinsurance agreements to Fortitude Re. Accordingly, the net investment income on Fortitude Re funds withheld assets and the net realized gains (losses) on Fortitude Re funds withheld assets are excluded from APTOI. Similarly, changes in the Fortitude Re funds withheld embedded derivative are also excluded from APTOI.
As a result of entering into the reinsurance agreements with Fortitude Re we recorded a loss which was primarily attributed to the write-off of DAC, VOBA and deferred cost of reinsurance assets. The total loss and the ongoing results associated with the reinsurance agreement with Fortitude Re have been excluded from APTOI as these are not indicative of our ongoing business operations.
Investment-related adjustments:
APTOI excludes “Net realized gains (losses)”, including changes in the allowance for credit losses on available for sale securities and loans, as well as gains or losses from sales of securities, except for gains (losses) related to the disposition of real estate investments. Net realized gains (losses), except for gains (losses) related to the disposition of real estate investments, are excluded as the timing of sales on invested assets or changes in allowances depend largely on market credit cycles and can vary considerably across periods. In addition, changes in interest rates may create opportunistic scenarios to buy or sell invested assets. Our derivative results, including those used to economically hedge insurance liabilities or are recognized as embedded derivatives at fair value are also included in net realized gains (losses) and are similarly excluded from APTOI except earned income (periodic settlements and changes in settlement accruals) on derivative instruments used for non-qualifying (economic) hedges or for asset replication. Earned income on such economic hedges is reclassified from net realized gains and losses to specific APTOI line items based on the economic risk being hedged (e.g., net investment income and interest credited to policyholder account balances).
Prior to the adoption of LDTI effective January 1, 2021, our investment-oriented contracts, such as universal life insurance, and fixed, fixed index and variable annuities, were also impacted by net realized gains (losses), and these secondary impacts were also excluded from APTOI. Specifically, the changes in benefit reserves and DAC, VOBA and DSI assets related to net realized gains (losses) were excluded from APTOI.
Variable, Fixed Index Annuities and Index Universal Life Insurance Products Adjustments:
Prior to the adoption of LDTI effective January 1, 2021, certain of our variable annuity contracts and fixed index annuity contracts contained GMWBs and were accounted for as embedded derivatives. Fixed index annuity contracts contain indexed interest credits which are accounted for as embedded derivatives, and our index universal life products also contain embedded derivatives. Changes in the fair value of these embedded derivatives, including rider fees attributed to the embedded derivatives are recorded through "Net realized gains (losses)" and are excluded from APTOI.
Changes in the fair value of securities used to hedge these guaranteed living benefits are excluded from APTOI.
ITEM 8 | Notes to Consolidated Financial Statements | 3. Segment Information
Market Risk Benefits adjustments:
Subsequent to the adoption of LDTI effective January 1, 2021, certain of our variable annuity, fixed annuity and fixed index annuity contracts contain guaranteed minimum withdrawal benefits (“GMWBs”) and/or guaranteed minimum death benefits (“GMDBs”) which are accounted for as MRBs. Changes in the fair value of these MRBs (excluding changes related to our own credit risk), including certain rider fees attributed to the MRBs, along with changes in the fair value of derivatives used to hedge MRBs are recorded through “Change in the fair value of MRBs, net” and are excluded from APTOI.
Changes in the fair value of securities used to economically hedge MRBs are excluded from APTOI.
Other adjustments:
Other adjustments represent all other adjustments that are excluded from APTOI and includes the net pre-tax operating income (losses) from noncontrolling interests related to consolidated investment entities. The excluded adjustments include, as applicable:
•restructuring and other costs related to initiatives designed to reduce operating expenses, improve efficiency and simplify our organization;
•non-recurring costs associated with the implementation of non-ordinary course legal or regulatory changes or changes to accounting principles;
•separation costs;
•non-operating litigation reserves and settlements;
•loss (gain) on extinguishment of debt;
•losses from the impairment of goodwill; and
•income and loss from divested or run-off business.
ITEM 8 | Notes to Consolidated Financial Statements | 3. Segment Information
The following table presents Corebridge’s operations by segment:
| | | | | | | | | | | | | | | | | | | | | | | | | | | | | |
| (in millions) | Individual Retirement | Group Retirement | Life Insurance | Institutional Markets | Corporate & Other | Eliminations | Total Corebridge | Adjustments | Total Consolidated |
| Year Ended December 31, 2022 | | | | | | | | | |
| Premiums | $ | 235 | | $ | 19 | | $ | 1,864 | | $ | 2,913 | | $ | 82 | | $ | — | | $ | 5,113 | | $ | (22) | | $ | 5,091 | |
| Policy fees | 741 | | 415 | | 1,564 | | 194 | | — | | — | | 2,914 | | — | | 2,914 | |
Net investment income(a) | 3,888 | | 2,000 | | 1,389 | | 1,049 | | 473 | | (41) | | 8,758 | | 818 | | 9,576 | |
Net realized gains (losses)(a)(b) | — | | — | | — | | — | | 170 | | — | | 170 | | 5,921 | | 6,091 | |
| Advisory fee and other income | 451 | | 305 | | 121 | | 2 | | 121 | | — | | 1,000 | | 25 | | 1,025 | |
| Total adjusted revenues | 5,315 | | 2,739 | | 4,938 | | 4,158 | | 846 | | (41) | | 17,955 | | 6,742 | | 24,697 | |
| Policyholder benefits | 285 | | 35 | | 3,010 | | 3,404 | | — | | — | | 6,734 | | (14) | | 6,720 | |
| Change in the fair value of market risk benefits, net | — | | — | | — | | — | | — | | — | | — | | (958) | | (958) | |
| Interest credited to policyholder account balances | 1,916 | | 1,147 | | 342 | | 320 | | — | | — | | 3,725 | | 7 | | 3,732 | |
| Amortization of deferred policy acquisition costs | 523 | | 80 | | 410 | | 7 | | — | | — | | 1,020 | | — | | 1,020 | |
| Non-deferrable insurance commissions | 351 | | 123 | | 72 | | 20 | | 2 | | — | | 568 | | — | | 568 | |
| Advisory fee expenses | 141 | | 124 | | 1 | | — | | — | | — | | 266 | | — | | 266 | |
| General operating expenses | 426 | | 447 | | 656 | | 73 | | 384 | | (2) | | 1,984 | | 339 | | 2,323 | |
| Interest expense | — | | — | | — | | — | | 535 | | (51) | | 484 | | 50 | | 534 | |
| | | | | | | | | |
| Net (gain) loss on divestitures | — | | — | | — | | — | | — | | — | | — | | 1 | | 1 | |
| | | | | | | | | |
| Total benefits and expenses | 3,642 | | 1,956 | | 4,491 | | 3,824 | | 921 | | (53) | | 14,781 | | (575) | | 14,206 | |
| Noncontrolling interests | — | | — | | — | | — | | (320) | | — | | (320) | | | |
| Adjusted pre-tax operating income (loss) | $ | 1,673 | | $ | 783 | | $ | 447 | | $ | 334 | | $ | (395) | | $ | 12 | | $ | 2,854 | | | |
| Adjustments to: | | | | | | | | | |
| Total revenue | | | | | | | 6,742 | | | |
| Total expenses | | | | | | | (575) | | | |
| Noncontrolling interests | | | | | | | 320 | | | |
| Income before income tax (benefit) | | | | | | | $ | 10,491 | | | $ | 10,491 | |
| | | | | | | | | |
| Year Ended December 31, 2021 | | | | | | | | | |
| Premiums | $ | 195 | | $ | 22 | | $ | 1,586 | | $ | 3,774 | | $ | 86 | | $ | — | | $ | 5,663 | | $ | (10) | | $ | 5,653 | |
| Policy fees | 797 | | 480 | | 1,541 | | 187 | | — | | — | | 3,005 | | — | | 3,005 | |
Net investment income(a) | 4,334 | | 2,413 | | 1,621 | | 1,155 | | 443 | | (49) | | 9,917 | | 1,755 | | 11,672 | |
Net realized gains (losses)(a)(b) | — | | — | | — | | — | | 701 | — | | 701 | | 1,051 | | 1,752 | |
| Advisory fee and other income | 592 | | 337 | | 110 | | 2 | | 134 | | — | | 1,175 | | — | | 1,175 | |
| Total adjusted revenues | 5,918 | | 3,252 | | 4,858 | | 5,118 | | 1,364 | | (49) | | 20,461 | | 2,796 | | 23,257 | |
| Policyholder benefits | 317 | | 31 | | 2,842 | | 4,183 | | — | | — | | 7,373 | | 14 | | 7,387 | |
| Change in the fair value of market risk benefits, net | — | | — | | — | | — | | — | | — | | — | | (447) | | (447) | |
| Interest credited to policyholder account balances | 1,793 | | 1,159 | | 354 | | 274 | | — | | — | | 3,580 | | (18) | | 3,562 | |
| Amortization of deferred policy acquisition costs | 451 | | 78 | | 416 | | 6 | | — | | — | | 951 | | — | | 951 | |
| Non-deferrable insurance commissions | 396 | | 122 | | 80 | | 22 | | 3 | | — | | 623 | | — | | 623 | |
| Advisory fee expenses | 189 | | 133 | | — | | — | | — | | — | | 322 | | — | | 322 | |
| General operating expenses | 437 | | 445 | | 682 | | 77 | | 375 | | — | | 2,016 | | 88 | | 2,104 | |
| Interest expense | 46 | | 35 | | 25 | | 9 | | 286 | | (47) | | 354 | | 35 | | 389 | |
| Loss on extinguishment of debt | — | | — | | — | | — | | — | | — | | — | | 219 | | 219 | |
| Net (gain) loss on divestitures | — | | — | | — | | — | | — | | — | | — | | (3,081) | | (3,081) | |
| Net (gain) loss on Fortitude Re transactions | — | | — | | — | | — | | — | | — | | — | | (26) | | (26) | |
| Total benefits and expenses | 3,629 | | 2,003 | | 4,399 | | 4,571 | | 664 | | (47) | | 15,219 | | (3,216) | | 12,003 | |
| Noncontrolling interests | — | | — | | — | | — | | (861) | | — | | (861) | | | |
| Adjusted pre-tax operating income (loss) | $ | 2,289 | | $ | 1,249 | | $ | 459 | | $ | 547 | | $ | (161) | | $ | (2) | | $ | 4,381 | | | |
| Adjustments to: | | | | | | | | | |
| Total revenue | | | | | | | 2,796 | | | |
| Total expenses | | | | | | | (3,216) | | | |
| Noncontrolling interests | | | | | | | 861 | | | |
| Income before income tax (benefit) | | | | | | | $ | 11,254 | | | $ | 11,254 | |
| | | | | | | | | |
| | | | | | | | | |
ITEM 8 | Notes to Consolidated Financial Statements | 3. Segment Information
| | | | | | | | | | | | | | | | | | | | | | | | | | | | | |
| (in millions) | Individual Retirement | Group Retirement | Life Insurance | Institutional Markets | Corporate & Other | Eliminations | Total Corebridge | Adjustments | Total Consolidated |
| Year Ended December 31, 2020 | | | | | | | | | |
| Premiums | $ | 151 | | $ | 19 | | $ | 1,526 | | $ | 2,564 | | $ | 74 | | $ | — | | $ | 4,334 | | $ | 7 | | $ | 4,341 | |
| Policy fees | 861 | | 443 | | 1,384 | | 186 | | — | | — | | 2,874 | | — | | 2,874 | |
Net investment income(a) | 4,105 | | 2,213 | | 1,532 | | 931 | | 346 | | (43) | | 9,084 | | 1,432 | | 10,516 | |
Net realized gains (losses)(a)(b) | — | | — | | — | | — | | 54 | — | | 54 | | (3,795) | | (3,741) | |
| Advisory fee and other income | 571 | | 272 | | 94 | | 1 | | 122 | | — | | 1,060 | | 12 | | 1,072 | |
| Total adjusted revenues | 5,688 | | 2,947 | | 4,536 | | 3,682 | | 596 | | (43) | | 17,406 | | (2,344) | | 15,062 | |
| Policyholder benefits | 411 | | 74 | | 3,219 | | 2,886 | | — | | — | | 6,590 | | 12 | | 6,602 | |
| Interest credited to policyholder account balances | 1,751 | | 1,125 | | 373 | | 303 | | — | | — | | 3,552 | | (24) | | 3,528 | |
| Amortization of deferred policy acquisition costs | 556 | | 15 | | 25 | | 5 | | — | | — | | 601 | | (58) | | 543 | |
| Non-deferrable insurance commissions | 334 | | 117 | | 119 | | 31 | | 3 | | — | | 604 | | — | | 604 | |
| Advisory fee expenses | 205 | | 111 | | — | | — | | — | | — | | 316 | | — | | 316 | |
| General operating expenses | 427 | | 488 | | 624 | | 79 | | 309 | | (7) | | 1,920 | | 107 | | 2,027 | |
| Interest expense | 62 | | 42 | | 30 | | 11 | | 324 | | (34) | | 435 | | 55 | | 490 | |
| Loss on extinguishment of debt | — | | — | | — | | — | | — | | — | | — | | 10 | | 10 | |
| | | | | | | | | |
| Net (gain) loss on Fortitude Re transactions | — | | — | | — | | — | | — | | — | | — | | 91 | | 91 | |
| Total benefits and expenses | 3,746 | | 1,972 | | 4,390 | | 3,315 | | 636 | | (41) | | 14,018 | | 193 | | 14,211 | |
| Noncontrolling interests | — | | — | | — | | — | | (194) | | — | | (194) | | | |
| Adjusted pre-tax operating income (loss) | $ | 1,942 | | $ | 975 | | $ | 146 | | $ | 367 | | $ | (234) | | $ | (2) | | $ | 3,194 | | | |
| Adjustments to: | | | | | | | | | |
| Total revenue | | | | | | | (2,344) | | | |
| Total expenses | | | | | | | 193 | | | |
| Noncontrolling interests | | | | | | | 194 | | | |
| Income before income tax (benefit) | | | | | | | $ | 851 | | | $ | 851 | |
| | | | | | | | | |
| | | | | | | | | |
| | | | | | | | | |
| | | | | | | | | |
| | | | | | | | | |
| | | | | | | | | |
| | | | | | | | | |
| | | | | | | | | |
| | | | | | | | | |
| | | | | | | | | |
| | | | | | | | | |
| | | | | | | | | |
| | | | | | | | | |
| | | | | | | | | |
| | | | | | | | | |
| | | | | | | | | |
| | | | | | | | | |
| | | | | | | | | |
| | | | | | | | | |
| | | | | | | | | |
| | | | | | | | | |
| | | | | | | | | |
| | | | | | | | | |
| | | | | | | | | |
| | | | | | | | | |
| | | | | | | | | |
(a) Adjustments include Fortitude Re activity of and $6,841 million, $2,012 million and $(1,549) million for the years ended December 31, 2022 ,2021 and 2020, respectively.
(b) Net realized gains (losses) includes the gains (losses) related to the disposition of real estate investments.
Corebridge does not report total assets by segment, as we do not use this metric to allocate resources or evaluate segment performance.
The following table presents Corebridge’s consolidated total revenues and real estate and other fixed assets, net of accumulated depreciation, by major geographic area:
| | | | | | | | | | | | | | | | | | | | | | | | | | | | | | | | | | | |
| Total Revenues* | | Real Estate and Other Fixed Assets,
Net of Accumulated Depreciation |
| (in millions) | 2022 | | 2021 | | 2020 | | 2022 | | 2021 | | 2020 |
| North America | $ | 24,160 | | | $ | 22,733 | | | $ | 14,642 | | | $ | 404 | | | $ | 286 | | | $ | 364 | |
| International | 537 | | | 524 | | | 420 | | | 36 | | | 37 | | | 39 | |
| Consolidated | $ | 24,697 | | | $ | 23,257 | | | $ | 15,062 | | | $ | 440 | | | $ | 323 | | | $ | 403 | |
* Revenues are generally reported according to the geographic location of the legal entity. International revenues consist of revenues from Laya and AIG Life (United Kingdom).
ITEM 8 | Notes to Consolidated Financial Statements | 4. Fair Value Measurements
4. Fair Value Measurements FAIR VALUE MEASUREMENTS ON A RECURRING BASIS
We carry certain of our financial instruments at fair value. We define the fair value of a financial instrument as the amount that would be received from the sale of an asset or paid to transfer a liability in an orderly transaction between market participants at the measurement date. We are responsible for the determination of the value of the investments carried at fair value and the supporting methodologies and assumptions.
The degree of judgment used in measuring the fair value of financial instruments generally inversely correlates with the level of observable valuation inputs. We maximize the use of observable inputs and minimize the use of unobservable inputs when measuring fair value. Financial instruments with quoted prices in active markets generally have more pricing observability and less judgment is used in measuring fair value. Conversely, financial instruments for which no quoted prices are available have less observability and are measured at fair value using valuation models or other pricing techniques that require more judgment. Pricing observability is affected by a number of factors, including the type of financial instrument, whether the financial instrument is new to the market and not yet established, the characteristics specific to the transaction, liquidity and general market conditions.
Assets and liabilities recorded at fair value in the Consolidated Balance Sheets are measured and classified in accordance with a fair value hierarchy consisting of three “levels” based on the observability of valuation inputs:
•Level 1: Fair value measurements based on quoted prices (unadjusted) in active markets that we have the ability to access for identical assets or liabilities. Market price data generally is obtained from exchange or dealer markets. We do not adjust the quoted price for such instruments.
•Level 2: Fair value measurements based on inputs other than quoted prices included in Level 1 that are observable for the asset or liability, either directly or indirectly. Level 2 inputs include quoted prices for similar assets and liabilities in active markets, quoted prices for identical or similar assets or liabilities in markets that are not active, and inputs other than quoted prices that are observable for the asset or liability, such as interest rates and yield curves that are observable at commonly quoted intervals.
•Level 3: Fair value measurements based on valuation techniques that use significant inputs that are unobservable. Both observable and unobservable inputs may be used to determine the fair values of positions classified in Level 3. The circumstances for using these measurements include those in which there is little, if any, market activity for the asset or liability. Therefore, we must make certain assumptions about the inputs a hypothetical market participant would use to value that asset or liability.
In certain cases, the inputs used to measure fair value may fall into different levels of the fair value hierarchy. In such cases, the level in the fair value hierarchy within which the fair value measurement in its entirety falls is determined based on the lowest level input that is significant to the fair value measurement in its entirety.
The following is a description of the valuation methodologies used for instruments carried at fair value. These methodologies are applied to assets and liabilities across the levels discussed above, and it is the observability of the inputs used that determines the appropriate level in the fair value hierarchy for the respective asset or liability.
VALUATION METHODOLOGIES OF FINANCIAL INSTRUMENTS MEASURED AT FAIR VALUE
Incorporation of Credit Risk in Fair Value Measurements
•Our Own Credit Risk. Fair value measurements for certain liabilities incorporate our own credit risk by determining the explicit cost for each counterparty to protect against its net credit exposure to us at the balance sheet date by reference to observable AIG credit default swaps (“CDS”) or cash bond spreads. We calculate the effect of credit spread changes using discounted cash flow techniques that incorporate current market interest rates. A derivative counterparty’s net credit exposure to us is determined based on master netting agreements, when applicable, which take into consideration all derivative positions with us, as well as collateral we post with the counterparty at the balance sheet date. We also incorporate our own risk of non-performance in the valuation of market risk benefits associated with variable annuity, fixed annuity and fixed index annuity contracts and embedded derivatives associated with fixed index annuity and life contracts. The non-performance risk adjustment (“NPA”) reflects a market participant’s view of our claims-paying ability by incorporating an additional spread to the swap curve used to discount projected benefit cash flows in the valuation of market risk benefits and embedded derivatives. The non-performance risk adjustment is calculated by constructing forward rates based on a weighted average of observable corporate credit indices to approximate the claims-paying ability rating of our insurance operations companies.
•Counterparty Credit Risk. Fair value measurements for freestanding derivatives incorporate counterparty credit by determining the explicit cost for us to protect against our net credit exposure to each counterparty at the balance sheet date by reference to observable counterparty CDS spreads, when available. When not available, other directly or indirectly observable credit spreads
ITEM 8 | Notes to Consolidated Financial Statements | 4. Fair Value Measurements
will be used to derive the best estimates of the counterparty spreads. Our net credit exposure to a counterparty is determined based on master netting agreements, which take into consideration all derivative positions with the counterparty, as well as collateral posted by the counterparty at the balance sheet date.
Fair values for fixed maturity securities based on observable market prices for identical or similar instruments implicitly incorporate counterparty credit risk. Fair values for fixed maturity securities based on internal models incorporate counterparty credit risk by using discount rates that take into consideration cash issuance spreads for similar instruments or other observable information.
For fair values measured based on internal models, the cost of credit protection is determined under a discounted present value approach considering the market levels for single name CDS spreads for each specific counterparty, the mid-market value of the net exposure (reflecting the amount of protection required) and the weighted average life of the net exposure. CDS spreads are provided to us by an independent third party. We utilize an interest rate based on the benchmark London Interbank Offered Rate (“LIBOR”) curve to derive our discount rates.
While this approach does not explicitly consider all potential future behavior of the derivative transactions or potential future changes in valuation inputs, we believe this approach provides a reasonable estimate of the fair value of the assets and liabilities, including consideration of the impact of non-performance risk.
Fixed Maturity Securities
Whenever available, we obtain quoted prices in active markets for identical assets at the balance sheet date to measure fixed maturity securities at fair value. Market price data is generally obtained from dealer markets.
We employ independent third-party valuation service providers to gather, analyze, and interpret market information to derive fair value estimates for individual investments, based upon market-accepted methodologies and assumptions. The methodologies used by these independent third-party valuation service providers are reviewed and understood by management, through periodic discussion with and information provided by the independent third-party valuation service providers. In addition, as discussed further below, control processes are applied to the fair values received from independent third-party valuation service providers to ensure the accuracy of these values.
Valuation service providers typically obtain data about market transactions and other key valuation model inputs from multiple sources and, through the use of market-accepted valuation methodologies, which may utilize matrix pricing, financial models, accompanying model inputs and various assumptions, provide a single fair value measurement for individual securities. The inputs used by the valuation service providers include, but are not limited to, market prices from completed transactions for identical securities and transactions for comparable securities, benchmark yields, interest rate yield curves, credit spreads, prepayment rates, default rates, recovery assumptions, currency rates, quoted prices for similar securities and other market-observable information, as applicable. If fair value is determined using financial models, these models generally take into account, among other things, market observable information as of the measurement date as well as the specific attributes of the security being valued, including its term, interest rate, credit rating, industry sector, and when applicable, collateral quality and other security or issuer-specific information. When market transactions or other market observable data is limited, the extent to which judgment is applied in determining fair value is greatly increased.
We have control processes designed to ensure that the fair values received from independent third-party valuation service providers are accurately recorded, that their data inputs and valuation techniques are appropriate and consistently applied and that the assumptions used appear reasonable and consistent with the objective of determining fair value. We assess the reasonableness of individual security values received from independent third-party valuation service providers through various analytical techniques and have procedures to escalate related questions internally and to the independent third-party valuation service providers for resolution. To assess the degree of pricing consensus among various valuation service providers for specific asset types, we conduct comparisons of prices received from available sources. We use these comparisons to establish a hierarchy for the fair values received from independent third-party valuation service providers to be used for particular security classes. We also validate prices for selected securities through reviews by members of management who have relevant expertise and who are independent of those charged with executing investing transactions.
When our independent third-party valuation service providers are unable to obtain sufficient market observable information upon which to estimate the fair value for a particular security, fair value is determined either by requesting brokers who are knowledgeable about these securities to provide a price quote, which is generally non-binding, or by employing market accepted valuation models internally or via our third party asset managers. Broker prices may be based on an income approach, which converts expected future cash flows to a single present value amount, with specific consideration of inputs relevant to particular security types. For structured securities, such inputs may include ratings, collateral types, geographic concentrations, underlying loan vintages, loan delinquencies and defaults, loss severity assumptions, prepayments, and weighted average coupons and maturities. When the volume or level of market activity for a security is limited, certain inputs used to determine fair value may not be observable in the market. Broker prices may also be based on a market approach that considers recent transactions involving identical or similar securities. Fair values provided by brokers are subject to similar control processes to those noted above for fair values from independent third-party valuation service providers, including management reviews. For those corporate debt instruments (for example, private placements) that are not traded in active markets or that are subject to transfer restrictions, valuations reflect illiquidity and non-transferability,
ITEM 8 | Notes to Consolidated Financial Statements | 4. Fair Value Measurements
based on available market evidence. When observable price quotations are not available, fair value is determined based on discounted cash flow models using discount rates based on credit spreads, yields or price levels of comparable securities, adjusted for illiquidity and structure. Fair values determined internally or via our third party asset managers are also subject to management review to ensure that valuation models and related inputs are reasonable.
The methodology above is relevant for all fixed maturity securities including residential mortgage backed securities (“RMBS”), commercial mortgage backed securities (“CMBS”), collateralized loan obligations (“CLOs”), other asset-backed securities (“ABS”) and fixed maturity securities issued by government sponsored entities and corporate entities.
Equity Securities Traded in Active Markets
Whenever available, we obtain quoted prices in active markets for identical assets at the balance sheet date to measure equity securities at fair value. Market price data is generally obtained from exchange or dealer markets.
Mortgage and Other Loans Receivable
We estimate the fair value of mortgage and other loans receivable that are measured at fair value by using dealer quotations, discounted cash flow analyses and/or internal valuation models. The determination of fair value considers inputs such as interest rate, maturity, the borrower’s creditworthiness, collateral, subordination, guarantees, past-due status, yield curves, credit curves, prepayment rates, market pricing for comparable loans and other relevant factors.
Other Invested Assets
We initially estimate the fair value of investments in certain hedge funds, private equity funds and other investment partnerships by reference to the transaction price. Subsequently, we generally obtain the fair value of these investments from net asset value information provided by the general partner or manager of the investments, the financial statements of which are generally audited annually. We consider observable market data and perform certain control procedures to validate the appropriateness of using the net asset value as a fair value measurement. The fair values of other investments carried at fair value, such as direct private equity holdings, are initially determined based on transaction price and are subsequently estimated based on available evidence such as market transactions in similar instruments, other financing transactions of the issuer and other available financial information for the issuer, with adjustments made to reflect illiquidity as appropriate.
Short-term Investments
For short-term investments that are measured at amortized cost, the carrying amounts of these assets approximate fair values because of the relatively short period of time between origination and expected realization, and their limited exposure to credit risk. Securities purchased under agreements to resell (reverse repurchase agreements) are generally treated as collateralized receivables. We report certain receivables arising from securities purchased under agreements to resell as Short-term investments in the Consolidated Balance Sheets. When these receivables are measured at fair value, we use market-observable interest rates to determine fair value.
Separate Account Assets
Separate account assets are composed primarily of registered and unregistered open-end mutual funds that generally trade daily and are measured at fair value in the manner discussed above for equity securities traded in active markets.
Freestanding Derivatives
Derivative assets and liabilities can be exchange-traded or traded over-the-counter (“OTC”). We generally value exchange-traded derivatives such as futures and options using quoted prices in active markets for identical derivatives at the balance sheet date. We use these OTC derivatives as part of fair value hedges.
OTC derivatives are valued using market transactions and other market evidence whenever possible, including market-based inputs to models, model calibration to market clearing transactions, broker or dealer quotations or alternative pricing sources with reasonable levels of price transparency. When models are used, the selection of a particular model to value an OTC derivative depends on the contractual terms of, and specific risks inherent in the instrument, as well as the availability of pricing information in the market. We generally use similar models to value similar instruments. Valuation models require a variety of inputs, including contractual terms, market prices and rates, yield curves, credit curves, measures of volatility, prepayment rates and correlations of such inputs. For OTC derivatives that trade in liquid markets, such as generic forwards, swaps and options, model inputs can generally be corroborated by observable market data by correlation or other means, and model selection does not involve significant management judgment.
For certain OTC derivatives that trade in less liquid markets, where we generally do not have corroborating market evidence to support significant model inputs and cannot verify the model to market transactions, the transaction price may provide the best estimate of fair value. Accordingly, when a pricing model is used to value such an instrument, the model is adjusted so the model value at inception equals the transaction price. We will update valuation inputs in these models only when corroborated by evidence such as similar market transactions, independent third-party valuation service providers and/or broker or dealer quotations, or other empirical market data. When appropriate, valuations are adjusted for various factors such as liquidity, bid/offer spreads and credit
ITEM 8 | Notes to Consolidated Financial Statements | 4. Fair Value Measurements
considerations. Such adjustments are generally based on available market evidence. In the absence of such evidence, management’s best estimate is used.
Market Risk Benefits and Embedded Derivatives within Policyholder Contract Deposits
Certain variable annuity, fixed annuity and fixed index annuity contracts contain MRBs related to guaranteed benefit features that we separate from the host contracts and account for at fair value, with certain changes recognized in earnings. MRBs are contracts or contract features that provide protection to policyholders from other-than-nominal capital market risks and expose the insurance entity to other-than-nominal capital market risks.
The fair value of MRBs contained in certain variable annuity, fixed annuity and fixed index annuity contracts is measured based on policyholder behavior and capital market assumptions related to projected cash flows over the expected lives of the contracts. These discounted cash flow projections primarily include benefits and related fees assessed, when applicable. In some instances, the projected cash flows from fees may exceed projected cash flows related to benefit payments and therefore, at a point in time, the carrying value of the MRBs may be in a net asset position. The projected cash flows incorporate best estimate assumptions for policyholder behavior (including mortality, lapses, withdrawals and benefit utilization), along with an explicit risk margin to reflect a market participant’s estimates of projected cash flows and policyholder behavior. Estimates of future policyholder behavior assumptions are subjective and are based primarily on our historical experience.
Because of the dynamic and complex nature of the projected cash flows with respect to MRBs in our variable annuity, fixed annuity and fixed index annuity contracts, risk neutral valuations are used, which are calibrated to observable interest rate and equity option prices. Estimating the underlying cash flows for these products involves judgments regarding the capital market assumptions related to expected market rates of return, market volatility, credit spreads, correlations of certain market variables, fund performance and discount rates. Additionally, estimating the underlying cash flows for these products also involves judgments regarding policyholder behavior. The portion of fees attributable to the fair value of expected benefit payments is included within the fair value measurement of these MRBs, and related fees are classified in change in the fair value of MRBs, net, as earned, consistent with other changes in the fair value of these MRBs. Any portion of the fees not attributed to the MRBs is excluded from the fair value measurement and classified in policy fees as earned.
Option pricing models are used to estimate the fair value of embedded derivatives in our fixed index annuity and life contracts, taking into account the capital market assumptions for future index growth rates, volatility of the index, future interest rates, and our ability to adjust the participation rate and the cap on fixed index credited rates in light of market conditions and policyholder behavior assumptions.
Projected cash flows are discounted using the interest rate swap curve (“swap curve”), which is viewed as being consistent with the credit spreads for highly-rated financial institutions (S&P AA-rated or above). A swap curve shows the fixed-rate leg of a non-complex swap against the floating rate (for example, LIBOR) leg of a related tenor. We also incorporate our own risk of non-performance in the valuation of MRBs and embedded derivatives associated with variable annuity, fixed annuity, fixed index annuity and life contracts. The non-performance risk adjustment (“NPA”) reflects a market participant’s view of our claims-paying ability by incorporating an additional spread to the swap curve used to discount projected benefit cash flows. The non-performance risk adjustment is calculated by constructing forward rates based on a weighted average of observable corporate credit indices to approximate the claims-paying ability rating of our insurance operations companies. MRBs are measured using a non-performance risk adjustment that is a locked-in estimate of our claims-paying ability at policy issue (“locked-in NPA”) as well as a non-performance risk adjustment that reflects an estimate of our current claims-paying ability (“current NPA”).
When MRBs are remeasured each period, both the interest rates and current non-performance risk adjustment are updated. Changes in the swap curve and the time value accretion of the at-issue non-performance risk adjustment are recorded to net income while the difference between the MRBs measured using the at-issue non-performance risk adjustment and the current non-performance risk adjustment is recorded to OCI. For embedded derivatives, changes in the interest rates and the period-over-period change in the non-performance risk adjustment are recorded to net income.
Policyholder Contract Deposits at Fair Value Option
We have elected fair value option on certain GICs recorded using discounted cash flow calculations based on interest rates currently being offered for similar contracts and our current market observable implicit credit spread rates with maturities consistent with those remaining for the contracts being valued. Obligations may be called at various times prior to maturity at the option of the counterparty. Interest rates on these borrowings are primarily fixed, vary by maturity and range up to 5.04%.
Fortitude Re funds withheld payable
The reinsurance transactions between AIG and Fortitude Re were structured as modco arrangements. Corebridge has established a funds withheld payable to Fortitude Re while simultaneously establishing a reinsurance asset representing liabilities for the insurance coverage that Fortitude Re has assumed. The funds withheld payable contains an embedded derivative. Changes in fair value of the embedded derivative related to the funds withheld payable are recognized in earnings through realized gains (losses). This embedded derivative is considered a total return swap with contractual returns that are attributable to various assets and liabilities associated
ITEM 8 | Notes to Consolidated Financial Statements | 4. Fair Value Measurements
with these reinsurance agreements. The fair value of the underlying assets is generally based on market observable inputs using industry standard valuation techniques. The valuation also requires certain significant inputs, which are generally not observable and accordingly, the valuation is considered Level 3 in the fair value hierarchy.
Debt of Consolidated Investment Entities
The fair value of debt of consolidated investment entities was determined using independent third-party valuation service providers that gather, analyze, and interpret market information to derive fair value estimates for individual securities, based upon market-accepted methodologies and assumptions. Previously, there were six consolidated investment entities which securitized portfolios of certain debt securities previously owned by Corebridge and its affiliates. These were valued using a discounted cash flow model. The discount rate considered current market spreads for U.S. Collateralized Loan Obligations, as well as our own considerations including duration, credit risk, and liquidity.
ITEM 8 | Notes to Consolidated Financial Statements | 4. Fair Value Measurements
ASSETS AND LIABILITIES MEASURED AT FAIR VALUE ON A RECURRING BASIS
The following table presents information about assets and liabilities measured at fair value on a recurring basis and indicates the level of the fair value measurement based on the observability of the inputs used:
| | | | | | | | | | | | | | | | | | | | | | | | | | | | | | | | | | | | | | |
| December 31, 2022 | | Level 1 | | Level 2 | | Level 3 | | Counterparty Netting(a) | | Cash
Collateral | | Total |
| (in millions) | |
| Assets: | | | | | | | | | | | | |
| Bonds available for sale: | | | | | | | | | | | | |
| U.S. government and government sponsored entities | | $ | — | | $ | 1,198 | | $ | — | | $ | — | | $ | — | | $ | 1,198 |
| Obligations of states, municipalities and political subdivisions | | — | | 5,121 | | 805 | | — | | — | | 5,926 |
| Non-U.S. governments | | — | | 4,392 | | — | | — | | — | | 4,392 |
| Corporate debt | | — | | 102,724 | | 1,968 | | — | | — | | 104,692 |
RMBS(b) | | — | | 6,274 | | 5,670 | | — | | — | | 11,944 |
| CMBS | | — | | 9,350 | | 718 | | — | | — | | 10,068 |
CLO(c) | | — | | 6,516 | | 1,670 | | — | | — | | 8,186 |
ABS | | — | | 792 | | 9,595 | | — | | — | | 10,387 |
| Total bonds available for sale | | — | | 136,367 | | 20,426 | | — | | — | | 156,793 |
| Other bond securities: | | | | | | | | | | | | |
| Obligations of states, municipalities and political subdivisions | | — | | 37 | | — | | — | | — | | 37 |
| Non-U.S. governments | | — | | 22 | | — | | — | | — | | 22 |
| Corporate debt | | — | | 1,805 | | 417 | | — | | — | | 2,222 |
RMBS(d) | | — | | 58 | | 107 | | — | | — | | 165 |
| CMBS | | — | | 204 | | 28 | | — | | — | | 232 |
| CLO | | — | | 268 | | 11 | | — | | — | | 279 |
| ABS | | — | | 71 | | 741 | | — | | — | | 812 |
| Total other bond securities | | — | | 2,465 | | 1,304 | | — | | — | | 3,769 |
| Equity securities | | 141 | | 3 | | 26 | | — | | — | | 170 |
Other invested assets(e) | | — | | — | | 1,832 | | — | | — | | 1,832 |
| Derivative assets: | | | | | | | | | | | | |
| Interest rate contracts | | 1 | | 1,269 | | 303 | | — | | — | | 1,573 |
| Foreign exchange contracts | | — | | 1,247 | | — | | — | | — | | 1,247 |
| Equity contracts | | 11 | | 124 | | 282 | | — | | — | | 417 |
| Credit contracts | | — | | — | | — | | — | | — | | — |
| Other contracts | | — | | 1 | | 14 | | — | | — | | 15 |
| Counterparty netting and cash collateral | | — | | — | | — | | (2,547) | | (406) | | (2,953) |
| Total derivative assets | | 12 | | 2,641 | | 599 | | (2,547) | | (406) | | 299 |
| Short-term investments | | 1 | | 1,356 | | — | | — | | — | | 1,357 |
| Market risk benefit assets | | — | | — | | 796 | | — | | — | | 796 |
| Separate account assets | | 81,655 | | 3,198 | | — | | — | | — | | 84,853 |
| Total | | $ | 81,809 | | $ | 146,030 | | $ | 24,983 | | $ | (2,547) | | $ | (406) | | $ | 249,869 |
| Liabilities: | | | | | | | | | | | | |
Policyholder contract deposits(f) | | $ | — | | $ | 97 | | $ | 5,367 | | $ | — | | $ | — | | $ | 5,464 |
| Derivative liabilities: | | | | | | | | | | | | |
| Interest rate contracts | | — | | 2,676 | | — | | — | | — | | 2,676 |
| Foreign exchange contracts | | — | | 632 | | — | | — | | — | | 632 |
| Equity contracts | | 2 | | 10 | | 15 | | — | | — | | 27 |
| Credit contracts | | — | | — | | — | | — | | — | | — |
| Other contracts | | — | | — | | — | | — | | — | | — |
| Counterparty netting and cash collateral | | — | | — | | — | | (2,547) | | (691) | | (3,238) |
| Total derivative liabilities | | 2 | | 3,318 | | 15 | | (2,547) | | (691) | | 97 |
Fortitude Re funds withheld payable(g) | | — | | — | | 1,262 | | — | | — | | 1,262 |
| Market risk benefit liabilities | | — | | — | | 4,736 | | — | | — | | 4,736 |
| Debt of consolidated investment entities | | — | | — | | 6 | | — | | — | | 6 |
| Total | | $ | 2 | | $ | 3,415 | | $ | 11,386 | | $ | (2,547) | | $ | (691) | | $ | 11,565 |
ITEM 8 | Notes to Consolidated Financial Statements | 4. Fair Value Measurements
| | | | | | | | | | | | | | | | | | | | | | | | | | | | | | | | | | | | | | |
| December 31, 2021 | | Level 1 | | Level 2 | | Level 3 | | Counterparty Netting(a) | | Cash
Collateral | | Total |
| (in millions) | | | | | | |
| Assets: | | | | | | | | | | | | |
| Bonds available for sale: | | | | | | | | | | | | |
| U.S. government and government sponsored entities | | $ | — | | $ | 1,712 | | $ | — | | $ | — | | $ | — | | $ | 1,712 |
| Obligations of states, municipalities and political subdivisions | | — | | 7,281 | | 1,395 | | — | | — | | 8,676 |
| Non-U.S. governments | | 7 | | 6,390 | | — | | — | | — | | 6,397 |
| Corporate debt | | — | | 138,156 | | 1,907 | | — | | — | | 140,063 |
RMBS(b) | | — | | 7,363 | | 7,595 | | — | | — | | 14,958 |
| CMBS | | — | | 10,228 | | 1,072 | | — | | — | | 11,300 |
CLO(c) | | — | | 4,364 | | 3,038 | | — | | — | | 7,402 |
ABS | | — | | 660 | | 7,400 | | — | | — | | 8,060 |
| Total bonds available for sale | | 7 | | 176,154 | | 22,407 | | — | | — | | 198,568 |
| Other bond securities: | | | | | | | | | | | | |
| Obligations of states, municipalities and political subdivisions | | — | | 50 | | — | | — | | — | | 50 |
| Non-U.S. governments | | — | | 17 | | — | | — | | — | | 17 |
| Corporate debt | | — | | 866 | | 134 | | — | | — | | 1,000 |
RMBS(d) | | — | | 93 | | 106 | | — | | — | | 199 |
| CMBS | | — | | 201 | | 33 | | — | | — | | 234 |
| CLO | | — | | 134 | | 149 | | — | | — | | 283 |
| ABS | | — | | 94 | | 205 | | — | | — | | 299 |
| Total other bond securities | | — | | 1,455 | | 627 | | — | | — | | 2,082 |
Equity securities | | 238 | | 2 | | 2 | | — | | — | | 242 |
Other invested assets(e) | | — | | — | | 1,892 | | — | | — | | 1,892 |
| Derivative assets: | | | | | | | | | | | | |
| Interest rate contracts | | — | | 1,911 | | — | | — | | — | | 1,911 |
| Foreign exchange contracts | | — | | 672 | | — | | — | | — | | 672 |
| Equity contracts | | 7 | | 4,184 | | 479 | | — | | — | | 4,670 |
| Credit contracts | | — | | — | | 1 | | — | | — | | 1 |
| Other contracts | | — | | 1 | | 12 | | — | | — | | 13 |
| Counterparty netting and cash collateral | | — | | — | | — | | (5,785) | | | (798) | | | (6,583) | |
| Total derivative assets | | 7 | | 6,768 | | 492 | | (5,785) | | (798) | | 684 |
| Short-term investments | | 1 | | 1,454 | | — | | — | | — | | 1,455 |
| Market risk benefit assets | | — | | — | | 610 | | — | | — | | 610 |
| Separate account assets | | 105,221 | | 3,890 | | — | | — | | — | | 109,111 |
| Total | | $ | 105,474 | | $ | 189,723 | | $ | 26,030 | | $ | (5,785) | | $ | (798) | | $ | 314,644 |
| Liabilities: | | | | | | | | | | | | |
Policyholder contract deposits(f) | Policyholder contract deposits(f) | $ | — | | $ | 130 | | $ | 5,572 | | $ | — | | $ | — | | $ | 5,702 |
| Derivative liabilities: | | | | | | | | | | | | |
| Interest rate contracts | | 1 | | 1,575 | | — | | — | | — | | 1,576 |
| Foreign exchange contracts | | — | | 366 | | — | | — | | — | | 366 |
| Equity contracts | | 1 | | 4,048 | | 22 | | — | | — | | 4,071 |
| Credit contracts | | — | | — | | — | | — | | — | | — |
| Other contracts | | — | | — | | — | | — | | — | | — |
| Counterparty netting and cash collateral | | — | | — | | — | | (5,785) | | | (37) | | | (5,822) | |
| Total derivative liabilities | | 2 | | 5,989 | | 22 | | (5,785) | | (37) | | 191 |
Fortitude Re funds withheld payable(g) | | — | | — | | 7,974 | | — | | — | | 7,974 |
| Market risk benefit liabilities | | — | | — | | 7,499 | | — | | — | | 7,499 |
| Debt of consolidated investment entities | | — | | — | | 5 | | — | | — | | 5 |
| Total | | $ | 2 | | $ | 6,119 | | $ | 21,072 | | $ | (5,785) | | $ | (37) | | $ | 21,371 |
(a)Represents netting of derivative exposures covered by qualifying master netting agreements.
(b)Includes investments in RMBS issued by related parties of $37 million and $2 million classified as Level 2 and Level 3, respectively, as of December 31, 2022. Additionally, includes investments in RMBS issued by related parties of $38 million and $9 million classified as Level 2 and Level 3, respectively, as of December 31, 2021.
(c)Includes investments in collateralized loan obligations (“CLOs”) issued by related parties of $0 and $862 million as of December 31, 2022 and December 31, 2021, respectively. The $862 million of CLOs are classified as Level 3.
(d)Includes less than $1 million of investments in RMBS issued by related parties classified as Level 2 as of December 31, 2022 and December 31, 2021.
(e)Excludes investments that are measured at fair value using the net asset value (“NAV”) per share (or its equivalent), which totaled $6.0 billion and $5.2 billion as of December 31, 2022 and December 31, 2021, respectively.
ITEM 8 | Notes to Consolidated Financial Statements | 4. Fair Value Measurements
(f)Excludes basis adjustments for fair value hedges.
(g)As discussed in Note 7, the Fortitude Re funds withheld payable is created through modco and funds withheld reinsurance arrangements where the investments supporting the reinsurance agreements are withheld by and continue to reside on Corebridge’s balance sheet. This embedded derivative is valued as a total return swap with reference to the fair value of the invested assets held by Corebridge, which are primarily available-for-sale securities.
CHANGES IN LEVEL 3 RECURRING FAIR VALUE MEASUREMENTS
The following tables present changes during the years ended December 31, 2022 and 2021 in Level 3 assets and liabilities measured at fair value on a recurring basis, and the realized and unrealized gains (losses) related to the Level 3 assets and liabilities in the Consolidated Balance Sheets at December 31, 2022 and 2021:
| | | | | | | | | | | | | | | | | | | | | | | | | | | | | | | | | | | | | | | | | | | | | | | | | | | | | | | | | | | | | | | | |
| (in millions) | | Fair Value
Beginning
of Year | | Net
Realized
and
Unrealized Gains
(Losses)
Included
in Income | | Other
Comprehensive
Income (Loss) | | Purchases,
Sales,
Issuances
and
Settlements,
Net | | Gross
Transfers
In | | Gross
Transfers
Out | | | | Other | | Fair Value
End
of Year | | Changes in
Unrealized
Gains
(Losses)
Included in
Income on
Instruments
Held at
End of Year | | Changes in
Unrealized
Gain (Losses)
Included in
Other Comprehensive Income (Loss)
for Recurring
Level 3 Instruments
Held at
End of Year |
| December 31, 2022 | | | | | | | | | | | | | | | | | | | | | | |
| Assets: | | | | | | | | | | | | | | | | | | | | | | |
| Bonds available for sale: | | | | | | | | | | | | | | | | | | | | | | |
Obligations of states,
municipalities and
political subdivisions | | $ | 1,395 | | | $ | 1 | | | $ | (525) | | | $ | (95) | | | $ | 40 | | | $ | (11) | | | | | $ | — | | | $ | 805 | | | $ | — | | | $ | (221) | |
| Corporate debt | | 1,907 | | | 17 | | | (192) | | | (159) | | | 911 | | | (516) | | | | | — | | | 1,968 | | | — | | | (174) | |
| RMBS | | 7,595 | | | 322 | | | (986) | | | (834) | | | 7 | | | (434) | | | | | — | | | 5,670 | | | — | | | (610) | |
| CMBS | | 1,072 | | | 9 | | | (140) | | | 38 | | | 45 | | | (306) | | | | | — | | | 718 | | | — | | | (115) | |
| CLO | | 3,038 | | | (31) | | | (163) | | | (105) | | | 1,305 | | | (1,673) | | | | | (701) | | | 1,670 | | | — | | | (76) | |
| ABS | | 7,400 | | | 131 | | | (1,417) | | | 3,283 | | | 218 | | | (20) | | | | | — | | | 9,595 | | | — | | | (1,369) | |
| Total bonds available for sale | | 22,407 | | | 449 | | | (3,423) | | | 2,128 | | | 2,526 | | | (2,960) | | | | | (701) | | | 20,426 | | | — | | | (2,565) | |
| Other bond securities: | | | | | | | | | | | | | | | | | | | | | | |
| Corporate debt | | 134 | | | (5) | | | — | | | 158 | | | 335 | | | (205) | | | | | — | | | 417 | | | (2) | | | — | |
| RMBS | | 106 | | | (23) | | | — | | | 24 | | | — | | | — | | | | | — | | | 107 | | | (22) | | | — | |
| CMBS | | 33 | | | (5) | | | — | | | — | | | — | | | — | | | | | — | | | 28 | | | (4) | | | — | |
| CLO | | 149 | | | 1 | | | — | | | (131) | | | 70 | | | (78) | | | | | — | | | 11 | | | (5) | | | — | |
| ABS | | 205 | | | (117) | | | — | | | 653 | | | — | | | — | | | | | — | | | 741 | | | (132) | | | — | |
| Total other bond securities | | 627 | | | (149) | | | — | | | 704 | | | 405 | | | (283) | | | | | — | | | 1,304 | | | (165) | | | — | |
| Equity securities | | 2 | | | (1) | | | — | | | 23 | | | 2 | | | — | | | | | — | | | 26 | | | (1) | | | — | |
| Other invested assets | | 1,892 | | | 313 | | | (22) | | | (195) | | | 24 | | | (180) | | | | | — | | | 1,832 | | | 329 | | | — | |
| | | | | | | | | | | | | | | | | | | | | | |
Total(a) | | $ | 24,928 | | | $ | 612 | | | $ | (3,445) | | | $ | 2,660 | | | $ | 2,957 | | | $ | (3,423) | | | | | $ | (701) | | | $ | 23,588 | | | $ | 163 | | | $ | (2,565) | |
ITEM 8 | Notes to Consolidated Financial Statements | 4. Fair Value Measurements
| | | | | | | | | | | | | | | | | | | | | | | | | | | | | | | | | | | | | | | | | | | | | | | | | | | | | | | | | | | | | | | | |
| (in millions) | | Fair Value
Beginning
of Year | | Net
Realized
and
Unrealized (Gains)
Losses
Included
in Income | | Other
Comprehensive
(Income) Loss | | Purchases,
Sales,
Issuances
and
Settlements,
Net | | Gross
Transfers
In | | Gross
Transfers
Out | | | | Other | | Fair Value
End
of Year | | Changes in
Unrealized
Gains
(Losses)
Included in Income on Instruments Held at
End of Year | | Changes in
Unrealized
Gain (Losses)
Included in
Other Comprehensive Income (Loss)
for Recurring
Level 3 Instruments
Held at
End of Year |
| Liabilities: | | | | | | | | | | | | | | | | | | | | | | |
| Policyholder contract deposits | | $ | 5,572 | | | $ | (1,107) | | | $ | — | | | $ | 902 | | | $ | — | | | $ | — | | | | | $ | — | | | $ | 5,367 | | | $ | 1,363 | | | $ | — | |
| Derivative liabilities, net: | | | | | | | | | | | | | | | | | | | | | | |
| Interest rate contracts | | — | | | 1 | | | — | | | (304) | | | — | | | — | | | | | — | | | (303) | | | (1) | | | — | |
| Foreign exchange contracts | | — | | | (1) | | | — | | | 1 | | | — | | | — | | | | | — | | | — | | | — | | | — | |
| Equity contracts | | (457) | | | 494 | | | — | | | (304) | | | — | | | — | | | | | — | | | (267) | | | (249) | | | — | |
| Credit contracts | | (1) | | | 1 | | | — | | | — | | | — | | | — | | | | | — | | | — | | | — | | | — | |
| Other contracts | | (12) | | | (63) | | | — | | | 61 | | | — | | | — | | | | | — | | | (14) | | | 63 | | | — | |
Total derivative liabilities, net(b) | | (470) | | | 432 | | | — | | | (546) | | | — | | | — | | | | | — | | | (584) | | | (187) | | | — | |
| Fortitude Re funds withheld payable | | 7,974 | | | (6,348) | | | — | | | (364) | | | — | | | — | | | | | — | | | 1,262 | | | 6,689 | | | — | |
| | | | | | | | | | | | | | | | | | | | | | |
| Debt of consolidated investment entities | | 5 | | | — | | | — | | | 1 | | | — | | | — | | | | | — | | | 6 | | | (1) | | | — | |
Total(c) | | $ | 13,081 | | | $ | (7,023) | | | $ | — | | | $ | (7) | | | $ | — | | | $ | — | | | | | $ | — | | | $ | 6,051 | | | $ | 7,864 | | | $ | — | |
| | | | | | | | | | | | | | | | | | | | | | | | | | | | | | | | | | | | | | | | | | | | | | | | | | | | | | | | | | | | | | |
| (in millions) | | Fair Value
Beginning
of Year | | Net
Realized
and
Unrealized Gains
(Losses)
Included
in Income | | Other
Comprehensive
Income (Loss) | | Purchases,
Sales,
Issuances
and
Settlements,
Net | | Gross
Transfers
In | | Gross
Transfers
Out | | Other | | Fair Value
End
of Year | | Changes in
Unrealized
Gains
(Losses)
Included in
Income on
Instruments
Held at
End of Year | | Changes in
Unrealized
Gain (Losses)
Included in
Other Comprehensive Income (Loss)
for Recurring
Level 3 Instruments
Held at
End of Year |
| December 31, 2021 | | | | | | | | | | | | | | | | | | | | |
| Assets: | | | | | | | | | | | | | | | | | | | | |
| Bonds available for sale: | | | | | | | | | | | | | | | | | | | | |
Obligations of states,
municipalities and
political subdivisions | | $ | 2,057 | | | $ | 7 | | | $ | (5) | | | $ | (342) | | | $ | — | | | $ | (260) | | | $ | (62) | | | $ | 1,395 | | | $ | — | | | $ | 36 | |
| Corporate debt | | 1,709 | | | (10) | | | (25) | | | 109 | | | 373 | | | (249) | | | — | | | 1,907 | | | — | | | 31 | |
| RMBS | | 8,104 | | | 415 | | | (104) | | | (782) | | | 8 | | | (46) | | | — | | | 7,595 | | | — | | | 787 | |
| CMBS | | 886 | | | 25 | | | (45) | | | 253 | | | 53 | | | (100) | | | — | | | 1,072 | | | — | | | 21 | |
| CLO | | 3,362 | | | (5) | | | (173) | | | 48 | | | 655 | | | (849) | | | — | | | 3,038 | | | — | | | (164) | |
| ABS | | 5,526 | | | 29 | | | (97) | | | 1,942 | | | — | | | — | | | — | | | 7,400 | | | — | | | 80 | |
| Total bonds available for sale | | 21,644 | | | 461 | | | (449) | | | 1,228 | | | 1,089 | | | (1,504) | | | (62) | | | 22,407 | | | — | | | 791 | |
| Other bond securities: | | | | | | | | | | | | | | | | | | | | |
| Corporate debt | | — | | | (1) | | | — | | | 135 | | | — | | | — | | | — | | | 134 | | | (1) | | | — | |
| RMBS | | 96 | | | 2 | | | — | | | 8 | | | — | | | — | | | — | | | 106 | | | — | | | — | |
| CMBS | | 45 | | | — | | | — | | | (17) | | | 5 | | | — | | | — | | | 33 | | | (2) | | | — | |
| CLO | | 193 | | | (4) | | | — | | | (40) | | | — | | | — | | | — | | | 149 | | | 15 | | | — | |
| ABS | | — | | | — | | | — | | | 205 | | | — | | | — | | | — | | | 205 | | | (1) | | | — | |
| Total other bond securities | | 334 | | | (3) | | | — | | | 291 | | | 5 | | | — | | | — | | | 627 | | | 11 | | | — | |
| Equity securities | | 42 | | | 11 | | | — | | | (120) | | | 70 | | | (1) | | | — | | | 2 | | | — | | | — | |
| Other invested assets | | 1,771 | | | 641 | | | (15) | | | (569) | | | 64 | | | — | | | — | | | 1,892 | | | 612 | | | — | |
| | | | | | | | | | | | | | | | | | | | |
Total(a) | | $ | 23,791 | | | $ | 1,110 | | | $ | (464) | | | $ | 830 | | | $ | 1,228 | | | $ | (1,505) | | | $ | (62) | | | $ | 24,928 | | | $ | 623 | | | $ | 791 | |
ITEM 8 | Notes to Consolidated Financial Statements | 4. Fair Value Measurements
| | | | | | | | | | | | | | | | | | | | | | | | | | | | | | | | | | | | | | | | | | | | | | | | | | | | | | | | | | | | | | |
| (in millions) | | Fair Value
Beginning
of Year | | Net
Realized
and
Unrealized (Gains)
Losses
Included
in Income | | Other
Comprehensive
(Income) Loss | | Purchases,
Sales,
Issuances
and
Settlements,
Net | | Gross
Transfers
In | | Gross
Transfers
Out | | Other | | Fair Value
End
of Year | | Changes in
Unrealized
Gains
(Losses)
Included in
Income on
Instruments
Held at
End of Year | | Changes in
Unrealized
Gains
(Losses)
Included in Income on Instruments Held at
End of Year |
| Liabilities: | | | | | | | | | | | | | | | | | | | | |
| Policyholder contract deposits | | $ | 4,830 | | | $ | 476 | | | $ | — | | | $ | 320 | | | $ | — | | | $ | (54) | | | $ | — | | | $ | 5,572 | | | $ | 837 | | | $ | — | |
| Derivative liabilities, net: | | | | | | | | | | | | | | | | | | | | |
| Interest rate contracts | | — | | | — | | | — | | | — | | | — | | | — | | | — | | | — | | | — | | | — | |
| Foreign exchange contracts | | — | | | — | | | — | | | — | | | — | | | — | | | — | | | — | | | — | | | — | |
| Equity contracts | | (146) | | | (22) | | | — | | | (271) | | | (71) | | | 53 | | | — | | | (457) | | | 19 | | | — | |
| Credit contracts | | (2) | | | 11 | | | — | | | (10) | | | — | | | — | | | — | | | (1) | | | (2) | | | — | |
| Other contracts | | (7) | | | (62) | | | — | | | 57 | | | — | | | — | | | — | | | (12) | | | 63 | | | — | |
Total derivative liabilities, net(b) | | (155) | | | (73) | | | — | | | (224) | | | (71) | | | 53 | | | — | | | (470) | | | 80 | | | — | |
| Fortitude Re funds withheld payable | | 7,749 | | | 687 | | | — | | | (462) | | | — | | | — | | | — | | | 7,974 | | | 1,766 | | | — | |
| | | | | | | | | | | | | | | | | | | | |
| Debt of consolidated investment entities | | 951 | | | 179 | | | — | | | (1,125) | | | — | | | — | | | — | | | 5 | | | 4 | | | — | |
Total(c) | | $ | 13,375 | | | $ | 1,269 | | | $ | — | | | $ | (1,491) | | | $ | (71) | | | $ | (1) | | | $ | — | | | $ | 13,081 | | | $ | 2,687 | | | $ | — | |
(a)Excludes MRB assets of $796 million and $610 million for the years ended December 31, 2022 and 2021, respectively. Refer to Note 13 for additional information.
(b)Total Level 3 derivative exposures have been netted in these tables for presentation purposes only.
(c)Excludes MRB liabilities of $4.7 billion and $7.5 billion for the years ended December 31, 2022 and 2021, respectively. Refer to Note 13 for additional information.
Change in the fair value of market risk benefits, net and net realized and unrealized gains and losses included in income related to Level 3 assets and liabilities shown above are reported in the Consolidated Statements of Income (Loss) as follows:
| | | | | | | | | | | | | | | | | | | | | | | | | | | | | | | | | | | | | | |
| (in millions) | | Policy
Fees | | Net Investment Income | | Net Realized and Unrealized Gains
(Losses) | | Interest Expense | | Change in the Fair Value of Market Risk Benefits, net(a) | | Total |
| December 31, 2022 | | | | | | | | | | | | |
| Assets: | | | | | | | | | | | | |
| Bonds available for sale | | $ | — | | $ | 516 | | $ | (67) | | $ | — | | $ | — | | $ | 449 |
| Other bond securities | | — | | (149) | | — | | — | | — | | (149) |
| Equity securities | | — | | (1) | | — | | — | | — | | (1) |
| Other invested assets | | — | | 321 | | (8) | | — | | — | | 313 |
| December 31, 2021 | | | | | | | | | | | | |
| Assets: | | | | | | | | | | | | |
| Bonds available for sale | | $ | — | | $ | 472 | | $ | (11) | | $ | — | | $ | — | | | $ | 461 |
| Other bond securities | | — | | (3) | | — | | — | | — | | | (3) |
| Equity securities | | — | | 11 | | — | | — | | — | | | 11 |
| Other invested assets | | — | | 630 | | 11 | | — | | — | | 641 |
ITEM 8 | Notes to Consolidated Financial Statements | 4. Fair Value Measurements
| | | | | | | | | | | | | | | | | | | | | | | | | | | | | | | | | | | | | | |
| (in millions) | | Policy
Fees | | Net Investment Income | | Net Realized and Unrealized Gains
(Losses) | | Interest Expense | | Change in the Fair Value of Market Risk Benefits(a) | | Total |
| December 31, 2022 | | | | | | | | | | | | |
| Liabilities: | | | | | | | | | | | | |
Policyholder contract deposits(b) | | $ | — | | $ | — | | $ | 1,107 | | $ | — | | $ | — | | $ | 1,107 |
| Derivative liabilities, net | | 61 | | — | | (577) | | — | | 84 | | (432) |
| Fortitude Re funds withheld payable | | — | | — | | 6,348 | | — | | — | | 6,348 |
Market risk benefit liabilities, net(c) | | — | | — | | — | | — | | (2,344) | | (2,344) |
Debt of consolidated investment entities(d) | | — | | — | | — | | — | | — | | — |
| December 31, 2021 | | | | | | | | | | | | |
| Liabilities: | | | | | | | | | | | | |
Policyholder contract deposits(b) | | $ | — | | $ | — | | $ | (476) | | $ | — | | $ | — | | $ | (476) |
| Derivative liabilities, net | | 59 | | | — | | 30 | | | — | | (16) | | 73 |
| Fortitude Re funds withheld payable | | — | | — | | (687) | | — | | — | | (687) |
Market risk benefit liabilities, net(c) | | — | | — | | — | | — | | (2,264) | | (2,264) |
Debt of consolidated investment entities(d) | | — | | — | | — | | 179 | | — | | 179 |
(a) The portion of the fair value change attributable to our own credit risk is recognized in OCI.
(b) Primarily embedded derivatives.
(c) Market risk benefit assets and liabilities have been netted in these tables for presentation purposes only.
(d) For the year ended December 31, 2021, includes $145 million of loss on extinguishment of debt, and $34 million of interest expense.
The following table presents the gross components of purchases, sales, issuances and settlements, net, shown above, for years ended December 31, 2022 and 2021 related to Level 3 assets and liabilities in the Consolidated Balance Sheets:
| | | | | | | | | | | | | | | | | | | | | | | | | | |
| (in millions) | | Purchases | | Sales | | Issuances and Settlements(a) | | Purchases, Sales, Issuances and Settlements, Net(a) |
| December 31, 2022 | | | | | | | | |
| Assets: | | | | | | | | |
| Bonds available for sale: | | | | | | | | |
| Obligations of states, municipalities and political subdivisions | | $ | — | | $ | (60) | | $ | (35) | | $ | (95) |
| Corporate debt | | 85 | | (39) | | (205) | | (159) |
| RMBS | | 377 | | — | | (1,211) | | (834) |
| CMBS | | 118 | | (9) | | (71) | | 38 |
| CLO | | 514 | | (27) | | (592) | | (105) |
| ABS | | 3,110 | | — | | 173 | | 3,283 |
| Total bonds available for sale | | 4,204 | | (135) | | (1,941) | | 2,128 |
| Other bond securities: | | | | | | | | |
| Corporate debt | | 29 | | (3) | | 132 | | 158 |
| RMBS | | 38 | | — | | (14) | | 24 |
| CMBS | | — | | — | | — | | — |
| CLO | | 16 | | (123) | | (24) | | (131) |
| ABS | | 675 | | — | | (22) | | 653 |
| Total other bond securities | | 758 | | (126) | | 72 | | 704 |
| Equity securities | | 22 | | — | | 1 | | 23 |
| Other invested assets | | 652 | | — | | (847) | | (195) |
| | | | | | | | |
| Total assets | | $ | 5,636 | | $ | (261) | | $ | (2,715) | | $ | 2,660 |
| Liabilities: | | | | | | | | |
| Policyholder contract deposits | | $ | — | | $ | 923 | | $ | (21) | | $ | 902 |
| Derivative liabilities, net | | (421) | | — | | (125) | | (546) |
| Fortitude Re funds withheld payable | | — | | — | | (364) | | (364) |
| | | | | | | | |
| Debt of consolidated investment entities | | — | | — | | 1 | | 1 |
| Total liabilities | | $ | (421) | | $ | 923 | | $ | (509) | | $ | (7) |
ITEM 8 | Notes to Consolidated Financial Statements | 4. Fair Value Measurements
| | | | | | | | | | | | | | | | | | | | | | | | | | |
| (in millions) | | Purchases | | Sales | | Issuances and Settlements(a) | | Purchases, Sales, Issuances and Settlements, Net(a) |
| December 31, 2021 | | | | | | | | |
| Assets: | | | | | | | | |
| Bonds available for sale: | | | | | | | | |
| Obligations of states, municipalities and political subdivisions | | $ | 36 | | $ | (212) | | | $ | (166) | | | $ | (342) |
| Corporate debt | | 424 | | (36) | | | (279) | | | 109 |
| RMBS | | 637 | | (1) | | (1,418) | | | (782) | |
| CMBS | | 334 | | (15) | | | (66) | | | 253 |
| CLO | | 923 | | — | | | (875) | | | 48 |
| ABS | | 3,202 | | (21) | | | (1,239) | | | 1,942 |
| Total bonds available for sale | | 5,556 | | (285) | | (4,043) | | 1,228 |
| Other bond securities: | | | | | | | | |
| Corporate debt | | 86 | | — | | 49 | | | 135 |
| RMBS | | 28 | | — | | (20) | | 8 |
| CMBS | | — | | (17) | | — | | (17) |
| CLO | | 7 | | — | | | (47) | | | (40) | |
| ABS | | 207 | | — | | | (2) | | | 205 | |
| Total other bond securities | | 328 | | (17) | | (20) | | 291 |
| Equity securities | | 2 | | — | | (122) | | (120) |
| Other invested assets | | 578 | | — | | (1,147) | | | (569) |
| | | | | | | | |
| Total assets | | $ | 6,464 | | $ | (302) | | $ | (5,332) | | $ | 830 |
| Liabilities: | | | | | | | | |
| Policyholder contract deposits | | $ | — | | $ | 710 | | $ | (390) | | | $ | 320 |
| Derivative liabilities, net | | (272) | | | — | | 48 | | (224) |
| Fortitude Re funds withheld payable | | — | | — | | (462) | | | (462) | |
| | | | | | | | |
| Debt of consolidated investment entities | | — | | — | | (1,125) | | (1,125) |
| Total liabilities | | $ | (272) | | $ | 710 | | $ | (1,929) | | $ | (1,491) |
(a) There were no issuances during the years ended December 31, 2022 and 2021.Both observable and unobservable inputs may be used to determine the fair values of positions classified in Level 3 in the tables above. As a result, the unrealized gains (losses) on instruments held at December 31, 2022 and 2021 may include changes in fair value that were attributable to both observable (e.g., changes in market interest rates) and unobservable inputs (e.g., changes in unobservable long-dated volatilities).
Transfers of Level 3 Assets and Liabilities
We record transfers of assets and liabilities into or out of Level 3 at their fair values as of the end of each reporting period, consistent with the date of the determination of fair value. The net realized and unrealized gains (losses) included in net income (loss) or Other comprehensive income (loss) as shown in the table above excludes $(92) million and $17 million of net gains (losses) related to assets transferred into Level 3 during 2022 and 2021, respectively, and includes $(142) million and $(19) million of net gains (losses) related to assets transferred out of Level 3 during 2022 and 2021, respectively.
Transfers of Level 3 Assets
During the years ended December 31, 2022 and 2021, transfers into Level 3 assets primarily included certain investments in private placement corporate debt, CMBS, CLO and ABS. Transfers of private placement corporate debt and certain ABS into Level 3 assets were primarily the result of limited market pricing information that required us to determine fair value for these securities based on inputs that are adjusted to better reflect our own assumptions regarding the characteristics of a specific security or associated market liquidity. The transfers of investments in CMBS, CLO and certain ABS into Level 3 assets were due to diminished market transparency and liquidity for individual security types.
During the years ended December 31, 2022 and 2021, transfers out of Level 3 assets primarily included private placement and other corporate debt, CMBS, RMBS, CLO, ABS and certain investments in municipal securities. Transfers of certain investments in municipal securities, corporate debt, RMBS, CMBS and CLO and ABS out of Level 3 assets were based on consideration of market liquidity as well as related transparency of pricing and associated observable inputs for these investments. Transfers of certain investments in private placement corporate debt and certain ABS out of Level 3 assets were primarily the result of using observable pricing information that reflects the fair value of those securities without the need for adjustment based on our own assumptions regarding the characteristics of a specific security or the current liquidity in the market.
ITEM 8 | Notes to Consolidated Financial Statements | 4. Fair Value Measurements
Transfers of Level 3 Liabilities
There were no significant transfers of derivative or other liabilities into or out of Level 3 for the year ended December 31, 2022. During the year ended December 31, 2021, transfers of Level 3 liabilities primarily included certain equity derivatives.
QUANTITATIVE INFORMATION ABOUT LEVEL 3 FAIR VALUE MEASUREMENTS
The table below presents information about the significant unobservable inputs used for recurring fair value measurements for certain Level 3 instruments, and includes only those instruments for which information about the inputs is reasonably available to us, such as data from independent third-party valuation service providers and from internal valuation models. Because input information from third parties with respect to certain Level 3 instruments (primarily CLO/ABS) may not be reasonably available to us, balances shown below may not equal total amounts reported for such Level 3 assets and liabilities: | | | | | | | | | | | | | | | | | | | | | | | | | | |
| (in millions) | | Fair Value at December 31, 2022 | | Valuation
Technique | | Unobservable Input(a) | | Range (Weighted Average)(b) |
| Assets: | | | | | | | | |
| Obligations of states, municipalities and political subdivisions | | $ | 780 | | Discounted cash flow | | Yield | | 5.33%-5.92% (5.63%) |
| Corporate debt | | 1,988 | | Discounted cash flow | | Yield | | 4.90% - 9.54% (7.22%) |
RMBS(c) | | 3,725 | | Discounted cash flow | | Constant prepayment rate | | 4.84% - 10.35% (7.60%) |
| | | | | | Loss severity | | 45.01% - 77.28% (61.14%) |
| | | | | | Constant default rate | | 0.79% - 2.67% (1.73%) |
| | | | | | Yield | | 5.95% - 7.72% (6.84%) |
CLO(c) | | 1,547 | | Discounted cash flow | | Yield | | 7.13% - 7.59% (7.36%) |
ABS(c) | | 6,591 | | Discounted cash flow | | Yield | | 6.01% - 7.96% (6.98%) |
| CMBS | | 663 | | Discounted cash flow | | Yield | | 4.72% - 10.21% (7.46%) |
| Market risk benefit assets | | 796 | | Discounted cash flow | | Equity volatility | | 6.45% - 50.75% |
| | | | | | Base lapse rate | | 0.16% - 28.80% |
| | | | | | Dynamic lapse multiplier(e) | | 20.00% - 186.18% |
| | | | | | Mortality multiplier(e)(f) | | 38.25% - 160.01% |
| | | | | | Utilization(h) | | 80.00% - 100.00% |
| | | | | | Equity / interest-rate correlation | | 0.00% - 30.00% |
| | | | | | NPA (g) | | 0.00% - 2.03% |
Liabilities(d): | | | | | | | | |
| Market risk benefit liabilities | | | | | | | | |
| Variable annuities guaranteed benefits | | $ | 2,358 | | Discounted cash flow | | Equity volatility | | 6.45% - 50.75% |
| | | | | | Base lapse rate | | 0.16% - 28.80% |
| | | | | | Dynamic lapse multiplier(e) | | 20.00% - 186.18% |
| | | | | | Mortality multiplier(e)(f) | | 38.25% - 160.01% |
| | | | | | Utilization(h) | | 80.00% - 100.00% |
| | | | | | Equity / interest-rate correlation | | 0.00% - 30.00% |
| | | | | | NPA (g) | | 0.00% - 2.03% |
| Fixed annuities guaranteed benefits | | 680 | | Discounted cash flow | | Base lapse rate | | 0.20% - 15.75% |
| | | | | | Dynamic lapse multiplier(e) | | 20.00% - 186.16% |
| | | | | | Mortality multiplier(e)(f) | | 40.26% - 168.43% |
| | | | | | Utilization(h) | | 90.00% - 97.50% |
| | | | | | NPA (g) | | 0.00% - 2.03% |
ITEM 8 | Notes to Consolidated Financial Statements | 4. Fair Value Measurements
| | | | | | | | | | | | | | | | | | | | | | | | | | |
| (in millions) | | Fair Value at December 31, 2022 | | Valuation
Technique | | Unobservable Input(a) | | Range (Weighted Average)(b) |
| Fixed index annuities guaranteed benefits | | 1,698 | | Discounted cash flow | | Equity volatility | | 6.45% - 50.75% |
| | | | | | Base lapse rate | | 0.20% - 50.00% |
| | | | | | Dynamic lapse multiplier(e) | | 20.00% - 186.18% |
| | | | | | Mortality multiplier(e)(f) | | 24.00% - 180.00% |
| | | | | | Utilization(h) | | 60.00% - 97.50% |
| | | | | | Option budget | | 0.00% - 5.00% |
| | | | | | Equity / interest-rate correlation | | 0.00% - 30.00% |
| | | | | | NPA (g) | | 0.00% - 2.03% |
| Embedded derivatives within Policyholder contract deposits: | | | | | | | | |
Index credits on fixed index annuities(i) | | 4,657 | | Discounted cash flow | | Equity volatility | | 6.45% - 50.75% |
| | | | | | Base lapse rate | | 0.20% - 50.00% |
| | | | | | Dynamic lapse multiplier(e) | | 20.00% - 186.18% |
| | | | | | Mortality multiplier(e)(f) | | 24.00% - 180.00% |
| | | | | | Utilization(h) | | 60.00% - 97.50% |
| | | | | | Option Budget | | 0.00% - 5.00% |
| | | | | | Equity / interest-rate correlation | | 0.00% - 30.00% |
| | | | | | NPA (g) | | 0.00% - 2.03% |
| | | | | | | | |
| Index Life | | 710 | | Discounted cash flow | | Base lapse rate | | 0.00% - 37.97% |
| | | | | | Mortality rate | | 0.00% - 100.00% |
| | | | | | Equity volatility | | 5.75%- 23.63% |
| | | | | | NPA(g) | | 0.00% - 2.03% |
| | | | | | | | |
| | | | | | | | |
| | | | | | | | |
| | | | | | | | |
| | | | | | | | | | | | | | | | | | | | | | | | | | |
| (in millions) | | Fair Value at December 31, 2021 | | Valuation
Technique | | Unobservable Input(a) | | Range (Weighted Average)(b) |
| Assets: | | | | | | | | |
| Obligations of states, municipalities and political subdivisions | | $ | 1,364 | | Discounted cash flow | | Yield | | 2.92% - 3.27% (3.10%) |
| Corporate debt | | 1,789 | | Discounted cash flow | | Yield | | 1.75% - 7.05% (4.40%) |
RMBS(c) | | 7,141 | | Discounted cash flow | | Constant prepayment | | 5.18% - 18.41% (11.79%) |
| | | | | | Loss severity | | 24.87% - 72.64% (48.75%) |
| | | | | | Constant default rate | | 1.01% - 5.74% (3.37%) |
| | | | | | Yield | | 1.72% - 4.08% (2.90%) |
CLO(c) | | 3,174 | | Discounted cash flow | | Yield | | 2.94% - 4.93% (3.94%) |
ABS(c) | | 5,077 | | Discounted cash flow | | Yield | | 1.89% - 3.36% (2.63%) |
| CMBS | | 887 | | Discounted cash flow | | Yield | | 1.54% - 4.49% (3.02%) |
| Market risk benefit assets | | 610 | | Discounted cash flow | | Equity volatility | | 5.95% - 46.65% |
| | | | | | Base lapse rate | | 0.16% - 28.80% |
| | | | | | Dynamic lapse multiplier(e) | | 20.00% - 186.18% |
| | | | | | Mortality multiplier(e)(f) | | 38.25% - 160.01% |
| | | | | | Utilization(h) | | 80.00% - 100.00% |
| | | | | | Equity / interest-rate correlation | | 0.00% - 40.00% |
| | | | | | NPA (g) | | 0.01% - 1.40% |
| | | | | | | | |
Liabilities(d): | | | | | | | | |
| Market risk benefit liabilities | | | | | | | | |
| Variable annuities guaranteed benefits | | $ | 3,912 | | Discounted cash flow | | Equity volatility | | 5.95% - 46.65% |
| | | | | | Base lapse rate | | 0.16% - 28.80% |
| | | | | | Dynamic lapse multiplier(e) | | 20.00% - 186.18% |
| | | | | | Mortality multiplier(e)(f) | | 38.25% - 160.01% |
| | | | | | Utilization(h) | | 80.00% - 100.00% |
| | | | | | Equity / interest-rate correlation | | 0.00% - 40.00% |
| | | | | | NPA (g) | | 0.01% - 1.40% |
ITEM 8 | Notes to Consolidated Financial Statements | 4. Fair Value Measurements
| | | | | | | | | | | | | | | | | | | | | | | | | | |
| (in millions) | | Fair Value at December 31, 2021 | | Valuation
Technique | | Unobservable Input(a) | | Range (Weighted Average)(b) |
| Fixed annuities guaranteed benefits | | 992 | | | Discounted cash flow | | Base lapse rate | | 0.20% - 15.75% |
| | | | | | Dynamic lapse multiplier(e) | | 20.00% - 186.16% |
| | | | | | Mortality multiplier(e)(f) | | 40.26% - 168.43% |
| | | | | | Utilization(h) | | 90.00% - 97.50% |
| | | | | | NPA (g) | | 0.01% - 1.40% |
| Fixed index annuities guaranteed benefits | | 2,595 | | | Discounted cash flow | | Equity volatility | | 5.95% - 46.65% |
| | | | | | Base lapse rate | | 0.20% - 50.00% |
| | | | | | Dynamic lapse multiplier(e) | | 20.00% - 186.18% |
| | | | | | Mortality multiplier(e)(f) | | 24.00% - 180.00% |
| | | | | | Utilization(h) | | 60.00% - 97.50% |
| | | | | | Option Budget | | 0.00% - 4.00% |
| | | | | | Equity / interest-rate correlation | | 0.00% - 40.00% |
| | | | | | NPA (g) | | 0.01% - 1.40% |
| Embedded derivatives within Policyholder contract deposits: | | | | | | | | |
Index credits on fixed index annuities(i) | | 4,807 | | | Discounted cash flow | | Equity volatility | | 5.95% - 46.65% |
| | | | | | Base lapse rate | | 0.20% - 50.00% |
| | | | | | Dynamic lapse multiplier(e) | | 20.00% - 186.18% |
| | | | | | Mortality multiplier(e)(f) | | 24.00% - 180.00% |
| | | | | | Utilization(h) | | 60.00% - 97.50% |
| | | | | | Option Budget | | 0.00% - 4.00% |
| | | | | | Equity / interest-rate correlation | | 0.00% - 40.00% |
| | | | | | NPA (g) | | 0.01% - 1.40% |
| Index Life | | 765 | | | Discounted cash flow | | Base lapse rate | | 0.00% - 37.97% |
| | | | | | Mortality rate | | 0.00% - 100.00% |
| | | | | | Equity volatility | | 7.65% - 20.70% |
| | | | | | NPA(g) | | 0.01% - 1.40% |
| | | | | | | | |
| | | | | | | | |
| | | | | | | | |
| | | | | | | | |
(a)Represents discount rates, estimates and assumptions that we believe would be used by market participants when valuing these assets and liabilities.
(b)The weighted averaging for fixed maturity securities is based on the estimated fair value of the securities. Because the valuation methodology for embedded derivatives within policyholder contract deposits and MRBs uses a range of inputs that vary at the contract level over the cash flow projection period, management believes that presenting a range, rather than weighted average, is a more meaningful representation of the unobservable inputs used in the valuation. Information received from third-party valuation service providers.
(c)Information received from third-party valuation service providers. The ranges of the unobservable inputs for constant prepayment rate, loss severity and constant default rate relate to each of the individual underlying mortgage loans that comprise the entire portfolio of securities in the RMBS and CLO securitization vehicles and not necessarily to the securitization vehicle bonds (tranches) purchased by us. The ranges of these inputs do not directly correlate to changes in the fair values of the tranches purchased by us because there are other factors relevant to the fair values of specific tranches owned by us, including, but not limited to, purchase price, position in the waterfall, senior versus subordinated position and attachment points.
(d)The Fortitude Re funds withheld payable has been excluded from the above table. As discussed in Note 7, the Fortitude Re funds withheld payable is created through modco and funds withheld reinsurance arrangements where the investments supporting the reinsurance agreements are withheld by and continue to reside on Corebridge’s balance sheet. This embedded derivative is valued as a total return swap with reference to the fair value of the invested assets held by Corebridge. Accordingly, the unobservable inputs utilized in the valuation of the embedded derivative are a component of the invested assets supporting the reinsurance agreements that are held on Corebridge’s balance sheet.
(e)The ranges for these inputs vary due to the different GMWB product specification and policyholder characteristics across in force policies. Policyholder characteristics that affect these ranges include age, policy duration, and gender.
(f)Mortality inputs are shown as multipliers of the 2012 Individual Annuity Mortality Basic table.
(g)The non-performance risk adjustment (“NPA”) applied as a spread over risk-free curve for discounting.
(h)The partial withdrawal utilization unobservable input range shown applies only to policies with guaranteed minimum withdrawal benefit riders. The total embedded derivative liability at December 31, 2022 and 2021 was approximately $1.1 billion and $1.1 billion, respectively.
(i)The fixed index annuities embedded derivative associated with index credits related to the contracts with guaranteed product features included in policyholder contract deposits was $1,078 million and $1,075 million at December 31, 2022 and 2021, respectively.
The ranges of reported inputs for obligations of states, municipalities and political subdivisions, corporate debt, RMBS, CLO/ABS and CMBS valued using a discounted cash flow technique consist of one standard deviation in either direction from the value-weighted average. The preceding table does not give effect to our risk management practices that might offset risks inherent in these Level 3 assets and liabilities.
ITEM 8 | Notes to Consolidated Financial Statements | 4. Fair Value Measurements
Interrelationships Between Unobservable Inputs
We consider unobservable inputs to be those for which market data is not available and that are developed using the best information available to us about the assumptions that market participants would use when pricing the asset or liability. Relevant inputs vary depending on the nature of the instrument being measured at fair value. The following paragraphs provide a general description of significant unobservable inputs along with interrelationships between and among the significant unobservable inputs and their impact on the fair value measurements. In practice, simultaneous changes in assumptions may not always have a linear effect on the inputs discussed below. Interrelationships may also exist between observable and unobservable inputs. Such relationships have not been included in the discussion below. For each of the individual relationships described below, the inverse relationship would also generally apply.
Fixed Maturity Securities
The significant unobservable input used in the fair value measurement of fixed maturity securities is yield. The yield is affected by the market movements in credit spreads and U.S. Treasury yields. The yield may be affected by other factors, including constant prepayment rates, loss severity and constant default rates. In general, increases in the yield would decrease the fair value of investments, and conversely, decreases in the yield would increase the fair value of investments.
MRBs and Embedded Derivatives within Policyholder Contract Deposits
For MRBs and embedded derivatives, the assumptions for unobservable inputs vary throughout the period over which cash flows are projected for valuation purposes. The following are applicable unobservable inputs:
•Long-term equity volatilities represent equity volatility beyond the period for which observable equity volatilities are available. Increases in assumed volatility will generally increase the fair value of both the projected cash flows from rider fees as well as the projected cash flows related to benefit payments. Therefore, the net change in the fair value of the liability may be either a decrease or an increase, depending on the relative changes in projected rider fees and projected benefit payments.
•Equity and interest rate correlation estimates the relationship between changes in equity returns and interest rates in the economic scenario generator used to value our MRBs. In general, a higher positive correlation assumes that equity markets and interest rates move in a more correlated fashion, which generally increases the fair value of the liability. Only our fixed index annuities with a GMWB rider are subject to the equity and interest correlation assumption. Other policies such as accumulation fixed index annuity and life products do not use a correlation assumption.
•Base lapse rate assumptions are determined by company experience and judgment and are adjusted at the contract level using a dynamic lapse function, which reduces the base lapse rate when the contract is in-the-money (when the contract holder’s guaranteed value, as estimated by the company, is worth more than their underlying account value). Lapse rates are also generally assumed to be lower in periods when a surrender charge applies. Increases in assumed lapse rates will generally decrease the fair value of the liability as fewer policyholders would persist to collect guaranteed benefits amounts.
•Mortality rate assumptions, which vary by age and gender, are based on company experience and include a mortality improvement assumption. Increases in assumed mortality rates will decrease the fair value of the GMWB liability, while lower mortality rate assumptions will generally increase the fair value of the liability because guaranteed withdrawal payments will be made for a longer period of time and generally exceed any decrease in guaranteed death benefits.
•Utilization assumptions estimate the timing when policyholders with a GMWB will elect to utilize their benefit and begin taking withdrawals. The assumptions may vary by the type of guarantee, tax-qualified status, the contract’s withdrawal history and the age of the policyholder. Utilization assumptions are based on company experience, which includes partial withdrawal behavior. Increases in assumed utilization rates will generally increase the fair value of the liability.
•Non-performance or “own credit” risk adjustment used in the valuation of MRBs and embedded derivatives, which reflects a market participant’s view of our claims-paying ability by incorporating a different spread (the NPA spread) to the curve used to discount projected benefit cash flows. When corporate credit spreads widen, the change in the NPA spread generally reduces the fair value of the MRBs and embedded derivatives, resulting in a gain in AOCI or Net realized gains (losses), respectively, and when corporate credit spreads narrow or tighten, the change in the NPA spread generally increases the fair value of the MRBs and embedded derivatives, resulting in a loss in AOCI or Net realized gains (losses), respectively.
•The projected cash flows incorporate best estimate assumptions for policyholder behavior (including mortality, lapses, withdrawals and benefit utilization), along with an explicit risk margin to reflect a market participant’s estimates of projected cash flows and policyholder behavior. Estimates of future policyholder behavior assumptions are subjective and based primarily on our historical experience.
ITEM 8 | Notes to Consolidated Financial Statements | 4. Fair Value Measurements
•For embedded derivatives, option budgets estimate the expected long-term cost of options used to hedge exposures associated with index price changes. The level of option budgets determines future costs of the options, which impacts the growth in account value and the valuation of embedded derivatives.
Embedded Derivatives within Reinsurance Contracts
The fair value of embedded derivatives associated with funds withheld reinsurance contracts is determined based upon a total return swap technique with reference to the fair value of the investments held by Corebridge related to Corebridge’s funds withheld payable. The fair value of the underlying assets is generally based on market observable inputs using industry standard valuation techniques. The valuation also requires certain significant inputs, which are generally not observable, and accordingly, the valuation is considered Level 3 in the fair value hierarchy.
INVESTMENTS IN CERTAIN ENTITIES CARRIED AT FAIR VALUE USING NET ASSET VALUE PER SHARE
The following table includes information related to our investments in certain other invested assets, including private equity funds, hedge funds and other alternative investments that calculate net asset value per share (or its equivalent). For these investments, which are measured at fair value on a recurring basis, we use the net asset value per share to measure fair value.
| | | | | | | | | | | | | | | | | | | | | | | | | | | | | | | | |
| | | | December 31, 2022 | | December 31, 2021 |
| (in millions) | | Investment Category Includes | | Fair Value
Using NAV
Per Share (or
its equivalent) | | Unfunded
Commitments | | Fair Value
Using NAV
Per Share (or
its equivalent) | | Unfunded
Commitments |
| Investment Category | | | | | | | | | | |
| Private equity funds: | | | | | | | | | | |
| Leveraged buyout | | Debt and/or equity investments made as part of a transaction in which assets of mature companies are acquired from the current shareholders, typically with the use of financial leverage | | $ | 2,014 | | | $ | 1,719 | | | $ | 1,762 | | | $ | 1,229 | |
| Real estate | | Investments in real estate properties and infrastructure positions, including power plants and other energy generating facilities | | 1,082 | | | 549 | | | 490 | | | 365 | |
| Venture capital | | Early-stage, high-potential, growth companies expected to generate a return through an eventual realization event, such as an initial public offering or sale of the company | | 212 | | | 118 | | | 194 | | | 135 | |
| Growth equity | | Funds that make investments in established companies for the purpose of growing their businesses | | 510 | | | 40 | | | 637 | | | 37 | |
| Mezzanine | | Funds that make investments in the junior debt and equity securities of leveraged companies | | 443 | | | 78 | | | 306 | | | 268 | |
| Other | | Includes distressed funds that invest in securities of
companies that are in default or under bankruptcy protection, as well as funds that have multi-strategy, and other strategies | | 902 | | | 284 | | | 921 | | | 324 | |
| Total private equity funds | | 5,163 | | | 2,788 | | | 4,310 | | | 2,358 | |
| Hedge funds: | | | | | | | | | | |
| Event-driven | | Securities of companies undergoing material structural changes, including mergers, acquisitions and other reorganizations | | 5 | | | — | | | 18 | | | — | |
| Long-short | | Securities that the manager believes are undervalued, with corresponding short positions to hedge market risk | | 335 | | | — | | | 404 | | | — | |
| Macro | | Investments that take long and short positions in financial instruments based on a top-down view of certain economic and capital market conditions | | 366 | | | — | | | 370 | | | — | |
| Other | | Includes investments held in funds that are less liquid, as well as other strategies which allow for broader allocation between public and private investments | | 178 | | | — | | | 110 | | | — | |
| Total hedge funds | | 884 | | | — | | | 902 | | | — | |
| Total | | $ | 6,047 | | | $ | 2,788 | | | $ | 5,212 | | | $ | 2,358 | |
ITEM 8 | Notes to Consolidated Financial Statements | 4. Fair Value Measurements
Private equity fund investments included above are not redeemable, because distributions from the funds will be received when underlying investments of the funds are liquidated. Private equity funds are generally expected to have 10-year lives at their inception, but these lives may be extended at the fund manager’s discretion, typically in one-year or two-year increments.
The hedge fund investments included above, which are carried at fair value, are generally redeemable subject to the redemption notices period. The majority of our hedge fund investments are redeemable monthly or quarterly.
FAIR VALUE OPTION
Under the fair value option, we may elect to measure at fair value financial assets and financial liabilities that are not otherwise required to be carried at fair value. This includes fixed income securities subject to modco agreements with Fortitude Re for which we have elected the fair value option. Subsequent changes in fair value for designated items are reported in earnings. We elect the fair value option for certain hybrid securities given the complexity of bifurcating the economic components associated with the embedded derivatives.
For additional information related to embedded derivatives refer to Note 12.
Additionally, we elect the fair value option for certain alternative investments when such investments are eligible for this election. We believe this measurement basis is consistent with the applicable accounting guidance used by the respective investment company funds themselves.
For additional information on securities and other invested assets for which we have elected the fair value option refer to Note 5.
The following table presents the gains or losses recorded related to the eligible instruments for which we elected the fair value option:
| | | | | | | | | | | | | | | | | | | | |
| Years Ended December 31, | | Gain (Loss) |
| (in millions) | | 2022 | | 2021 | | 2020 |
| Assets: | | | | | | |
Other bond securities(a) | | $ | (408) | | | $ | 26 | | | $ | 72 | |
Alternative investments(b) | | 191 | | | 1,083 | | | 290 | |
| Total assets | | (217) | | | 1,109 | | | 362 | |
| Liabilities: | | | | | | |
Policyholder contract deposits(c) | | 20 | | | 7 | | | (9) | |
Debt of consolidated investment entities(d) | | — | | | (179) | | | (102) | |
| Total liabilities | | 20 | | | (172) | | | (111) | |
| Total gain (loss) | | $ | (197) | | | $ | 937 | | | $ | 251 | |
(a)Includes certain securities supporting the funds withheld arrangements with Fortitude Re. For additional information regarding the gains and losses for Other bond securities, see Note 5. For additional information regarding the funds withheld arrangements with Fortitude Re, see Note 7.
(b)Includes certain hedge funds, private equity funds and other investment partnerships.
(c)Represents GICs.
(d)Primarily related to six transactions securitizing certain debt portfolios previously owned by Corebridge and its affiliates and were terminated during 2021. For additional information, see Note 10.
Interest income and dividend income on assets measured under the fair value option are recognized and included in Net investment income in the Consolidated Statements of Income. Interest expense on liabilities measured under the fair value option is reported in Interest Expense in the Consolidated Statements of Income.
For additional information about our policies for recognition, measurement, and disclosure of interest and dividend income, see Note 5.
We are required to record unrealized gains and losses attributable to the observable effect of changes in credit spreads on our liabilities for which the fair value option was elected in Other comprehensive income (loss). We calculate the effect of these credit spread changes using discounted cash flow techniques that incorporate current market interest rates, our observable credit spreads on these liabilities and other factors that mitigate the risk of non-performance such as cash collateral posted.
We calculate the effect of these credit spread changes using discounted cash flow techniques that incorporate current market interest rates, our observable credit spreads on these liabilities and other factors that mitigate the risk of non-performance such as cash collateral posted.
We have elected the fair value option on certain debt securities issued by Corebridge or its affiliates. As of December 31, 2022, and December 31, 2021, the fair value was $6 million and $5 million, respectively. This relates to interest only notes issued by residential mortgage loan securitization structures for which the principal of the notes is a reference amount only and its repayment is not expected. The aforementioned principal reference amounts are $655 million and $779 million as of December 31, 2022 and December 31, 2021, respectively.
ITEM 8 | Notes to Consolidated Financial Statements | 4. Fair Value Measurements
FAIR VALUE MEASUREMENTS ON A NON-RECURRING BASIS
We measure the fair value of certain assets on a non-recurring basis, generally quarterly, annually or when events or changes in circumstances indicate that the carrying amount of the assets may not be recoverable. These assets include cost and equity-method investments, commercial mortgage loans and commercial loans, investments in real estate and other fixed assets, goodwill and other intangible assets.
For additional information about how we test various asset classes for impairment, see Notes 5 and 6.
The following table presents assets measured at fair value on a non-recurring basis at the time of impairment and the related impairment charges recorded during the periods presented:
| | | | | | | | | | | | | | | | | | | | | | | | | | | | | | | | | | | | | | | | | | | | | | | | | | |
| | Assets at Fair Value | | Impairment Charges | | |
| | Non-Recurring Basis | | December 31, | | |
| (in millions) | | Level 1 | | Level 2 | | Level 3 | | Total | | 2022 | | 2021 | | 2020 | | |
| December 31, 2022 | | | | | | | | | | | | | | | | |
| Other investments | | $ | — | | | $ | — | | | $ | 12 | | | $ | 12 | | | $ | 25 | | | $ | 6 | | $ | 77 | | |
| | | | | | | | | | | | | | | | |
| | | | | | | | | | | | | | | | |
| Other assets | | — | | | — | | | — | | | — | | | — | | | 1 | | 5 | | |
| Total | | $ | — | | | $ | — | | | $ | 12 | | | $ | 12 | | | $ | 25 | | | $ | 7 | | $ | 82 | | |
| December 31, 2021 | | | | | | | | | | | | | | | | |
| Other investments | | $ | — | | $ | — | | $ | 89 | | $ | 89 | | | | | | | | |
| Mortgage and other loans receivable* | | — | | — | | 15 | | 15 | | | | | | | | |
| Other assets | | — | | 14 | | — | | 14 | | | | | | | | |
| Total | | $ | — | | $ | 14 | | $ | 104 | | $ | 118 | | | | | | | | |
* Mortgage and other loans receivable are carried at lower of cost or fair value.
In addition to the assets presented in the table above, at December 31, 2022, Corebridge had $163 million of loans held for sale which are carried at fair value, determined on an individual loan basis. There is no associated impairment charge.
FAIR VALUE INFORMATION ABOUT FINANCIAL INSTRUMENTS NOT MEASURED AT FAIR VALUE
Information regarding the estimation of fair value for financial instruments not carried at fair value (excluding insurance contracts and lease contracts) is discussed below:
•Mortgage and other loans receivable: Fair values of loans on commercial real estate and other loans receivable are estimated for disclosure purposes using discounted cash flow calculations based on discount rates that we believe market participants would use in determining the price that they would pay for such assets. For certain loans, our current incremental lending rates for similar types of loans are used as the discount rates, because we believe this rate approximates the rates market participants would use. Fair values of residential mortgage loans are generally determined based on market prices, using market-based adjustments for credit and servicing as appropriate. The fair values of policy loans are generally estimated based on unpaid principal amount as of each reporting date. No consideration is given to credit risk because policy loans are effectively collateralized by the cash surrender value of the policies.
•Other invested assets: Certain of our subsidiaries are members of Federal Home Loan Banks (FHLBs) and such membership requires the members to own stock in these FHLBs. The carrying amounts of these stocks approximate fair values.
•Cash and short-term investments: The carrying amounts of these assets approximate fair values because of the relatively short period of time between origination and expected realization, and their limited exposure to credit risk.
•Policyholder contract deposits associated with investment-type contracts: Fair values for policyholder contract deposits associated with investment-type contracts not accounted for at fair value are estimated using discounted cash flow calculations based on interest rates currently being offered for similar contracts with maturities consistent with those of the contracts being valued. When no similar contracts are being offered, the discount rate is the appropriate swap rate (if available) or current risk-free interest rate consistent with the currency in which the cash flows are denominated. To determine fair value, other factors include current policyholder account values and related surrender charges and other assumptions include expectations about policyholder behavior and an appropriate risk margin.
•Other liabilities: The majority of the Other liabilities that are financial instruments not measured at fair value represent secured financing arrangements, including repurchase agreements. The carrying amounts of these liabilities approximate fair value because the financing arrangements are short-term and are secured by cash or other liquid collateral.
•Fortitude Re funds withheld payable: The funds withheld payable contains an embedded derivative and the changes in its fair value are recognized in earnings each period. The difference between the total Fortitude Re funds withheld payable and the embedded derivative represents the host contract.
ITEM 8 | Notes to Consolidated Financial Statements | 4. Fair Value Measurements
•Short-term and long-term debt and debt of consolidated investment entities: Fair values of these obligations were determined by reference to quoted market prices, when available and appropriate, or discounted cash flow calculations based upon our current market observable implicit credit spread rates for similar types of borrowings with maturities consistent with those remaining for the debt being valued.
•Separate Account Liabilities—Investment Contracts: Only the portion of separate account liabilities related to products that are investment contracts are reflected in the table below. Separate account liabilities are recorded at the amount credited to the contract holder, which reflects the change in fair value of the corresponding separate account assets, including contract holder deposits less withdrawals and fees; therefore, carrying value approximates fair value.
The following table presents the carrying amounts and estimated fair values of our financial instruments not measured at fair value and indicates the level in the fair value hierarchy of the estimated fair value measurement based on the observability of the inputs used:
| | | | | | | | | | | | | | | | | | | | | | | | | | | | | | | | |
| | Estimated Fair Value | | |
| (in millions) | | Level 1 | | Level 2 | | Level 3 | | Total | | Carrying
Value |
| December 31, 2022 | | | | | | | | | | |
| Assets: | | | | | | | | | | |
| Mortgage and other loans receivable | | $ | — | | | $ | 31 | | | $ | 40,936 | | | $ | 40,967 | | | $ | 44,403 | |
| Other invested assets | | — | | | 222 | | | — | | | 222 | | | 222 | |
| Short-term investments | | — | | | 3,043 | | | — | | | 3,043 | | | 3,043 | |
| Cash | | 552 | | | — | | | — | | | 552 | | | 552 | |
| Other assets | | 4 | | | 8 | | | — | | | 12 | | | 12 | |
| Liabilities: | | | | | | | | | | |
| Policyholder contract deposits associated with investment-type contracts | | — | | | 119 | | | 129,174 | | | 129,293 | | | 137,086 | |
| Fortitude Re funds withheld payable | | — | | | — | | | 25,289 | | | 25,289 | | | 25,289 | |
| Other liabilities | | — | | | 3,056 | | | — | | | 3,056 | | | 3,056 | |
| Short-term debt | | — | | | 1,500 | | | — | | | 1,500 | | | 1,500 | |
| Long-term debt | | — | | | 7,172 | | | — | | | 7,172 | | | 7,868 | |
| Debt of consolidated investment entities | | — | | | 3,055 | | | 2,488 | | | 5,543 | | | 5,952 | |
| Separate account liabilities - investment contracts | | — | | | 80,649 | | | — | | | 80,649 | | | 80,649 | |
| December 31, 2021 | | | | | | | | | | |
| Assets: | | | | | | | | | | |
| Mortgage and other loans receivable | | $ | — | | | $ | 52 | | | $ | 41,077 | | | $ | 41,129 | | | $ | 39,373 | |
| Other invested assets | | — | | | 193 | | | — | | | 193 | | | 193 | |
| Short-term investments | | — | | | 4,016 | | | — | | | 4,016 | | | 4,016 | |
| Cash | | 537 | | | — | | | — | | | 537 | | | 537 | |
| Other assets | | 7 | | | — | | | — | | | 7 | | | 7 | |
| Liabilities: | | | | | | | | | | |
| Policyholder contract deposits associated with investment-type contracts | | — | | | 169 | | | 139,464 | | | 139,633 | | | 132,142 | |
| Fortitude Re funds withheld payable | | — | | | — | | | 27,170 | | | 27,170 | | | 27,170 | |
| Other liabilities | | — | | | 3,704 | | | — | | | 3,704 | | | 3,704 | |
| Short-term debt | | — | | | — | | | 8,317 | | | 8,317 | | | 8,317 | |
| Long-term debt | | — | | | 586 | | | — | | | 586 | | | 427 | |
| Debt of consolidated investment entities | | — | | | 3,077 | | | 3,810 | | | 6,887 | | | 6,931 | |
| Separate account liabilities - investment contracts | | — | | | 104,126 | | | — | | | 104,126 | | | 104,126 | |
ITEM 8 | Notes to Consolidated Financial Statements | 5. Investments
FIXED MATURITY SECURITIES
Bonds held to maturity are carried at amortized cost when we have the ability and positive intent to hold these securities until maturity. When we do not have the ability or positive intent to hold bonds until maturity, these securities are classified as available for sale or are measured at fair value at our election. None of our fixed maturity securities met the criteria for held to maturity classification at December 31, 2022 or 2021.
Unrealized gains and losses from available for sale investments in fixed maturity securities carried at fair value were reported as a separate component of AOCI, net of policy related amounts and deferred income taxes, in Shareholders’ equity. Realized and unrealized gains and losses from fixed maturity securities measured at fair value at our election are reflected in Net investment income. Investments in fixed maturity securities are recorded on a trade-date basis.
Interest income is recognized using the effective yield method and reflects amortization of premium and accretion of discount. Premiums and discounts arising from the purchase of bonds classified as available for sale are treated as yield adjustments over their estimated holding periods, until maturity, or call date, if applicable. For investments in certain structured securities, recognized yields are updated based on current information regarding the timing and amount of expected undiscounted future cash flows. For high credit quality structured securities, effective yields are recalculated based on actual payments received and updated prepayment expectations, and the amortized cost is adjusted to the amount that would have existed had the new effective yield been applied since acquisition with a corresponding charge or credit to net investment income. For structured securities that are not high credit quality, the structured securities yields are based on expected cash flows which take into account both expected credit losses and prepayments.
An allowance for credit losses is not established upon initial recognition of the asset (unless the security is determined to be a purchased credit deteriorated (“PCD”) asset which is discussed in more detail below). Subsequently, differences between actual and expected cash flows and changes in expected cash flows are recognized as adjustments to the allowance for credit losses. Changes that cannot be reflected as adjustments to the allowance for credit losses are accounted for as prospective adjustments to yield.
SECURITIES AVAILABLE FOR SALE
The following table presents the amortized cost or cost and fair value of our available-for-sale securities:
| | | | | | | | | | | | | | | | | | | | | | | | | | | | | | | | |
| (in millions) | | Amortized Cost or Costs(a) | | Allowance for Credit Losses(b) | | Gross
Unrealized
Gains | | Gross
Unrealized
Losses | | Fair Value(a) |
| December 31, 2022 | | | | | | | | | | |
| Bonds available for sale: | | | | | | | | | | |
| U.S. government and government sponsored entities | | $ | 1,405 | | | $ | — | | | $ | 17 | | | $ | (224) | | | $ | 1,198 | |
| Obligations of states, municipalities and political subdivisions | | 6,808 | | | — | | | 42 | | | (924) | | | 5,926 | |
| Non-U.S. governments | | 5,251 | | | (5) | | | 25 | | | (879) | | | 4,392 | |
| Corporate debt | | 124,068 | | | (116) | | | 729 | | | (19,989) | | | 104,692 | |
| Mortgage-backed, asset-backed and collateralized: | | | | | | | | | | |
| RMBS | | 12,267 | | | (27) | | | 574 | | | (870) | | | 11,944 | |
| CMBS | | 11,176 | | | — | | | 7 | | | (1,115) | | | 10,068 | |
| CLO | | 8,547 | | | — | | | 15 | | | (376) | | | 8,186 | |
| ABS | | 11,752 | | | — | | | 15 | | | (1,380) | | | 10,387 | |
| Total mortgage-backed, asset-backed and collateralized | | 43,742 | | | (27) | | | 611 | | | (3,741) | | | 40,585 | |
Total bonds available for sale(c) | | $ | 181,274 | | | $ | (148) | | | $ | 1,424 | | | $ | (25,757) | | | $ | 156,793 | |
ITEM 8 | Notes to Consolidated Financial Statements | 5. Investments
| | | | | | | | | | | | | | | | | | | | | | | | | | | | | | | | |
| (in millions) | | Amortized Cost or Costs(a) | | Allowance for Credit Losses(b) | | Gross
Unrealized
Gains | | Gross
Unrealized
Losses | | Fair Value(a) |
| | | | | | | | | | |
| December 31, 2021 | | | | | | | | | | |
| Bonds available for sale: | | | | | | | | | | |
| U.S. government and government sponsored entities | | $ | 1,406 | | | $ | — | | | $ | 306 | | | $ | — | | | $ | 1,712 | |
| Obligations of states, municipalities and political subdivisions | | 7,321 | | | — | | | 1,362 | | | (7) | | | 8,676 | |
| Non-U.S. governments | | 6,026 | | | — | | | 495 | | | (124) | | | 6,397 | |
| Corporate debt | | 128,417 | | | (72) | | | 12,674 | | | (956) | | | 140,063 | |
| Mortgage-backed, asset-backed and collateralized: | | | | | | | | | | |
| RMBS | | 13,236 | | | (6) | | | 1,762 | | | (34) | | | 14,958 | |
| CMBS | | 10,903 | | | — | | | 451 | | | (54) | | | 11,300 | |
| CLO | | 7,382 | | | — | | | 73 | | | (53) | | | 7,402 | |
| ABS | | 7,902 | | | — | | | 205 | | | (47) | | | 8,060 | |
| Total mortgage-backed, asset-backed and collateralized | | 39,423 | | | (6) | | | 2,491 | | | (188) | | | 41,720 | |
Total bonds available for sale(c) | | $ | 182,593 | | | $ | (78) | | | $ | 17,328 | | | $ | (1,275) | | | $ | 198,568 | |
(a) The table above includes available-for-sale securities issued by related parties. This includes RMBS which had a fair value of $39 million and $47 million, and an amortized cost of $43 million and $44 million as of December 31, 2022 and December 31, 2021, respectively. Additionally, this includes CDOs which had a fair value of $862 million and an amortized cost of $823 million as of December 31, 2021. There were no available-for-sale CDO securities issued by related parties as of December 31, 2022.
(b) Represents the allowance for credit losses that have been recognized. Changes in the allowance for credit losses are recorded through Net realized gains (losses) and are not recognized in Other comprehensive income (loss).
(c) At December 31, 2022 and December 31, 2021, the fair value of bonds available for sale held by us that were below investment grade or not rated totaled $16.7 billion and $20.4 billion, respectively.
Securities Available for Sale in a Loss Position for Which No Allowance for Credit Loss Has Been Recorded
The following table summarizes the fair value and gross unrealized losses on our available-for-sale securities, aggregated by major investment category and length of time that individual securities have been in a continuous unrealized loss position for which no allowance for credit loss has been recorded:
| | | | | | | | | | | | | | | | | | | | | | | | | | | | | | | | | | | | | | |
| | Less Than 12 Months | | 12 Months or More | | Total |
(in millions) | | Fair Value | | Gross Unrealized Losses | | Fair Value | | Gross Unrealized Losses | | Fair Value | | Gross Unrealized Losses |
| December 31, 2022 | | | | | | | | | | | | |
| Bonds available for sale: | | | | | | | | | | | | |
| U.S. government and government sponsored entities | | $ | 761 | | | $ | 224 | | | $ | — | | | $ | — | | | $ | 761 | | | $ | 224 | |
| Obligations of states, municipalities and political subdivisions | | 5,076 | | | 924 | | | — | | | — | | | 5,076 | | | 924 | |
| Non-U.S. governments | | 3,932 | | | 868 | | | — | | | — | | | 3,932 | | | 868 | |
| Corporate debt | | 82,971 | | | 16,866 | | | 11,143 | | | 3,070 | | | 94,114 | | | 19,936 | |
| RMBS | | 6,227 | | | 653 | | | 903 | | | 171 | | | 7,130 | | | 824 | |
| CMBS | | 7,902 | | | 797 | | | 1,708 | | | 318 | | | 9,610 | | | 1,115 | |
| CLO | | 5,573 | | | 234 | | | 2,007 | | | 142 | | | 7,580 | | | 376 | |
| ABS | | 6,998 | | | 854 | | | 2,271 | | | 526 | | | 9,269 | | | 1,380 | |
| Total bonds available for sale | | $ | 119,440 | | | $ | 21,420 | | | $ | 18,032 | | | $ | 4,227 | | | $ | 137,472 | | | $ | 25,647 | |
| | | | | | | | | | | | |
| December 31, 2021 | | | | | | | | | | | | |
| Bonds available for sale: | | | | | | | | | | | | |
| U.S. government and government sponsored entities | | $ | — | | | $ | — | | | $ | — | | | $ | — | | | $ | — | | | $ | — | |
| Obligations of states, municipalities and political subdivisions | | 201 | | | 4 | | | 48 | | | 3 | | | 249 | | | 7 | |
| Non-U.S. governments | | 1,198 | | | 58 | | | 376 | | | 66 | | | 1,574 | | | 124 | |
| Corporate debt | | 19,916 | | | 513 | | | 6,922 | | | 387 | | | 26,838 | | | 900 | |
| RMBS | | 1,235 | | | 30 | | | 27 | | | 2 | | | 1,262 | | | 32 | |
| CMBS | | 2,498 | | | 36 | | | 79 | | | 18 | | | 2,577 | | | 54 | |
| CLO | | 3,829 | | | 48 | | | 21 | | | 5 | | | 3,850 | | | 53 | |
| ABS | | 2,540 | | | 43 | | | 140 | | | 4 | | | 2,680 | | | 47 | |
| Total bonds available for sale | | $ | 31,417 | | | $ | 732 | | | $ | 7,613 | | | $ | 485 | | | $ | 39,030 | | | $ | 1,217 | |
At December 31, 2022, we held 16,516 individual fixed maturity securities that were in an unrealized loss position and for which no allowance for credit losses has been recorded (including 1,923 individual fixed maturity securities that were in a continuous unrealized loss position for 12 months or more). At December 31, 2021, we held 4,944 individual fixed maturity securities that were in an
ITEM 8 | Notes to Consolidated Financial Statements | 5. Investments
unrealized loss position (including 1,179 individual fixed maturity securities were in a continuous unrealized loss position for 12 months or more). We did not recognize the unrealized losses in earnings on these fixed maturity securities at December 31, 2022 because it was determined that such losses were due to non-credit factors. Additionally, we neither intend to sell the securities nor do we believe that it is more likely than not that we will be required to sell these securities before recovery of their amortized cost basis. For fixed maturity securities with significant declines, we performed fundamental credit analyses on a security-by-security basis, which included consideration of credit enhancements, liquidity position, expected defaults, industry and sector analysis, forecasts and available market data.
Contractual Maturities of Fixed Maturity Securities Available for Sale
The following table presents the amortized cost and fair value of fixed maturity securities available for sale by contractual maturity:
| | | | | | | | | | | | | | |
| | Total Fixed Maturity Securities
Available for sale |
| (in millions) | | Amortized Cost,
Net of Allowance | | Fair Value |
| December 31, 2022 | | | | |
| Due in one year or less | | $ | 2,334 | | | $ | 2,290 | |
| Due after one year through five years | | 22,500 | | | 21,650 | |
| Due after five years through ten years | | 28,376 | | | 25,452 | |
| Due after ten years | | 84,201 | | | 66,816 | |
| Mortgage-backed, asset-backed and collateralized | | 43,715 | | | 40,585 | |
| Total | | $ | 181,126 | | | $ | 156,793 | |
Actual maturities may differ from contractual maturities because certain borrowers have the right to call or prepay certain obligations with or without call or prepayment penalties.
The following table presents the gross realized gains and gross realized losses from sales or maturities of our available-for-sale securities:
| | | | | | | | | | | | | | | | | | | | | | | | | | | | | | | | | | | | | | | | | | | | | | | | | | |
| | | | | | | | |
| | Years Ended December 31, | | | | | | | | | | | | |
| | 2022 | | 2021 | | 2020 | | | | | | |
| (in millions) | | Gross
Realized
Gains | | Gross
Realized
Losses | | Gross
Realized
Gains | | Gross
Realized
Losses | | Gross
Realized
Gains | | Gross
Realized
Losses | | | | | | | | | | | | |
| Fixed maturity securities | | $ | 120 | | | $ | (677) | | | $ | 894 | | | $ | (144) | | | $ | 1,022 | | | $ | (440) | | | | | | | | | | | | | |
For the years ended December 31, 2022, 2021, and 2020, the aggregate fair value of available for sale securities sold was $10.0 billion, $11.4 billion, and $12.0 billion respectively, which resulted in net realized gains (losses) of $(557) million, $750 million, and $582 million respectively. Included within the net realized gains (losses) are $(232) million, $647 million, and $660 million of realized gains (losses) for the years ended December 31, 2022, 2021, and 2020 respectively, which relate to the Fortitude Re funds withheld assets held by Corebridge in support of Fortitude Re’s reinsurance obligations to Corebridge (Fortitude Re funds withheld assets). These realized gains (losses) are included in net realized gains (losses) on Fortitude Re funds withheld assets.
ITEM 8 | Notes to Consolidated Financial Statements | 5. Investments
OTHER SECURITIES MEASURED AT FAIR VALUE
The following table presents the fair value of fixed maturity securities measured at fair value, including securities in the modco agreement with Fortitude Re, based on our election of the fair value option and equity securities measured at fair value:
| | | | | | | | | | | | | | | | | | | | | | | | | | |
| | December 31, 2022 | | December 31, 2021 |
| (in millions) | | Fair Value* | | Percent
of Total | | Fair Value* | | Percent
of Total |
| Fixed maturity securities: | | | | | | | | |
| | | | | | | | |
| Obligations of states, municipalities and political subdivisions | | $ | 37 | | | 1 | % | | $ | 50 | | | 2 | % |
| Non-U.S. governments | | 22 | | | 1 | % | | 17 | | | 1 | % |
| Corporate debt | | 2,222 | | | 56 | % | | 1,000 | | | 43 | % |
| Mortgage-backed, asset-backed and collateralized: | | | | | | | | |
| RMBS | | 165 | | | 4 | % | | 199 | | | 9 | % |
| CMBS | | 232 | | | 6 | % | | 234 | | | 10 | % |
| CLO | | 279 | | | 7 | % | | 283 | | | 12 | % |
| ABS | | 812 | | | 21 | % | | 299 | | | 13 | % |
| Total mortgage-backed, asset-backed and collateralized | | 1,488 | | | 38 | % | | 1,015 | | | 44 | % |
| Total fixed maturity securities | | 3,769 | | | 96 | % | | 2,082 | | | 90 | % |
| Equity securities | | 170 | | | 4 | % | | 242 | | | 10 | % |
| Total | | $ | 3,939 | | | 100 | % | | $ | 2,324 | | | 100 | % |
* The table above includes other securities measured at fair value issued by related parties, which are primarily Corebridge affiliates that are not consolidated. There were no equity securities with related parties as of December 31, 2022 or December 31, 2021.
OTHER INVESTED ASSETS
The following table summarizes the carrying amounts of other invested assets:
| | | | | | | | | | | | | | |
| (in millions) | | December 31, 2022 | | December 31, 2021 |
Alternative investments(a) (b) | | $ | 8,014 | | | $ | 7,527 | |
Investment real estate (c) | | 1,831 | | | 2,349 | |
All other investments (d) | | 573 | | | 691 | |
Total (e) | | $ | 10,418 | | | $ | 10,567 | |
(a)At December 31, 2022, included hedge funds of $884 million and private equity funds of $7.1 billion. At December 31, 2021, included hedge funds of $1.0 billion and private equity funds of $6.5 billion.
(b)At December 31, 2022, approximately 77% of our hedge fund portfolio is available for redemption in 2023. The remaining 23% will be available for redemption between 2024 and 2028. At December 31, 2021, approximately 73% of our hedge fund portfolio is available for redemption in 2022. The remaining 27% will be available for redemption between 2023 and 2028.
(c)Represents values net of accumulated depreciation of $616 million and $493 million as of December 31, 2022 and December 31, 2021, respectively. The accumulated depreciation related to the investment real estate held by legacy assets owned by us was $124 million and $123 million as of December 31, 2022 and December 31, 2021, respectively.
(d)Includes Corebridge’s ownership interest in Fortitude Holdings, which is recorded using the measurement alternative for equity securities. Our investment in Fortitude Holdings totaled $156 million and $100 million at December 31, 2022 and December 31, 2021, respectively.
(e)Includes investments in related parties, which totaled $6 million and $11 million as of December 31, 2022 and December 31, 2021, respectively.
Other Invested Assets Carried at Fair Value
Certain hedge funds, private equity funds, and other investment partnerships for which we have elected the fair value option are reported at fair value with changes in fair value recognized in Net investment income.
Other Invested Assets – Equity Method Investments
We account for hedge funds, private equity funds, certain affordable housing partnerships and other investment partnerships using the equity method of accounting unless our interest is so minor that we may have virtually no influence over partnership operating and financial policies, or we have elected the fair value option. Under the equity method of accounting, our carrying amount generally is our share of the net asset value of the funds or the partnerships, and changes in our share of the net asset values are recorded in Net investment income. In applying the equity method of accounting, we consistently use the most recently available financial information provided by the general partner or manager of each of these investments. Hedge funds are reported as of the balance sheet date. Private equity funds are generally reported on a one-quarter lag. The financial statements of these investees are generally audited annually.
ITEM 8 | Notes to Consolidated Financial Statements | 5. Investments
Summarized Financial Information of Equity Method Investees
The following is the aggregated summarized financial information of our equity method investees, including those for which the fair value option has been elected:
| | | | | | | | | | | | | | | | | |
| Years Ended December 31, | | | | | |
| (in millions) | 2022 | | 2021 | | 2020 |
| Operating results: | | | | | |
| Total revenues | $ | 6,316 | | | $ | 9,425 | | | $ | 2,375 | |
| Total expenses | (579) | | | (674) | | | (778) | |
| Net income | $ | 5,737 | | | $ | 8,751 | | | $ | 1,597 | |
| December 31, | | | | | |
| (in millions) | | | 2022 | | 2021 |
| Balance sheet: | | | | | |
| Total assets | | | $ | 39,181 | | | $ | 33,894 | |
| Total liabilities | | | $ | (3,551) | | | $ | (4,453) | |
The following table presents the carrying amount and ownership percentage of equity method investments at December 31, 2022 and December 31, 2021:
| | | | | | | | | | | | | | | | | | | | | | | | | | |
| | December 31, 2022 | | December 31, 2021 |
| (in millions) | | Carrying
Value | | Ownership
Percentage | | Carrying
Value | | Ownership
Percentage |
| Equity method investments | | $ | 3,185 | | | Various | | $ | 2,797 | | | Various |
Summarized financial information for these equity method investees may be presented on a lag, due to the unavailability of information for the investees at our respective balance sheet dates and is included for the periods in which we held an equity method ownership interest.
Other Investments
Also included in Other invested assets are real estate held for investment. These investments are reported at cost, less depreciation and are subject to impairment review, as discussed below.
NET INVESTMENT INCOME
Net investment income represents income primarily from the following sources:
•Interest income and related expenses, including amortization of premiums and accretion of discounts with changes in the timing and the amount of expected principal and interest cash flows reflected in yield, as applicable.
•Dividend income from common and preferred stocks.
•Realized and unrealized gains and losses from investments in other securities and investments for which we elected the fair value option.
•Earnings from alternative investments.
•Prepayment premiums.
ITEM 8 | Notes to Consolidated Financial Statements | 5. Investments
The following table presents the components of Net investment income:
| | | | | | | | | | | | | | | | | | | | | | | | | | | | | | | | | | | | | | | | | | | | | | | | | | | | | | | | | | | | | | |
| | Years Ended December 31, | | | | | | |
| | 2022 | | 2021 | | 2020 | | |
| (in millions) | | Excluding
Fortitude
Re Funds
Withheld
Assets | | Fortitude
Re Funds
Withheld
Assets | | Total | | Excluding
Fortitude
Re Funds
Withheld
Assets | | Fortitude
Re Funds
Withheld
Assets | | Total | | Excluding
Fortitude
Re Funds
Withheld
Assets | | Fortitude
Re Funds
Withheld
Assets | | Total | | | | | | |
| | | | | | | | | | | | | | | | | | | | | | | | |
| Available-for-sale fixed maturity securities, including short-term investments | | $ | 6,725 | | | $ | 954 | | | $ | 7,679 | | | $ | 6,837 | | | $ | 1,296 | | | $ | 8,133 | | | $ | 6,841 | | | $ | 1,279 | | | $ | 8,120 | | | | | | | |
| Other bond securities | | (30) | | | (378) | | | (408) | | | 17 | | | 9 | | | 26 | | | 66 | | | 6 | | | 72 | | | | | | | |
| Equity securities | | (82) | | | — | | | (82) | | | (290) | | | — | | | (290) | | | 255 | | | — | | | 255 | | | | | | | |
| Interest on mortgage and other loans | | 1,703 | | | 176 | | | 1,879 | | | 1,479 | | | 184 | | | 1,663 | | | 1,489 | | | 166 | | | 1,655 | | | | | | | |
Alternative investments* | | 675 | | | 170 | | | 845 | | | 1,851 | | | 318 | | | 2,169 | | | 584 | | | 12 | | | 596 | | | | | | | |
| Real estate | | 43 | | | — | | | 43 | | | 204 | | | — | | | 204 | | | 177 | | | — | | | 177 | | | | | | | |
| Other investments | | 100 | | | — | | | 100 | | | 115 | | | — | | | 115 | | | 13 | | | — | | | 13 | | | | | | | |
| Total investment income | | 9,134 | | | 922 | | | 10,056 | | | 10,213 | | | 1,807 | | | 12,020 | | | 9,425 | | | 1,463 | | | 10,888 | | | | | | | |
| Investment expenses | | 449 | | | 31 | | | 480 | | | 316 | | | 32 | | | 348 | | | 336 | | | 36 | | | 372 | | | | | | | |
| Net investment income | | $ | 8,685 | | | $ | 891 | | | $ | 9,576 | | | $ | 9,897 | | | $ | 1,775 | | | $ | 11,672 | | | $ | 9,089 | | | $ | 1,427 | | | $ | 10,516 | | | | | | | |
* Included income from hedge funds, private equity funds and affordable housing partnerships. Hedge funds are recorded as of the balance sheet date. Private equity funds are generally reported on a one-quarter lag.
NET REALIZED GAINS AND LOSSES
Net realized gains and losses are determined by specific identification. The net realized gains and losses are generated primarily from the following sources:
•Sales or full redemptions of available for sale fixed maturity securities, real estate and other alternative investments.
•Reductions to the amortized cost basis of available for sale fixed maturity securities that have been written down due to our intent to sell them or it being more likely than not that we will be required to sell them.
•Changes in the allowance for credit losses on bonds available for sale, mortgage and other loans receivable, and loans commitments.
•Most changes in the fair value of free standing and embedded derivatives, including changes in the non-performance adjustment are included in Net realized gains (losses). However, changes in derivatives designated as hedging instruments when the fair value of the hedged item is not reported in Net realized gains (losses) are excluded from Net realized gains (losses). Additionally, in conjunction with the adoption of LDTI which is effective as of January 1, 2021, changes in the fair value of free standing derivatives that hedge certain MRBs are excluded from Net realized gains (losses).
•Foreign exchange gains and losses resulting from foreign currency transactions.
•Changes in fair value of the embedded derivative related to the Fortitude Re funds withheld assets.
ITEM 8 | Notes to Consolidated Financial Statements | 5. Investments
The following table presents the components of Net realized gains (losses):
| | | | | | | | | | | | | | | | | | | | | | | | | | | | | | | | | | | | | | | | | | | | | | | | | | | | | | | | | | | | | | |
| | Years Ended December 31, | | | | | | |
| | 2022 | | 2021 | | 2020 | |
| (in millions) | | Excluding Fortitude
Re Funds
Withheld
Assets | | Fortitude
Re Funds
Withheld
Assets | | Total | | Excluding
Fortitude
Re Funds
Withheld
Assets | | Fortitude
Re Funds
Withheld
Assets | | Total | | Excluding
Fortitude
Re Funds
Withheld
Assets | | Fortitude
Re Funds
Withheld
Assets | | Total | | | |
| Sales of fixed maturity securities | | $ | (325) | | | $ | (232) | | | $ | (557) | | | $ | 103 | | | $ | 647 | | | $ | 750 | | | $ | (78) | | | $ | 660 | | | $ | 582 | | | | | | | |
| | | | | | | | | | | | | | | | | | | | | | | | |
| Change in allowance for credit losses on fixed maturity securities | | (115) | | | (31) | | | (146) | | | 8 | | | 3 | | | 11 | | | (186) | | | 17 | | | (169) | | | | | | | |
| Change in allowance for credit losses on loans | | (76) | | | (44) | | | (120) | | | 133 | | | 8 | | | 141 | | | (61) | | | 3 | | | (58) | | | | | | | |
Foreign exchange transactions, net of related hedges (a) | | 695 | | | 61 | | | 756 | | | 310 | | | 20 | | | 330 | | | 89 | | | (5) | | | 84 | | | | | | | |
Variable annuity embedded derivatives, net of related hedges(a) (b) | | — | | | — | | | — | | | — | | | — | | | — | | | 159 | | | — | | | 159 | | | | | | | |
Fixed index annuity and index life embedded derivatives, net of related hedges(a) | | (117) | | | — | | | (117) | | | (3) | | | — | | | (3) | | | (766) | | | — | | | (766) | | | | | | | |
All other derivatives and hedge accounting(b) | | (43) | | | (181) | | | (224) | | | (6) | | | 9 | | | 3 | | | (94) | | | 423 | | | 329 | | | | | | | |
| Sales of alternative investments and real estate investments | | 179 | | | 43 | | | 222 | | | 794 | | | 237 | | | 1,031 | | | 158 | | | (96) | | | 62 | | | | | | | |
Other | | (57) | | | (13) | | | (70) | | | 176 | | | — | | | 176 | | | 14 | | | — | | | 14 | | | | | | | |
| Net realized gains (losses) – excluding Fortitude Re funds withheld embedded derivative | | 141 | | | (397) | | | (256) | | | 1,515 | | | 924 | | | 2,439 | | | (765) | | | 1,002 | | | 237 | | | | | | | |
| Net realized gains (losses) on Fortitude Re funds withheld embedded derivative | | — | | | 6,347 | | | 6,347 | | | — | | | (687) | | | (687) | | | — | | | (3,978) | | | (3,978) | | | | | | | |
| Net realized gains (losses) | | $ | 141 | | | $ | 5,950 | | | $ | 6,091 | | | $ | 1,515 | | | $ | 237 | | | $ | 1,752 | | | $ | (765) | | | $ | (2,976) | | | $ | (3,741) | | | | | | | |
(a) The results for the years ended December 31, 2022 and 2021 have been updated to reflect the adoption of LDTI. No updates have been made to the results for the year ended December 31, 2020 as our effective date for LDTI adoption was January 1, 2021.
(b) There is no 2022 or 2021 activity for Variable Annuity Embedded Derivatives, net of related hedges, and certain Index Annuity Embedded Derivatives, net of related hedges, because guaranteed benefit riders on annuity contracts are accounted for as MRBs after the adoption of LDTI effective on January 1, 2021. Derivative activity related to hedging certain MRBs is recorded in Change in the fair value of MRBs, net. For additional disclosures about MRBs, see Note 13.
CHANGE IN UNREALIZED APPRECIATION (DEPRECIATION) OF INVESTMENTS
The following table presents the increase (decrease) in unrealized appreciation (depreciation) of our available-for-sale securities:
| | | | | | | | | | | | | | |
| | Years Ended December 31, |
(in millions) | | 2022 | | 2021 |
Increase (decrease) in unrealized appreciation (depreciation) of investments: | | | | |
Fixed maturity securities | | $ | (40,386) | | | $ | (7,457) |
| Other investments | | (15) | | | — |
Total increase (decrease) in unrealized appreciation (depreciation) of investments | | $ | (40,401) | | | $ | (7,457) |
ITEM 8 | Notes to Consolidated Financial Statements | 5. Investments
The following table summarizes the unrealized gains and losses recognized in Net investment income during the reporting period on equity securities and other invested assets still held at the reporting date:
| | | | | | | | | | | | | | | | | | | | | | | | | | | | | | | | | | | | | | |
| | Years Ended December 31, |
| | 2022 | | 2021 |
(in millions) | | Equities | | Other Invested Assets | | Total | | Equities | | Other Invested Assets | | Total |
Net gains (losses) recognized during the period on equity securities and other investments | | $ | (82) | | | $ | 353 | | | $ | 271 | | | $ | (290) | | | $ | 1,362 | | | $ | 1,072 | |
Less: Net gains (losses) recognized during the period on equity securities and other investments sold during the period | | (46) | | | (11) | | | (57) | | | (255) | | | 30 | | | (225) | |
Unrealized gains (losses) recognized during the reporting period on equity securities and other investments still held at the reporting date | | $ | (36) | | | $ | 364 | | | $ | 328 | | | $ | (35) | | | $ | 1,332 | | | $ | 1,297 | |
EVALUATING INVESTMENTS FOR AN ALLOWANCE FOR CREDIT LOSSES
Credit Impairments
The following table presents a rollforward of the changes in allowance for credit losses on available-for-sale fixed maturity securities by major investment category:
| | | | | | | | | | | | | | | | | | | | | | | | | | | | | | | | | | | | | | | | | | | | | | | | | | | | | | | | |
| | Years Ended December 31, |
| | 2022 | | 2021 | | 2020 |
(in millions) | | Structured | | Non-Structured | | Total | | Structured | | Non-Structured | | Total | Structured | Structured | | Non-Structured | | Total |
Balance, beginning of year | | $ | 8 | | | $ | 70 | | | $ | 78 | | | $ | 14 | | | $ | 117 | | | $ | 131 | | | $ | 5 | | | $ | — | | | $ | 5 | |
Additions: | | | | | | | | | | | | | | | | | | |
Securities for which allowance for credit losses were not previously recorded | | 36 | | | 139 | | | 175 | | | 3 | | | 46 | | | 49 | | | 28 | | | 211 | | | 239 | |
| Purchases of available for sale debt securities accounted for as purchased credit deteriorated assets | | — | | | — | | | — | | | — | | | — | | | — | | | 25 | | | — | | | 25 | |
| Accretion of available for sale debt securities accounted for as purchased credit deteriorated assets | | — | | | — | | | — | | | — | | | — | | | — | | | 1 | | | — | | | 1 | |
| | | | | | | | | | | | | | | | | | |
| | | | | | | | | | | | | | | | | | |
Reductions: | | | | | | | | | | | | | | | | | | |
Securities sold during the period | | (3) | | | (48) | | | (51) | | | (4) | | | (19) | | | (23) | | | (3) | | | (21) | | | (24) | |
Additional net increases or decreases to the allowance for credit losses on securities that had an allowance recorded in a previous period, for which there was no intent to sell before recovery, amortized cost basis | | (14) | | | (15) | | | (29) | | | (5) | | | (55) | | | (60) | | | (42) | | | (4) | | | (46) | |
Write-offs charged against the allowance | | — | | | (25) | | | (25) | | | — | | | (19) | | | (19) | | | — | | | (69) | | | (69) | |
| | | | | | | | | | | | | | | | | | |
Balance, end of year | | $ | 27 | | | $ | 121 | | | $ | 148 | | | $ | 8 | | | $ | 70 | | | $ | 78 | | | $ | 14 | | | $ | 117 | | | $ | 131 | |
Other Invested Assets
Our equity method investments in private equity funds, hedge funds and other entities are evaluated for impairment each reporting period. Such evaluation considers market conditions, events and volatility that may impact the recoverability of the underlying investments within these private equity funds and hedge funds and is based on the nature of the underlying investments and specific inherent risks. Such risks may evolve based on the nature of the underlying investments.
ITEM 8 | Notes to Consolidated Financial Statements | 5. Investments
Purchased Credit Deteriorated/Impaired Securities
We purchase certain RMBS securities that have experienced more-than-insignificant deterioration in credit quality since origination. Subsequent to the adoption of the Financial Instruments Credit Losses Standard, these are referred to as PCD assets. At the time of purchase an allowance is recognized for these PCD assets by adding it to the purchase price to arrive at the initial amortized cost. There is no credit loss expense recognized upon acquisition of a PCD asset. When determining the initial allowance for credit losses, management considers the historical performance of underlying assets and available market information as well as bond-specific structural considerations, such as credit enhancement and the priority of payment structure of the security. In addition, the process of estimating future cash flows includes, but is not limited to, the following critical inputs:
•current delinquency rates;
•expected default rates and the timing of such defaults;
•loss severity and the timing of any recovery; and
•expected prepayment speeds.
Subsequent to the acquisition date, the PCD assets follow the same accounting as other structured securities that are not of high credit quality.
We did not purchase securities with more-than-insignificant credit deterioration since their origination during the years ended December 31, 2022 and 2021.
PLEDGED INVESTMENTS
Secured Financing and Similar Arrangements
We enter into secured financing transactions whereby certain securities are sold under agreements to repurchase (repurchase agreements), in which we transfer securities in exchange for cash, with an agreement by us to repurchase the same or substantially similar securities. Our secured financing transactions also include those that involve the transfer of securities to financial institutions in exchange for cash (securities lending agreements). In all of these secured financing transactions, the securities transferred by us (pledged collateral) may be sold or repledged by the counterparties. These agreements are recorded at their contracted amounts plus accrued interest, other than those that are accounted for at fair value.
Pledged collateral levels are monitored daily and are generally maintained at an agreed-upon percentage of the fair value of the amounts borrowed during the life of the transactions. In the event of a decline in the fair value of the pledged collateral under these secured financing transactions, we may be required to transfer cash or additional securities as pledged collateral under these agreements. At the termination of the transactions, we and our counterparties are obligated to return the amounts borrowed and the securities transferred, respectively.
The following table presents the fair value of securities pledged to counterparties under secured financing transactions, including repurchase and securities lending agreements:
| | | | | | | | | | | | | | |
| (in millions) | | December 31, 2022 | | December 31, 2021 |
| Fixed maturity securities available for sale | | $ | 2,968 | | | $ | 3,582 | |
At December 31, 2022 and December 31, 2021, amounts borrowed under repurchase and securities lending agreements totaled $3.1 billion and $3.7 billion, respectively.
ITEM 8 | Notes to Consolidated Financial Statements | 5. Investments
The following table presents the fair value of securities pledged under our repurchase agreements by collateral type and by remaining contractual maturity:
| | | | | | | | | | | | | | | | | | | | | | | | | | | | | | | | | | | | | | |
| | Remaining Contractual Maturity of the Repurchase Agreements |
| (in millions) | | Overnight and Continuous | | Up to 30 Days | | 31 - 90 Days | | 91 - 364 Days | | 365 Days or Greater | | Total |
| December 31, 2022 | | | | | | | | | | | | |
| Bonds available for sale: | | | | | | | | | | | | |
| | | | | | | | | | | | |
| | | | | | | | | | | | |
| Non-U.S. governments | | $ | — | | | $ | 21 | | | $ | — | | | $ | — | | | $ | — | | | $ | 21 | |
| Corporate debt | | — | | | 2,370 | | | 577 | | | — | | | — | | | 2,947 | |
| Total | | $ | — | | | $ | 2,391 | | | $ | 577 | | | $ | — | | | $ | — | | | $ | 2,968 | |
| | | | | | | | | | | | |
| | | | | | | | | | | | |
| | | | | | | | | | | | |
| | | | | | | | | | | | |
| December 31, 2021 | | | | | | | | | | | | |
| Bonds available for sale: | | | | | | | | | | | | |
| | | | | | | | | | | | |
| | | | | | | | | | | | |
| Non-U.S. governments | | $ | 48 | | | $ | — | | | $ | — | | | $ | — | | | $ | — | | | $ | 48 | |
| Corporate debt | | 128 | | | 61 | | | 22 | | | — | | | — | | | 211 | |
| Total | | $ | 176 | | | $ | 61 | | | $ | 22 | | | $ | — | | | $ | — | | | $ | 259 | |
| | | | | | | | | | | | |
| | | | | | | | | | | | |
| | | | | | | | | | | | |
| | | | | | | | | | | | |
The following table presents the fair value of securities pledged under our securities lending agreements by collateral type and by remaining contractual maturity:
| | | | | | | | | | | | | | | | | | | | | | | | | | | | | | | | | | | | | | |
| | Remaining Contractual Maturity of the Securities Lending Agreements |
| (in millions) | | Overnight and Continuous | | Up to 30 Days | | 31 - 90 Days | | 91 - 364 Days | | 365 Days or Greater | | Total |
| | | | | | | | | | | | |
| | | | | | | | | | | | |
| | | | | | | | | | | | |
| | | | | | | | | | | | |
| | | | | | | | | | | | |
| | | | | | | | | | | | |
| | | | | | | | | | | | |
| | | | | | | | | | | | |
| | | | | | | | | | | | |
| | | | | | | | | | | | |
| December 31, 2021 | | | | | | | | | | | | |
| Bonds available for sale: | | | | | | | | | | | | |
| Obligations of states, municipalities and political subdivisions | | $ | — | | | $ | — | | | $ | 106 | | | $ | — | | | $ | — | | | $ | 106 | |
| Non-U.S. government | | — | | | — | | | 43 | | | — | | | — | | | 43 | |
| Corporate debt | | — | | | 534 | | | 2,640 | | | — | | | — | | | 3,174 | |
| Total | | $ | — | | | $ | 534 | | | $ | 2,789 | | | $ | — | | | $ | — | | | $ | 3,323 | |
| | | | | | | | | | | | |
| | | | | | | | | | | | |
| | | | | | | | | | | | |
| | | | | | | | | | | | |
There were no securities lending agreements at December 31, 2022.
There were no reverse repurchase agreements at December 31, 2022 and December 31, 2021.
We do not currently offset any secured financing transactions. All such transactions are collateralized and margined daily consistent with market standards and subject to enforceable master netting arrangements with rights of set off.
Insurance – Statutory and Other Deposits
The total carrying value of cash and securities deposited by our insurance subsidiaries under requirements of regulatory authorities or other insurance-related arrangements, including certain annuity-related obligations and certain reinsurance treaties, was $3.5 billion and $3.9 billion at December 31, 2022 and December 31, 2021, respectively.
Other Pledges and Restrictions
Certain of our subsidiaries are members of Federal Home Loan Banks (“FHLBs”) and such membership requires the members to own stock in these FHLBs. We owned an aggregate of $222 million and $193 million of stock in FHLBs at December 31, 2022 and December 31, 2021, respectively. In addition, our subsidiaries have pledged securities available for sale and residential loans associated with borrowings and funding agreements from FHLBs, with a fair value of $4.8 billion and $1.8 billion, respectively, at December 31, 2022 and $3.7 billion and $1.4 billion, respectively, at December 31, 2021.
Certain GICs recorded in policyholder contract deposits with a carrying value of $56 million and $76 million at December 31, 2022 and December 31, 2021, respectively, have provisions that require collateral to be posted or payments to be made by us upon a downgrade of our Insurer Financial Strength ratings. The actual amount of collateral required to be posted to the counterparties in the event of such downgrades and the aggregate amount of payments that we could be required to make depend on market conditions, the fair value of outstanding affected transactions and other factors prevailing at and after the time of the downgrade. The fair value of securities pledged as collateral with respect to these obligations was approximately $63 million and $41 million at December 31, 2022 and December 31, 2021, respectively. This collateral primarily consists of securities of the U.S. government and government-sponsored entities and generally cannot be repledged or resold by the counterparties.
As part of our collateralized reinsurance transactions, we pledge collateral to cedants. The fair value of securities pledged as excess collateral with respect to these obligations was approximately $144 million and $148 million at December 31, 2022 and December 31,
ITEM 8 | Notes to Consolidated Financial Statements | 5. Investments
2021, respectively. Additionally, assets supporting these transactions are held solely for the benefit of the cedants and insulated from obligations owed to or policyholders and general creditors.
Reinsurance transactions between Corebridge and Fortitude Re were structured as modco with funds withheld.
For further discussion on the sale of Fortitude Holdings, see Note 7.
Mortgage and other loans receivable include commercial mortgages, residential mortgages, policy loans on life and annuity contracts, commercial loans, and other loans and notes receivable. Commercial mortgages, residential mortgages, commercial loans, and other loans and notes receivable are carried at unpaid principal balances less allowance for credit losses and plus or minus adjustments for the accretion or amortization of discount or premium. Interest income on such loans is accrued as earned.
Direct costs of originating commercial mortgages, commercial loans, and other loans and notes receivable, net of nonrefundable points and fees, are deferred and included in the carrying amount of the related receivables. The amount deferred is amortized to income as an adjustment to earnings using the interest method. Premiums and discounts on purchased residential mortgages are also amortized to income as an adjustment to earnings using the interest method.
Policy loans on life and annuity contracts are carried at unpaid principal balances. There is no allowance for policy loans because these loans serve to reduce the death benefit paid when the death claim is made, and the balances are effectively collateralized by the cash surrender value of the policy or annuity.
The following table presents the composition of Mortgage and other loans receivable, net:
| | | | | | | | | | | | | | |
| (in millions) | | December 31, 2022 | | December 31, 2021 |
Commercial mortgages(a) | | $ | 32,993 | | $ | 30,528 | |
| Residential mortgages | | 5,856 | | 4,672 |
| Life insurance policy loans | | 1,750 | | 1,832 |
Commercial loans, other loans and notes receivable(b) | | 4,567 | | 2,852 |
| Total mortgage and other loans receivable | | 45,166 | | 39,884 |
Allowance for credit losses(c) | | (600) | | | (496) | |
| Mortgage and other loans receivable, net | | $ | 44,566 | | $ | 39,388 |
(a)Commercial mortgages primarily represent loans for apartments, offices and retail properties, with exposures in New York and California representing the largest geographic concentrations (aggregating approximately 20% and 11%, respectively, at December 31, 2022, and 22% and 10%, respectively, at December 31, 2021). The weighted average loan-to-value ratio for NY and CA was 59% and 53% at December 31, 2022, respectively, and 51% and 53% at December 31, 2021, respectively. The debt service coverage ratio for NY and CA was 2.0X and 2.1X at December 31, 2022, respectively, and 2.0X and 1.9X at December 31, 2021, respectively.
(b)Includes loans held for sale which are carried at lower cost or market, determined on an individual loan basis, and are collateralized primarily by apartments. As of December 31, 2022 and December 31, 2021, the net carrying value of these loans was $170 million and $15 million, respectively.
(c)Does not include allowance for credit losses of $60 million and $57 million at December 31, 2022 and December 31, 2021, respectively in relation to off-balance-sheet commitments to fund commercial mortgage loans, which is recorded in Other liabilities.
Interest income is not accrued when payment of contractual principal and interest is not expected. Any cash received on impaired loans is generally recorded as a reduction of the current carrying amount of the loan. Accrual of interest income is generally resumed when delinquent contractual principal and interest are repaid or when a portion of the delinquent contractual payments are made, and the ongoing required contractual payments have been made for an appropriate period. As of December 31, 2022, $3 million and $623 million of residential mortgage loans and commercial mortgage loans, respectively, were placed on nonaccrual status. As of December 31, 2021, $7 million and $118 million of residential mortgage loans and commercial mortgage loans, respectively, were placed on nonaccrual status.
Accrued interest is presented separately and is included in Accrued investment income on the Consolidated Balance Sheets. As of December 31, 2022, accrued interest receivable was $15 million and $130 million associated with residential mortgage loans and commercial mortgage loans, respectively. As of December 31, 2021, accrued interest receivable was $11 million and $109 million associated with residential mortgage loans and commercial mortgage loans, respectively.
A significant majority of commercial mortgages in the portfolio are non-recourse loans and, accordingly, the only guarantees are for specific items that are exceptions to the non-recourse provisions. It is therefore extremely rare for us to have cause to enforce the provisions of a guarantee on a commercial real estate or mortgage loan.
Nonperforming loans are generally those loans where payment of contractual principal or interest is more than 90 days past due. Nonperforming mortgages were not significant for all periods presented.
ITEM 8 | Notes to Consolidated Financial Statements | 6. Lending Activities
CREDIT QUALITY OF COMMERCIAL MORTGAGES
The following table presents debt service coverage ratios(a) for commercial mortgages by year of vintage:
| | | | | | | | | | | | | | | | | | | | | | | | | | | | | | | | | | | | | | | | | | | | |
| December 31, 2022 | | | | | | | | | | | | | | |
| (in millions) | | 2022 | | 2021 | | 2020 | | 2019 | | 2018 | | Prior | | Total |
| >1.2X | | $ | 5,382 | | | $ | 2,043 | | | $ | 1,521 | | | $ | 4,832 | | | $ | 3,505 | | | $ | 9,948 | | | $ | 27,231 | |
| 1.00 - 1.20X | | 859 | | | 734 | | | 388 | | | 343 | | | 470 | | | 1,088 | | | 3,882 | |
| <1.00X | | 37 | | | — | | | 23 | | | 52 | | | 707 | | | 1,061 | | | 1,880 | |
| Total commercial mortgages | | $ | 6,278 | | $ | 2,777 | | $ | 1,932 | | $ | 5,227 | | $ | 4,682 | | $ | 12,097 | | $ | 32,993 |
| December 31, 2021 | | | | | | | | | | | | | | |
| (in millions) | | 2021 | | 2020 | | 2019 | | 2018 | | 2017 | | Prior | | Total |
| >1.2X | | $ | 1,861 | | | $ | 1,520 | | | $ | 4,915 | | | $ | 3,300 | | | $ | 2,997 | | | $ | 9,005 | | | $ | 23,598 | |
| 1.00 - 1.20X | | 463 | | | 810 | | | 598 | | | 1,030 | | | 88 | | | 1,684 | | | 4,673 | |
| <1.00X | | — | | | 27 | | | 71 | | | 826 | | | — | | | 1,333 | | | 2,257 | |
| Total commercial mortgages | | $ | 2,324 | | $ | 2,357 | | $ | 5,584 | | $ | 5,156 | | $ | 3,085 | | $ | 12,022 | | $ | 30,528 |
The following table presents loan-to-value ratios(b) for commercial mortgages by year of vintage:
| | | | | | | | | | | | | | | | | | | | | | | | | | | | | | | | | | | | | | | | | | | | |
| December 31, 2022 | | | | | | | | | | | | | | |
| (in millions) | | 2022 | | 2021 | | 2020 | | 2019 | | 2018 | | Prior | | Total |
| Less than 65% | | $ | 5,270 | | $ | 2,061 | | $ | 1,515 | | $ | 3,752 | | $ | 2,666 | | $ | 9,205 | | $ | 24,469 |
| 65% to 75% | | 973 | | 435 | | 391 | | 1,425 | | 1,356 | | 1,184 | | 5,764 |
| 76% to 80% | | 35 | | 43 | | — | | — | | 70 | | 218 | | 366 |
| Greater than 80% | | — | | 238 | | 26 | | 50 | | 590 | | 1,490 | | 2,394 |
| Total commercial mortgages | | $ | 6,278 | | $ | 2,777 | | $ | 1,932 | | $ | 5,227 | | $ | 4,682 | | $ | 12,097 | | $ | 32,993 |
| | | | | | | | | | | | | | |
| December 31, 2021 | | | | | | | | | | | | | | |
| (in millions) | | 2021 | | 2020 | | 2019 | | 2018 | | 2017 | | Prior | | Total |
| Less than 65% | | $ | 1,859 | | | $ | 1,935 | | | $ | 3,912 | | | $ | 4,072 | | | $ | 2,384 | | | $ | 8,264 | | | $ | 22,426 | |
| 65% to 75% | | 304 | | | 396 | | | 1,672 | | | 1,084 | | | 340 | | | 2,814 | | | 6,610 | |
| 76% to 80% | | — | | | — | | | — | | | — | | | 188 | | | 259 | | | 447 | |
| Greater than 80% | | 161 | | | 26 | | | — | | | — | | | 173 | | | 685 | | | 1,045 | |
| Total commercial mortgages | | $ | 2,324 | | | $ | 2,357 | | | $ | 5,584 | | | $ | 5,156 | | | $ | 3,085 | | | $ | 12,022 | | | $ | 30,528 | |
(a)The debt service coverage ratio compares a property’s net operating income to its debt service payments, including principal and interest. Our weighted average debt service coverage ratio was 1.9X at December 31, 2022 and 1.9X at December 31, 2021. The debt service coverage ratios have been updated within the last three months. The debt service coverage ratios are updated when additional information becomes available.
(b)The loan-to-value ratio compares the current unpaid principal balance of the loan to the estimated fair value of the underlying property collateralizing the loan. Our weighted average loan-to-value ratio was 59% at December 31, 2022, and 57% at December 31, 2021. The loan-to-value ratios have been updated within the last three to nine months.
ITEM 8 | Notes to Consolidated Financial Statements | 6. Lending Activities
The following table presents the credit quality performance indicators for commercial mortgages:
| | | | | | | | | | | | | | | | | | | | | | | | | | | | | | | | | | | | | | | | | | | | | | | | | | | | | | | | |
| (dollars in millions) | | Number
of
Loans | | Class | | | | Percent
of
Total |
| | Apartments | | Offices | | Retail | | Industrial | | Hotel | | Others | | Total(c) | |
| December 31, 2022 | | | | | | | | | | | | | | | | | | |
| Credit Quality Performance Indicator: | | | | | | | | | | | | | | | | | | |
| In good standing | | 599 | | $ | 13,226 | | $ | 8,470 | | $ | 3,192 | | $ | 5,417 | | $ | 1,749 | | $ | 290 | | $ | 32,344 | | 98% |
Restructured(a) | | 9 | | — | | 329 | | 94 | | — | | 59 | | — | | 482 | | 1% |
| 90 days or less delinquent | | — | | — | | — | | — | | — | | — | | — | | — | | —% |
>90 days delinquent or in process of foreclosure | | 3 | | — | | 167 | | — | | — | | — | | — | | 167 | | 1% |
Total(b) | | 611 | | $ | 13,226 | | $ | 8,966 | | $ | 3,286 | | $ | 5,417 | | $ | 1,808 | | $ | 290 | | $ | 32,993 | | 100% |
| Allowance for credit losses | | | | $ | 89 | | $ | 294 | | $ | 54 | | $ | 65 | | $ | 23 | | $ | 6 | | $ | 531 | | 2 | % |
| | | | | | | | | | | | | | | | | | |
| December 31, 2021 | | | | | | | | | | | | | | | | | | |
| Credit Quality Performance Indicator: | | | | | | | | | | | | | | | | | | |
| In good standing | | 613 | | $ | 12,394 | | $ | 8,370 | | $ | 4,026 | | $ | 3,262 | | $ | 1,726 | | $ | 301 | | $ | 30,079 | | 99% |
Restructured(a) | | 7 | | — | | 269 | | 17 | | — | | 104 | | — | | 390 | | 1% |
| 90 days or less delinquent | | — | | — | | — | | — | | — | | — | | — | | — | | —% |
>90 days delinquent or in process of foreclosure | | 4 | | — | | 59 | | — | | — | | — | | — | | 59 | | —% |
Total(b) | | 624 | | $ | 12,394 | | $ | 8,698 | | $ | 4,043 | | $ | 3,262 | | $ | 1,830 | | $ | 301 | | $ | 30,528 | | 100% |
| Allowance for credit losses | | | | $ | 93 | | $ | 193 | | $ | 69 | | $ | 39 | | $ | 23 | | $ | 6 | | $ | 423 | | 1 | % |
(a) Loans that have been modified in troubled debt restructurings and are performing according to their restructured terms. For additional discussion of troubled debt restructurings, see the paragraphs below.
(b) Does not reflect allowance for credit losses.
(c) Our commercial mortgage loan portfolio is current as to payments of principal and interest, for both periods presented. There were no significant amounts of nonperforming commercial mortgages (defined as those loans where payment of contractual principal or interest is more than 90 days past due) during any of the periods presented.
The following table presents credit quality performance indicators for residential mortgages by year of vintage:
| | | | | | | | | | | | | | | | | | | | | | | | | | | | | | | | | | | | | | | | | | | | |
| December 31, 2022 | | | | | | | | | | | | | | |
| (in millions) | | 2022 | | 2021 | | 2020 | | 2019 | | 2018 | | Prior | | Total |
| FICO*: | | | | | | | | | | | | | | |
| 780 and greater | | $ | 294 | | $ | 2,141 | | $ | 652 | | $ | 229 | | $ | 76 | | $ | 437 | | $ | 3,829 |
| 720 - 779 | | 536 | | 711 | | 167 | | 75 | | 32 | | 134 | | 1,655 |
| 660 - 719 | | 163 | | 79 | | 28 | | 16 | | 9 | | 47 | | 342 |
| 600 - 659 | | 2 | | 4 | | 2 | | 1 | | 2 | | 13 | | 24 |
| Less than 600 | | — | | — | | — | | 1 | | — | | 5 | | 6 |
| Total residential mortgages | | $ | 995 | | $ | 2,935 | | $ | 849 | | $ | 322 | | $ | 119 | | $ | 636 | | $ | 5,856 |
| | | | | | | | | | | | | | |
| December 31, 2021 | | | | | | | | | | | | | | |
| (in millions) | | 2021 | | 2020 | | 2019 | | 2018 | | 2017 | | Prior | | Total |
| FICO*: | | | | | | | | | | | | | | |
| 780 and greater | | $ | 1,398 | | $ | 678 | | $ | 284 | | $ | 100 | | $ | 107 | | $ | 325 | | $ | 2,892 |
| 720 - 779 | | 1,118 | | 225 | | 83 | | 41 | | 36 | | 94 | | 1,597 |
| 660 - 719 | | 44 | | 39 | | 20 | | 11 | | 13 | | 33 | | 160 |
| 600 - 659 | | 1 | | 1 | | 2 | | 3 | | 2 | | 6 | | 15 |
| Less than 600 | | — | | — | | — | | 1 | | 1 | | 6 | | 8 |
| Total residential mortgages | | $ | 2,561 | | $ | 943 | | $ | 389 | | $ | 156 | | $ | 159 | | $ | 464 | | $ | 4,672 |
* Fair Isaac Corporation (“FICO”) is the credit quality indicator used to evaluate consumer credit risk for residential mortgage loan borrowers and has been updated within the last three months.
ITEM 8 | Notes to Consolidated Financial Statements | 6. Lending Activities
METHODOLOGY USED TO ESTIMATE THE ALLOWANCE FOR CREDIT LOSSES
At the time of origination or purchase, an allowance for credit losses is established for mortgage and other loan receivables and is updated each reporting period. Changes in the allowance for credit losses are recorded in net realized gains (losses). This allowance reflects the risk of loss, even when that risk is remote, and reflects losses expected over the remaining contractual life of the loan. The allowance for credit losses considers available relevant information about the collectability of cash flows, including information about past events, current conditions, and reasonable and supportable forecasts of future economic conditions. We revert to historical information when we determine that we can no longer reliably forecast future economic assumptions.
The allowances for the commercial mortgage loans and residential mortgage loans are estimated utilizing a probability of default and loss given default model. Loss rate factors are determined based on historical data and adjusted for current and forecasted information. The loss rates are applied based on individual loan attributes and considering such data points as loan-to-value ratios, FICO scores, and debt service coverage.
The estimate of credit losses also reflects management’s assumptions on certain macroeconomic factors that include, but are not limited to, gross domestic product growth, employment, inflation, housing price index, interest rates and credit spreads.
Accrued interest is excluded from the measurement of the allowance for credit losses and accrued interest is reversed through interest income once a loan is placed on non-accrual.
When all or a portion of a loan is deemed uncollectible, the uncollectible portion of the carrying amount of the loan is charged off against the allowance.
We also have off-balance sheet commitments related to our commercial mortgage loans. The liability for expected credit losses related to these commercial mortgage loan commitments is reported in Other liabilities in the Consolidated Balance Sheets. When a commitment is funded, we record a loan receivable and reclassify the liability for expected credit losses related to the commitment into loan allowance for expected credit losses. Other changes in the liability for expected credit losses on loan commitments are recorded in Net realized gains (losses) in the Consolidated Statements of Income (Loss).
The following table presents a rollforward of the changes in the allowance for credit losses on Mortgage and other loans receivable:*
| | | | | | | | | | | | | | | | | | | | | | | | | | | | | | | | | | | | | | | | | | |
| Years Ended December 31, | | 2022 | | 2021 | | 2020 |
| (in millions) | | Commercial Mortgages | | Other Loans | | Total | | Commercial Mortgages | | Other Loans | | Total | | Commercial Mortgages | | Other Loans | | Total |
| Allowance, beginning of year | | $ | 423 | | $ | 73 | | $ | 496 | | $ | 546 | | $ | 111 | | $ | 657 | | $ | 266 | | $ | 91 | | $ | 357 |
| Initial allowance upon CECL adoption | | — | | — | | — | | — | | — | | — | | 272 | | 2 | | 274 |
| Loans charged off | | (13) | | — | | (13) | | (1) | | — | | (1) | | (12) | | (5) | | (17) |
| | | | | | | | | | | | | | | | | | |
| Net charge-offs | | (13) | | — | | (13) | | (1) | | | — | | (1) | | | (12) | | | (5) | | (17) | |
| Addition to (release of) allowance for loan losses | | 121 | | (4) | | 117 | | (122) | | | (19) | | | (141) | | | 20 | | | 23 | | | 43 | |
| | | | | | | | | | | | | | | | | | |
| Divestitures | | — | | — | | — | | — | | (19) | | (19) | | — | | — | | — |
| | | | | | | | | | | | | | | | | | |
| Allowance, end of year | | $ | 531 | | $ | 69 | | $ | 600 | | $ | 423 | | $ | 73 | | $ | 496 | | $ | 546 | | $ | 111 | | $ | 657 |
* Does not include allowance for credit losses of $60 million, $57 million and $57 million, respectively, at December 31, 2022, 2021 and 2020 in relation to the off-balance-sheet commitments to fund commercial mortgage loans, which is recorded in Other liabilities in the Consolidated Balance Sheets.
As a result of the COVID-19 pandemic, including the significant global economic slowdown and general market decline, our expectations and models used to estimate the allowance for losses on commercial and residential mortgage loans have been updated to reflect the economic environment. The full impact of COVID-19 on real estate valuations remains uncertain and we will continue to review our valuations as further information becomes available.
TROUBLED DEBT RESTRUCTURINGS
We modify loans to optimize their returns and improve their collectability, among other things. When we undertake such a modification with a borrower that is experiencing financial difficulty and the modification involves us granting a concession to the troubled debtor, the modification is a troubled debt restructuring (“TDR”). We assess whether a borrower is experiencing financial difficulty based on a variety of factors, including the borrower’s current default on any of its outstanding debt, the probability of a default on any of its debt in the foreseeable future without the modification, the insufficiency of the borrower’s forecasted cash flows to service any of its outstanding debt (including both principal and interest) and the borrower’s inability to access alternative third-party financing at an interest rate that would be reflective of current market conditions for a non-troubled debtor. Concessions granted may include extended maturity dates, interest rate changes, principal or interest forgiveness, payment deferrals and easing of loan covenants.
During the years ended December 31, 2022 and 2021, loans with a carrying value of $143 million and $280 million, respectively, were modified in TDRs.
ITEM 8 | Notes to Consolidated Financial Statements | 7. Reinsurance
In the ordinary course of business, our insurance companies may use ceded reinsurance to limit potential losses, provide additional capacity for growth, minimize exposure to significant risks or to provide greater diversification of our businesses. We may also use assumed reinsurance to diversify our business. Our reinsurance is principally under YRT treaties, along with a large modco treaty reinsuring the majority of our legacy business to a former affiliate, Fortitude Re. Reinsurance premiums ceded are recognized when due, along with corresponding benefits. Amounts recoverable from reinsurers are presented as a component of Reinsurance assets.
Reinsurance assets include the balances due from reinsurance and insurance companies under the terms of our reinsurance agreements for ceded future policy benefits for life and accident and health insurance contracts and benefits paid and unpaid. We remain liable to the extent that our reinsurers do not meet their obligations under the reinsurance contracts, and as such, we regularly evaluate the financial condition of our reinsurers and monitor concentration of our credit risk. The estimation of the allowance for credit losses and disputes requires judgment for which key inputs typically include historical trends regarding uncollectible balances, disputes and credit events as well as specific reviews of balances in dispute or subject to credit impairment. Changes in the allowance for credit losses and disputes on reinsurance assets are reflected in Policyholder benefits within the Consolidated statements of income (loss).
Prior to the adoption of the Targeted Improvements to the Accounting for Long-Duration Contracts Standard
Prior to January 1, 2021, assumptions used in estimating reinsurance recoverables related to coinsurance or modco contracts were consistent with those used in estimating the related liabilities and reflected locked-in assumptions, absent a loss recognition event. Amounts recoverable on YRT treaties were recognized when claims were incurred on the reinsured policies.
Subsequent to the adoption of the Targeted Improvements to the Accounting for Long-Duration Contracts Standard
Reinsurance recoverables are recognized in a manner consistent with the liabilities relating to the underlying reinsured contracts. The reinsurance recoverables for coinsurance and modco contracts, along with amounts recoverable on YRT treaties are determined based on updated NPRs, reflecting updated actuarial assumptions using locked-in upper-medium investment instrument yield discount rates with changes recognized as remeasurement gains and losses reported in income. In addition, reinsurance recoverables are remeasured at the balance sheet date using current upper-medium grade discount rates with changes reported in OCI. For reinsurance agreements that reinsure existing, or non-contemporaneous (in-force) traditional and limited payment long-duration insurance contracts, the reinsurance recoverable is measured using the upper-medium grade fixed-income instrument yield discount rate assumption related to the effective date of the reinsurance contract. Therefore, for non-contemporaneous reinsurance agreements executed after January 1, 2021, the locked-in rate to accrete interest into the income statement related to the reinsurance recoverable would be different from the locked-in rate used for accreting interest on the direct reserve for future policy benefits. Certain reinsured guaranteed benefits previously reported as reinsurance recoverables are classified as Market risk benefit assets in the Consolidated Balance Sheets and are measured at fair value.
The following table presents the transition rollforward for reinsurance recoverables:
| | | | | | | | | | | | | | | | | | | | | | | | | | | |
| Individual | | | | Life | | Institutional | | | | |
| (in millions) | Retirement | | | | Insurance | | Markets | | | | Total |
Pre-adoption, December 31, 2020 for Reinsurance assets - other, net of allowance for credit losses and disputes(a) | $ | 309 | | | | | $ | 2,370 | | | $ | 43 | | | | | $ | 2,722 | |
Reclassification of Cost of Reinsurance(b) | — | | | | | 416 | | | — | | | | | 416 | |
| Reclassification to Market risk benefits | (35) | | | | | — | | | — | | | | | (35) | |
| Change in cash flow assumptions and effect of net premiums exceeding gross premiums | — | | | | | (52) | | | — | | | | | (52) | |
| Change due to the current upper-medium grade discount rate | — | | | | 99 | | 5 | | | | 104 |
| Post-adoption January 1, 2021 for Reinsurance assets - other, net of allowance for credit losses and disputes | $ | 274 | | | | $ | 2,833 | | $ | 48 | | | | $ | 3,155 |
(a) Excludes $(15) million of Reinsurance assets - other, net of allowance for credit losses and disputes in Other Operations.
(b) Cost of reinsurance is reported in Other liabilities in the Condensed Consolidated Balance sheets.
ITEM 8 | Notes to Consolidated Financial Statements | 7. Reinsurance
| | | | | | | | | | | | | | | | | |
| | | | | | | | | Corporate and | | |
| (in millions) | | | | | | | | | Other | | |
| Pre-adoption, December 31, 2020 for Reinsurance assets - Fortitude Re, net of allowance for credit losses and disputes | | | | | | | | | $ | 29,158 | | | |
| Change in cash flow assumptions and effect of net premiums exceeding gross premiums | | | | | | | | | 55 | | | |
| Change due to the current upper-medium grade discount rate | | | | | | | | | 7,611 | | |
| Post-adoption January 1, 2021 for Reinsurance assets - Fortitude Re, net of allowance for credit losses and disputes | | | | | | | | | $ | 36,824 | | |
The remeasurement of the reinsurance recoverable using the current upper-medium grade discount rate is offset in AOCI.
The following table presents the impacts of reinsurance ceded and the corresponding gross liabilities on the Consolidated Balance Sheets:
| | | | | | | | | | | |
| December 31, | | | |
| (in millions) | 2022 | | 2021 |
| Assets | | | |
| Reinsurance assets, net of allowance | $ | 2,517 | | $ | 3,101 |
| Reinsurance assets - Fortitude Re, net of allowance | 26,844 | | 34,102 |
| Total Assets | $ | 29,361 | | $ | 37,203 |
| Liabilities | | | |
| Future policy benefits for life and accident and health insurance contracts | $ | 50,518 | | $ | 64,270 |
| Policyholder contract deposits | 156,058 | | 151,545 |
| Other policyholder funds | 2,885 | | 2,879 |
| Total Liabilities | $ | 209,461 | | $ | 218,694 |
The following table presents premiums earned, policy fees, and policyholder benefits for our long-duration life insurance and annuity operations:
| | | | | | | | | | | | | | | | | |
| Years Ended December 31, | | | | | |
| (in millions) | 2022 | | 2021 | | 2020 |
Premiums(a) | | | | | |
| Direct | $ | 4,739 | | $ | 4,603 | | $ | 4,384 |
Assumed(b) | 1,318 | | 2,265 | | 1,073 |
| Ceded | (966) | | (1,215) | | (1,116) |
| Net | $ | 5,091 | | $ | 5,653 | | $ | 4,341 |
Policy Fees(a) | | | | | |
| Direct | $ | 2,992 | | $ | 3,090 | | $ | 2,957 |
| Assumed | — | | — | | — |
| Ceded | (78) | | (85) | | (83) |
| Net | $ | 2,914 | | $ | 3,005 | | $ | 2,874 |
| Policyholder benefits* | | | | | |
| Direct | $ | 8,864 | | $ | 10,029 | | $ | 9,092 |
| Assumed | 74 | | 47 | | 32 |
| Ceded | (2,218) | | (2,689) | | (2,522) |
| Net | $ | 6,720 | | $ | 7,387 | | $ | 6,602 |
(a) The results for the years ended December 31, 2022 and 2021 have been updated to reflect the adoption of LDTI. No updates have been made to the results for the year ended December 31, 2020 as our effective date for LDTI adoption was January 1, 2021.
(b) Assumed premiums includes premium from pension risk transfer agreements of $1.3 billion, $2.3 billion, and $1.1 billion for the years ended December 31, 2022, 2021 and 2020, respectively.
FORTITUDE RE
In February 2018, AGL, VALIC and USL entered into a modco agreement with Fortitude Re, then a wholly owned AIG subsidiary and registered Class 4 and Class E reinsurer in Bermuda. Fortitude Holdings was formed by AIG to act as a holding company for Fortitude Re.
These reinsurance transactions between Corebridge and Fortitude Re were structured as modco arrangements. In the modco, the investments supporting the reinsurance agreements, and which reflect the majority of the consideration that would be paid to the reinsurer for entering into the transaction, are withheld by, and therefore continue to reside on the balance sheet of, the ceding company (i.e., Corebridge) thereby creating an obligation for the ceding company to pay the reinsurer (i.e., Fortitude Re) at a later date. Additionally, as Corebridge maintains ownership of these investments, Corebridge will maintain its existing accounting for these assets (e.g., the changes in fair value of available-for-sale securities will be recognized within other comprehensive income (loss)).
ITEM 8 | Notes to Consolidated Financial Statements | 7. Reinsurance
Corebridge has established a funds withheld payable to Fortitude Re while simultaneously establishing a reinsurance asset representing liabilities for the insurance coverage that Fortitude Re has assumed. The funds withheld payable contains an embedded derivative and changes in fair value of the embedded derivative related to the funds withheld payable are recognized in earnings through realized gains (losses). This embedded derivative is considered a total return swap with contractual returns that are attributable to various assets and liabilities associated with these reinsurance agreements.
As our accounting policy is to include reinsurance balances when performing loss recognition testing and as there will be no future profits recognized on this business, we will not incur any future loss recognition events related to business ceded to Fortitude Re.
On July 1, 2020, the Company amended the modco agreements. Under the terms of the amendment, certain business ceded to Fortitude Re was recaptured by the Company and certain additional business was ceded by the Company to Fortitude Re. We recorded an additional $91 million loss associated with this amendment.
As of December 31, 2022, and 2021, respectively, approximately $26.8 billion and $34.1 billion of liabilities related to business written by Corebridge, had been ceded to Fortitude Re under these reinsurance transactions. As of closing of the Majority Interest Fortitude Sale, these reinsurance transactions are no longer considered affiliated transactions.
There is a diverse pool of assets supporting the funds withheld arrangements with Fortitude Re. The following summarizes the composition of the pool of assets:
| | | | | | | | | | | | | | | | | | | | | | | | | | | | | | | | |
| | December 31, 2022 | | December 31, 2021 | | |
| (in millions) | | Carrying Value | | Fair Value | | Carrying Value | | Fair Value | | Corresponding Accounting Policy |
| Fixed maturity securities - available for sale | | $ | 16,339 | | $ | 16,339 | | $ | 27,180 | | $ | 27,180 | | Fair value through other comprehensive income |
| Fixed maturity securities - fair value option | | 3,485 | | 3,485 | | 1,593 | | 1,593 | | Fair value through net investment income |
| Commercial mortgage loans | | 3,490 | | 3,241 | | 3,179 | | 3,383 | | Amortized cost |
| Real estate investments | | 133 | | 348 | | 201 | | 395 | | Amortized cost |
| Private equity funds/hedge funds | | 1,893 | | 1,893 | | 1,606 | | 1,606 | | Fair value through net investment income |
| Policy loans | | 355 | | 355 | | 380 | | 380 | | Amortized cost |
| Short-term Investments | | 69 | | 69 | | 50 | | 50 | | Fair value through net investment income |
| Funds withheld investment assets | | 25,764 | | 25,730 | | 34,189 | | 34,587 | | |
Derivative assets, net(a) | | 90 | | 90 | | 81 | | 81 | | Fair value through realized gains (losses) |
Other(b) | | 731 | | 731 | | 476 | | 476 | | Amortized cost |
| Total | | $ | 26,585 | | $ | 26,551 | | $ | 34,746 | | $ | 35,144 | | |
(a) The derivative assets and liabilities have been presented net of cash collateral. The derivative assets supporting the Fortitude Re funds withheld arrangements had a fair market value of $189 million and $387 million as of December 31, 2022 and December 31, 2021, respectively. These derivative assets and liabilities are fully collateralized either by cash or securities.
(b) Primarily comprised of Cash and Accrued investment income.
The impact of the funds withheld arrangements with Fortitude Re was as follows:
| | | | | | | | | | | | | | | | | | | |
| Years Ended December 31, | | |
| (in millions) | 2022 | | 2021 | | 2020 | | |
| Net investment income - Fortitude Re funds withheld assets | $ | 891 | | $ | 1,775 | | $ | 1,427 | | |
| Net realized gains (losses) on Fortitude Re funds withheld assets: | | | | | | | |
| Net realized gains (losses) Fortitude Re funds withheld assets | (397) | | 924 | | 1,002 | | |
| Net realized gains (losses) Fortitude Re funds withheld embedded derivatives | 6,347 | | (687) | | (3,978) | | |
| Net realized gains (losses) on Fortitude Re funds withheld assets | 5,950 | | 237 | | (2,976) | | |
| Income (loss) before income tax benefit (expense) | 6,841 | | 2,012 | | (1,549) | | |
| Income tax benefit (expense)* | (1,437) | | (423) | | 325 | | |
| Net income (loss) | 5,404 | | 1,589 | | (1,224) | | |
| Change in unrealized appreciation (depreciation) of the invested assets supporting the Fortitude Re modco arrangement classified as available for sale* | (5,064) | | (1,488) | | 1,165 | | |
| Comprehensive income (loss) | $ | 340 | | $ | 101 | | $ | (59) | | |
* The income tax expense (benefit) and the tax impact in accumulated other comprehensive income was computed using Corebridge’s U.S. statutory tax rate of 21%.
Various assets supporting the Fortitude Re funds withheld arrangements are reported at amortized cost, and as such, changes in the fair value of these assets are not reflected in the financial statements. However, changes in the fair value of these assets are included in the embedded derivative in the Fortitude Re funds withheld arrangement and the appreciation (depreciation) of the assets is the primary driver of the comprehensive income (loss) reflected above.
ITEM 8 | Notes to Consolidated Financial Statements | 7. Reinsurance
REINSURANCE SECURITY
Our third-party reinsurance arrangements do not relieve us from our direct obligations to our beneficiaries. Thus, a credit exposure exists to the extent that any reinsurer fails to meet the obligations assumed under any reinsurance agreement. We hold substantial collateral as security under related reinsurance agreements in the form of funds, securities, and/or letters of credit, as well as funds withheld reinsurance structures. A provision has been recorded for estimated unrecoverable reinsurance. Fortitude Re is our only reinsurer where the amount due from the reinsurer is in excess of 5% of our total reinsurance assets. Our reinsurance asset with Fortitude Re was $26.8 billion and $34.1 billion as of December 31, 2022 and 2021, respectively. Assets held by Corebridge with a fair value of $26.6 billion and $35.1 billion as of December 31, 2022 and 2021, respectively, provide collateral supporting funds withheld balances due to Fortitude Re in excess of the respective reinsurance recoverable assets. We believe that no exposure to a single reinsurer represents an inappropriate concentration of credit risk to Corebridge.
STATUTORY REINSURANCE
In addition to contracts which qualify for reinsurance accounting under U.S. GAAP, the Company also manages its risks through contracts which follow deposit accounting. Expenses associated with these contracts are recorded in General operating and other expenses within the Consolidated Statements of Income (Loss). For example, certain of our insurance companies manage the capital impact of their statutory reserve requirements, including those resulting from the NAIC Model Regulation “Valuation of Life Insurance Policies” (“Regulation XXX”) and NAIC Actuarial Guideline 38 (“Guideline AXXX”), through reinsurance transactions which do not qualify for reinsurance accounting under U.S. GAAP. Effective July 1, 2016, AGL entered into an agreement to cede approximately $5 billion of statutory reserves for certain whole life and universal life policies to an unaffiliated reinsurer. Effective December 31, 2016, AGL recaptured term and universal life reserves of $16 billion from AGC, subject to Regulation XXX and Guideline AXXX, and ceded approximately $14 billion of such statutory reserves to an unaffiliated reinsurer under an amendment to the July 1, 2016 agreement. Under one affiliated reinsurance arrangement, USL obtains letters of credit to support statutory recognition of the ceded reinsurance. As of December 31, 2022 USL had one bilateral letter of credit currently in the amount of $175 million, which was issued on May 9, 2022 and expires on February 7, 2026. As of May 12, 2022, this letter of credit is subject to reimbursement by Corebridge Parent in the event of a drawdown.
For additional information on the use of affiliated reinsurance for Regulation XXX and Guideline AXXX reserves, see Note 19.
REINSURANCE – CREDIT LOSSES
The estimation of reinsurance recoverables involves a significant amount of judgment. Reinsurance assets include reinsurance recoverables on future policy benefits and policyholder contract deposits that are estimated as part of our insurance liability valuation process and, consequently, are subject to similar judgments and uncertainties as the estimation of gross benefit liabilities.
We assess the collectability of reinsurance recoverable balances in each reporting period, through either historical trends of disputes and credit events or financial analysis of the credit quality of the reinsurer. We record adjustments to reflect the results of these assessments through an allowance for credit losses and disputes on uncollectible reinsurance that reduces the carrying amount of reinsurance and other assets on the Consolidated Balance Sheets (collectively, the reinsurance recoverable balances). This estimate requires significant judgment for which key considerations include:
•paid and unpaid amounts recoverable;
•whether the balance is in dispute or subject to legal collection;
•the relative financial health of the reinsurer as classified by the Obligor Risk Ratings (“ORRs”) we assign to each reinsurer based upon our financial reviews; insurers that are financially troubled (i.e., in run-off, have voluntarily or involuntarily been placed in receivership, are insolvent, are in the process of liquidation or otherwise subject to formal or informal regulatory restriction) are assigned ORRs that will generate a significant allowance; and
•whether collateral and collateral arrangements exist.
An estimate of the reinsurance recoverable’s lifetime expected credit losses is established utilizing a probability of default and loss given default method, which reflects the reinsurer’s ORR. The allowance for credit losses excludes disputed amounts. An allowance for disputes is established for a reinsurance recoverable using the losses incurred model for contingencies.
The total reinsurance recoverables as of December 31, 2022 were $29.4 billion. As of that date, utilizing Corebridge’s ORRs, (i) approximately 100% of the reinsurance recoverables were investment grade, (ii) less than 1% were non-investment grade reinsurance recoverables and (iii) none of the reinsurance recoverables were related to entities that were not rated by Corebridge.
ITEM 8 | Notes to Consolidated Financial Statements | 7. Reinsurance
Reinsurance Recoverable Allowance
The following table presents a rollforward of the reinsurance recoverable allowance:
| | | | | | | | | | | | | | | | | | |
| | | | Years Ended December 31, |
| (in millions) | | | | | | 2022 | | 2021 |
| Balance, beginning of year | | | | | | $ | 101 | | $ | 83 |
| Current period provision for expected credit losses and disputes | | | | | | 8 | | 18 |
| Write-offs charged against the allowance for credit losses and disputes | | | | | | — | | — |
| Other changes | | | | | | (25) | | — |
| Balance, end of year | | | | | | $ | 84 | | $ | 101 |
There were no material recoveries of credit losses previously written off for the years ended December 31, 2022 or 2021.
Past-Due Status
We consider a reinsurance asset to be past due when it is 90 days past due and record an allowance for disputes when there is reasonable uncertainty of the collectability of a disputed amount during the reporting period. Past-due balances were not significant for any of the periods presented. Certain reinsurers with whom we have disputes have initiated arbitration proceedings against us, and others may initiate them in the future.
For further discussion of arbitration proceedings against us, see Note 16.
8. Deferred Policy Acquisition Costs
DAC represent those costs that are incremental and directly related to the successful acquisition of new or renewal of existing insurance contracts. We defer incremental costs that result directly from, and are essential to, the acquisition or renewal of an insurance contract. Such DAC generally include agent or broker commissions and bonuses, and medical fees that would not have been incurred if the insurance contract had not been acquired or renewed. Each cost is analyzed to assess whether it is fully deferrable. We partially defer costs, including certain commissions, when we do not believe that the entire cost is directly related to the acquisition or renewal of insurance contracts. Commissions that are not deferred to DAC are recorded in Non-deferrable insurance commissions in the Consolidated Statements of Income.
We also defer a portion of employee total compensation and payroll-related fringe benefits directly related to time spent performing specific acquisition or renewal activities, including costs associated with the time spent on underwriting, policy issuance and processing, and sales force contract selling. The amounts deferred are derived based on successful efforts for each distribution channel and/or cost center from which the cost originates.
Prior to the adoption of the Targeted Improvements to the Accounting for Long-Duration Contracts Standard
Long-duration insurance contracts: Policy acquisition costs for participating life, traditional life and accident and health insurance products were generally deferred and amortized, with interest, over the premium paying period. The assumptions used to calculate the benefit liabilities and DAC for these traditional products were set when a policy was issued and did not change with changes in actual experience, unless a loss recognition event occurred. These “locked-in” assumptions included mortality, morbidity, persistency, maintenance expenses and investment returns, and included margins for adverse deviation to reflect uncertainty given that actual experience might deviate from these assumptions. A loss recognition event occurred when there was a shortfall between the carrying amount of future policy benefit liabilities, net of DAC, and what the future policy benefit liabilities, net of DAC, would be when applying updated current assumptions. When we determined a loss recognition event had occurred, we first reduced any DAC related to that block of business through amortization of acquisition expense, and after DAC was depleted, we recorded additional liabilities through a charge to Policyholder benefits. Groupings for loss recognition testing were consistent with our manner of acquiring, servicing and measuring the profitability of the business and applied by product groupings. We performed separate loss recognition tests for traditional life products, payout annuities and long-term care products. Our policy was to perform loss recognition testing net of reinsurance. Once loss recognition had been recorded for a block of business, the old assumption set was replaced, and the assumption set used for the loss recognition would then be subject to the lock-in principle.
Investment-oriented contracts: Certain policy acquisition costs and policy issuance costs related to investment-oriented contracts, for example universal life, variable and fixed annuities, and fixed index annuities, were deferred and amortized, with interest, in relation to the incidence of EGPs to be realized over the estimated lives of the contracts. EGPs were affected by a number of factors, including levels of current and expected interest rates, net investment income and spreads, net realized gains and losses, fees, surrender rates, mortality experience, policyholder behavior experience and equity market returns and volatility. In each reporting period, current period amortization expense was adjusted to reflect actual gross profits. If the assumptions used for estimating gross
ITEM 8 | Notes to Consolidated Financial Statements | 8. Deferred Policy Acquisition Costs
profit changed significantly, DAC was recalculated using the new assumptions, including actuarial assumptions such as mortality, lapse, benefit utilization, and premium persistency, and any resulting adjustment was included in income. If the new assumptions indicated that future EGPs were higher than previously estimated, DAC was increased resulting in a decrease in amortization expense and increase in income in the current period; if future EGPs were lower than previously estimated, DAC was decreased resulting in an increase in amortization expense and decrease in income in the current period. Updating such assumptions may result in acceleration of amortization in some products and deceleration of amortization in other products. DAC was grouped consistent with the manner in which the insurance contracts were acquired, serviced and measured for profitability and was reviewed for recoverability based on the current and projected future profitability of the underlying insurance contracts.
To estimate future EGPs for variable life and annuity products, a long-term annual asset growth assumption was applied to determine the future growth in assets and related asset-based fees. In determining the asset growth rate, the effect of short-term fluctuations in the equity markets was partially mitigated through the use of a “reversion to the mean” methodology for variable annuities, whereby short-term asset growth above or below long-term annual rate assumptions impacted the growth assumption applied to the five-year period subsequent to the current balance sheet date. The reversion to the mean methodology allowed us to maintain our long-term growth assumptions, while also giving consideration to the effect of actual investment performance. When actual performance significantly deviated from the annual long-term growth assumption, as evidenced by growth assumptions in the five-year reversion to the mean period falling below a certain rate (floor) or rising above a certain rate (cap) for a sustained period, judgment was applied to revise or “unlock” the growth rate assumptions to be used for both the five-year reversion to the mean period as well as the long-term annual growth assumption applied to subsequent periods.
Value of Business Acquired (“VOBA”) is determined at the time of acquisition and is reported in the Consolidated Balance Sheets with DAC. This value is based on the present value of future pre-tax profits discounted at yields applicable at the time of purchase. VOBA was amortized, consistent with DAC, i.e., over the premium paying period or in relation to the EGPs.
Unrealized Appreciation (Depreciation) of Investments: DAC related to investment-oriented contracts was also adjusted to reflect the effect of unrealized gains or losses on fixed maturity securities available for sale on EGPs, with related changes recognized through Other comprehensive income. The adjustment was made at each balance sheet date, as if the securities had been sold at their stated aggregate fair value and the proceeds reinvested at current yields. Similarly, for long-duration traditional insurance contracts, if the assets supporting the liabilities were in a net unrealized gain position at the balance sheet date, loss recognition testing assumptions were updated to exclude such gains from future cash flows by reflecting the impact of reinvestment rates on future yields. If a future loss was anticipated under this basis, any additional shortfall indicated by loss recognition tests was recognized as a reduction in Accumulated other comprehensive income. Similar to other loss recognition on long-duration insurance contracts, such shortfall is first reflected as a reduction in DAC and secondly as an increase in liabilities for Future policy benefits. The change in these adjustments, net of tax, was included with the change in net unrealized appreciation of investments that is credited or charged directly to Other comprehensive income.
Internal Replacements of Long-duration and Investment-oriented Products: For some products, policyholders can elect to modify product benefits, features, rights or coverages by exchanging a contract for a new contract or by amendment, endorsement, or rider to a contract, or by the election of a feature or coverage within a contract. These transactions are known as internal replacements. If the modification does not substantially change the contract, we do not change the accounting and amortization of existing DAC and related actuarial balances. If an internal replacement represents a substantial change, the original contract is considered to be extinguished and any related DAC or other policy balances are charged or credited to income, and any new deferrable costs associated with the replacement contract are deferred.
Subsequent to the adoption of the Targeted Improvements to the Accounting for Long-Duration Contracts Standard
DAC for all contracts, except for those with limited to no exposure to policyholder behavior risk (i.e., certain investment contracts), is grouped and amortized on a constant level basis (i.e., approximating straight line amortization with adjustments for expected terminations) over the expected term of the related contracts using assumptions consistent with those used in estimating the related liability for future policy benefits, or any other related balances, for those corresponding contracts, as applicable. Capitalized expenses are only included in DAC amortization as expenses are incurred. For amortization purposes, contracts are grouped into annual cohorts by issue year and product and to segregate reinsured and non-reinsured contracts. For life insurance contracts, amortization is based on insurance in-force, while policy counts are used for deferred annuity contracts and expected future benefits payments for structured settlements and pension risk transfer products. Changes in future assumptions (e.g., expected duration of contracts or amount of coverage expected to be in force) are applied by adjusting the amortization rate prospectively. The Company has elected to implicitly account for actual experience, whether favorable or unfavorable, in its amortization expense each period. DAC is capped at the amount of expenses capitalized as the DAC balance does not accrue interest. DAC is not subject to recoverability testing.
VOBA: VOBA is determined at the time of acquisition and is reported in the Consolidated Balance Sheets with DAC. This value is based on the present value of future pre-tax profits discounted at yields applicable at the time of purchase. VOBA is amortized, consistent with DAC, i.e., over the life of the business on a constant level basis.
ITEM 8 | Notes to Consolidated Financial Statements | 8. Deferred Policy Acquisition Costs
Internal Replacements of Long-duration and Investment-oriented Products: the accounting of internal replacements has generally not been impacted by the adoption of LDTI.
The following table presents the transition rollforward for deferred policy acquisition costs for long-duration contracts:
| | | | | | | | | | | | | | | | | | | | | | | | | | | | | | | | |
| | Individual
Retirement | | Group
Retirement | | Life
Insurance | | Institutional
Markets | | Total |
| (in millions) | | | | | |
| | | | | | | | | | |
| | | | | | | | | | |
| Pre-adoption December 31, 2020 DAC balance | | $ | 2,426 | | | $ | 560 | | | $ | 4,229 | | | $ | 26 | | | $ | 7,241 | |
| Adjustments for the removal of related balances in Accumulated other comprehensive income originating from unrealized gains (losses) | | 2,050 | | | 533 | | | 544 | | | 7 | | | 3,134 | |
| Post-adoption January 1, 2021 DAC balance | | $ | 4,476 | | | $ | 1,093 | | | $ | 4,773 | | | $ | 33 | | | $ | 10,375 | |
Prior to the adoption of LDTI, DAC for investment-oriented products included the effect of unrealized gains or losses on fixed maturity securities classified as available for sale. At the transition date, these adjustments were removed with a corresponding offset in AOCI. As the available for sale portfolio was in an unrealized gain position as of the transition date, the adjustment for removal of related balances in AOCI originating from unrealized gains (losses) balances were reducing DAC.
The following table presents the transition rollforward for value of business acquired for long-duration contracts:
| | | | | | | | | | | | | | | | | | | | | | | | | | | | |
| | Individual
Retirement | | Group
Retirement | | Life
Insurance | | | Total |
| (in millions) | | | | | |
| | | | | | | | | | |
| | | | | | | | | | |
| Pre-adoption December 31, 2020 VOBA balance | | | $ | 3 | | | $ | 1 | | | $ | 118 | | | | $ | 122 | |
| Adjustments for the removal of related balances in accumulated other comprehensive income originating from unrealized gains (losses) | | | — | | | — | | | 3 | | | | 3 | |
| Post-adoption January 1, 2021 VOBA balance | | | $ | 3 | | | $ | 1 | | | $ | 121 | | | | $ | 125 | |
Prior to the adoption of LDTI, VOBA for investment-oriented products included the effect of unrealized gains or losses on fixed maturity securities classified as available for sale. At the transition date, these adjustments were removed with a corresponding offset in AOCI. As the available for sale portfolio was in an unrealized gain position as of the transition date, the adjustment for removal of related balances in AOCI originating from unrealized gains (losses) balances was reducing VOBA.
The following table presents a rollforward of deferred policy acquisition costs related to long-duration contracts for the years ended December 31, 2022*, 2021*, and 2020:
| | | | | | | | | | | | | | | | | | | | | | | | | | | | | | | | |
| Year Ended December 31, 2022 | | Individual
Retirement | | Group
Retirement | | Life
Insurance | | Institutional
Markets | | Total |
| (in millions) | | | | | |
| | | | | | | | | | |
| | | | | | | | | | |
| Balance, beginning of year | | $ | 4,604 | | | $ | 1,078 | | | $ | 4,765 | | | $ | 38 | | | $ | 10,485 | |
| Capitalization | | 562 | | | 62 | | | 414 | | | 21 | | | 1,059 | |
| Amortization expense | | (523) | | | (80) | | | (401) | | | (7) | | | (1,011) | |
| Other, including foreign exchange | | — | | | — | | | (60) | | | (1) | | | (61) | |
| Balance, end of year | | $ | 4,643 | | | $ | 1,060 | | | $ | 4,718 | | | $ | 51 | | | $ | 10,472 | |
| Value of Business Acquired | | 3 | | | 1 | | | 87 | | | — | | | 91 | |
| | | | | | | | | | |
| Deferred policy acquisition costs and value of business acquired | | $ | 4,646 | | | $ | 1,061 | | | $ | 4,805 | | | $ | 51 | | | $ | 10,563 | |
| | | | | | | | | | | | | | | | | | | | | | | | | | | | | | | | |
| Year Ended December 31, 2021 | | Individual
Retirement | | Group
Retirement | | Life
Insurance | | Institutional
Markets | | Total |
| (in millions) | | | | | |
| Balance, beginning of year | | $ | 4,476 | | | $ | 1,093 | | | $ | 4,773 | | | $ | 33 | | | $ | 10,375 | |
| Capitalization | | 579 | | | 63 | | | 404 | | | 10 | | | 1,056 | |
| Amortization expense | | (451) | | | (78) | | | (406) | | | (6) | | | (941) | |
| Other, including foreign exchange | | — | | | — | | | (6) | | | 1 | | | (5) | |
| Balance, end of year | | $ | 4,604 | | | $ | 1,078 | | | $ | 4,765 | | | $ | 38 | | | $ | 10,485 | |
| Value of Business Acquired | | 3 | | | 1 | | | 109 | | | — | | | 113 | |
| | | | | | | | | | |
| Deferred policy acquisition costs and value of business acquired | | $ | 4,607 | | | $ | 1,079 | | | $ | 4,874 | | | $ | 38 | | | $ | 10,598 | |
ITEM 8 | Notes to Consolidated Financial Statements | 8. Deferred Policy Acquisition Costs
| | | | | | | | | | | | | | |
| Year Ended December 31, | | | | | | 2020 | | |
| (in millions) | | | | |
| | | | | | | | |
| | | | | | | | |
| Balance, beginning of year | | | | | | $ | 7,939 | | | |
| Impact of CECL adoption | | | | | | 15 | | | |
| Capitalizations | | | | | | 889 | | | |
| Amortization expense | | | | | | (532) | | | |
| Change related to unrealized appreciation (depreciation) of investments | | | | | | (1,085) | | | |
| Other, including foreign exchange | | | | | | 15 | | | |
| Balance, end of year | | | | | | $ | 7,241 | | | |
*The results for the years ended December 31, 2022 and 2021 have been updated to reflect the adoption of LDTI. No updates have been made to the results for the year ended December 31, 2020 as our effective date for LDTI adoption was January 1, 2021.
The following table presents a rollforward of value of business acquired for the years ended December 31, 2022*, 2021* and 2020:
| | | | | | | | | | | | | | | | | | | | | | | | | | | | |
| Year Ended December 31, 2022 | | Individual
Retirement | | Group
Retirement | | Life
Insurance | | | Total |
| (in millions) | | | | | |
| | | | | | | | | | |
| | | | | | | | | | |
| Balance, beginning of year | | | $ | 3 | | | $ | 1 | | | $ | 109 | | | | $ | 113 | |
| | | | | | | | | | |
| Amortization expense | | | — | | | — | | | (9) | | | | (9) | |
| | | | | | | | | | |
| | | | | | | | | | |
| Other, including foreign exchange | | | — | | | — | | | (13) | | | | (13) | |
| Balance, end of year | | | $ | 3 | | | $ | 1 | | | $ | 87 | | | | $ | 91 | |
| | | | | | | | | | | | | | | | | | | | | | | | | | | | |
| Year Ended December 31, 2021 | | Individual
Retirement | | Group
Retirement | | Life
Insurance | | | Total |
| (in millions) | | | | | |
| | | | | | | | | | |
| | | | | | | | | | |
| Balance, beginning of year | | | $ | 3 | | | $ | 1 | | | $ | 121 | | | | $ | 125 | |
| | | | | | | | | | |
| Amortization expense | | | — | | | — | | | (10) | | | | (10) | |
| | | | | | | | | | |
| | | | | | | | | | |
| Other, including foreign exchange | | | — | | | — | | | (2) | | | | (2) | |
| Balance, end of year | | | $ | 3 | | | $ | 1 | | | $ | 109 | | | | $ | 113 | |
| | | | | | | | | | | | |
| Year Ended December 31, | | | | | | 2020 |
| (in millions) | | | |
| Balance, beginning of year | | | | | | $ | 130 | |
| | | | | | |
| Amortization expense | | | | | | (11) | |
| Change related to unrealized appreciation (depreciation) of investments | | | | | | 2 | |
| Other, including foreign exchange | | | | | | 1 | |
| Balance, end of year | | | | | | $ | 122 | |
*The results for the years ended December 31, 2022 and 2021 have been updated to reflect the adoption of LDTI. No updates have been made to the results for the year ended December 31, 2020 as our effective date for LDTI adoption was January 1, 2021.
The amount of the unamortized balance of VOBA at December 31, 2022, expected to be amortized in 2023 through 2027 by year is: $12 million, $10 million, $10 million, $8 million and $6 million, respectively, with $45 million being amortized after five years.
ITEM 8 | Notes to Consolidated Financial Statements | 8. Deferred Policy Acquisition Costs
DEFERRED SALES INDUCEMENTS
We offer deferred sales inducements (“DSI”) which include enhanced crediting rates or bonus payments to contract holders (bonus interest) on certain annuity and investment contract products. To qualify for such accounting treatment, the bonus interest must be explicitly identified in the contract at inception. We must also demonstrate that such amounts are incremental to amounts we credit on similar contracts without bonus interest and are higher than the contracts’ expected ongoing crediting rates for periods after the bonus period. DSI is reported in Other assets, while amortization related to DSI is recorded in Interest credited to policyholder account balances.
Prior to the adoption of the Targeted Improvements to the Accounting for Long-Duration Contracts Standard
DSI amounts were deferred and amortized over the life of the contract in relation to the incidence of EGPs to be realized over the estimated lives of the contracts. DSI was adjusted for the effect on EGPs of unrealized gains and losses on available-for-sale securities, with related changes recognized through Other comprehensive income.
Subsequent to the adoption of the Targeted Improvements to the Accounting for Long-Duration Contracts Standard
DSI amounts are deferred and amortized on a constant level basis over the life of the contract consistent with DAC. Changes in future assumptions (e.g., expected duration of contracts) are applied by adjusting the amortization rate prospectively rather than through a retrospective catch up adjustment. The Company has elected to implicitly account for actual experience, whether favorable or unfavorable, in its amortization expense each period, consistent with DAC.
The following table presents the transition rollforward for deferred sales inducement assets for long-duration contracts: | | | | | | | | | | | | | | | | | | | | | | |
| (in millions) | | Individual
Retirement | | Group
Retirement | | | | Total |
| | | | | | | | |
| Pre-adoption December 31, 2020 deferred sales inducement assets balance | | $ | 194 | | | $ | 91 | | | | | $ | 285 | |
| Adjustments for the removal of related balances in Accumulated other comprehensive income originating from unrealized gains (losses) | | 282 | | | 114 | | | | | 396 | |
| Post-adoption January 1, 2021 deferred sales inducement asset balance | | $ | 476 | | | $ | 205 | | | | | $ | 681 | |
| | | | | | | | |
| | | | | | | | |
| | | | | | | | |
| | | | | | | | |
Prior to the adoption of LDTI, deferred sales inducements for investment-oriented products included the effect of unrealized gains or losses on fixed maturity securities classified as available-for-sale. At the transition date, these adjustments were removed with a corresponding offset in AOCI. As the available for sale portfolio was in an unrealized gain position as of the transition date, the adjustment for removal of related balances in AOCI originating from unrealized gains (losses) balances was reducing DSI.
The following table presents a rollforward of deferred sales inducement assets related to long-duration contracts for the years ended December 31, 2022(a), 2021(a) and 2020: | | | | | | | | | | | | | | | | | | | | |
| Year Ended December 31, 2022 | | Individual
Retirement | | Group
Retirement | | Total |
| (in millions) | | | |
| | | | | | |
| | | | | | |
| Balance, beginning of year | | $ | 428 | | | $ | 191 | | | $ | 619 | |
| Capitalization | | 9 | | | — | | | 9 | |
| Amortization expense | | (56) | | | (14) | | | (70) | |
| | | | | | |
| Balance, end of year | | $ | 381 | | | $ | 177 | | | $ | 558 | |
Other reconciling items(b) | | | | | | 1,963 | |
| Other assets, including restricted cash | | | | | | $ | 2,521 | |
| | | | | | | | | | | | | | | | | | | | |
| Year Ended December 31, 2021 | | Individual
Retirement | | Group
Retirement | | Total |
| (in millions) | | | |
| | | | | | |
| | | | | | |
| Balance, beginning of year | | $ | 476 | | | $ | 205 | | | $ | 681 | |
| Capitalization | | 10 | | | — | | | 10 | |
| Amortization expense | | (58) | | | (14) | | | (72) | |
| | | | | | |
| Balance, end of year | | $ | 428 | | | $ | 191 | | | $ | 619 | |
Other reconciling items(b) | | | | | | 2,995 | |
| Other assets, including restricted cash | | | | | | $ | 3,614 | |
ITEM 8 | Notes to Consolidated Financial Statements | 8. Deferred Policy Acquisition Costs
| | | | | | | | |
| Years Ended December 31, | | |
| (in millions) | | 2020 |
| Balance, beginning of year | | $ | 437 |
| Capitalizations | | 11 |
| Amortization expense | | (64) | |
| Change related to unrealized (appreciation) depreciation of investments | | (99) | |
| Balance, end of year | | $ | 285 |
(a) The results for the years ended December 31, 2022 and 2021 have been updated to reflect the adoption of LDTI. No updates have been made to the results for the year ended December 31, 2020 as our effective date for LDTI adoption was January 1, 2021.
(b) Other reconciling items include prepaid expenses, goodwill, intangible assets, and any similar items.
9. Variable Interest Entities A variable interest entity (“VIE”) is a legal entity that does not have sufficient equity at risk to finance its activities without additional subordinated financial support or is structured such that equity investors lack the ability to make significant decisions relating to the entity’s operations through voting rights or do not substantively participate in the gains and losses of the entity. Consolidation of a VIE by its primary beneficiary is not based on majority voting interest but is based on other criteria discussed below.
We enter into various arrangements with VIEs in the normal course of business and consolidate the VIEs when we determine we are the primary beneficiary. This analysis includes a review of the VIE’s capital structure, related contractual relationships and terms, nature of the VIE’s operations and purpose, nature of the VIE’s interests issued and our involvement with the entity. When assessing the need to consolidate a VIE, we evaluate the design of the VIE as well as the related risks to which the entity was designed to expose the variable interest holders.
The primary beneficiary is the entity that has both (i) the power to direct the activities of the VIE that most significantly affect the entity’s economic performance and (ii) the obligation to absorb losses or the right to receive benefits that could be potentially significant to the VIE. While also considering these factors, the consolidation conclusion depends on the breadth of our decision-making ability and our ability to influence activities that significantly affect the economic performance of the VIE.
ITEM 8 | Notes to Consolidated Financial Statements | 9. Variable Interest Entities
BALANCE SHEET CLASSIFICATION AND EXPOSURE TO LOSS
Creditors or beneficial interest holders of VIEs for which the Company is the primary beneficiary generally have recourse only to the assets and cash flows of the VIEs and do not have recourse to the Company. The following table presents the total assets and total liabilities associated with our variable interests in consolidated VIEs, as classified in the Consolidated Balance Sheets:
| | | | | | | | | | | | | | | | | | | | |
| (in millions) | | Real Estate and Investment Entities(c) | | Securitization
and Repackaging
Vehicles | | Total |
| December 31, 2022 | | | | | | |
| Assets: | | | | | | |
| Bonds available for sale | | $ | — | | $ | 3,571 | | $ | 3,571 |
| Other bond securities | | — | | — | | — |
| Equity securities | | 51 | | — | | 51 |
| Mortgage and other loans receivable | | — | | 2,088 | | 2,088 |
| Other invested assets | | | | | | |
Alternative investments(a) | | 2,842 | | — | | 2,842 |
| Investment real estate | | 1,731 | | — | | 1,731 |
| Short-term investments | | 191 | | 265 | | 456 |
| Cash | | 71 | | — | | 71 |
| Accrued investment income | | — | | 7 | | 7 |
| Other assets | | 102 | | 68 | | 170 |
Total assets(b) | | $ | 4,988 | | $ | 5,999 | | $ | 10,987 |
| Liabilities: | | | | | | |
| Debt of consolidated investment entities | | $ | 1,382 | | $ | 4,576 | | $ | 5,958 |
| Other liabilities | | 85 | | 47 | | 132 |
| Total liabilities | | $ | 1,467 | | $ | 4,623 | | $ | 6,090 |
| December 31, 2021 | | | | | | |
| Assets: | | | | | | |
| Bonds available for sale | | $ | — | | $ | 5,393 | | $ | 5,393 |
| Other bond securities | | — | | — | | — |
| Equity securities | | 223 | | — | | 223 |
| Mortgage and other loans receivable | | — | | 2,359 | | 2,359 |
| Other invested assets | | | | | | |
Alternative investments(a) | | 3,017 | | — | | 3,017 |
| Investment real estate | | 2,257 | | — | | 2,257 |
| Short-term investments | | 467 | | 151 | | 618 |
| Cash | | 93 | | — | | 93 |
| Accrued investment income | | — | | 15 | | 15 |
| Other assets | | 188 | | 557 | | 745 |
Total assets(b) | | $ | 6,245 | | $ | 8,475 | | $ | 14,720 |
| Liabilities: | | | | | | |
| Debt of consolidated investment entities | | $ | 1,743 | | $ | 5,193 | | $ | 6,936 |
| Other liabilities | | 112 | | 723 | | 835 |
| Total liabilities | | $ | 1,855 | | $ | 5,916 | | $ | 7,771 |
(a) Composed primarily of investments in real estate joint ventures at December 31, 2022 and December 31, 2021.
(b) The assets of each VIE can be used only to settle specific obligations of that VIE.
(c) Off-balance-sheet exposure primarily consisting of commitments by insurance operations and affiliates into real estate and investment entities. At December 31, 2022 and December 31, 2021, together the Company and AIG affiliates have commitments to internal parties of $2.1 billion and $2.4 billion and commitments to external parties of $0.6 billion and $0.6 billion, respectively. At December 31, 2022, $1.4 billion out of the internal commitments was from subsidiaries of Corebridge entities and $0.7 billion was from other AIG affiliates. At December 31, 2021, $1.5 billion out of the internal commitments was from subsidiaries of Corebridge entities, and $0.9 billion was from other AIG affiliates.
ITEM 8 | Notes to Consolidated Financial Statements | 9. Variable Interest Entities
The following table presents the revenue, net income (loss) attributable to noncontrolling interests and net income (loss) attributable to Corebridge associated with our variable interests in consolidated VIEs, as classified in the Consolidated Income Statements: | | | | | | | | | | | | | | | | | | | | | | | | | | |
| (in millions) | | Real Estate and Investment Entities | | Securitization and Repackaging Vehicles | | Affordable Housing Partnerships | | Total |
| December 31, 2022 | | | | | | | | |
| Total revenue | | $ | 681 | | | $ | 229 | | | $ | — | | | $ | 910 | |
| Net income attributable to noncontrolling interests | | 318 | | | 3 | | | — | | | 321 | |
Net income (loss) attributable to Corebridge | | 314 | | | 47 | | | — | | | 361 | |
| December 31, 2021 | | | | | | | | |
Total revenue | | $ | 1,639 | | | $ | 247 | | | $ | 450 | | | $ | 2,336 | |
Net income attributable to noncontrolling interests | | 858 | | | 3 | | | 68 | | | 929 | |
Net income (loss) attributable to Corebridge | | 525 | | | (33) | | | 304 | | | 796 | |
| December 31, 2020 | | | | | | | | |
| Total revenue | | $ | 477 | | | $ | 386 | | | $ | 275 | | | $ | 1,138 | |
| Net income attributable to noncontrolling interests | | 173 | | | 4 | | | 31 | | | 208 | |
Net income (loss) attributable to Corebridge | | 229 | | | 137 | | | 131 | | | 497 | |
We calculate our maximum exposure to loss to be (i) the amount invested in the debt or equity of the VIE, (ii) the notional amount of VIE assets or liabilities where we have also provided credit protection to the VIE with the VIE as the referenced obligation and (iii) other commitments and guarantees to the VIE.
The following table presents total assets of unconsolidated VIEs in which we hold a variable interest, as well as our maximum exposure to loss associated with these VIEs:
| | | | | | | | | | | | | | | | | | | | | | | | | | |
| | | Maximum Exposure to Loss |
| (in millions) | | Total VIE
Assets | | On-Balance Sheet(b) | | Off-Balance Sheet (c) | | Total |
| December 31, 2022 | | | | | | | | |
Real estate and investment entities(a) | | $ | 376,055 | | $ | 5,575 | | $ | 2,784 | | $ | 8,359 |
| | | | | | | | |
| Total | | $ | 376,055 | | $ | 5,575 | | $ | 2,784 | | $ | 8,359 |
| December 31, 2021 | | | | | | | | |
Real estate and investment entities(a) | | $ | 309,866 | | $ | 4,459 | | $ | 2,452 | | $ | 6,911 |
| | | | | | | | |
| Total | | $ | 309,866 | | $ | 4,459 | | $ | 2,452 | | $ | 6,911 |
(a) Composed primarily of hedge funds and private equity funds.
(b) At December 31, 2022 and December 31, 2021, $5.6 billion and $4.5 billion, respectively, of our total unconsolidated VIE assets were recorded as other invested assets.
(c) These amounts represent our unfunded commitments to invest in private equity funds and hedge funds.
REAL ESTATE AND INVESTMENT ENTITIES
Through our insurance operations and AIG Global Real Estate Investment Corp., we are an investor in various real estate investment entities, some of which are VIEs. These investments are typically with unaffiliated third-party developers via a partnership or limited liability company structure. The VIEs’ activities consist of the development or redevelopment of commercial, industrial and residential real estate. Our involvement varies from being a passive equity investor or finance provider to actively managing the activities of the VIEs.
Our insurance operations participate as passive investors in the equity interests issued by certain third party-managed hedge and private equity funds that are VIEs. Our insurance operations typically are not involved in the design or establishment of these VIEs, nor do they actively participate in the management of the VIEs.
SECURITIZATION AND REPACKAGING VEHICLES
We created certain VIEs that hold investments, primarily in investment-grade debt securities and loans, and issued beneficial interests in these investments. Some of these VIEs were created to facilitate our purchase of asset-backed securities. In these situations, all of the beneficial interests are owned by Corebridge and affiliated entities and are consolidated by Corebridge. In other instances, we have created VIEs that are securitizations of residential mortgage loans or other forms of collateralized loan obligations or we repackage loans and other assets into pass-through securities. Corebridge subsidiaries or affiliated entities own some of the beneficial interests of these VIEs, and we maintain the power to direct the activities of the VIEs that most significantly impact their economic performance. Accordingly, we consolidate these entities and those beneficial interests issued to third parties are reported as debt of consolidated investment entities. This debt is non-recourse to Corebridge.
ITEM 8 | Notes to Consolidated Financial Statements | 9. Variable Interest Entities
AFFORDABLE HOUSING PARTNERSHIPS
Affordable Housing organized and invested in limited partnerships that develop and operate affordable housing qualifying for federal, state, and historic tax credits, in addition to a few market rate properties across the United States. The operating partnerships are VIEs, whose debt is generally non-recourse in nature, and the general partners of which are mostly unaffiliated third-party developers. We account for our investments in operating partnerships using the equity method of accounting, unless they are required to be consolidated. We consolidate an operating partnership if the general partner is an affiliated entity, or we otherwise have the power to direct activities that most significantly impact the entities’ economic performance. In December 2021, Corebridge completed the sale of affordable housing portfolio to Blackstone Real Estate Income Trust.
For additional information on the sale of Corebridge’s interests in a U.S. affordable housing portfolio, see Note 1.
RMBS, CMBS, OTHER ABS AND CLOs
Primarily through our insurance operations, we are a passive investor in RMBS, CMBS, other ABS and CLOs, the majority of which are issued by domestic special purpose entities. We generally do not sponsor or transfer assets to, or act as the servicer to these asset-backed structures and were not involved in the design of these entities.
Our maximum exposure in these types of structures is limited to our investment in securities issued by these entities and, where applicable, any unfunded commitments to these entities. Conditional unfunded commitments for these unconsolidated entities are $399 million at December 31, 2022. Based on the nature of our investments and our passive involvement in these types of structures, we have determined that we are not the primary beneficiary of these entities. We have not included these entities in the above tables; however, the fair values of our investments in these structures are reported in Notes 4 and 5.
Additionally, from time to time, AIG designed internal securitizations and a series of VIEs, which are not consolidated by Corebridge, that securitized certain secured loans and RMLs. The notes held by Corebridge and their related fair values are included in the available-for-sale disclosures that are reported in Notes 4 and 5. As of December 31, 2022, the total VIE assets of these securitizations are $3.2 billion, of which Corebridge’s maximum exposure to loss is $1.5 billion. As of December 31, 2021, the total VIE assets of these securitizations are $2.0 billion, of which Corebridge’s maximum exposure to loss is $1.2 billion.
10. Derivatives and Hedge Accounting We use derivatives and other financial instruments as part of our financial risk management programs and as part of our investment operations. Interest rate derivatives (such as interest rate futures, swaps and options), equity derivatives (such as equity futures, swaps and options) and fixed maturity securities are used to economically mitigate interest rate risk, equity risk and credit spread exposure associated with MRBs contained in insurance contract liabilities. Equity derivatives are used to economically mitigate financial risk associated with embedded derivatives and MRBs in certain insurance liabilities. Foreign exchange derivatives (principally foreign exchange forwards and swaps) are used to economically mitigate risk associated with foreign denominated investments, net capital exposures and foreign currency transactions. In addition, interest rate derivatives are used to manage interest rate risk associated with fixed maturity securities as well as other interest rate sensitive assets and liabilities, while equity derivatives are used to economically hedge certain investments. We use credit derivatives to manage our credit exposures. The derivatives are effective economic hedges of the exposures that they are meant to offset. In addition to hedging activities, we also enter into derivative instruments with respect to investment operations, which may include, among other things, CDSs and purchases of investments with embedded derivatives, such as equity linked notes and convertible bonds.
Interest rate, currency and equity swaps, credit contracts, swaptions, options and forward transactions are accounted for as derivatives, recorded on a trade-date basis and carried at fair value. Unrealized gains and losses are generally reflected in income, except in certain situations in which hedge accounting is applied and unrealized gains and losses are reflected in AOCI. Aggregate asset or liability positions are netted on the Consolidated Balance Sheets only to the extent permitted by qualifying master netting arrangements in place with each respective counterparty. Cash collateral posted with counterparties in conjunction with transactions supported by qualifying master netting arrangements is reported as a reduction of the corresponding net derivative liability, while cash collateral received in conjunction with transactions supported by qualifying master netting arrangements is reported as a reduction of the corresponding net derivative asset.
Derivatives, with the exception of embedded derivatives, are reported at fair value in the Consolidated Balance Sheets in Other assets and Other liabilities. Embedded derivatives are generally presented with the host contract in the Consolidated Balance Sheets. A bifurcated embedded derivative is measured at fair value and accounted for in the same manner as a freestanding derivative contract. The corresponding host contract is accounted for according to the accounting guidance applicable for that instrument.
For additional information on embedded derivatives and MRBs, see Notes 4, 12 and 13.
ITEM 8 | Notes to Consolidated Financial Statements | 10. Derivatives and Hedge Accounting
The following table presents the notional amounts of our derivatives and the fair value of derivative assets and liabilities in the Consolidated Balance Sheets:
| | | | | | | | | | | | | | | | | | | | | | | | | | | | | | | | | | | | | | | | | | | | | | | | | | |
| | December 31, 2022 | | December 31, 2021 |
| | Gross Derivative
Assets | | Gross Derivative Liabilities | | Gross Derivative
Assets | | Gross Derivative Liabilities |
| (in millions) | | Notional
Amount | | Fair
Value | | Notional
Amount | | Fair
Value | | Notional
Amount | | Fair
Value | | Notional
Amount | | Fair
Value |
Derivatives designated as hedging instruments:(a) | | | | | | | | | | | | | | | | |
| Interest rate contracts | | $ | 155 | | $ | 202 | | $ | 1,798 | | $ | 77 | | $ | 352 | | $ | 274 | | $ | 980 | | $ | 14 |
| Foreign exchange contracts | | 3,535 | | 575 | | 3,354 | | 176 | | 4,058 | | 262 | | 2,861 | | 55 |
Derivatives not designated as hedging instruments:(a) | | | | | | | | | | | | | | | | |
| Interest rate contracts | | 27,656 | | 1,371 | | 21,553 | | 2,599 | | 28,056 | | 1,637 | | 23,219 | | 1,562 |
| Foreign exchange contracts | | 4,630 | | 672 | | 6,673 | | 456 | | 4,047 | | 410 | | 5,413 | | 311 |
| Equity contracts | | 26,041 | | 417 | | 9,962 | | 27 | | 60,192 | | 4,670 | | 38,932 | | 4,071 |
| Credit contracts | | — | | — | | — | | — | | 1,840 | | 1 | | — | | — |
Other contracts(b) | | 47,128 | | 15 | | 48 | | — | | 43,839 | | 13 | | 133 | | — |
| Total derivatives, gross | | $ | 109,145 | | $ | 3,252 | | $ | 43,388 | | $ | 3,335 | | $ | 142,384 | | $ | 7,267 | | $ | 71,538 | | $ | 6,013 |
Counterparty netting(c) | | | | (2,547) | | | | | (2,547) | | | | | (5,785) | | | | | (5,785) | |
Cash collateral(d) | | | | (406) | | | | | (691) | | | | | (798) | | | | | (37) | |
Total derivatives on Consolidated Balance Sheets(e) | | | | $ | 299 | | | | $ | 97 | | | | $ | 684 | | | | $ | 191 |
(a) Fair value amounts are shown before the effects of counterparty netting adjustments and offsetting cash collateral.
(b) Consists primarily of stable value wraps and contracts with multiple underlying exposures.
(c) Represents netting of derivative exposures covered by a qualifying master netting agreement.
(d) Represents cash collateral posted and received that is eligible for netting.
(e) Freestanding derivatives only, excludes embedded derivatives. Derivative instrument assets and liabilities are recorded in Other assets and Other liabilities, respectively. The fair value of assets related to bifurcated embedded derivatives were both zero at December 31, 2022 and December 31, 2021. The fair value of liabilities related to bifurcated embedded derivatives was $6.7 billion and $13.6 billion at December 31, 2022 and December 31, 2021, respectively. A bifurcated embedded derivative is generally presented with the host contract in the Consolidated Balance Sheets. Embedded derivatives are primarily related to guarantee features in fixed index annuities and index universal life contracts, which include equity and interest rate components and the funds withheld arrangement with Fortitude Re. For additional information, see Note 7.
The following table presents the gross notional amounts of our derivatives and the fair value of derivative assets and liabilities with related parties and third parties:
| | | | | | | | | | | | | | | | | | | | | | | | | | | | | | | | | | | | | | | | | | | | | | | | | | |
| | December 31, 2022 | | December 31, 2021 |
| | Gross Derivative
Assets | | Gross Derivative
Liabilities | | Gross Derivative
Assets | | Gross Derivative
Liabilities |
| (in millions) | | Notional
Amount | | Fair
Value | | Notional
Amount | | Fair
Value | | Notional
Amount | | Fair
Value | | Notional
Amount | | Fair
Value |
| Total derivatives with related parties | | $ | 60,633 | | $ | 3,177 | | $ | 42,109 | | $ | 3,154 | | $ | 96,862 | | $ | 7,182 | | $ | 68,623 | | $ | 5,778 |
| Total derivatives with third parties | | 48,512 | | 75 | | 1,279 | | 181 | | 45,522 | | 85 | | 2,915 | | 235 |
| Total derivatives, gross | | $ | 109,145 | | $ | 3,252 | | $ | 43,388 | | $ | 3,335 | | $ | 142,384 | | $ | 7,267 | | $ | 71,538 | | $ | 6,013 |
ITEM 8 | Notes to Consolidated Financial Statements | 10. Derivatives and Hedge Accounting
As of December 31, 2022 and December 31, 2021, the following amounts were recorded on the Consolidated Balance Sheets related to the carrying amount of the hedged assets (liabilities) and cumulative basis adjustments included in the carrying amount for fair value hedges:
| | | | | | | | | | | | | | | | | | | | | | | | | | |
| | December 31, 2022 | | December 31, 2021 |
| (in millions) | | Carrying
Amount of the Hedged Assets
(Liabilities) | | Cumulative Amount of
Fair Value Hedging
Adjustments Included
In the Carrying Amount
of the Hedged Assets
Liabilities | | Carrying
Amount of the Hedged Assets
(Liabilities) | | Cumulative Amount of
Fair Value Hedging
Adjustments Included
In the Carrying Amount
of the Hedged Assets
Liabilities |
| Balance sheet line item in which hedged item is recorded: | | | | | | | | |
| Fixed maturities, available for sale, at fair value | | $ | 6,520 | | $ | — | | | $ | 7,478 | | $ | — | |
Commercial mortgage and other loans(a) | | — | | (25) | | | — | | (6) |
Policyholder contract deposits(b) | | (2,218) | | 68 | | (1,500) | | | (79) | |
(a) This relates to hedge accounting that has been discontinued, but the respective loans are still held. The cumulative adjustment is being amortized into earnings over the remaining life of the loan.
(b) This relates to fair value hedges on GICs.
COLLATERAL
We engage in derivative transactions that are not subject to a clearing requirement directly with related parties and unaffiliated third parties in most cases, under International Swaps and Derivatives Association, Inc. (“ISDA”) Master Agreements. Many of the ISDA Master Agreements also include Credit Support Annex provisions, which provide for collateral postings that may vary at various ratings and threshold levels. We attempt to reduce our risk with certain counterparties by entering into agreements that enable collateral to be obtained from a counterparty on an up-front or contingent basis. We minimize the risk that counterparties might be unable to fulfill their contractual obligations by monitoring counterparty credit exposure and collateral value and generally requiring additional collateral to be posted upon the occurrence of certain events or circumstances.
Collateral posted by us to third parties for derivative transactions was $255 million and $317 million at December 31, 2022 and December 31, 2021, respectively. Collateral posted by us to related parties for derivative transactions was $1.5 billion and $803 million at December 31, 2022 and December 31, 2021, respectively. In the case of collateral posted under derivative transactions that are not subject to clearing, this collateral can generally be repledged or resold by the counterparties. Collateral provided to us from third parties for derivative transactions was $40 million and $53 million at December 31, 2022 and December 31, 2021, respectively. Collateral provided to us from related parties for derivative transactions was $380 million and $770 million at December 31, 2022 and December 31, 2021, respectively. In the case of collateral provided to us under derivative transactions that are not subject to clearing, we generally can repledge or resell collateral.
OFFSETTING
We have elected to present all derivative receivables and derivative payables, and the related cash collateral received and paid, on a net basis on our Consolidated Balance Sheets when a legally enforceable ISDA Master Agreement exists between us and our derivative counterparty. An ISDA Master Agreement is an agreement governing multiple derivative transactions between two counterparties. The ISDA Master Agreement generally provides for the net settlement of all, or a specified group, of these derivative transactions, as well as transferred collateral, through a single payment, and in a single currency, as applicable. The net settlement provisions apply in the event of a default on, or affecting any, one derivative transaction or a termination event affecting all, or a specified group of, derivative transactions governed by the ISDA Master Agreement.
HEDGE ACCOUNTING
We designated certain derivatives entered into with related parties as fair value hedges of available-for-sale securities held by our insurance subsidiaries. The fair value hedges include foreign currency forwards and cross-currency swaps designated as hedges of the change in fair value of foreign currency denominated available-for-sale securities attributable to changes in foreign exchange rates. We also designated certain interest rate swaps entered into with related parties as fair value hedges of fixed rate GICs and commercial mortgage loans attributable to changes in benchmark interest rates.
During 2022, we designated certain interest rate swaps entered into with related parties as cash flow hedges of forecasted coupon payments associated with anticipated long-term debt issuances. For the year ended December 31, 2022, we recognized derivative gains of $223 million in AOCI, of which, $21 million has been reclassified into Interest expense. The remaining amount in AOCI, of $202 million, will be reclassified into Interest expense over the life of the hedging relationship, which can extend up to 30 years. We expect $28 million to be reclassified into Interest expense over the next 12 months. There are no amounts excluded from the assessment of hedge effectiveness that are recognized in earnings.
ITEM 8 | Notes to Consolidated Financial Statements | 10. Derivatives and Hedge Accounting
For additional information related to the debt issuances, see Note 15.
We use cross-currency swaps as hedging instruments in net investment hedge relationships to mitigate the foreign exchange risk associated with our non-U.S. dollar functional currency foreign subsidiaries. For net investment hedge relationships that use derivatives as hedging instruments, we assess hedge effectiveness and measure hedge ineffectiveness using changes in forward rates. For the years ended December 31, 2022, 2021 and 2020, we recognized gains (losses) of $9 million, $8 million and $(5) million, respectively, included in Change in foreign currency translation adjustment in Other comprehensive income (loss) related to the net investment hedge relationships. The gains (losses) recognized primarily include transactions with related parties. A qualitative methodology is utilized to assess hedge effectiveness for net investment hedges, while regression analysis is employed for all other hedges.
The following table presents the gain (loss) recognized in earnings on our derivative instruments in fair value hedging relationships in the Consolidated Statements of Income:
| | | | | | | | | | | | | | | | | | | | | | | | | | |
| | Gains/(Losses) Recognized in Earnings for: | | |
| (in millions) | | Hedging Derivatives(a)(c) | | Excluded Components(b)(c) | | Hedged
Items | | Net Impact |
| Year Ended December 31, 2022 | | | | | | | | |
| Interest rate contracts: | | | | | | | | |
| Realized gains (losses) | | $ | — | | $ | — | | $ | — | | $ | — |
| Interest credited to policyholder account balances | | (156) | | — | | 151 | | (5) |
| Net investment income | | 11 | | — | | (12) | | (1) |
| Foreign exchange contracts: | | | | | | | | |
| Realized gains (losses) | | 459 | | 171 | | (459) | | 171 |
| Year Ended December 31, 2021 | | | | | | | | |
| Interest rate contracts: | | | | | | | | |
| Realized gains (losses) | | $ | — | | $ | — | | $ | — | | $ | — |
| Interest credited to policyholder account balances | | (62) | | | 18 | | 54 | | 10 |
| Net investment income | | 9 | | — | | (11) | | | (2) |
| Foreign exchange contracts: | | | | | | | | |
| Realized gains (losses) | | 260 | | 31 | | (260) | | | 31 | |
| Year Ended December 31, 2020 | | | | | | | | |
| Interest rate contracts: | | | | | | | | |
| Realized gains (losses) | | $ | — | | $ | — | | $ | — | | $ | — |
| Interest credited to policyholder account balances | | 47 | | | 1 | | (53) | | (5) |
| Net investment income | | (6) | | — | | 5 | | | (1) |
| Foreign exchange contracts: | | | | | | | | |
| Realized gains (losses) | | (298) | | 98 | | 298 | | | 98 | |
(a) Gains and losses on derivative instruments designated and qualifying in fair value hedges that are included in the assessment of hedge effectiveness.
(b) Gains and losses on derivative instruments designated and qualifying in fair value hedges that are excluded from the assessment of hedge effectiveness and recognized in earnings on a mark-to-market basis.
(c) Primarily consists of gains and losses with related parties.
ITEM 8 | Notes to Consolidated Financial Statements | 10. Derivatives and Hedge Accounting
DERIVATIVES NOT DESIGNATED AS HEDGING INSTRUMENTS
The following table presents the effect of derivative instruments not designated as hedging instruments in the Consolidated Statements of Income:
| | | | | | | | | | | | | | | | | | | | | | | | | |
| Years Ended December 31, | | Gains (Losses) Recognized in Earnings | |
| (in millions) | | 2022 | | 2021 | | 2020 | | | | | |
| By Derivative Type: | | | | | | | | | | | |
| Interest rate contracts | | $ | (2,386) | | $ | (585) | | $ | 1,643 | | | | | |
| Foreign exchange contracts | | 1,028 | | 476 | | (239) | | | | | |
| Equity contracts | | (483) | | | (742) | | | 206 | | | | | | |
| Credit contracts | | (1) | | | (11) | | | 42 | | | | | | |
| Other contracts | | 64 | | 64 | | 60 | | | | | |
Embedded derivatives within policyholder contract deposits(c) | | 1,120 | | (477) | | (2,154) | | | | | |
| Fortitude Re funds withheld embedded derivative | | 6,347 | | (687) | | (3,978) | | | | | |
Total(a) | | $ | 5,689 | | $ | (1,962) | | $ | (4,420) | | | | | |
| By Classification: | | | | | | | | | | | |
| Policy fees | | $ | 61 | | $ | 62 | | $ | 62 | | | | | |
| Net investment income | | (10) | | 6 | | 2 | | | | | |
Net realized gains - excluding Fortitude Re funds withheld assets(c) | | 817 | | 445 | | (916) | | | | | |
| Net realized gains (losses) on Fortitude Re funds withheld assets | | (121) | | 33 | | 398 | | | | | |
| Net realized gains (losses) on Fortitude Re funds withheld embedded derivatives | | 6,347 | | (687) | | (3,978) | | | | | |
| Policyholder benefits | | (19) | | (4) | | 12 | | | | | |
Change in the fair value of market risk benefits(b)(c) | | (1,386) | | (1,817) | | — | | | | | |
Total(a) | | $ | 5,689 | | $ | (1,962) | | $ | (4,420) | | | | | |
(a) Includes gains (losses) with related parties of $(2.5) billion, $(363) million and $2.4 billion for the years ended December 31, 2022, 2021, and 2020, respectively.
(b) This represents activity related to derivatives that economically hedged changes in the fair value of certain MRBs.
(c) The results for the years ended December 31, 2022 and 2021 have been updated to reflect the adoption of LDTI. No updates have been made to the results for the year ended December 31, 2020 as our effective date for LDTI adoption was January 1, 2021.
In addition to embedded derivatives within policyholder contract deposits, certain guaranteed benefits within insurance contracts are classified as MRBs. The change in the fair value of these benefits is disclosed in Note 13. The change in the fair value of MRBs and certain derivative instruments that hedge those risks are recognized in “Change in the fair value of MRBs, net” in the Consolidated Statements of Income.
HYBRID SECURITIES WITH EMBEDDED CREDIT DERIVATIVES
We invest in hybrid securities (such as credit-linked notes) with the intent of generating income, and not specifically to acquire exposure to embedded derivative risk. As is the case with our other investments in RMBS, CMBS, CLOs, ABS and CDOs, our investments in these hybrid securities are exposed to losses only up to the amount of our initial investment in the hybrid security. Other than our initial investment in the hybrid securities, we have no further obligation to make payments on the embedded credit derivatives in the related hybrid securities.
We elect to account for our investments in these hybrid securities with embedded written credit derivatives at fair value, with changes in fair value recognized in Net investment income and Other income. Our investments in these hybrid securities are reported as Other bond securities in the Consolidated Balance Sheets. The fair values of these hybrid securities were zero and $121 million at December 31, 2022 and December 31, 2021, respectively. These securities have par amounts of $25 million and $884 million at December 31, 2022 and December 31, 2021, respectively, and have remaining stated maturity dates that extend to 2052. The majority of these securities were sold in the fourth quarter of 2022 resulting in the decrease in fair value and par value.
11. Goodwill and Other Intangible Assets
Goodwill represents the future economic benefits arising from assets acquired in a business combination that are not individually identified and separately recognized. Goodwill is tested for impairment at the reporting unit level, which is defined as an operating segment or one level below, and the test is performed annually, or more frequently if circumstances indicate an impairment may have occurred.
The impairment assessment involves an option to first assess qualitative factors to determine whether events or circumstances exist that lead to a determination that it is more likely than not that the fair value of a reporting unit is less than its carrying amount. If the qualitative assessment is not performed, or after assessing the totality of the events or circumstances, we determine it is more likely
ITEM 8 | Notes to Consolidated Financial Statements | 11. Goodwill and Other Intangible Assets
than not that the fair value of a reporting unit is less than its carrying amount, a quantitative assessment for potential impairment is performed.
If the qualitative test is not performed or if the test indicates a potential impairment is present, we estimate the fair value of each reporting unit and compare the estimated fair value with the carrying amount of the reporting unit, including allocated goodwill. The estimate of a reporting unit’s fair value involves management judgment and is based on one or a combination of approaches including discounted expected future cash flows, market-based earnings multiples of the unit’s peer companies, external appraisals or, in the case of reporting units being considered for sale, third-party indications of fair value, if available. We consider one or more of these estimates when determining the fair value of a reporting unit to be used in the impairment test.
If the estimated fair value of a reporting unit exceeds its carrying amount, goodwill is not impaired. If the carrying value of a reporting unit exceeds its estimated fair value, goodwill associated with that reporting unit potentially is impaired. The amount of impairment, if any, is measured as the excess of a reporting unit’s carrying amount over its fair value not to exceed the total amount of goodwill allocated to that reporting unit and recognized in income.
The date of our annual goodwill impairment testing is July 1. We performed our annual goodwill impairment tests of all reporting units and concluded that our goodwill was not impaired.
The following table presents the changes in goodwill by operating segment:
| | | | | | | | | | | | | | | | | |
| (in millions) | Life
Insurance | | Corporate
and Other
Operations | | Total |
| Balance at January 1, 2020 | | | | | |
| Goodwill - gross | $ | 231 | | | $ | 54 | | | $ | 285 | |
| Accumulated impairments | (67) | | | (10) | | | (77) | |
| Net goodwill | 164 | | | 44 | | | 208 | |
| Increase (decrease) due to: | | | | | |
| Dispositions | — | | | — | | | — | |
Other* | 10 | | | — | | | 10 | |
| Balance at December 31, 2020: | | | | | |
| Goodwill - gross | 241 | | | 54 | | | 295 | |
| Accumulated impairments | (67) | | | (10) | | | (77) | |
| Net goodwill | 174 | | | 44 | | | 218 | |
| Increase (decrease) due to: | | | | | |
| Dispositions | — | | | (21) | | | (21) | |
Other* | (5) | | | — | | | (5) | |
| Balance at December 31, 2021: | | | | | |
| Goodwill - gross | 236 | | | 33 | | | 269 | |
| Accumulated impairments | (67) | | | (10) | | | (77) | |
| Net goodwill | 169 | | | 23 | | | 192 | |
| Increase (decrease) due to: | | | | | |
| Dispositions | — | | | — | | | — | |
Other* | (16) | | | (1) | | | (17) | |
| Balance at December 31, 2022: | | | | | |
| Goodwill - gross | 220 | | | 32 | | | 252 | |
| Accumulated impairments | (67) | | | (10) | | | (77) | |
| Net goodwill | $ | 153 | | | $ | 22 | | | $ | 175 | |
* Other primarily relates to changes in foreign currencies.
Indefinite lived intangible assets are not subject to amortization. Finite lived intangible assets are amortized over their useful lives. Finite lived intangible assets primarily include distribution networks and are recorded net of accumulated amortization. The Company tests intangible assets for impairment on an annual basis or whenever events or circumstances suggest that the carrying value of an intangible asset may exceed the sum of the undiscounted cash flows expected to result from its use and eventual disposition. If this condition exists and the carrying value of an intangible asset exceeds its fair value, the excess is recognized as an impairment and is recorded as a charge against net income (loss).
ITEM 8 | Notes to Consolidated Financial Statements | 11. Goodwill and Other Intangible Assets
The following table presents the changes in other intangible assets by operating segment:
| | | | | | | | | | | | | | | | | |
| (in millions) | Life
Insurance | | Corporate
and Other
Operations | | Total |
| Other intangible assets | | | | | |
| Balance at January 1, 2020 | $ | 24 | | | $ | 11 | | | $ | 35 | |
| Increase (decrease) due to: | | | | | |
| Dispositions | — | | | — | | | — | |
| Amortization | (4) | | | (2) | | | (6) | |
| Other | 3 | | | (1) | | | 2 | |
| Balance at December 31, 2020 | $ | 23 | | | $ | 8 | | | $ | 31 | |
| Increase (decrease) due to: | | | | | |
| Dispositions | $ | — | | | $ | (5) | | | $ | (5) | |
| Amortization | (4) | | | (3) | | | (7) | |
| Other | (1) | | | — | | | (1) | |
| Balance at December 31, 2021 | $ | 18 | | | $ | — | | | $ | 18 | |
| Increase (decrease) due to: | | | | | |
| Dispositions | $ | — | | | $ | — | | | $ | — | |
| Amortization | (4) | | | — | | | (4) | |
| Other | (2) | | | — | | | (2) | |
| Balance at December 31, 2022 | $ | 12 | | | $ | — | | | $ | 12 | |
The percentage of the unamortized balance of Other intangible assets at December 31, 2022 expected to be amortized in 2023 through 2026 by year is 32.9%,30.5%, 29.3%, and 7.3%, respectively, with none being amortized thereafter.
12. Insurance Liabilities
FUTURE POLICY BENEFITS
Future policy benefits primarily include reserves for traditional life and annuity payout contracts, which represent an estimate of the present value of future benefits less the present value of future net premiums. Included in Future policy benefits are liabilities for annuities issued in structured settlement arrangements whereby a claimant receives life contingent payments over their lifetime. Also included are pension risk transfer arrangements whereby an upfront premium is received in exchange for guaranteed retirement benefits. All payments under these arrangements are fixed and determinable with respect to their amounts and dates.
Prior to the adoption of the Targeted Improvements to the Accounting for Long-Duration Contracts Standard
Future policy benefits for traditional and limited pay contracts were reserved using actuarial assumptions locked-in at contract issuance. These assumptions were only updated when a loss recognition event occurred. Also included in Future policy benefits, were reserves for contracts in loss recognition, including the adjustment to reflect the effect of unrealized gains on fixed maturity securities available for sale with related changes recognized through Other comprehensive income (loss).
Future policy benefits also included certain guaranteed benefits of annuity products that were not considered embedded derivatives.
Subsequent to the adoption of the Targeted Improvements to the Accounting for Long-Duration Contracts Standard
For traditional and limited pay long-duration products, benefit reserves are accrued and benefit expense is recognized using a NPR methodology for each annual cohort of business. This NPR method incorporates periodic retrospective revisions to the NPR to reflect updated actuarial assumptions and variances in actual versus expected experience. The Future policy benefit liability is accrued by multiplying the gross premium recognized in each period by the NPR. The net premium is equal to the portion of the gross premium required to provide for all benefits and certain expenses and may not exceed 100%. Benefits in excess of premiums are expensed immediately through Policyholder benefits. In addition, periodic revisions to the NPR below 100% may result in reclassification between the benefit reserves and deferred profit liability for limited pay contracts.
Insurance contracts are aggregated into annual cohorts for the purposes of determining the Liability for future policy benefits (“LFPB”), but are not aggregated across segments. These annual cohorts may be further segregated based on product characteristics, or to distinguish business reinsured from non-reinsured business or products issued in different functional currencies. The assumptions
ITEM 8 | Notes to Consolidated Financial Statements | 12. Insurance Liabilities
used to calculate the future policy benefits include discount rates, persistency and recognized morbidity and mortality tables modified to reflect the Company's experience.
The current discount rate assumption for the liability for future policy benefits is derived from market observable yields on upper-medium-grade fixed income instruments. The Company uses an external index as the source of the yields on these instruments for the first 30 years. For years 30 to 50, the yield is derived using market observable yields. Yields for years 50 to 100 are extrapolated using a flat forward approach, maintaining a constant forward spread through the period. The current discount rate assumption is updated quarterly and used to remeasure the liability at the reporting date, with the resulting change in the discount rate reflected in AOCI.
The method for constructing and applying the locked-in discount rate assumptions on newly issued business is determined based on factors such as product characteristics and the expected timing of cash flows. This discount rate assumption is derived from market observable yields on upper-medium-grade fixed income instruments. Similar to the current discount rate assumption, the Company may employ conversion and interpolation methodologies when necessary. The applicable interest accretion is reflected in Policyholder benefits in the Consolidated Statements of Income (Loss).
The following table presents the transition rollforward of the liability for future policy benefits for nonparticipating contracts:
| | | | | | | | | | | | | | | | | | | | | | | | | | | | | | | | | | | | |
| Individual
Retirement | | Group
Retirement | | Life
Insurance | | Institutional
Markets | | Corporate and Other | | Total | |
| (in millions) | | | | | | |
| | | | | | | | | | | | |
| | | | | | | | | | | | |
| Pre-adoption December 31, 2020 liability for future policy benefits balance | $ | 1,309 | | | $ | 282 | | | $ | 11,129 | | | $ | 11,029 | | | $ | 22,206 | | | $ | 45,955 | | |
| Adjustments for the reclassification to the deferred profit liability | (65) | | | (8) | | | — | | | (766) | | | (859) | | | (1,698) | | |
| | | | | | | | | | | | |
| Change in cash flow assumptions and effect of net premiums exceeding gross premiums | (14) | | | 2 | | | 16 | | | 4 | | | 55 | | | 63 | | |
| Effect of the remeasurement of the liability at a current single A rate | 156 | | | 63 | | | 2,977 | | | 1,655 | | | 7,611 | | | 12,462 | | |
| Adjustment for the removal of loss recognition balances related to unrealized gain or loss on securities and other | (63) | | | (60) | | | 4 | | | (292) | | | — | | | (411) | | |
| Post-adoption January 1, 2021 liability for future policy benefits balance | $ | 1,323 | | | $ | 279 | | | $ | 14,126 | | | $ | 11,630 | | | $ | 29,013 | | | $ | 56,371 | | |
Adjustments for the reclassification between the liability for future policy benefits and deferred profit liability represent changes in the NPRs that are less than 100% at transition for certain limited pay cohorts, resulting in a reclassification between the two liabilities, with no impact on Retained earnings.
Adjustments for changes in cash flow assumptions represents revised NPRs in excess of 100% for certain cohorts at transition, with an offset to Retained earnings.
The effect of the remeasurement at the current single A rate is reported at the transition date and each subsequent balance sheet date, with an offset in AOCI.
Prior to adoption, loss recognition for traditional products was adjusted for the effect of unrealized gains on fixed maturity securities available for sale. At the transition date, these adjustments were removed with a corresponding offset in AOCI.
ITEM 8 | Notes to Consolidated Financial Statements | 12. Insurance Liabilities
The following tables present the balances and changes in the liability for future policy benefits and a reconciliation of the net liability for future policy benefits to the liability for future policy benefits in the Consolidated Balance Sheets: | | | | | | | | | | | | | | | | | | | | | | | | | | | | | | | | | | | |
| Year Ended December 31, 2022 | Individual
Retirement | | Group
Retirement | | Life
Insurance | | Institutional
Markets | | Corporate and Other | | Total |
| (in millions, expect liability durations) | | | | |
| | | | | | | | | | | |
| | | | | | | | | | | |
| Present value of expected net premiums | | | | | | | | | | | |
| Balance, beginning of year | $ | — | | | $ | — | | | $ | 14,369 | | | $ | — | | | $ | 1,274 | | | $ | 15,643 | |
| Effect of changes in discount rate assumptions (AOCI) | — | | | — | | | (706) | | | — | | | (150) | | | (856) | |
| Beginning balance at original discount rate | — | | | — | | | 13,663 | | | — | | | 1,124 | | | 14,787 | |
Effect of changes in cash flow assumptions | — | | | — | | | 123 | | | — | | | — | | | 123 | |
Effect of actual variances from expected experience | — | | | — | | | (79) | | | — | | | 7 | | | (72) | |
| Adjusted beginning of year balance | — | | | — | | | 13,707 | | | — | | | 1,131 | | | 14,838 | |
| Issuances | — | | | — | | | 1,358 | | | — | | | — | | | 1,358 | |
| Interest accrual | — | | | — | | | 397 | | | — | | | 48 | | | 445 | |
| Net premium collected | — | | | — | | | (1,418) | | | — | | | (123) | | | (1,541) | |
| Foreign exchange impact | — | | | — | | | (517) | | | — | | | — | | | (517) | |
| Other | — | | | — | | | (1) | | | — | | | 1 | | | — | |
| Ending balance at original discount rate | — | | | — | | | 13,526 | | | — | | | 1,057 | | | 14,583 | |
| Effect of changes in discount rate assumptions (AOCI) | — | | | — | | | (1,872) | | | — | | | (66) | | | (1,938) | |
| Balance, end of year | $ | — | | | $ | — | | | $ | 11,654 | | | $ | — | | | $ | 991 | | | $ | 12,645 | |
| | | | | | | | | | | |
| Present value of expected future policy benefits | | | | | | | | | | | |
| Balance, beginning of year | $ | 1,373 | | | $ | 264 | | | $ | 27,442 | | | $ | 13,890 | | | $ | 27,674 | | | $ | 70,643 | |
| Effect of changes in discount rate assumptions (AOCI) | (95) | | | (46) | | | (2,717) | | | (870) | | | (5,673) | | | (9,401) | |
| Beginning balance at original discount rate | 1,278 | | | 218 | | | 24,725 | | | 13,020 | | | 22,001 | | | 61,242 | |
Effect of changes in cash flow assumptions(a) | — | | | — | | | 140 | | | (6) | | | — | | | 134 | |
Effect of actual variances from expected experience(a) | (30) | | | (2) | | | (94) | | | 3 | | | 1 | | | (122) | |
| Adjusted beginning of year balance | 1,248 | | | 216 | | | 24,771 | | | 13,017 | | | 22,002 | | | 61,254 | |
| Issuances | 216 | | | 12 | | | 1,374 | | | 2,782 | | | 9 | | | 4,393 | |
| Interest accrual | 42 | | | 10 | | | 876 | | | 459 | | | 1,233 | | | 2,620 | |
| Benefit payments | (116) | | | (26) | | | (1,757) | | | (821) | | | (1,483) | | | (4,203) | |
| Foreign exchange impact | — | | | — | | | (657) | | | (339) | | | — | | | (996) | |
| Other | — | | | 1 | | | (4) | | | — | | | (249) | | | (252) | |
| Ending balance at original discount rate | 1,390 | | | 213 | | | 24,603 | | | 15,098 | | | 21,512 | | | 62,816 | |
| Effect of changes in discount rate assumptions (AOCI) | (167) | | | (2) | | | (3,424) | | | (2,634) | | | (1,083) | | | (7,310) | |
| Balance, end of year | $ | 1,223 | | | $ | 211 | | | $ | 21,179 | | | $ | 12,464 | | | $ | 20,429 | | | $ | 55,506 | |
| Net liability for future policy benefits, end of year | 1,223 | | | 211 | | | 9,525 | | | 12,464 | | | 19,438 | | | 42,861 | |
| Liability for future policy benefits for certain participating contracts | — | | | — | | | 14 | | | — | | | 1,338 | | | 1,352 | |
Liability for universal life policies with secondary guarantees and similar features(b) | — | | | — | | | 3,300 | | | — | | | 55 | | | 3,355 | |
| | | | | | | | | | | |
| | | | | | | | | | | |
| Deferred profit liability | 99 | | | 12 | | | 15 | | | 1,281 | | | 896 | | | 2,303 | |
Other reconciling items(c) | 37 | | | — | | | 500 | | | — | | | 110 | | | 647 | |
| Future policy benefits for life and accident and health insurance contracts | 1,359 | | | 223 | | | 13,354 | | | 13,745 | | | 21,837 | | | 50,518 | |
| Less: Reinsurance recoverable: | (4) | | | — | | | (1,107) | | | (36) | | | (21,837) | | | (22,984) | |
| Net liability for future policy benefits after reinsurance recoverable | $ | 1,355 | | | $ | 223 | | | $ | 12,247 | | | $ | 13,709 | | | $ | — | | | $ | 27,534 | |
| | | | | | | | | | | |
Weighted average liability duration of the liability for future policy benefits(d) | 7.6 | | 6.9 | | 12.2 | | 10.8 | | 11.4 | | |
ITEM 8 | Notes to Consolidated Financial Statements | 12. Insurance Liabilities
| | | | | | | | | | | | | | | | | | | | | | | | | | | | | | | | | | | |
| Year Ended December 31, 2021 | Individual
Retirement | | Group
Retirement | | Life
Insurance | | Institutional
Markets | | Corporate and Other | | Total |
| (in millions, expect liability durations) | | | | |
| | | | | | | | | | |
| | | | | | | | | | | |
| Present value of expected net premiums | | | | | | | | | | | |
| Balance, beginning of year | $ | — | | | $ | — | | | $ | 13,793 | | | $ | — | | | $ | 1,506 | | | $ | 15,299 | |
| Effect of changes in discount rate assumptions (AOCI) | — | | | — | | | (1,374) | | | — | | | (249) | | | (1,623) | |
| Beginning balance at original discount rate | — | | | — | | | 12,419 | | | — | | | 1,257 | | | 13,676 | |
Effect of changes in cash flow assumptions | — | | | — | | | 164 | | | — | | | (72) | | | 92 | |
Effect of actual variances from expected experience | — | | | — | | | 371 | | | — | | | 14 | | | 385 | |
| Adjusted beginning of year balance | — | | | — | | | 12,954 | | | — | | | 1,199 | | | 14,153 | |
| Issuances | — | | | — | | | 1,727 | | | — | | | — | | | 1,727 | |
| Interest accrual | — | | | — | | | 392 | | | — | | | 54 | | | 446 | |
| Net premium collected | — | | | — | | | (1,364) | | | — | | | (129) | | | (1,493) | |
| Foreign exchange impact | — | | | — | | | (46) | | | — | | | — | | | (46) | |
| Other | — | | | — | | | — | | | — | | | — | | | — | |
| Ending balance at original discount rate | — | | | — | | | 13,663 | | | — | | | 1,124 | | | 14,787 | |
| Effect of changes in discount rate assumptions (AOCI) | — | | | — | | | 706 | | | — | | | 150 | | | 856 | |
| Balance, end of year | $ | — | | | $ | — | | | $ | 14,369 | | | $ | — | | | $ | 1,274 | | | $ | 15,643 | |
| | | | | | | | | | | |
| Present value of expected future policy benefits | | | | | | | | | | | |
| Balance, beginning of year | $ | 1,323 | | | $ | 279 | | | $ | 27,919 | | | $ | 11,630 | | | $ | 30,519 | | | $ | 71,670 | |
| Effect of changes in discount rate assumptions (AOCI) | (156) | | | (63) | | | (4,351) | | | (1,654) | | | (7,862) | | | (14,086) | |
| Beginning balance at original discount rate | 1,167 | | | 216 | | | 23,568 | | | 9,976 | | | 22,657 | | | 57,584 | |
Effect of changes in cash flow assumptions(a) | — | | | — | | | 193 | | | — | | | (83) | | | 110 | |
Effect of actual variances from expected experience(a) | 1 | | | (1) | | | 413 | | | (3) | | | (121) | | | 289 | |
| Adjusted beginning of year balance | 1,168 | | | 215 | | | 24,174 | | | 9,973 | | | 22,453 | | | 57,983 | |
| Issuances | 172 | | | 21 | | | 1,713 | | | 3,366 | | | 15 | | | 5,287 | |
| Interest accrual | 41 | | | 11 | | | 876 | | | 380 | | | 1,085 | | | 2,393 | |
| Benefit payments | (101) | | | (28) | | | (1,981) | | | (696) | | | (1,530) | | | (4,336) | |
| Foreign exchange impact | — | | | — | | | (60) | | | (3) | | | — | | | (63) | |
| Other | (2) | | | (1) | | | 3 | | | — | | | (22) | | | (22) | |
| Ending balance at original discount rate | 1,278 | | | 218 | | | 24,725 | | | 13,020 | | | 22,001 | | | 61,242 | |
| Effect of changes in discount rate assumptions (AOCI) | 95 | | | 46 | | | 2,717 | | | 870 | | | 5,673 | | | 9,401 | |
| Balance, end of year | 1,373 | | | 264 | | | 27,442 | | | 13,890 | | | 27,674 | | | 70,643 | |
| Net liability for future policy benefits, end of year | 1,373 | | | 264 | | | 13,073 | | | 13,890 | | | 26,400 | | | 55,000 | |
| Liability for future policy benefits for certain participating contracts | — | | | — | | | 15 | | | — | | | 1,382 | | | 1,397 | |
Liability for universal life policies with secondary guarantees and similar features(b) | — | | | — | | | 4,952 | | | — | | | 55 | | | 5,007 | |
| | | | | | | | | | | |
| | | | | | | | | | | |
| Deferred profit liability | 81 | | | 11 | | | 10 | | | 1,218 | | | 916 | | | 2,236 | |
Other reconciling items(c) | 42 | | | — | | | 485 | | | 1 | | | 102 | | | 630 | |
| Future policy benefits for life and accident and health insurance contracts | 1,496 | | | 275 | | | 18,535 | | | 15,109 | | | 28,855 | | | 64,270 | |
| Less: Reinsurance recoverable: | (4) | | | — | | | (1,715) | | | (47) | | | (28,855) | | | (30,621) | |
| Net liability for future policy benefits after reinsurance recoverable | $ | 1,492 | | | $ | 275 | | | $ | 16,820 | | | $ | 15,062 | | | $ | — | | | $ | 33,649 | |
| | | | | | | | | | | |
Weighted average liability duration of the liability for future policy benefits(d) | 8.6 | | 7.8 | | 14.4 | | 13.0 | | 13.7 | | |
(a) Effect of changes in cash flow assumptions and variances from actual experience are partially offset by changes in deferred profit liability.
(b) Additional details can be found in the table that presents the balances and changes in the liability for universal life policies with secondary guarantees and similar features.
(c) Other reconciling items primarily include the Accident and Health as well as Group Benefits (short-duration) contracts.
(d) The weighted average liability durations are calculated as the modified duration using projected future net liability cashflows that are aggregated at the segment level, utilizing the segment level weighted average interest rates and current discount rate, which can be found in the table below.
ITEM 8 | Notes to Consolidated Financial Statements | 12. Insurance Liabilities
For the years ended December 31, 2022 and 2021 in the traditional term life insurance block, capping of NPRs at 100% causes our reserves to be higher by $26 million and $15 million, respectively. The discount rate was updated based on market observable information. Relative to prior period, the increase in upper-medium-grade fixed income yields resulted in a decrease in the liability for future policy benefits.
The following table presents the amount of undiscounted expected future benefit payments and expected gross premiums for future policy benefits for nonparticipating contracts:
| | | | | | | | | | | | | | |
| | | Year Ended December 31, |
| (in millions) | | | 2022 | 2021 |
| | | | |
| Individual Retirement | Expected future benefits and expense | | $ | 1,959 | | $ | 1,747 | |
| Expected future gross premiums | | $ | — | | $ | — | |
| | | | |
| Group Retirement | Expected future benefits and expense | | $ | 321 | | $ | 328 | |
| Expected future gross premiums | | $ | — | | $ | — | |
| | | | |
| Life Insurance | Expected future benefits and expense | | $ | 38,909 | | $ | 38,869 | |
| Expected future gross premiums | | $ | 29,035 | | $ | 29,272 | |
| | | | |
| Institutional Markets | Expected future benefits and expense | | $ | 25,066 | | $ | 20,839 | |
| Expected future gross premiums | | $ | — | | $ | — | |
| Corporate and Other | Expected future benefits and expense | | $ | 44,530 | | $ | 46,038 | |
| Expected future gross premiums | | $ | 2,262 | | $ | 2,437 | |
The following table presents the amount of revenue and interest recognized in the Consolidated Statement of Income (Loss) for future policy benefits for nonparticipating contracts:
| | | | | | | | | | | | | | |
| Gross Premiums
Year Ended December 31, | Interest Accretion Year Ended 31, |
|
| (in millions) | 2022 | 2021 | 2022 | 2021 |
| | | | |
| Individual Retirement | $ | 224 | | $ | 186 | | $ | 42 | | $ | 41 | |
| | | | |
| Group Retirement | $ | 19 | | $ | 21 | | $ | 10 | | $ | 11 | |
| | | | |
| Life Insurance | $ | 2,342 | | $ | 2,319 | | $ | 479 | | $ | 484 | |
| | | | |
Institutional Markets | $ | 2,940 | | $ | 3,818 | | $ | 459 | | $ | 380 | |
| Corporate and Other | $ | 224 | | $ | 236 | | $ | 1,185 | | $ | 1,031 | |
| Total | $ | 5,749 | | $ | 6,580 | | $ | 2,175 | | $ | 1,947 | |
The following table presents the weighted-average interest rate for future policy benefits for nonparticipating contracts:
| | | | | | | | | | | | | | | | | | | | | | | | | | | | | | |
| December 31, 2022 | Individual
Retirement | | Group
Retirement | | Life
Insurance | | Institutional
Markets | | Corporate and Other | |
| | | | |
| | | | | | | | | | |
| | | | | | | | | | |
| Weighted-average interest rate, original discount rate | 3.58 | % | | 5.17 | % | | 4.08 | % | | 3.56 | % | | 4.88 | % | |
| Weighted-average interest rate, current discount rate | 5.32 | % | | 5.30 | % | | 5.33 | % | | 5.30 | % | | 5.36 | % | |
| | | | | | | | | | |
| December 31, 2021 | | | | | | | | | | |
| | | | | | | | | | |
| Weighted-average interest rate, original discount rate | 3.23 | % | | 4.96 | % | | 4.11 | % | | 3.22 | % | | 4.83 | % | |
| Weighted-average interest rate, current discount rate | 2.75 | % | | 2.68 | % | | 2.85 | % | | 2.71 | % | | 3.08 | % | |
The weighted average interest rates are calculated using projected future net liability cash flows that are aggregated to the segment level, and are represented as an annual rate.
Actuarial Assumption Updates for Liability for Future Policy Benefits
Corebridge undertook a review of all significant assumptions in 2022, 2021, and 2020. Corebridge recognized a $7 million favorable (mostly offset by corresponding DPL adjustment), $25 million unfavorable, and $0 impact in net income for 2022, 2021, and 2020, respectively, attributable to the annual actuarial assumption review. For 2022, the impact was due to updates to mortality and retirement assumption on certain pension risk transfer products. For 2021, the impact was mainly due to updated mortality on
ITEM 8 | Notes to Consolidated Financial Statements | 12. Insurance Liabilities
Traditional Life products. Assumptions left unchanged were deemed to be consistent with management’s best estimate at the time of the review.
Deferred Profit Liability: Corebridge issues certain annuity and life insurance contracts where premiums are paid up-front or for a shorter period than benefits will be paid (i.e., limited pay contracts). A DPL is required to be established to avoid recognition of gains when these contracts are issued. DPLs are amortized over the life of the contracts to align the revenue recognized with the related benefit expenses. The DPL is amortized in a constant relationship to the amount of discounted insurance in force for life insurance or expected future benefit payments for annuity contracts over the term of the contract.
Prior to the adoption of the Targeted Improvements to the Accounting for Long-Duration Contracts Standard
Limited pay contracts were subject to a lock-in concept and assumptions derived at policy issue were not subsequently updated unless a loss recognition event occurred. The net premiums were recorded as revenue. The difference between the gross premium received and the net premium was deferred and recognized in premiums in a constant relationship to insurance in-force, or for annuities, the amount of expected future policy benefits. This unearned revenue (deferred profit) was recorded in the Consolidated Balance Sheets in Other policyholder funds.
Subsequent to the adoption of the Targeted Improvements to the Accounting for Long-Duration Contracts Standard
The difference between the gross premium received and recorded as revenue and the net premium is deferred and recognized in Policyholder benefits in a constant relationship to insurance in-force, or for annuities, the amount of expected future policy benefits. This deferred profit liability accretes interest and is recorded in the Consolidated Balance Sheets in Future policy benefits. Cash flow assumptions included in the measurement of the DPL are the same as those utilized in the respective LFPBs and are reviewed at least annually. The cash flow estimates for DPLs are updated on a retrospective catch-up basis at the same time as the cash flow estimates for the related LFPBs. The updated LFPB cash flows are used to recalculate the DPL at the inception of the applicable related LFPB cohort. The difference between the recalculated DPL at the beginning of the current reporting period and the carrying amount of the DPL at the current reporting period is recognized as a gain or loss in Policyholder benefits in the Consolidated Statements of Income (Loss).
The following table presents the transition rollforward for deferred profit liability for long-duration contracts:
| | | | | | | | | | | | | | | | | | | | | | | | | | | | | | | | | | | |
| Individual
Retirement | | Group
Retirement | | Life
Insurance | | Institutional
Markets | | Corporate and Other | | Total |
| (in millions) | | | |
| | | | | | | | | | | |
| | | | | | | | | | | |
| Pre-adoption December 31, 2020 deferred profit liability balance | $ | 2 | | | $ | — | | | $ | 5 | | | $ | 64 | | | $ | — | | | $ | 71 | |
| Adjustments for the reclassification from/(to) the liability for the future policy benefits | 65 | | | 8 | | | — | | | 766 | | | 859 | | | 1,698 | |
| Post-adoption January 1, 2021 deferred profit liability balance | $ | 67 | | | $ | 8 | | | $ | 5 | | | $ | 830 | | | $ | 859 | | | $ | 1,769 | |
Adjustments for the reclassification between the liability for future policy benefits and deferred profit liability represent changes in the NPRs that are less than 100% at transition for certain limited pay cohorts, resulting in a reclassification between the two liabilities, with no impact on retained earnings.
Additional Liabilities: For universal-life type products, insurance benefits in excess of the account balance are generally recognized as expenses in the period incurred unless the design of the product is such that future charges are insufficient to cover the benefits, in which case an “additional liability” is accrued over the life of the contract. These additional liabilities are included in Future policy benefits for life and accident and health insurance contracts in the Consolidated Balance Sheets. Prior to the adoption of the standard, our additional liabilities consisted primarily of GMDBs on annuities, as well as universal-life contracts with secondary guarantees. Subsequent to the adoption of this standard, the GMDBs have been reclassified and reported as MRBs, while the universal-life contracts with secondary guarantees continue to be reported as additional liabilities.
ITEM 8 | Notes to Consolidated Financial Statements | 12. Insurance Liabilities
The following table presents the transition rollforward of the additional liabilities:
| | | | | | | | | | | | | | | | | | | | | | | | | | | | | | | |
| Individual
Retirement | | Group
Retirement | | Life
Insurance | | | | Corporate and Other | | Total |
| (in millions) |
| | | | | | | | | | | |
| | | | | | | | | | | |
Pre-adoption December 31, 2020 additional liabilities | $ | 1,391 | | | $ | 219 | | | $ | 5,117 | | | | | $ | 55 | | | $ | 6,782 | |
Adjustment for the reclassification of additional liabilities from Future policy benefits to Market risk benefits(a) | (875) | | | (130) | | | — | | | | | — | | | (1,005) | |
Adjustment for removal of related balances in Accumulated other comprehensive income originating from unrealized gains (losses)(b) | (516) | | | (89) | | | — | | | | | — | | | (605) | |
Post-adoption January 1, 2021 additional liabilities | $ | — | | | $ | — | | | $ | 5,117 | | | | | $ | 55 | | | $ | 5,172 | |
(a) Adjustments for the reclassification of additional liabilities from Future policy benefits to MRBs represent contract guarantees (e.g., GMDBs) that were previously classified as insurance liabilities within Future policy benefits, but have been reclassified as MRBs as of January 1, 2021. Refer to Note 13 for additional information on the transition impacts associated with LDTI.
(b) Adjustments for the removal of related balances in AOCI originating from unrealized gains (losses) relate to the additional liabilities reclassified from Future policy benefits in the line above.
ITEM 8 | Notes to Consolidated Financial Statements | 12. Insurance Liabilities
Post-adoption, our additional liabilities primarily consist of universal life policies with secondary guarantees and these additional liabilities are recognized in addition to the Policyholder account balances. For universal life policies with secondary guarantees, as well as other universal life policies for which profits followed by losses are expected at contract inception, a liability is recognized based on a benefit ratio of (a) the present value of total expected payments, in excess of the account value, over the life of the contract, divided by (b) the present value of total expected assessments over the life of the contract. For universal life policies without secondary guarantees, for which profits followed by losses are first expected after contract inception, we establish a liability, in addition to policyholder account balances, so that expected future losses are recognized in proportion to the emergence of profits in the earlier (profitable) years. Universal life account balances are reported within Policyholder contract deposits, while these additional liabilities are reported within the liability for future policy benefits in the Consolidated Balance Sheets. These additional liabilities are also adjusted to reflect the effect of unrealized gains or losses on fixed maturity securities available for sale on accumulated assessments, with related changes recognized through Other comprehensive income. The policyholder behavior assumptions for these liabilities include mortality, lapses and premium persistency. The capital market assumptions used for the liability for universal life secondary guarantees include discount rates and net earned rates.
The following table presents the balances and changes in the liability for universal life policies:
| | | | | | | | | | | | | | | | | | | | | | | | | | | | | | | | | | | |
| Year Ended December 31, 2022 | | Year Ended December 31, 2021 |
| Life
Insurance | | Corporate and Other | | Total | | Life
Insurance | | Corporate and Other | | Total |
| (in millions, except weighted average duration of liability ) | | | | | |
| | | | | | | | | | | |
| | | | | | | | | | | |
| Balance, beginning of year | $ | 4,952 | | | $ | 55 | | | $ | 5,007 | | | $ | 5,117 | | | $ | 55 | | | $ | 5,172 | |
| | | | | | | | | | | |
| Effect of changes in assumptions | (24) | | | — | | | (24) | | | (116) | | | — | | | (116) | |
| Effect of changes in experience | 303 | | | (4) | | | 299 | | | 331 | | | (4) | | | 327 | |
| Adjusted beginning balance | $ | 5,231 | | | $ | 51 | | | $ | 5,282 | | | $ | 5,332 | | | $ | 51 | | | $ | 5,383 | |
| | | | | | | | | | | |
| Assessments | 687 | | | 2 | | | 689 | | | 669 | | | 2 | | | 671 | |
| Excess benefits paid | (909) | | | — | | | (909) | | | (859) | | | — | | | (859) | |
| Interest accrual | 126 | | | 2 | | | 128 | | | 136 | | | 2 | | | 138 | |
| Other | (11) | | | — | | | (11) | | | 24 | | | — | | | 24 | |
| Changes related to unrealized appreciation (depreciation) of investments | (1,824) | | | — | | | (1,824) | | | (350) | | | — | | | (350) | |
| Balance, end of year | $ | 3,300 | | | $ | 55 | | | $ | 3,355 | | | $ | 4,952 | | | $ | 55 | | $ | — | | $ | 5,007 | |
| Less: Reinsurance recoverable | (191) | | | — | | | (191) | | | (200) | | | — | | | (200) | |
| Balance, end of period net of Reinsurance recoverable | $ | 3,109 | | | $ | 55 | | | $ | 3,164 | | | $ | 4,752 | | | $ | 55 | | | $ | 4,807 | |
| | | | | | | | | | | |
| Weighted average duration of liability * | 26.3 | | 9.5 | | | | 27.1 | | 9.8 | | |
* The weighted average duration of liability is calculated as the modified duration using projected future net liability cashflows that are aggregated at the segment level, utilizing the segment level weighted average interest rates, which can be found in the table below.
The following table presents the amount of revenue and interest recognized in the Consolidated Statement of Income (Loss) for the liability for universal life policies with secondary guarantees and similar features:
| | | | | | | | | | | | | | |
| Gross Assessments
Year Ended December 31, | Interest Accretion Year Ended December 31, |
|
| (in millions) | 2022 | 2021 | 2022 | 2021 |
| | | | |
| | | | |
| | | | |
| | | | |
| | | | |
| Life Insurance | $ | 1,193 | | $ | 1,187 | | $ | 126 | | $ | 136 | |
| | | | |
| Corporate and Other | 39 | | 39 | | 2 | | 2 | |
| Total | $ | 1,232 | | $ | 1,226 | | $ | 128 | | $ | 138 | |
| | | | |
The following table presents the calculation of weighted average interest rate for the liability for universal life policies with secondary guarantees and similar features:
| | | | | | | | | | | | | | | | | | | | | | | | | | |
| December 31, | | | 2022 | | 2021 | |
| | | Life
Insurance | | Corporate and Other | | Life
Insurance | | Corporate and Other | |
| | | | | |
| | | | | | | | | | |
| | | | | | | | | | |
| Weighted-average interest rate | | | 3.76 | % | | 4.24 | % | | 3.74 | % | | 4.21 | % | |
| | | | | | | | | | |
The weighted average interest rates are calculated using projected future net liability cash flows that are aggregated to the segment level, and are represented as an annual rate.
ITEM 8 | Notes to Consolidated Financial Statements | 12. Insurance Liabilities
The following table presents details concerning our universal life policies with secondary guarantees and similar features:
| | | | | | | | | | | | | | |
| | Years Ended December 31, |
| (in millions, except for attained age of contract holders) | | 2022 | | 2021 |
| Account value | | $ | 3,514 | | | $ | 3,313 |
| Net amount at risk | | $ | 69,335 | | | $ | 65,801 |
| Average attained age of contract holders | | 53 | | 53 |
Corebridge undertook a review of all significant assumptions in 2022, 2021, and 2020. Corebridge recognized a $24 million favorable, $117 million favorable, and $251 million unfavorable impact in net income for 2022, 2021, and 2020, respectively, attributable to the annual actuarial assumption review. For 2022, the impacts were due to modeling refinements to reflect actual versus expected asset data related to calls and capital gains. For 2021, the impacts were primarily due to the update in the reserving methodology, partially offset by assumption updates to mortality. Assumptions left unchanged were deemed to be consistent with management’s best estimate at the time of the review. For 2020, the impacts were driven by assumption updates to mortality.
POLICYHOLDER CONTRACT DEPOSITS
The liability for Policyholder contract deposits is primarily recorded at accumulated value (deposits received and net transfers from separate accounts, plus accrued interest credited at rates ranging from 0.0% to 9.0% at December 31, 2022, less withdrawals and assessed fees). Deposits collected on investment-oriented products are not reflected as revenues. They are recorded directly to Policyholder contract deposits upon receipt. Amounts assessed against the contract holders for mortality, administrative, and other services are included as Policy fees in revenues.
In addition to liabilities for universal life, fixed annuities, fixed options within variable annuities, annuities without life contingencies, funding agreements and GICs, policyholder contract deposits also include our liability for (i) index features accounted for as embedded derivatives at fair value, (ii) annuities issued in a structured settlement arrangement with no life contingency and (iii) certain contracts we have elected to account for at fair value. Changes in the fair value of the embedded derivatives related to policy index features and the fair value of derivatives hedging these liabilities are recognized in realized gains and losses.
For additional information on index credits accounted for as embedded derivatives, see Note 4.
The following table presents the transition rollforward of Policyholder contract deposits account balances: | | | | | | | | | | | | | | | | | | | | | | | | | | | | | | | | | | | |
| Individual
Retirement | | Group
Retirement | | Life
Insurance | | Institutional
Markets | | Corporate and Other | | Total |
| (in millions) |
| | | | | | | | | | | |
| | | | | | | | | | | |
| Pre-adoption December 31, 2020 Policyholder contract deposits | $ | 85,097 | | | $ | 43,805 | | | $ | 10,286 | | | $ | 11,559 | | | $ | 4,145 | | | $ | 154,892 | |
| Adjustment for the reclassification of the embedded derivative liability to market risk benefits, net of the host adjustment(s) | (5,894) | | | (577) | | | — | | | — | | | — | | | (6,471) | |
| | | | | | | | | | | |
| Post-adoption January 1, 2021 Policyholder contract deposits | $ | 79,203 | | | $ | 43,228 | | | $ | 10,286 | | | $ | 11,559 | | | $ | 4,145 | | | $ | 148,421 | |
| | | | | | | | | | | |
| | | | | | | | | | | |
ITEM 8 | Notes to Consolidated Financial Statements | 12. Insurance Liabilities
The following table presents the balances and changes in Policyholder contract deposits account balances(a): | | | | | | | | | | | | | | | | | | | | | | | | | | | | | | | | | | | |
| Year Ended December 31, 2022 | Individual
Retirement | | Group
Retirement | | Life
Insurance | | Institutional
Markets | | Corporate and Other | | Total |
| (in millions, except for average crediting rate) | | | | | |
| | | | | | | | | | | |
| | | | | | | | | | | |
| Policyholder contract deposits account balance, beginning of year | $ | 84,097 | | | $ | 43,902 | | | $ | 10,183 | | | $ | 10,804 | | | $ | 3,823 | | | $ | 152,809 | |
| Issuances | 15,175 | | | 4,927 | | | 190 | | | 1,468 | | | 15 | | | 21,775 | |
| Deposits received | 11 | | | 19 | | | 1,484 | | | 26 | | | 33 | | | 1,573 | |
| Policy charges | (870) | | | (462) | | | (1,570) | | | (69) | | | (65) | | | (3,036) | |
| Surrenders and withdrawals | (8,921) | | | (5,712) | | | (211) | | | (134) | | | (64) | | | (15,042) | |
| Benefit payments | (3,798) | | | (2,528) | | | (216) | | | (775) | | | (349) | | | (7,666) | |
| Net transfers from (to) separate account | 2,248 | | | 2,149 | | | (5) | | | 144 | | | — | | | 4,536 | |
| Interest credited | 1,608 | | | 1,100 | | | 377 | | | 301 | | | 178 | | | 3,564 | |
| Other | 4 | | | — | | | (8) | | | (31) | | | 16 | | | (19) | |
| Ending Policyholder contract deposits account balance | $ | 89,554 | | | $ | 43,395 | | | $ | 10,224 | | | $ | 11,734 | | | $ | 3,587 | | | $ | 158,494 | |
Other reconciling items(b) | (2,136) | | | (319) | | | 34 | | | (16) | | | 1 | | | (2,436) | |
| Policyholder contract deposits | $ | 87,418 | | | $ | 43,076 | | | $ | 10,258 | | | $ | 11,718 | | | $ | 3,588 | | | $ | 156,058 | |
| | | | | | | | | | | |
| Weighted average crediting rate | 2.43 | % | | 2.77 | % | | 4.29 | % | | 2.71 | % | | 4.91 | % | | |
Cash surrender value(c) | 83,278 | | | 41,831 | | | 8,866 | | | 2,537 | | | 1,808 | | | 138,320 | |
| | | | | | | | | | | | | | | | | | | | | | | | | | | | | | | | | | | |
| Year Ended December 31, 2021 | Individual
Retirement | | Group
Retirement | | Life
Insurance | | Institutional
Markets | | Corporate and Other | | Total |
| (in millions, except for average crediting rate) | | | | | |
| | | | | | | | | | | |
| | | | | | | | | | | |
| | | | | | | | | | | |
| | | | | | | | | | | |
| Policyholder contract deposits account balance, beginning of year | $ | 80,012 | | | $ | 43,406 | | | $ | 10,012 | | | $ | 11,351 | | | $ | 4,143 | | | $ | 148,924 | |
| Issuances | 13,760 | | | 5,124 | | | 225 | | | 1,230 | | | 18 | | | 20,357 | |
| Deposits received | 14 | | | 22 | | | 1,477 | | | 42 | | | 35 | | | 1,590 | |
| Policy charges | (781) | | | (523) | | | (1,567) | | | (65) | | | (69) | | | (3,005) | |
| Surrenders and withdrawals | (8,863) | | | (5,795) | | | (212) | | | (91) | | | (76) | | | (15,037) | |
| Benefit payments | (4,031) | | | (2,329) | | | (245) | | | (1,948) | | | (374) | | | (8,927) | |
| Net transfers from (to) separate account | 1,531 | | | 2,750 | | | (2) | | | 61 | | | — | | | 4,340 | |
| Interest credited | 2,444 | | | 1,249 | | | 447 | | | 263 | | | 191 | | | 4,594 | |
| Other | 11 | | | (2) | | | 48 | | | (39) | | | (45) | | | (27) | |
| Ending Policyholder contract deposits account balance | $ | 84,097 | | | $ | 43,902 | | | $ | 10,183 | | | $ | 10,804 | | | $ | 3,823 | | | $ | 152,809 | |
Other reconciling items(b) | (1,289) | | | (259) | | | 117 | | | 165 | | | 2 | | | (1,264) | |
| Policyholder contract deposits | $ | 82,808 | | | $ | 43,643 | | | $ | 10,300 | | | $ | 10,969 | | | $ | 3,825 | | | $ | 151,545 | |
| | | | | | | | | | | |
| Weighted average crediting rate | 2.42 | % | | 2.79 | % | | 4.28 | % | | 2.41 | % | | 4.92 | % | | |
Cash surrender value(c) | $ | 79,787 | | | $ | 43,359 | | | $ | 8,826 | | | $ | 2,520 | | | $ | 1,880 | | | $ | 136,372 | |
(a) Transactions between the general account and the separate account are presented in this table on a gross basis (e.g., a policyholder's funds are initially deposited into the general account and then simultaneously transferred to the separate account), and thus, did not impact the ending balance of policyholder contract deposits.
(b) Reconciling items principally relate to MRBs that are bifurcated and reported separately, net of embedded derivatives that are recorded in PCD.
(c) Cash surrender value is related to the portion of policyholder contract deposits that have a defined cash surrender value (e.g. GICs, do not have a cash surrender value).
For information related to net amount at risk, refer to the table that presents the balances of and changes in MRBs in Note 13.
The following table presents Policyholder contract deposits account balance by range of guaranteed minimum crediting rates and the related range of difference, in basis points, between rates being credited to policyholders and the respective guaranteed minimums:
ITEM 8 | Notes to Consolidated Financial Statements | 12. Insurance Liabilities
| | | | | | | | | | | | | | | | | |
| December 31, 2022 | At Guaranteed Minimum | 1 Basis Point - 50 Basis Points Above | More than 50 Basis Points Above Minimum Guarantee | Total |
| (in millions, except percentage of total) | | | | |
| | | | |
| Individual Retirement | Range of Guaranteed Minimum Credited Rate | | |
<=1% | 8,766 | | 2,161 | | 21,702 | | 32,629 | |
> 1% - 2% | 4,208 | | 24 | | 2,195 | | 6,427 | |
> 2% - 3% | 9,502 | | — | | 17 | | 9,519 | |
> 3% - 4% | 7,630 | | 40 | | 6 | | 7,676 | |
> 4% - 5% | 456 | | — | | 5 | | 461 | |
> 5% | 33 | | — | | 4 | | 37 | |
| Total | $ | 30,595 | | $ | 2,225 | | $ | 23,929 | | $ | 56,749 | |
| | | | | |
| | | | | |
| | | |
| | | | | |
| | | | | |
| | | | | |
| | | | | |
| | | | | |
| | | | | |
| Group Retirement | Range of Guaranteed Minimum Credited Rate | | |
<=1% | 3,611 | | 1,427 | | 5,609 | | 10,647 | |
> 1% - 2% | 5,628 | | 727 | | 150 | | 6,505 | |
> 2% - 3% | 13,968 | | 3 | | — | | 13,971 | |
> 3% - 4% | 666 | | — | | — | | 666 | |
> 4% - 5% | 6,843 | | — | | — | | 6,843 | |
> 5% | 154 | | — | | — | | 154 | |
| Total | $ | 30,870 | | $ | 2,157 | | $ | 5,759 | | $ | 38,786 | |
| | | | | |
| | | | | |
| Life Insurance | Range of Guaranteed Minimum Credited Rate | | |
<=1% | — | | — | | — | | — | |
> 1% - 2% | 1 | | 129 | | 352 | | 482 | |
> 2% - 3% | 32 | | 831 | | 1,116 | | 1,979 | |
> 3% - 4% | 1,369 | | 180 | | 195 | | 1,744 | |
> 4% - 5% | 2,974 | | — | | — | | 2,974 | |
> 5% | 223 | | — | | — | | 223 | |
| Total | 4,599 | | 1,140 | | 1,663 | | 7,402 | |
| | | | | |
| | | | | |
| Total* | $ | 66,064 | | $ | 5,522 | | $ | 31,351 | | $ | 102,937 | |
| Percentage of total | 64% | 5% | 30% | 100% |
ITEM 8 | Notes to Consolidated Financial Statements | 12. Insurance Liabilities
| | | | | | | | | | | | | | | | | |
| December 31, 2021 | At Guaranteed Minimum | 1 Basis Point - 50 Basis Points Above | More than 50 Basis Points Above Minimum Guarantee | Total |
| (in millions, except percentage of total) | | | | |
| | | | |
| Individual Retirement | Range of Guaranteed Minimum Credited Rate | | |
<=1% | 10,212 | | 1,911 | | 17,935 | | 30,058 | |
> 1% - 2% | 4,540 | | 28 | | 1,681 | | 6,249 | |
> 2% - 3% | 10,353 | | — | | 18 | | 10,371 | |
> 3% - 4% | 8,150 | | 41 | | 6 | | 8,197 | |
> 4% - 5% | 477 | | — | | 5 | | 482 | |
> 5% | 34 | | — | | 4 | | 38 | |
| Total | $ | 33,766 | | $ | 1,980 | | $ | 19,649 | | $ | 55,395 | |
| | | | | |
| | | | | |
| | | |
| | | | | |
| | | | | |
| | | | | |
| | | | | |
| | | | | |
| | | | | |
| Group Retirement | Range of Guaranteed Minimum Credited Rate | | |
<=1% | 2,134 | | 3,254 | | 4,682 | | 10,070 | |
> 1% - 2% | 6,027 | | 644 | | 99 | | 6,770 | |
> 2% - 3% | 14,699 | | — | | — | | 14,699 | |
> 3% - 4% | 708 | | — | | — | | 708 | |
> 4% - 5% | 6,962 | | — | | — | | 6,962 | |
> 5% | 159 | | — | | — | | 159 | |
| Total | $ | 30,689 | | $ | 3,898 | | $ | 4,781 | | $ | 39,368 | |
| | | | | |
| | | | | |
| Life Insurance | Range of Guaranteed Minimum Credited Rate | | |
<=1% | — | | — | | — | | — | |
> 1% - 2% | 103 | | 25 | | 359 | | 487 | |
> 2% - 3% | 258 | | 533 | | 1,208 | | 1,999 | |
> 3% - 4% | 1,417 | | 178 | | 213 | | 1,808 | |
> 4% - 5% | 3,085 | | 2 | | — | | 3,087 | |
> 5% | 236 | | — | | — | | 236 | |
| Total | $ | 5,099 | | $ | 738 | | $ | 1,780 | | $ | 7,617 | |
| | | | | |
| | | | | |
| Total* | $ | 69,554 | | $ | 6,616 | | $ | 26,210 | | $ | 102,380 | |
| Percentage of total | 68% | 6% | 26% | 100% |
* Excludes policyholder contract deposits account balances that are not subject to guaranteed minimum crediting rates.
Funding Agreements
Under a funding agreement-backed notes issuance program, an unaffiliated, non-consolidated statutory trust issues medium-term notes to investors, which are secured by funding agreements issued to the trust by one of our Life and Retirement companies.
USL is a member of the FHLB of New York, while VALIC and AGL are members of the FHLB of Dallas. Membership with both FHLBs provides us with collateralized borrowing opportunities, primarily as an additional source of liquidity or for other uses deemed appropriate by management. Our ownership in the FHLB stock is reported in Other invested assets within the Consolidated Balance Sheets. Pursuant to the membership terms, we elected to pledge such stock to the FHLB as collateral for our obligations under agreements entered into with the FHLB.
Our net borrowing capacity under such facilities with FHLB of Dallas and FHLB of New York as of December 31, 2022 is $4.4 billion. As of December 31, 2022, we pledged $7.4 billion as collateral to the FHLB, including assets backing funding agreements.
Corebridge issued the following funding agreements to the FHLB of Dallas and FHLB of New York; these obligations are reported in Policyholder contract deposits in the Consolidated Balance Sheets:
ITEM 8 | Notes to Consolidated Financial Statements | 12. Insurance Liabilities
The following table presents details concerning our funding agreements as of December 31, 2022:
| | | | | | | | | | | | | | | | | | | | |
| December 31, 2022 | | Payments due by period | |
| (in millions) | Gross Amounts | 2023 | 2024-2025 | 2026-2027 | Thereafter | Stated Interest rates |
| FHLB Facility | | | | | | |
| FHLB of Dallas | $ | 3,357 | $ | — | $ | 52 | $ | 378 | $ | 2,927 | DNU Auction* + 22 to 30 bps |
| FHLB of Dallas | 1,000 | — | — | 1,000 | — | 3.53 | % |
| FHLB of New York | 241 | — | 241 | — | — | 1.52% to 2.70% |
| $ | 4,598 | $ | — | $ | 293 | $ | 1,378 | $ | 2,927 | |
* Discount Note Advance (“DNA”) Auction is based on either a 4-Week or 3-Month tenor, depending on contractual terms of each borrowing.
OTHER POLICYHOLDER FUNDS
Other policyholder funds include URR, consisting of front-end loads on investment-oriented contracts, representing those policy loads that are non-level and typically higher in initial policy years than in later policy years. Amortization of URR is recorded in Policy fees.
Prior to the adoption of the Targeted Improvements to the Accounting for Long-Duration Contracts Standard
URR for investment-oriented contracts are generally deferred and amortized, with interest, in relation to the incidence of EGPs to be realized over the estimated lives of the contracts and are subject to the same adjustments due to changes in the assumptions underlying EGPs as DAC. Similar to unrealized appreciation (depreciation) of investments for DAC, URR related to investment-oriented products is also adjusted to reflect the effect of unrealized gains or losses on fixed maturity securities available for sale on EGPs, with related changes recognized through Other comprehensive income.
Subsequent to the adoption of the Targeted Improvements to the Accounting for Long-Duration Contracts Standard
URR for investment-oriented contracts are generally deferred and amortized into income using the same assumptions and factors used to amortize DAC (i.e., on a constant level basis). Changes in future assumptions are applied by adjusting the amortization rate prospectively. The Company has elected to implicitly account for actual experience, whether favorable or unfavorable, in its amortization of URR (i.e., policy fees) each period.
Other policyholder funds also include provisions for future dividends to participating policyholders, accrued in accordance with all applicable regulatory or contractual provisions. The participating life business represented approximately 0.7% of gross insurance in force at December 31, 2022 and 1.3% of gross domestic premiums and other considerations in 2022. The amount of annual dividends to be paid is approved locally by the Corebridge Boards of Directors. Provisions for future dividend payments are computed by jurisdiction, reflecting local regulations. The portions of current and prior net income and of current unrealized appreciation of investments that can inure to our benefit are restricted in some cases by the insurance contracts and by the local insurance regulations of the jurisdictions in which the policies are in force.
Certain products are subject to experience adjustments. These include group life and group medical products, credit life contracts, accident and health insurance contracts/riders attached to life policies and, to a limited extent, reinsurance agreements with other direct insurers. Ultimate premiums from these contracts are estimated and recognized as revenue with the unearned portions of the premiums recorded as liabilities in Other policyholder funds. Experience adjustments vary according to the type of contract and the territory in which the policy is in force and are subject to local regulatory guidance.
The following table presents the transition rollforward of URR:
| | | | | | | | | | | | | | | | | | | | | | | | | | | | | |
| | | | Life
Insurance | | Institutional
Markets | | Corporate and Other | | Total |
| (in millions) | | | | | | |
| | | | | | | | | | | |
| | | | | | | | | | | |
| Pre-adoption December 31, 2020 URR balance | | | | | $ | 1,413 | | | $ | 2 | | | $ | 132 | | | $ | 1,547 | |
| Adjustment for removal of related balances in Accumulated other comprehensive income originating from unrealized gains (losses) | | | | | 248 | | | — | | | — | | | 248 | |
| Post-adoption January 1, 2021 URR balance | | | | | $ | 1,661 | | | $ | 2 | | | $ | 132 | | | $ | 1,795 | |
| | | | | | | | | | | |
Prior to the adoption of LDTI, URR for investment-oriented products included the effect of unrealized gains or losses on fixed maturity securities classified as available for sale. At the transition date, these adjustments were removed with a corresponding offset in AOCI. As the available for sale portfolio was in an unrealized gain position as of the transition date, the adjustment for removal of related balances in AOCI originating from unrealized gains (losses) balances were reducing URR.
ITEM 8 | Notes to Consolidated Financial Statements | 12. Insurance Liabilities
The following table presents a rollforward of the unearned revenue reserve for the year ended December 31, 2022 and 2021:
| | | | | | | | | | | | | | | | | | | | | | | |
| Year Ended December 31, 2022 | Life
Insurance | | Institutional
Markets | | Corporate and Other | | Total |
| (in millions) | | | |
| | | | | | | |
| | | | | | | |
| Balance, beginning of year | $ | 1,693 | | | $ | 2 | | | $ | 116 | | | $ | 1,811 | |
| Revenue deferred | 143 | | | — | | | — | | | 143 | |
| | | | | | | |
| | | | | | | |
| Amortization | (109) | | | — | | | (11) | | | (120) | |
| | | | | | | |
| Ending balance | $ | 1,727 | | | $ | 2 | | | $ | 105 | | | $ | 1,834 | |
Other reconciling items* | | | | | | | 1,051 | |
| Other policyholder funds | | | | | | | $ | 2,885 | |
| | | | | | | | | | | | | | | | | | | | | | | |
| Year Ended December 31, 2021 | Life
Insurance | | Institutional
Markets | | Corporate and Other | | Total |
| (in millions) | | | |
| | | | | | | |
| | | | | | | |
| Balance, beginning of year | $ | 1,661 | | | $ | 2 | | | $ | 132 | | | $ | 1,795 | |
| Revenue deferred | 140 | | | — | | | — | | | 140 | |
| | | | | | | |
| | | | | | | |
| Amortization | (108) | | | — | | | (15) | | | (123) | |
| Other, including foreign exchange | — | | | — | | | (1) | | | (1) | |
| Ending balance | $ | 1,693 | | | $ | 2 | | | $ | 116 | | | $ | 1,811 | |
| Other reconciling items* | | | | | | | 1,068 | |
| Other policyholder funds | | | | | | | $ | 2,879 | |
* Other reconciling items include policyholders' dividend accumulations, provisions for future dividends to participating policyholders, dividends to policyholders and any similar items.
MRBs are defined as contracts or contract features that both provide protection to the contract holder from other-than-nominal capital market risk and expose Corebridge to other-than nominal capital market risk. The MRB is an amount that a policyholder receives in addition to the account balance upon the occurrence of a specific event or circumstance, such as death, annuitization, or periodic withdrawal that involves protection from other-than-nominal capital market risk. Certain contract features, such as GMWBs, GMDBs and GMIBs commonly found in variable, fixed index and fixed annuities, are MRBs. MRBs are assessed at contract inception using a non-option method involving attributed fees that results in an initial fair value of zero or an option method that results in a fair value greater than zero.
MRBs are recorded at fair value, and Corebridge applies a non-option attributed fee valuation method for variable annuity products, and an option-based valuation method (host offset) for both fixed index and fixed products. Under the non-option valuation method, the attributed fee is determined at contract inception; it cannot exceed the total contract fees and assessments collectible from the contract holder and cannot be less than zero. Investment margin is excluded from the attributed fee determination. Under the option-based valuation method, an offset to the host amount related to the MRB amount is established at inception. Changes in the fair value of MRBs are recorded in net income in Changes in the fair value of market risk benefits, net and the portion of the fair value change attributable to our own credit risk, is recognized in OCI. MRBs are derecognized when the underlying contract is surrendered, a GMDB is incurred, a GMIB is annuitized, or when the account value is exhausted on a policy with a GMWB. When a policyholder elects to annuitize a GMIB rider or the account value on a policy with a GMWB rider is reduced to zero, the policy is converted to a payout annuity automatically. When a conversion occurs, the policyholder is issued a new payout annuity contract. At this point, the MRB is derecognized, and a LFPB is established for the payout annuity.
Assumptions used to determine the MRB asset (including ceded MRBs) or liability generally include mortality rates that are based upon actual experience modified to allow for variations in policy form; lapse rates that are based upon actual experience modified to allow for variations in policy features; and investment returns, based on stochastically generated scenarios. We evaluate at least annually, estimates used to determine the MRB asset or liability and adjust the balance, with a related charge or credit to Change in fair value of market risk benefits, net, if actual experience or other evidence suggests that earlier assumptions should be revised. In addition, MRBs are valued such that the current provision for nonperformance risk is reflected in the claims cash flows of the asset or liability valuation for direct MRBs. The nonperformance risk spread at contract issue is locked-in. The difference between the MRB valued using the at issue nonperformance risk spread and the current nonperformance risk spread is reported through other comprehensive income, while changes in the counterparty credit risk related to ceded MRBs are reported in income.
Changes in the fair value of Market Risk Benefits, net represents changes in the fair value of market risk benefit liabilities and assets (with the exception of our own credit risk changes), and includes attributed rider fees and benefits, net of changes in the fair value of derivative instruments and fixed maturity securities that are used to economically hedge market risk from the VA GMWB riders.
ITEM 8 | Notes to Consolidated Financial Statements | 13. Market Risk Benefits
The following table presents the transition rollforward of MRBs:
| | | | | | | | | | | | | | | | | | | | |
| | Individual
Retirement | | Group
Retirement | | Total |
| (in millions) | | | |
| | | | | | |
| | | | | | |
| | | | | | |
| | | | | | |
| Pre-adoption December 31, 2020 carrying amount for features now classified as MRBs | | $ | — | | | $ | — | | | $ | — | |
Adjustment for the reclassification of the embedded derivative liability from policyholder contract deposits, net of the host adjustment(s)(a) | | 5,894 | | | 577 | | | 6,471 | |
Adjustment for the reclassification of additional liabilities from Future policy benefits(b) | | 1,356 | | | 219 | | | 1,575 | |
Adjustments for the cumulative effect of the changes in our own credit risk between the original contract issuance date and the transition date(c) | | 2,140 | | | 187 | | | 2,327 | |
| | | | | | |
Adjustment for the removal of related balances in Accumulated other comprehensive income originating from unrealized gains (losses)(d) | | (516) | | | (89) | | | (605) | |
| | | | | | |
| | | | | | |
Adjustment for the remaining difference (exclusive of our own credit risk change and host contract adjustments) between previous carrying amount and fair value measurement for the MRB(e) | | (1,275) | | | (92) | | | (1,367) | |
Post-adoption January 1, 2021 carrying amount for features now classified as MRBs | | $ | 7,599 | | | $ | 802 | | | $ | 8,401 | |
(a) Adjustments for the reclassification from Policyholder contract deposits represents certain contract guarantees (e.g., GMWBs) that were previously classified as embedded derivatives, but have been reclassified as MRBs as of January 1, 2021, and the related host impact. The impact on Retained earnings or AOCI resulting from the simultaneous remeasurement of the guarantee as a market risk benefit is reflected in the lines below.
(b) Adjustments for the reclassification from Future policy benefits represents contract guarantees (e.g., GMDBs) that were previously classified as insurance liabilities within Future policy benefits, but have been reclassified as MRBs as of January 1, 2021. The impact on Retained earnings or AOCI resulting from the simultaneous remeasurement of the guarantee as a market risk benefit is reflected in the lines below.
(c) Adjustments for the cumulative effect of the changes in our own credit risk between the original contract issuance date and the transition date are recognized in AOCI.
(d) Adjustment for the removal of related balances in AOCI originating from unrealized gains (losses) with an offset to AOCI relate to the additional liabilities reclassified from Future policy benefits in the line above.
(e) Adjustment for the remaining difference represents the measurement of MRBs at fair value, excluding the impact of our own credit risk with an offset to Retained earnings.
The following is a reconciliation of MRBs by amounts in an asset position and in liability position to the MRB amounts in the Consolidated Balance Sheets at transition:
| | | | | | | | | | | | | | | | | | | | |
| | Individual
Retirement | | Group
Retirement | | Total |
| (in millions) | | | |
| Market risk benefit in an asset position | | $ | 176 | | | $ | — | | | $ | 176 | |
| Reinsured market risk benefit | | 162 | | | — | | | 162 | |
| Market Risk Benefit assets, at fair value | | $ | 338 | | | — | | | $ | 338 | |
| | | | | | |
| Market Risk Benefit liabilities, at fair value | | 7,937 | | | 802 | | | 8,739 | |
Market risk benefit, net, January 1, 2021 | | $ | 7,599 | | | $ | 802 | | | $ | 8,401 | |
ITEM 8 | Notes to Consolidated Financial Statements | 13. Market Risk Benefits
The following table presents the balances of and changes in market risk benefits:
| | | | | | | | | | | | | | | | | | | | |
| Year Ended December 31, 2022 | | Individual
Retirement | | Group
Retirement | | Total |
| (in millions, except for attained age of contract holders) | | | |
| Balance, beginning of year | | $ | 6,452 | | | $ | 582 | | | $ | 7,034 | |
| Balance, beginning of year, before effect of changes in our own credit risk | | 4,518 | | | 415 | | | 4,933 | |
| Issuances | | 263 | | | 25 | | | 288 | |
| Interest accrual | | 172 | | | 21 | | | 193 | |
| Attributed fees | | 864 | | | 70 | | | 934 | |
| Expected claims | | (83) | | | (2) | | | (85) | |
| Effect of changes in interest rates | | (4,087) | | | (371) | | | (4,458) | |
| Effect of changes in interest rate volatility | | 263 | | | 18 | | | 281 | |
| Effect of changes in equity markets | | 1,382 | | | 122 | | | 1,504 | |
| Effect of changes in equity index volatility | | (75) | | | 1 | | | (74) | |
| Actual outcome different from model expected outcome | | 164 | | | (3) | | | 161 | |
| Effect of changes in future expected policyholder behavior | | (2) | | | (18) | | | (20) | |
| Effect of changes in other future expected assumptions | | (85) | | | — | | | (85) | |
| | | | | | |
| | | | | | |
| Other, including foreign exchange | | 3 | | | (6) | | | (3) | |
| Balance, end of year before effect of changes in our own credit risk | | 3,297 | | | 272 | | | 3,569 | |
| Effect of changes in our own credit risk | | 441 | | | 24 | | | 465 | |
| | | | | | |
| Balance, end of year | | 3,738 | | | 296 | | | 4,034 | |
| | | | | | |
| | | | | | |
| Less: Reinsured MRB, end of year | | (94) | | | — | | | (94) | |
| Net Liability Balance after reinsurance recoverable | | $ | 3,644 | | | $ | 296 | | | $ | 3,940 | |
| Net amount at risk | | | | | | |
| GMDB only | | $ | 1,615 | | | $ | 371 | | | $ | 1,986 | |
| GMWB only | | $ | 27 | | | $ | 1 | | | $ | 28 | |
Combined* | | $ | 2,084 | | | $ | 39 | | | $ | 2,123 | |
| Weighted average attained age of contract holders | | 70 | | 64 | | |
| | | | | | | | | | | | | | | | | | | | |
| Year Ended December 31, 2021 | | Individual
Retirement | | Group
Retirement | | Total |
| (in millions, except for attained age of contract holders) | | | |
| | | | | | |
| | | | | | |
| Balance, beginning of year | | $ | 7,761 | | | $ | 802 | | | $ | 8,563 | |
| Balance, beginning of year, before effect of changes in our own credit risk | | 5,621 | | | 615 | | | 6,236 | |
| Issuances | | 247 | | | 28 | | | 275 | |
| Interest accrual | | 142 | | | 21 | | | 163 | |
| Attributed fees | | 805 | | | 74 | | | 879 | |
| Expected claims | | (54) | | | (2) | | | (56) | |
| Effect of changes in interest rates | | (1,098) | | | (107) | | | (1,205) | |
| Effect of changes in interest rate volatility | | 74 | | | 4 | | | 78 | |
| Effect of changes in equity markets | | (1,414) | | | (203) | | | (1,617) | |
| Effect of changes in equity index volatility | | 33 | | | 20 | | | 53 | |
| Actual outcome different from model expected outcome | | 106 | | | 8 | | | 114 | |
| Effect of changes in future expected policyholder behavior | | 53 | | | (36) | | | 17 | |
| | | | | | |
| | | | | | |
| | | | | | |
| Other, including foreign exchange | | 3 | | | (7) | | | (4) | |
| Balance, end of year before effect of changes in our own credit risk | | 4,518 | | | 415 | | | 4,933 | |
| Effect of changes in our own credit risk | | 1,934 | | | 167 | | | 2,101 | |
| | | | | | |
| Balance, end of year | | 6,452 | | | 582 | | | 7,034 | |
| | | | | | |
| | | | | | |
| Less: Reinsured MRB, end of year | | (145) | | | — | | | (145) | |
| Net Liability Balance after reinsurance recoverable | | $ | 6,307 | | | $ | 582 | | | $ | 6,889 | |
| Net amount at risk | | | | | | |
| GMDB only | | $ | 684 | | | $ | 159 | | | $ | 843 | |
| GMWB only | | $ | 831 | | | $ | 118 | | | $ | 949 | |
Combined* | | $ | 567 | | | $ | 14 | | | $ | 581 | |
| Weighted average attained age of contract holders | | 70 | | 63 | | |
* Certain contracts contain both guaranteed GMDB and GMWB features and are modeled together for the purposes of calculating the MRB.
ITEM 8 | Notes to Consolidated Financial Statements | 13. Market Risk Benefits
The following is a reconciliation of MRBs by amounts in an asset position and in a liability position to the MRBs amount in the Consolidated Balance Sheets:
| | | | | | | | | | | | | | | | | | | | | | | | | | | | | | | | | | | | | | |
| Years Ended December 31, | | 2022 | | 2021 |
| (in millions) | | Asset* | | Liability* | | Net | | Asset* | | Liability* | | Net |
| | | | | | | | | | | | |
| | | | | | | | | | | | |
| | | | | | | | | | | | |
| Individual Retirement | | $ | 661 | | | $ | 4,305 | | | $ | 3,644 | | | $ | 472 | | | $ | 6,779 | | | $ | 6,307 | |
| | | | | | | | | | | | |
| Group Retirement | | 135 | | | 431 | | | 296 | | | 138 | | | 720 | | | 582 | |
| | | | | | | | | | | | |
| | | | | | | | | | | | |
| Total | | $ | 796 | | | $ | 4,736 | | | $ | 3,940 | | | $ | 610 | | | $ | 7,499 | | | $ | 6,889 | |
* Cash flows and attributed fees for MRBs are determined on a policy level basis and are reported based on their asset or liability position at the balance sheet date.
For additional information related to fair value measurements of MRBs see Note 4.
Actuarial Assumption Updates for Market Risk Benefits
Corebridge recognized a $105 million favorable and $17 million unfavorable impact in net income for 2022 and 2021, respectively, attributable to the annual actuarial assumption review. For 2022, the impacts were mainly due to an update to the relationship between projected equity growth and interest rates for annuities. For 2021, the impacts were mainly due to updating the lapse rate expectations. Assumptions left unchanged were deemed to be consistent with management’s best estimate at the time of the review.
ANNUITY GUARANTEES
Annuity contracts may include certain contractually guaranteed benefits to the contract holder. These guaranteed features include GMDBs that are payable in the event of death and living benefits that are payable when partial withdrawals exhaust a policy’s account value, in the event of annuitization, or, in other instances, at specified dates during the accumulation period. Living benefits primarily include GMWBs. A variable annuity contract may include more than one type of guaranteed benefit feature; for example, it may have both a GMDB and a GMWB. However, a policyholder can only receive payout from one guaranteed feature on a contract containing a death benefit and a living benefit, i.e., the features are mutually exclusive (except a surviving spouse who has a rider to potentially collect both a GMDB upon their spouse’s death and a GMWB during their lifetime). A policyholder cannot purchase more than one living benefit on one contract. The net amount at risk for each feature is calculated irrespective of the existence of other features; as a result, the net amount at risk for each feature is not additive to that of other features.
Guaranteed Benefits on Variable Annuities
Depending on the contract, the GMDB feature may provide a death benefit of either (a) total deposits made to the contract, less any partial withdrawals plus a minimum return (and in rare instances, no minimum return), (b) return of premium whereby the benefit is the greater of the current account value or premiums paid less any partial withdrawals, (c) rollups whereby the benefit is the greater of current account value or premiums paid (adjusted for withdrawals) accumulated at contractually specified rates up to specified ages, or (d) the highest contract value attained, typically on any anniversary date less any subsequent withdrawals following the contract anniversary. GMDB is our most widely offered benefit.
Certain of our variable annuity contracts also contain living benefit riders, which include optional GMWBs and, to a lesser extent, GMABs and GMIBs. These living benefits and GMDBs related to variable annuity contracts are accounted for as MRBs measured at fair value, with changes in the fair value (excluding changes in our own credit risk) recorded in Change in the fair value of market risk benefits, net. The net amount at risk for the GMWB represents benefits in excess of the account value assuming the utilization of all benefits by the contract holders at the balance sheet date. The net amount at risk for the GMDB feature represents the amount of guaranteed benefits in excess of account value if all policyholders died.
Guaranteed Benefits on Fixed Index and Fixed Annuities
Certain of our fixed annuity and fixed index annuity contracts, which are not offered through separate accounts, contain optional GMWBs. With a GMWB, the contract holder can monetize the excess of the guaranteed amount over the account value of the contract through a series of withdrawals that do not exceed a specific percentage per year of the guaranteed amount. Once the account value is exhausted, the contract holder will receive a series of annuity payments equal to the remaining guaranteed amount; for lifetime GMWB products, the annuity payments continue as long as the covered person(s) is living. The liability for GMWBs in fixed annuity and fixed index annuity contracts, which are recorded in MRBs, represents the expected value of benefits in excess of the projected account value, with the excess (excluding changes in our own credit risk) recognized at fair value through Change in the fair value of MRBs, net.
The liability for all of our GMWBs in fixed annuity and fixed index annuity contracts are accounted for as MRBs.
For a discussion of the fair value measurement of guaranteed benefits that are accounted for as MRBs, see Note 4.
ITEM 8 | Notes to Consolidated Financial Statements | 13. Market Risk Benefits
14. Separate Account Assets and Liabilities We report variable contracts within the separate accounts when investment income and investment gains and losses accrue directly to, and investment risk is borne by, the contract holder and the separate account meets additional accounting criteria to qualify for separate account treatment. The assets supporting the variable portion of variable annuity and variable universal life contracts that qualify for separate account treatment are carried at fair value and are reported as separate account assets, with an equivalent summary total reported as separate account liabilities. The assets of insulated accounts are legally segregated and are not subject to claims that arise from any of our other businesses.
Policy values for variable products and investment contracts are expressed in terms of investment units. Each unit is linked to an asset portfolio. The value of a unit increases or decreases based on the value of the linked asset portfolio. The current liability at any time is the sum of the current unit value of all investment units in the separate accounts, plus any liabilities for MRBs.
Amounts assessed against the policyholders for mortality, administrative and other services are included in policy fees. Investment performance (including investment income, net investment gains (losses) and changes in unrealized gains (losses)) and the corresponding amounts credited to policyholders of such separate accounts are offset within the same line in the Consolidated Statements of Income (Loss).
For discussion of the fair value measurement of guaranteed benefits that are accounted for as MRBs, see Note 4.
The following table presents fair value of separate account investment options:
| | | | | | | | | | | | | | | | | | | | | | | | | | | | | |
| December 31, 2022 | Individual Retirement | | Group Retirement | | Life
Insurance | | Institutional
Markets | | Total |
| (in millions) |
| | | | | | | | | |
| Equity Funds | $ | 22,990 | | | $ | 24,608 | | | $ | 687 | | | $ | 581 | | | $ | 48,866 | |
| Bond Funds | 3,802 | | | 4,081 | | | 46 | | | 1,321 | | | 9,250 | |
| Balanced Funds | 17,663 | | | 5,113 | | | 49 | | | 1,939 | | | 24,764 | |
| Money Market Funds | 723 | | | 559 | | | 17 | | | 674 | | | 1,973 | |
| Total | $ | 45,178 | | | $ | 34,361 | | | $ | 799 | | | $ | 4,515 | | | $ | 84,853 | |
| | | | | | | | | | | | | | | | | | | | | | | | | | | | | |
| December 31, 2021 | Individual Retirement | | Group Retirement | | Life
Insurance | | Institutional
Markets | | Total |
| (in millions) |
| | | | | | | | | |
| Equity Funds | $ | 29,158 | | | $ | 33,849 | | | $ | 917 | | | $ | 748 | | | $ | 64,672 | |
| Bond Funds | 4,745 | | | 4,496 | | | 50 | | | 1,468 | | | 10,759 | |
| Balanced Funds | 23,460 | | | 6,326 | | | 60 | | | 2,515 | | | 32,361 | |
| Money Market Funds | 564 | | | 467 | | | 17 | | | 271 | | | 1,319 | |
| Total | $ | 57,927 | | | $ | 45,138 | | | $ | 1,044 | | | $ | 5,002 | | | $ | 109,111 | |
The following table presents the balances and changes in separate account liabilities:
| | | | | | | | | | | | | | | | | | | | | | | | | | | | | |
| Year Ended December 31, 2022 | Individual Retirement | | Group
Retirement | | Life
Insurance | | Institutional
Markets | | Total |
| (in millions) | | |
| | | | | | | | | |
| | | | | | | | | |
| Separate accounts balance, beginning of year | $ | 57,927 | | | $ | 45,138 | | | $ | 1,044 | | | $ | 5,002 | | | $ | 109,111 | |
| Premiums and deposits | 2,420 | | | 1,611 | | | 37 | | | 69 | | | 4,137 | |
| Policy charges | (1,325) | | | (461) | | | (51) | | | (100) | | | (1,937) | |
| Surrenders and withdrawals | (3,320) | | | (2,452) | | | (22) | | | (131) | | | (5,925) | |
| Benefit payments | (898) | | | (613) | | | (6) | | | (59) | | | (1,576) | |
| Investment performance | (9,861) | | | (8,479) | | | (201) | | | (319) | | | (18,860) | |
| Net transfers from (to) general account | 235 | | | (383) | | | (2) | | | 44 | | | (106) | |
| Other charges | — | | | — | | | — | | | 9 | | | 9 | |
| Separate accounts balance, end of year | $ | 45,178 | | | $ | 34,361 | | | $ | 799 | | | $ | 4,515 | | | $ | 84,853 | |
| | | | | | | | | |
| Cash surrender value* | $ | 44,124 | | | $ | 34,169 | | | $ | 777 | | | $ | 4,518 | | | $ | 83,588 | |
| | | | | | | | | |
| | | | | | | | | |
ITEM 8 | Notes to Consolidated Financial Statements | 14. Separate Account Assets and Liabilities
| | | | | | | | | | | | | | | | | | | | | | | | | | | | | |
| Year Ended December 31, 2021 | Individual
Retirement | | Group
Retirement | | Life
Insurance | | Institutional
Markets | | Total |
| (in millions) | | | | |
| | | | | | | | | |
| | | | | | | | | |
| Separate accounts balance, beginning of year | $ | 53,456 | | | $ | 41,310 | | | $ | 912 | | | $ | 4,612 | | | $ | 100,290 | |
| Premiums and deposits | 4,081 | | | 1,979 | | | 49 | | | 76 | | | 6,185 | |
| Policy charges | (1,368) | | | (523) | | | (52) | | | (98) | | | (2,041) | |
| Surrenders and withdrawals | (4,261) | | | (3,013) | | | (32) | | | (82) | | | (7,388) | |
| Benefit payments | (1,039) | | | (615) | | | (10) | | | (23) | | | (1,687) | |
| Investment performance | 6,743 | | | 6,711 | | | 180 | | | 486 | | | 14,120 | |
| Net transfers from (to) general account | 315 | | | (711) | | | (3) | | | 26 | | | (373) | |
| Other charges | — | | | — | | | — | | | 5 | | | 5 | |
| Separate accounts balance, end of year | $ | 57,927 | | | $ | 45,138 | | | $ | 1,044 | | | $ | 5,002 | | | $ | 109,111 | |
| | | | | | | | | |
| Cash surrender value* | $ | 56,727 | | | $ | 44,909 | | | $ | 1,026 | | | $ | 4,993 | | | $ | 107,655 | |
* The cash surrender value represents the amount of the contract holder’s account balance distributable at the balance sheet date less applicable surrender charges.
Separate account liabilities primarily represent the contract holder's account balance in separate account assets and will be equal and offsetting to total separate account assets.
ITEM 8 | Notes to Consolidated Financial Statements | 15. Debt
15. Debt
Short-term and long-term debt is carried at the principal amount borrowed, including unamortized discounts, and fair value adjustments, when applicable.
The following table lists our total debt outstanding at December 31, 2022 and December 31, 2021. The interest rates presented in the following table are the range of contractual rates in effect at December 31, 2022, including fixed and variable rates:
| | | | | | | | | | | | | | | | | | | | | | | |
| (in millions) | Range of
Interest Rate(s) | | Maturity
Date(s) | | December 31, 2022 | | December 31, 2021 |
| Short-term debt issued or borrowed by Corebridge: | | | | | | | |
Affiliated senior promissory note with AIG | LIBOR+100bps | | 2022 | | $ | — | | $ | 8,317 |
Three-Year DDTL Facility | 5.80 | % | | 2023 | | 1,500 | | — |
| | | | | | | |
| Total short-term debt | | | | | 1,500 | | 8,317 |
| Long-term debt issued by Corebridge: | | | | | | | |
Senior unsecured notes* | 3.50% - 4.40% | | 2025 - 2052 | | 6,500 | | — |
| Hybrid junior subordinated notes | 6.875% | | 2052 | | 1,000 | | — |
| Long-term debt issued by Corebridge subsidiaries: | | | | | | | |
| AIGLH notes | 6.63% - 7.50% | | 2025 - 2029 | | 200 | | 200 |
| AIGLH junior subordinated debentures | 7.57% - 8.50% | | 2030 - 2046 | | 227 | | 227 |
| Total long-term debt | | | | | 7,927 | | 427 |
| Debt issuance costs | | | | | (59) | | — |
| Total long-term debt, net of debt issuance costs | | | | | 7,868 | | 427 |
| Debt of consolidated investment entities - not guaranteed by Corebridge | 0.00% -12.27% | | 2023 - 2051 | | 5,958 | | 6,936 |
| Total debt, net of issuance costs | | | | | $ | 15,326 | | $ | 15,680 |
* Interest rates reflect contractual amounts and do not reflect the effective borrowing rate after giving effect to the cash flow hedges.
The following table presents maturities of short-term and long-term debt (including unamortized original issue discount when applicable):
| | | | | | | | | | | | | | | | | | | | | | | | | | | | | | | | | | | | | | | | | |
| December 31, 2022 | | | Year Ending |
| (in millions) | Total | | 2023 | | 2024 | | 2025 | | 2026 | | 2027 | | Thereafter |
| Short-term and Long-term debt issued by Corebridge: | | | | | | | | | | | | | |
| | | | | | | | | | | | | |
Three-Year DDTL Facility* | $ | 1,500 | | $ | 1,500 | | $ | — | | $ | — | | $ | — | | $ | — | | $ | — |
| | | | | | | | | | | | | |
| | | | | | | | | | | | | |
| | | | | | | | | | | | | |
| Senior unsecured notes | 6,500 | | — | | — | | 1,000 | | — | | 1,250 | | 4,250 |
| Hybrid junior subordinated notes | 1,000 | | — | | — | | — | | — | | — | | 1,000 |
| | | | | | | | | | | | | |
| AIGLH notes | 200 | | — | | — | | 101 | | — | | — | | 99 |
| AIGLH junior subordinated debentures | 227 | | — | | — | | — | | — | | — | | 227 |
| Total short-term and long-term debt issued by Corebridge | $ | 9,427 | | $ | 1,500 | | $ | — | | $ | 1,101 | | $ | — | | $ | 1,250 | | $ | 5,576 |
| | | | | | | | | | | | | |
| | | | | | | | | | | | | |
| | | | | | | | | | | | | |
| | | | | | | | | | | | | |
*On September 15, 2022, Corebridge Parent borrowed an aggregate principal amount of $1.5 billion under the Three-Year DDTL Facility through October 20, 2022. We continued this borrowing through June 21, 2023. We have the ability to further continue this borrowing through February 25, 2025.
SENIOR UNSECURED NOTES AND DELAYED DRAW TERM LOAN
On February 25, 2022, Corebridge Parent entered into an 18-Month Delayed Draw Term Loan Agreement (the “18-Month DDTL Facility”) among Corebridge Parent, as borrower, the lenders party thereto and the administrative agent thereto, and a Three-Year Delayed Draw Term Loan Agreement (the “Three-Year DDTL Facility”) among Corebridge Parent, as borrower, the lenders party thereto and the administrative agent thereto.
The 18-Month DDTL Facility and Three-Year DDTL Facility provided us with committed delayed draw term loan facilities in the aggregate principal amount of $6.0 billion and $3.0 billion, respectively. On April 5, 2022, Corebridge Parent issued $6.5 billion of senior unsecured notes consisting of: $1.0 billion aggregate principal amount of its 3.50% Senior Notes due 2025, $1.25 billion aggregate principal amount of its 3.65% Senior Notes due 2027, $1.0 billion aggregate principal amount of its 3.85% Senior Notes due 2029, $1.5 billion aggregate principal amount of its 3.90% Senior Notes due 2032, $500 million aggregate principal amount of its 4.35% Senior Notes due 2042 and $1.25 billion aggregate principal amount of its 4.40% Senior Notes due 2052.
On April 6, 2022, in connection with the issuance of the senior unsecured notes of Corebridge Parent, (i) the commitments under the 18-Month DDTL Facility were terminated in full and (ii) the commitments under the Three-Year DDTL Facility were reduced from $3.0
ITEM 8 | Notes to Consolidated Financial Statements | 15. Debt
billion to $2.5 billion. On August 25, 2022, in connection with the issuance of the hybrid junior subordinated notes, the commitments under the Three-Year DDTL Facility were further reduced from $2.5 billion to $1.5 billion.
On September 15, 2022, Corebridge Parent borrowed an aggregate principal amount of $1.5 billion under the Three-Year DDTL Facility. For the current interest period, the Three-Year DDTL Facility will end on June 21, 2023, unless prior to that date Corebridge Parent elects to continue the loan, or a portion of it, for an additional interest period. For the current interest period, the Three-Year DDTL Facility bears interest at a rate per annum equal to the Adjusted Term SOFR Rate (as defined in the Three-Year DDTL Agreement) plus the Applicable Rate (as defined in the Three-Year DDTL Agreement) of 1.000%, which is based on the then-applicable credit ratings of our senior unsecured long-term indebtedness. The Three-Year DDTL Facility matures on February 25, 2025.
HYBRID JUNIOR SUBORDINATED NOTES
On August 23, 2022, Corebridge Parent issued $1.0 billion of 6.875% fixed-to-fixed reset rate hybrid junior subordinated notes due 2052. Subject to certain redemption provisions and other terms of the hybrid junior subordinated notes, the interest rate and interest payment date reset every five years based on the average of the yields on five-year U.S. Treasury securities, as of the most recent interest rate determination on a reset plus a spread, payable semi-annually.
AFFILIATED NOTES
In November 2021, Corebridge issued an $8.3 billion senior promissory note to AIG. We used the net proceeds from the senior unsecured notes, the net proceeds from the hybrid junior subordinated notes and a portion of the borrowing of the Three-Year DDTL Facility, discussed above, to repay the principal balance and accrued interest of this note to AIG. The interest rate per annum was equal to LIBOR plus 100 basis points and accrued semi-annually in arrears on March 1 and September 1 of each year, beginning on March 1, 2022.
In 2019, AGREIC issued a note to Lexington in the amount of $250 million. Interest expense incurred specific to this note was $0.4 million and $4 million for the years ended December 31, 2021 and 2020, respectively. On February 12, 2021, AGREIC repaid the loan and interest in the amount of $254 million.
On June 23, 2022, AIG Life (United Kingdom) borrowed GBP £10 million from AIG Transaction Execution Limited, which was repaid on July 7, 2022.
In 2013, AIG Property Company Limited issued an affiliated note to AIG Europe S.A. (Netherlands Branch) of $17 million for the purpose of purchasing a building. The carrying amount of the note was $9 million as of December 31, 2020. Interest expense incurred specific to this note was $0.3 million, $0.5 million and $0.6 million for the years ended December 31, 2021, 2020 and 2019, respectively. On October 1, 2021, AIG Property Company Limited repaid the loan and interest of $9 million to AIG Europe S.A.
AIGLH NOTES AND JUNIOR SUBORDINATED DEBENTURES
As of December 31, 2022, AIGLH had outstanding $427 million aggregate principal amount, consisting of $227 million of junior subordinated debt due between 2030 and 2046 and $200 million of notes due between 2025 and 2029. At December 31, 2022 and 2021, the junior subordinated debentures outstanding consisted of $54 million of 8.5% junior subordinated debentures due July 2030, $142 million of 8.125% junior subordinated debentures due March 2046 and $31 million of 7.57% junior subordinated debentures due December 2045, each guaranteed by AIG.
For details regarding guarantees provided by AIG related to these notes and debentures, see Note 16.
DEBT CASH TENDER OFFERS
During the twelve-month period ended December 31, 2021, $216 million of aggregate principal amount of AIGLH notes and AIGLH junior subordinated debentures were repurchased through cash tender offers for an aggregate purchase price of $312 million.
REVOLVING CREDIT AGREEMENT
On May 12, 2022, Corebridge Parent entered into the Revolving Credit Agreement (the “Credit Agreement”).
The Credit Agreement provides for a five-year total commitment of $2.5 billion, consisting of standby letters of credit and/or revolving credit borrowings without any limits on the type of borrowings. Under circumstances described in the Credit Agreement, the aggregate commitments may be increased by up to $500 million, for a total commitment under the Credit Agreement of $3.0 billion. Loans under the Credit Agreement will mature on May 12, 2027. Under the Credit Agreement, the applicable rate, commitment fee and letter of credit fee are determined by reference to the credit ratings of Corebridge Parent’s senior, unsecured, long-term indebtedness. Borrowings bear interest at a rate per annum equal to (i) in the case of U.S. dollar borrowings, Term SOFR plus an applicable credit spread adjustment plus an applicable rate or an alternative base rate plus an applicable rate; (ii) in the case of Sterling borrowings, SONIA plus an applicable credit spread adjustment plus an applicable rate; (iii) in the case of Euro borrowings, European Union interbank Offer Rate plus an applicable rate; and (iv) in the case of Japanese Yen, Tokyo Interbank Offered Rate plus an applicable
ITEM 8 | Notes to Consolidated Financial Statements | 15. Debt
rate. The alternative base rate is equal to the highest of (a) the New York Federal Reserve Bank Rate plus 0.50%, (b) the rate of interest in effect as quoted by The Wall Street Journal as the “Prime Rate” in the United States and (c) Term SOFR plus a credit spread adjustment of 0.100% plus an additional 1.00%.
The Credit Agreement requires Corebridge Parent to maintain a specified minimum consolidated net worth and subjects Corebridge to a specified limit on consolidated total debt to consolidated total capitalization, subject to certain limitations and exceptions. In addition, the Credit Agreement contains certain customary affirmative and negative covenants, including limitations with respect to the incurrence of certain types of liens and certain fundamental changes. Amounts due under the Credit Agreement may be accelerated upon an “event of default,” as defined in the Credit Agreement, such as failure to pay amounts owed thereunder when due, breach of a covenant, material inaccuracy of a representation, or occurrence of bankruptcy or insolvency, subject in some cases to cure periods.
LETTERS OF CREDIT
Effective July 28, 2022, Corebridge Parent replaced AIG as applicant and guarantor on two letters of credit totaling £80 million, for the benefit of AIG Life (United Kingdom). Effective January 1, 2023, Corebridge Parent replaced this letter of credit with a single letter of credit of £80 million. The letter of credit supports AIG Life (United Kingdom)’s capital position and will be counted as Tier 2 capital under EU Solvency II regulations as approved by the Prudential Regulation Authority.
We have an intercompany reinsurance arrangement with AIG Bermuda whereby certain Regulation XXX and Guideline AXXX reserves related to a closed block of in-force business are ceded to AIG Bermuda. AIG Bermuda had a $250 million letter of credit guaranteed by AIG that is used to support the credit for reinsurance provided by AIG Bermuda. Effective May 9, 2022, the letter of credit was reduced from $250 million to $175 million, and effective May 12, 2022, Corebridge Parent has replaced AIG as the guarantor.
AFFILIATED CREDIT FACILITIES
In 2015 and 2018, we entered into three revolving loan facilities with AIG pursuant to which our participating subsidiaries could, on a several basis, borrow monies from AIG subject to the terms and conditions stated therein. Principal amounts borrowed under each of these facilities could be repaid and re-borrowed, in whole or in part, from time to time, without penalty. As of December 31, 2021, there were no amounts owed under these facilities. On September 19, 2022, these credit facilities were terminated.
CONSOLIDATED INVESTMENT ENTITIES CREDIT FACILITIES
We also maintain revolving credit facilities that can be utilized exclusively by certain consolidated investment entities to acquire assets related to securitizations. Draws under those credit facilities cannot be utilized for general corporate purposes. Prior to the pricing of the related securitizations, these credit facilities have combined limits of up to $556 million. Subsequent to pricing of the related securitizations, the combined limits are expected to increase to up to approximately $1.4 billion. As of December 31, 2022 and December 31, 2021, we have drawn $177 million and $57 million, respectively, under the credit facilities. These credit facilities have maturity dates ranging from two years to nine years.
We also maintain revolving credit facilities that can exclusively be utilized by certain consolidated investment entities to acquire real estate assets. Draws under those credit facilities cannot be utilized for general corporate purposes. These credit facilities have consolidated limits of up to $420 million. As of December 31, 2022 and December 31, 2021, we have drawn $326 million and $403 million, respectively, under the credit facilities. Each of these credit facilities have maturity dates of three years.
16. Contingencies, Commitments and Guarantees In the normal course of business, we enter into various contingent liabilities and commitments. Although we cannot currently quantify our ultimate liability for unresolved litigation and investigation matters, including those referred to below, it is possible that such liability could have a material adverse effect on our consolidated financial condition, consolidated results of operations or consolidated cash flows for an individual reporting period.
LEGAL CONTINGENCIES
Overview
In the normal course of business, we are subject to regulatory and government investigations and actions, and litigation and other forms of dispute resolution in a large number of proceedings pending in various domestic and foreign jurisdictions. Certain of these matters involve potentially significant risk of loss due to potential for significant jury awards and settlements, punitive damages or other penalties. Many of these matters are also highly complex and may seek recovery on behalf of a class or similarly large number of plaintiffs. It is therefore inherently difficult to predict the size or scope of potential future losses arising from these matters. In our insurance and reinsurance operations, litigation and arbitration concerning coverage under insurance and reinsurance contracts are generally considered in the establishment of our future policy benefits. Separate and apart from the foregoing matters involving
ITEM 8 | Notes to Consolidated Financial Statements | 16. Contingencies, Commitments and Guarantees
insurance and reinsurance coverage, we and our officers and directors are subject to a variety of additional types of legal proceedings brought by holders of our securities, customers, employees and others, alleging, among other things, breach of contractual or fiduciary duties, bad faith, indemnification and violations of federal and state statutes and regulations. With respect to these other categories of matters not arising out of claims for insurance or reinsurance coverage, we establish reserves for loss contingencies when it is probable that a loss will be incurred, and the amount of the loss can be reasonably estimated. In many instances, we are unable to determine whether a loss is probable or to reasonably estimate the amount of such a loss and, therefore, the potential future losses arising from legal proceedings may exceed the amount of liabilities that we have recorded in our financial statements covering these matters. While such potential future charges could be material, based on information currently known to management, management does not believe, other than as may be discussed below, that any such charges are likely to have a material adverse effect on our financial position or results of operations. We estimate that our range of reasonably possible loss in excess of the aggregate amount we have accrued for probable losses is not material.
Additionally, from time to time, various regulatory and governmental agencies review our transactions and practices in connection with industry-wide and other inquiries or examinations into, among other matters, the business practices of current and former operating subsidiaries. Such investigations, inquiries or examinations could develop into administrative, civil or criminal proceedings or enforcement actions, in which remedies could include fines, penalties, restitution or alterations in our business practices, and could result in additional expenses, limitations on certain business activities and reputational damage.
Yearly Renewable Term Agreements
Certain of our reinsurers have sought rate increases on certain YRT agreements. We are disputing the requested rate increases under these agreements. Certain reinsurers with whom we have disputes have initiated arbitration proceedings against us, and others may initiate them in the future. To the extent reinsurers have sought retroactive premium increases, we have accrued our current estimate of probable loss with respect to these matters.
For additional information, see Note 7.
Moriarty Litigation
Effective January 1, 2013, the California legislature enacted AB 1747 (the “Act”), which amended the Insurance Code to mandate that life insurance policies issued and delivered in California contain a 60-day grace period during which time the policies must remain in force after a premium payment is missed, and that life insurers provide both a 30-day minimum notification of lapse and the right of policy owners to designate a secondary recipient for lapse and termination notices. Following guidance from the California Department of Insurance and certain industry trade groups, American General Life Insurance Company (AGL) interpreted the Act to be prospective in nature, applying only to policies issued and delivered on or after the Act’s January 1, 2013 effective date. On July 18, 2017, AGL was sued in a putative class action captioned Moriarty v. American General Life Insurance Company, No. 17-cv-1709 (S.D. Cal.), challenging AGL’s prospective application of the Act. Plaintiff’s complaint, which is similar to complaints filed against other insurers, argues that policies issued and delivered prior to January 1, 2013, like the $1 million policy issued to Plaintiff’s husband do not lapse—despite nonpayment of premiums—if the insurer has not complied with the Act’s terms. On August 30, 2021, the California Supreme Court issued an opinion in McHugh v. Protective Life Insurance, 12 Cal. 5th 213 (2021), ruling that the Act applies to all policies in force on January 1, 2013, regardless of when the policies were issued. On February 7, 2022, Plaintiff filed motions for summary judgment and class certification; AGL opposed both motions and filed its own motion for partial summary judgment. On July 26, 2022, the District Court granted in part and denied in part AGL’s motion for partial summary judgment, and on September 7, 2022, the District Court denied Plaintiff's motion for summary judgment. In the summary judgment decisions, the District Court declined to adopt Plaintiff's theory that a failure to comply with the Act necessitates payment of policy benefits or to make a pre-trial determination as to AGL’s liability. On September 27, 2022, the District Court denied Plaintiff’s motion for class certification without prejudice. The District Court declined to certify Plaintiff’s proposed class consisting of claims for monetary damages and equitable relief, but indicated that Plaintiff could seek the certification of a narrower class consisting only of claims for monetary damages. The District Court indicated, however, that it has “substantial concerns” as to whether individual issues such as actual damages and causation would predominate, precluding class certification. While the District Court had initially set a trial date for February 7, 2023, it has since vacated that date and indicated that it will set a new trial date in due course, following consultation with the parties. Proceedings are ongoing in other California cases that raise similar industry-wide issues including in the McHugh case on remand from the California Supreme Court, in which the California Court of Appeal rendered an unpublished opinion on October 10, 2022 that also declined to hold that failure to comply with the Act automatically necessitates payment of policy benefits. We have accrued our current estimate of probable loss with respect to this litigation.
LEASE COMMITMENTS
We lease office space and equipment in various locations across jurisdictions in which the Company operates. The majority of the resulting obligation arising from these contracts is generated by our real estate portfolio, which only includes contracts classified as operating leases. As of December 31, 2022, the lease liability and corresponding right of use asset reflected in Other liabilities and Other assets were $43 million and $36 million, respectively, and we made cash payments of $20 million in 2022 in connection with
ITEM 8 | Notes to Consolidated Financial Statements | 16. Contingencies, Commitments and Guarantees
these leases. As of December 31, 2021, the lease liability and corresponding right of use asset reflected in Other liabilities and Other assets were $66 million and $51 million, respectively, and we made cash payments of $23 million in 2021 in connection with these leases. The liability includes non-lease components, such as property taxes and insurance for our gross leases. Some of these leases contain options to renew after a specified period of time at the prevailing market rate; however, renewal options that have not been exercised as of December 31, 2022 are excluded until management attains a reasonable level of certainty. Some leases also include termination options at specified times and term; however, termination options are not reflected in the lease asset and liability balances until they have been exercised.
The weighted average discount rate and lease term assumptions used in determining the liability are 3.6% and 4.71 years, respectively. The primary assumption used to determine the discount rate is the cost of funding for the Company, which is based on the secured borrowing rate for terms similar to the lease term, and for the major financial markets in which Corebridge operates.
Rent expense was $33 million, $21 million and $21 million for the years ended December 31, 2022, 2021 and 2020, respectively.
The following table presents the future undiscounted cash flows under operating leases at December 31, 2022:
| | | | | |
| (in millions) | |
| 2023 | $ | 16 |
| 2024 | 9 |
| 2025 | 7 |
| 2026 | 6 |
| 2027 | 2 |
| Remaining years after 2027 | 6 |
| Total undiscounted lease payments | 46 |
| Less: Present value adjustment | 3 |
| Net lease liabilities | $ | 43 |
OTHER COMMITMENTS
In the normal course of business, we enter into commitments to invest in limited partnerships, private equity funds and hedge funds and to purchase and develop real estate in the United States and abroad. These commitments totaled $4.6 billion at December 31, 2022.
GUARANTEES
Asset Dispositions
We are subject to guarantees and indemnity arrangements in connection with the completed sales of businesses. The various arrangements may be triggered by, among other things, declines in asset values; the occurrence of specified business contingencies; the realization of contingent liabilities; developments in litigation; or breaches of representations, warranties or covenants provided by us. These arrangements are typically subject to various time limitations, defined by the contract or by operation of law, such as statutes of limitations. In some cases, the maximum potential obligation is subject to contractual limitations, while in other cases such limitations are not specified or are not applicable.
We are unable to develop a reasonable estimate of the maximum potential payout under certain of these arrangements. Overall, we believe that it is unlikely we will have to make any material payments related to completed sales under these arrangements, and no material liabilities related to these arrangements have been recorded in the Consolidated Balance Sheets.
Guarantees provided by AIG
Prior to the IPO, AIG provided certain guarantees to us as described below. Pursuant to the Separation Agreement we entered into with AIG dated September 14, 2022 (the “Separation Agreement”), we will indemnify, defend and hold harmless AIG against or from any liability arising from or related to these guarantees.
Certain of our insurance subsidiaries benefit from General Guarantee Agreements under which AHAC or NUFIC has unconditionally and irrevocably guaranteed all present and future obligations arising from certain insurance policies issued by these subsidiaries (a “Guaranteed Policy” or the “Guaranteed Policies”). AHAC and NUFIC are required to perform under the agreements if one of the insurance subsidiaries fails to make payments due under a Guaranteed Policy. These General Guarantee Agreements have all been terminated as to insurance policies issued after the date of termination. AHAC and NUFIC have not been required to perform under any of the agreements but remain contingently liable for all policyholder obligations associated with the Guaranteed Policies. We did not pay any fees under these agreements for the years ended December 31, 2022 or 2021.
AGC is a party to a Capital Maintenance Agreement (“CMA”) with AIG. Among other things, the CMA provides that AIG will maintain the total adjusted capital of AGC at or above a specified minimum percentage of AGC’s projected Company Action Level Risk Based
ITEM 8 | Notes to Consolidated Financial Statements | 16. Contingencies, Commitments and Guarantees
Capital. AIG did not make any capital contributions to AGC under the CMA during the year ended December 31, 2022. As of December 31, 2022 and 2021, the specified minimum capital percentage in the CMA was 250%.
AIG provides a full and unconditional guarantee of all outstanding notes and junior subordinated debentures of AIGLH. This includes:
•a guarantee (the “AIGLH External Debt Guarantee”) in connection with AIGLH junior subordinated debentures and certain AIG notes (the “AIGLH External Debt”); and
•a guarantee in connection with a sale-leaseback transaction in 2020. Pursuant to this transaction, AIGLH issued promissory notes to AGL with maturity dates of up to five years. These promissory notes are guaranteed by AIG for the benefit of AGL. We paid no fees for these guarantees for the years ended December 31, 2022, or 2021.
In addition to the Separation Agreement, we have entered into a guarantee reimbursement agreement with AIG which provides that we will reimburse AIG for the full amount of any payment made by or on behalf of AIG pursuant to the AIGLH External Debt Guarantee. We have also entered into a collateral agreement with AIG which provides that in the event of: (i) a ratings downgrade of Corebridge Parent or AIGLH long-term unsecured indebtedness below specified levels or (ii) the failure by AIGLH to pay principal and interest on the External Debt when due, we must collateralize an amount equal to the sum of: (i) 100% of the principal amount outstanding, (ii) accrued and unpaid interest and (iii) 100% of the net present value of scheduled interest payments through the maturity dates of the AIGLH External Debt.
•For additional discussion on commitments and guarantees associated with VIEs, see Note 9.
•For additional disclosures about derivatives, see Note 10.
•For additional disclosures about debt, see Note 15.
•For additional disclosures about related parties, see Note 23.
17. Equity and Redeemable Noncontrolling Interest COREBRIDGE SHAREHOLDERS’ EQUITY
Retained Earnings
Dividends
| | | | | | | | | | | |
| Declaration Date | Record Date | Payment Date | Dividend Paid Per Common Share |
| | | |
| | | |
| November 8, 2022 | December 16, 2022 | December 30, 2022 | $ | 0.23 | |
| September 30, 2022 | October 10, 2022 | October 20, 2022 | $ | 0.23 | |
For the year ended December 31, 2022, Corebridge paid cash dividends of $876 million.
The following sections summarize certain transactions that occurred prior to and including the Reorganization that affected shareholders’ equity.
As discussed in Note 1, the separate legal entities that made up the company’s business were not historically held by a single legal entity, and Shareholders’ net investment was shown in lieu of Shareholders’ equity in these financial statements prior to December 31, 2021, representing our shareholders’ interest in the recorded assets of the Company and their cumulative investment through December 31, 2021, inclusive of operating results. As part of the internal reorganization, Cap Corp and certain of its subsidiaries were transferred as common control transactions.
Dividends Declared
On February 16, 2023, the Company declared a cash dividend on Corebridge common stock of $0.23 per share, payable on March 31, 2023 to shareholders of record at close of business on March 17, 2023.
Prior to completion of the Reorganization on December 31, 2021, the following significant transactions were recorded in Shareholder’s net investment.
Distributions
For the years ended December 31, 2021, and 2020 Corebridge distributed dividends to AIG in the amount of $13.1 billion and $450 million, respectively.
For the year ended December 31, 2021, Cap Corp returned capital to AIG in the amount of $536 million. There was no return of capital for the year ended December 31, 2020.
ITEM 8 | Notes to Consolidated Financial Statements | 17. Equity and Redeemable Noncontrolling Interest
AIG Bermuda Tax Payment Allocation Agreement
Under an Amended and Restated Tax Payment Allocation Agreement dated June 6, 2011 between AIG and AIG Bermuda, AIG agreed to indemnify AIG Bermuda for any tax liability (including interest and penalties) resulting from adjustments made by the IRS or other appropriate authorities to taxable income, special deductions or credits in connection with investments made by AIG Bermuda in certain affiliated entities. At both December 31, 2022 and 2021, the Company had no remaining indemnification asset. Changes in the indemnification asset were recorded through Shareholders’ Equity. For the years ended December 31, 2021 and 2020, the change in indemnification asset was $353 million and $203 million, respectively, with an equal and offsetting change to unrecognized tax benefits.
Fortitude Re Sale
Following closing of the Majority Interest Fortitude Sale in the second quarter of 2020, AIG contributed $135 million to Corebridge. In 2021, AIG, Inc. contributed its 3.5% ownership interest in Fortitude Group Holdings, LLC to Corebridge. The carrying value of this investment was $156 million and $100 million at December 31, 2022 and 2021, respectively.
Refer to Notes 1 and 7 for additional information regarding the Fortitude Re sale.
AIG Federal Tax Sharing Agreement
Prior to the IPO, Certain Corebridge entities were included in the consolidated federal income tax return of AIG as well as certain state tax returns where AIG files on a consolidated or unitary basis. Under our pre-existing federal tax sharing agreements with AIG related to those filings, we settle our current tax liability as if the Corebridge entities are each a separate standalone taxpayer. Further, AIG credits us to the extent our net operating losses, tax credits and other tax benefits are used in AIG's consolidated tax return and charges us to the extent of our tax liability (calculated on a separate return basis).
Refer to Note 22 for additional information related to the AIG Federal Tax Sharing Agreement.
ITEM 8 | Notes to Consolidated Financial Statements | 17. Equity and Redeemable Noncontrolling Interest
Accumulated Other Comprehensive Income (Loss)
The following table presents a rollforward of Accumulated other comprehensive income (loss):
| | | | | | | | | | | | | | | | | | | | | | | | | | | | | | | | | | | | | | | | | | | | | | | | | | | | |
| (in millions) | | Unrealized Appreciation (Depreciation) of Fixed Maturity Securities on Which allowance for credit losses was Taken | | Unrealized Appreciation (Depreciation) of All Other Investments | | Change in fair value of market risk benefits attributable to changes in our own credit risk | | Change in the discount rates used to measure traditional and limited payment long-duration insurance contracts | | Cash Flow Hedges | | Foreign Currency Translation Adjustments | | Retirement Plan Liabilities Adjustment | | Total | | |
| Balance, December 31, 2019, net of tax | | $ | — | | | $ | 9,361 | | | $ | — | | | $ | — | | | $ | — | | | $ | (40) | | | $ | 8 | | | $ | 9,329 | | | |
| Change in unrealized depreciation of investments | | (89) | | | 8,984 | | | — | | | — | | | — | | | — | | | — | | | 8,895 | | | |
| Change in deferred policy acquisition costs adjustment and other | | 11 | | | (1,194) | | | — | | | — | | | — | | | — | | | — | | | (1,183) | | | |
| | | | | | | | | | | | | | | | | | |
| | | | | | | | | | | | | | | | | | |
| Change in future policy benefits | | — | | | (870) | | | — | | | — | | | — | | | — | | | — | | | (870) | | | |
| | | | | | | | | | | | | | | | | | |
| Change in foreign currency translation adjustments | | — | | | — | | | — | | | — | | | — | | | 61 | | | — | | | 61 | | | |
| Change in net actuarial loss | | — | | | — | | | — | | | — | | | — | | | — | | | (2) | | | (2) | | | |
| | | | | | | | | | | | | | | | | | |
| Change in deferred tax asset (liability) | | 16 | | | (1,583) | | | — | | | — | | | — | | | (4) | | | — | | | (1,571) | | | |
| | | | | | | | | | | | | | | | | | |
| Total other comprehensive income (loss) | | (62) | | | 5,337 | | | — | | | — | | | — | | | 57 | | | (2) | | | 5,330 | | | |
| Less: Noncontrolling interests | | — | | | — | | | — | | | — | | | — | | | 6 | | | — | | | 6 | | | |
| Balance, December 31, 2020, net of tax | | $ | (62) | | | $ | 14,698 | | | $ | — | | | $ | — | | | $ | — | | | $ | 11 | | | $ | 6 | | | $ | 14,653 | | | |
| Cumulative effect of change in accounting principles | | — | | | 3,235 | | | (1,838) | | | (3,746) | | | — | | | — | | | — | | | (2,349) | | | |
| Change in unrealized depreciation of investments | | 39 | | | (7,496) | | | — | | | — | | | — | | | — | | | — | | | (7,457) | | | |
Change in fair value of market risk benefits attributable to changes in our own credit risk | | — | | | — | | | 226 | | | — | | | — | | | — | | | — | | | 226 | | | |
| Change in discount rates assumptions of certain liabilities | | — | | | — | | | — | | | 1,719 | | | — | | | — | | | — | | | 1,719 | | | |
| Change in future policy benefits and other | | — | | | 458 | | | — | | | — | | | — | | | — | | | — | | | 458 | | | |
| | | | | | | | | | | | | | | | | | |
| Change in foreign currency translation adjustments | | — | | | — | | | — | | | — | | | — | | | (22) | | | — | | | (22) | | | |
| Change in net actuarial loss | | — | | | — | | | — | | | — | | | — | | | — | | | 1 | | | 1 | | | |
| | | | | | | | | | | | | | | | | | |
| | | | | | | | | | | | | | | | | | |
| Change in deferred tax asset (liability) | | (8) | | | 1,400 | | | (47) | | | (363) | | | — | | | 2 | | | — | | | 984 | | | |
| | | | | | | | | | | | | | | | | | |
| Total other comprehensive income (loss) | | 31 | | | (5,638) | | | 179 | | | 1,356 | | | — | | | (20) | | | 1 | | | (4,091) | | | |
| Other | | — | | | 20 | | | — | | | — | | | — | | | — | | | — | | | 20 | | | |
| Less: Noncontrolling interests | | — | | | — | | | — | | | — | | | — | | | — | | | — | | | — | | | |
| Balance at December 31, 2021, net of tax* | | $ | (31) | | | $ | 12,315 | | | $ | (1,659) | | | $ | (2,390) | | | $ | — | | | $ | (9) | | | $ | 7 | | | $ | 8,233 | | | |
| Change in unrealized depreciation of investments | | (78) | | | (40,323) | | | — | | | — | | | — | | | — | | | — | | | (40,401) | | | |
| | | | | | | | | | | | | | | | | | |
Change in fair value of market risk benefits attributable to changes in our own credit risk | | — | | | — | | | 1,635 | | | — | | | — | | | — | | | — | | | 1,635 | | | |
| Change in discount rates assumptions of certain liabilities | | — | | | — | | | — | | | 6,746 | | | — | | | — | | | — | | | 6,746 | | | |
| Change in future policy benefits and other | | — | | | 1,822 | | | — | | | — | | | — | | | — | | | — | | | 1,822 | | | |
| Change in cash flow hedges | | — | | | — | | | — | | | — | | | 203 | | | — | | | — | | | 203 | | | |
| Change in foreign currency translation adjustments | | — | | | — | | | — | | | — | | | — | | | (109) | | | — | | | (109) | | | |
| Change in net actuarial loss | | — | | | — | | | — | | | — | | | — | | | — | | | 2 | | | 2 | | | |
| | | | | | | | | | | | | | | | | | |
| Change in deferred tax asset (liability) | | 17 | | | 6,806 | | | (341) | | | (1,448) | | | (46) | | | 8 | | | — | | | 4,996 | | | |
| | | | | | | | | | | | | | | | | | |
| Total other comprehensive income (loss) | | (61) | | | (31,695) | | | 1,294 | | | 5,298 | | | 157 | | | (101) | | | 2 | | | (25,106) | | | |
| Less: Noncontrolling interests | | — | | | — | | | — | | | — | | | — | | | (10) | | | — | | | (10) | | | |
| Balance, December 31, 2022, net of tax | | $ | (92) | | | $ | (19,380) | | | $ | (365) | | | $ | 2,908 | | | $ | 157 | | | $ | (100) | | | $ | 9 | | | $ | (16,863) | | | |
* For additional disclosures related to the impact of the Targeted improvements to the Accounting for Long-Duration Contracts refer to Note 2.
ITEM 8 | Notes to Consolidated Financial Statements | 17. Equity and Redeemable Noncontrolling Interest
The following table presents the other comprehensive income (loss) reclassification adjustments for the years ended December 31, 2022, 2021, and 2020 respectively:
| | | | | | | | | | | | | | | | | | | | | | | | | | | | | | | | | | | | | | | | | | | | | | | | | | |
| (in millions) | | Unrealized Appreciation (Depreciation) of Fixed Maturity Securities on Which Allowance
for Credit Losses
Was Taken | | Unrealized Appreciation (Depreciation) of All Other Investments | | Change in fair value of market risk benefits in liability position attributable to changes in our own credit risk | | Effect of changes in the discount rates used to measure traditional and limited-payment long duration insurance contracts | | Cash Flow Hedges | | Foreign Currency Translation Adjustments | | Retirement Plan Liabilities Adjustment | | Total |
| | | | | | | | | | | | | | | | |
| | | | | | | | | | | | | | | | |
| | | | | | | | | | | | | | | | |
| | | | | | | | | | | | | | | | |
| | | | | | | | | | | | | | | | |
| | | | | | | | | | | | | | | | |
| | | | | | | | | | | | | | | | |
| | | | | | | | | | | | | | | | |
| | | | | | | | | | | | | | | | |
| | | | | | | | | | | | | | | | |
| | | | | | | | | | | | | | | | |
| | | | | | | | | | | | | | | | |
| Year Ended December 31, 2022 | | | | | | | | | | | | | | | | |
| Unrealized change arising during year | | $ | (89) | | | $ | (39,049) | | | $ | 1,635 | | | $ | 6,746 | | | $ | 203 | | | $ | (109) | | | $ | 2 | | | $ | (30,661) | |
| Less: Reclassification adjustments included in net income | | (11) | | | (548) | | | — | | | — | | | — | | | — | | | — | | | (559) | |
Total other comprehensive income (loss),
before income tax expense (benefit) | | (78) | | | (38,501) | | | 1,635 | | | 6,746 | | | 203 | | | (109) | | | 2 | | | (30,102) | |
| Less: Income tax expense (benefit) | | (17) | | | (6,806) | | | 341 | | | 1,448 | | | 46 | | | (8) | | | — | | | (4,996) | |
Total other comprehensive income (loss),
net of income tax expense (benefit) | | $ | (61) | | | $ | (31,695) | | | $ | 1,294 | | | $ | 5,298 | | | $ | 157 | | | $ | (101) | | | $ | 2 | | | $ | (25,106) | |
| Year Ended December 31, 2021 | | | | | | | | | | | | | | | | |
| Unrealized change arising during year | | $ | 39 | | | $ | (6,290) | | | $ | 226 | | | $ | 1,719 | | | $ | — | | | $ | (21) | | | $ | 1 | | | $ | (4,326) | |
| Less: Reclassification adjustments included in net income | | — | | | 748 | | | — | | | — | | | — | | | — | | | — | | | 748 | |
Total other comprehensive income (loss),
before income tax expense (benefit) | | 39 | | | (7,038) | | | 226 | | | 1,719 | | | — | | | (21) | | | 1 | | | (5,074) | |
| Less: Income tax expense (benefit) | | 8 | | | (1,400) | | | 47 | | | 363 | | | — | | | (1) | | | — | | | (983) | |
Total other comprehensive income (loss),
net of income tax expense (benefit) | | $ | 31 | | | $ | (5,638) | | | $ | 179 | | | $ | 1,356 | | | $ | — | | | $ | (20) | | | $ | 1 | | | $ | (4,091) | |
| Year Ended December 31, 2020 | | | | | | | | | | | | | | | | |
| Unrealized change arising during year | | $ | (107) | | | $ | 7,558 | | | $ | — | | | $ | — | | | $ | — | | | $ | 60 | | | $ | (2) | | | $ | 7,509 | |
| Less: Reclassification adjustments included in net income | | (29) | | | 636 | | | — | | | — | | | — | | | — | | | — | | | 607 | |
Total other comprehensive income (loss),
before income tax expense (benefit) | | (78) | | | 6,922 | | | — | | | — | | | — | | | 60 | | | (2) | | | 6,902 | |
| Less: Income tax expense (benefit) | | (16) | | | 1,585 | | | — | | | — | | | — | | | 3 | | | — | | | 1,572 | |
Total other comprehensive income (loss),
net of income tax expense (benefit) | | $ | (62) | | | $ | 5,337 | | | $ | — | | | $ | — | | | $ | — | | | $ | 57 | | | $ | (2) | | | $ | 5,330 | |
| | | | | | | | | | | | | | | | |
| | | | | | | | | | | | | | | | |
| | | | | | | | | | | | | | | | |
ITEM 8 | Notes to Consolidated Financial Statements | 17. Equity and Redeemable Noncontrolling Interest
The following table presents the effect of the reclassification of significant items out of Accumulated other comprehensive income on the respective line items in the Consolidated Statements of Income:
| | | | | | | | | | | | | | | | | | | | | | | | | | | | | | |
| | | | | | Amount Reclassified from AOCI | | Affected Line Item in the Consolidated Statements of Income (Loss) |
| | | | Years Ended December 31, | |
| (in millions) | | | | | | 2022 | | 2021 | | 2020 | |
| Unrealized appreciation (depreciation) of fixed maturity securities on which allowance for credit losses was taken | | | | | | | | | | | | |
| Investments | | | | | | $ | (11) | | $ | — | | | $ | (29) | | | Net realized gains (losses) |
| Total | | | | | | (11) | | — | | | (29) | | | |
| Unrealized appreciation (depreciation) of all other investments | | | | | | | | | | | | |
| Investments | | | | | | (548) | | 748 | | 636 | | Net realized gains (losses) |
| Total | | | | | | (548) | | 748 | | 636 | | |
| | | | | | | | | | | | |
| | | | | | | | | | | | |
| | | | | | | | | | | | |
| | | | | | | | | | | | |
| Total reclassifications for the period | | | | | | $ | (559) | | $ | 748 | | $ | 607 | | |
* The following items are not reclassified out of AOCI and included in the Consolidated Statements of Income (Loss) and thus have been excluded from the table:(a) Change in fair value of MRBs attributable to changes in our own credit risk (b) Change in the discount rates used to measure traditional and limited-payment long-duration insurance contracts and (c) Fair value of liabilities under fair value option attributable to changes in own credit Risk
NON-REDEEMABLE NONCONTROLLING INTEREST
The activity in non-redeemable noncontrolling interest primarily relates to activities with consolidated investment entities.
The changes in non-redeemable noncontrolling interest due to divestitures and acquisitions primarily relate to the formation and funding of new consolidated investment entities. The majority of the funding for these consolidated investment entities comes from affiliated companies of Corebridge.
The changes in non-redeemable noncontrolling interest due to contributions from noncontrolling interests primarily relate to the additional capital calls related to consolidated investment entities.
The changes in non-redeemable noncontrolling interest due to distributions to noncontrolling interests primarily relate to dividends or other distributions related to consolidated investment entities.
| | | | | | | | | | | | | | | | | | | | | | | | |
| | | | | Non-Redeemable Noncontrolling Interest |
| | | | Years Ended December 31, |
| (in millions) | | | | | | 2022 | | 2021 | | 2020 |
| Beginning balance | | | | | | $ | 1,759 | | $ | 2,549 | | $ | 1,874 |
| Net income attributable to redeemable noncontrolling interest | | | | | | 320 | | 929 | | 224 |
| Other comprehensive loss, net of tax | | | | | | (10) | | — | | 6 |
| Changes in noncontrolling interests due to divestitures and acquisitions | | | | | | (104) | | (373) | | 633 |
| Contributions from noncontrolling interests | | | | | | 155 | | 264 | | 268 |
| Distributions to noncontrolling interests | | | | | | (1,181) | | (1,611) | | (454) |
| Other | | | | | | — | | 1 | | (2) |
| Ending balance | | | | | | $ | 939 | | $ | 1,759 | | $ | 2,549 |
Refer to Note 9 for additional information related to Variable Interest Entities.
REDEEMABLE NONCONTROLLING INTEREST
The Company has launched certain investment funds which non-consolidated Corebridge affiliates participate in. Certain of these funds are redeemable at the option of the holder and thus are accounted for as mezzanine equity.
The following table presents a rollforward of redeemable noncontrolling interest:
| | | | | | | | | | | | | | | | | | | | | | | | |
| | | | | Redeemable Noncontrolling Interest |
| | | | Years Ended December 31, |
| (in millions) | | | | | | 2022 | | 2021 | | 2020 |
| Beginning balance | | | | | | $ | 83 | | $ | 51 | | $ | — |
| Distributions to noncontrolling interests | | | | | | (83) | | — | | — |
| Contributions from noncontrolling interests | | | | | | — | | 32 | | 50 |
| Net income attributable to redeemable noncontrolling interest | | | | | | — | | — | | 1 |
| Ending balance | | | | | | $ | — | | $ | 83 | | $ | 51 |
ITEM 8 | Notes to Consolidated Financial Statements | 18. Earnings Per Common Share
18. Earnings Per Common Share
The basic earnings per common share (“EPS”) computation is based on the weighted average number of common shares outstanding, adjusted to reflect all stock splits. The diluted EPS computation is based on those shares used in the basic EPS computation plus common shares that would have been outstanding assuming issuance of common shares for all dilutive potential common shares outstanding and adjusted to reflect all stock splits, using the treasury stock method.
On September 6, 2022, Corebridge Parent effectuated a stock split and recapitalization of its 100,000 shares of common stock, of which 90,100 shares were Class A Common Stock and 9,900 shares were Class B Common Stock. Subsequent to September 6, 2022, there is a single class of Common Stock. Accordingly, the two-class method for allocating net income will no longer be applicable. Corebridge Parent split its 100,000 shares of Class A shares and Class B shares in a 6,450 to 1 stock split for a total of 645,000,000 shares of a single class of Common Stock.
The results of the stock split have been applied retroactively to the weighted average common shares outstanding for all periods prior to September 6, 2022. After closing the sale of a 9.9% equity stake in Corebridge to Blackstone on November 2, 2021, Blackstone owned 63,855,000 shares of Class B Common Stock. Prior to the sale of the Class B shares to Blackstone on November 2, 2021, Class B shares did not exist. The Class B Common Stock was pari passu to the Class A Common Stock except for distributions associated with the sale of the affordable housing portfolio.
Prior to September 6, 2022, we used the two-class method for allocating net income to each class of our common stock. Prior to November 1, 2021, the EPS calculation allocates all net income ratably to Class A and Class B shares. After November 2, 2021, income was allocated ratably to the Class A and B shares, except for distributions associated with the sale of the affordable housing portfolio in 2021 in which the Class B shareholder did not participate.
The following table presents the computation of basic and diluted EPS for the years ended December 31, 2022, 2021 and 2020:
| | | | | | | | | | | | | | | | | | | | | | |
| | | Years Ended December 31, | |
| (in millions, except per common share data) | | | | | 2022 | | 2021 | | 2020 | |
| Numerator for EPS: | | | | | | | | | | |
| Net income (loss) | | | | | $ | 8,479 | | | N/A | | N/A | |
| Less: Net income (loss) attributable to noncontrolling interests | | | | | 320 | | | N/A | | N/A | |
| Net income (loss) attributable to Corebridge common shareholders | | | | | $ | 8,159 | | | N/A | | N/A | |
| Net income attributable to Class A shareholders | | | | | N/A | | $ | 7,658 | | | $ | 578 | | |
| Net income attributable to Class B shareholders | | | | | N/A | | $ | 584 | | | $ | 64 | | |
| | | | | | | | | | |
Denominator for EPS(a): | | | | | | | | | | |
| Weighted average common shares outstanding - basic | | | | | 646.1 | | | N/A | | N/A | |
Dilutive common shares(b) | | | | | 1.3 | | | N/A | | N/A | |
| Weighted average common shares outstanding - diluted | | | | | 647.4 | | | N/A | | N/A | |
| Common stock Class A - basic and diluted | | | | | N/A | | 581.1 | | 581.1 | |
| Common stock Class B - basic and diluted | | | | | N/A | | 63.9 | | 63.9 | |
| | | | | | | | | | |
Income per common share attributable to Corebridge common shareholders(a) | | | | | | | | | | |
| Basic: | | | | | | | | | | |
| Common stock | | | | | $ | 12.63 | | | N/A | | N/A | |
| Common stock Class A | | | | | N/A | | $ | 13.18 | | | $ | 1.00 | | |
| Common stock Class B | | | | | N/A | | $ | 9.14 | | | $ | 1.00 | | |
| Diluted: | | | | | | | | | | |
| Common stock | | | | | $ | 12.60 | | | N/A | | N/A | |
| Common stock Class A | | | | | N/A | | $ | 13.18 | | | $ | 1.00 | | |
| Common stock Class B | | | | | N/A | | $ | 9.14 | | | $ | 1.00 | | |
(a) The results of the September 6, 2022 stock split have been applied retroactively for all periods prior to September 6, 2022.
(b) Potential dilutive common shares include our share-based employee compensation plans. The number of common shares excluded from dilutive shares outstanding was approximately 41 thousand for the year ended December 31, 2022 because the effect of including those common shares in the calculation would have been anti-dilutive. There were no anti-dilutive instruments for the years ended December 31, 2021 and 2020.
ITEM 8 | Notes to Consolidated Financial Statements | 19. Statutory Financial Data and Restrictions
19. Statutory Financial Data and Restrictions The following table presents statutory net income (loss) and capital and surplus for our insurance operations companies in accordance with statutory accounting practices:
| | | | | | | | | | | | | | | | | |
| (in millions) | 2022 | | 2021 | | 2020 |
| Years Ended December 31, | | | | | |
Statutory net income (loss)*: | | | | | |
| Insurance Operations companies: | | | | | |
| Domestic | $ | 3,091 | | | $ | 2,588 | | $ | 482 |
| Foreign | 4 | | | (4) | | 6 |
| Total Insurance Operations companies | $ | 3,095 | | | $ | 2,584 | | $ | 488 |
| December 31, | | | | | |
Statutory capital and surplus*: | | | | | |
| Insurance Operations companies: | | | | | |
| Domestic | $ | 12,229 | | | $ | 12,471 | | |
| Foreign | 476 | | | 612 | | |
| Total Insurance Operations companies | $ | 12,705 | | | $ | 13,083 | | |
| Aggregate minimum required statutory capital and surplus: | | | | | |
| Insurance Operations companies: | | | | | |
| Domestic | $ | 4,057 | | | $ | 3,903 | | |
| Foreign | 189 | | | 208 | | |
| Total Insurance Operations companies | $ | 4,246 | | | $ | 4,111 | | |
* The 2022 amounts reflect our best estimate of the statutory net income, capital and surplus as of the dates these financial statements were issued.
Our insurance subsidiaries file financial statements prepared in accordance with statutory accounting practices prescribed or permitted by domestic and foreign insurance regulatory authorities. The principal differences between statutory financial statements and financial statements prepared in accordance with U.S. GAAP for domestic companies are that statutory financial statements do not reflect DAC, most bond portfolios may be carried at amortized cost, investment impairments are determined in accordance with statutory accounting practices, assets and liabilities are presented net of reinsurance, policyholder liabilities are generally valued using more conservative assumptions and certain assets are non-admitted.
For domestic insurance subsidiaries, aggregate minimum required statutory capital and surplus is based on the greater of the RBC ratio level that would trigger regulatory action or minimum requirements per state insurance regulation. Capital and surplus requirements of our foreign subsidiaries differ from those prescribed in the United States and can vary significantly by jurisdiction. At both December 31, 2022 and 2021, all domestic and foreign insurance subsidiaries individually exceeded the minimum required statutory capital and surplus requirements and all domestic insurance subsidiaries individually exceeded RBC ratio minimum required levels.
For foreign insurance companies, financial statements are prepared in accordance with local regulatory requirements. These accounting practices differ from U.S. GAAP primarily by different rules on deferral of policy acquisition costs, amortization of deferred acquisition costs, and establishing future policy benefit liabilities using different actuarial assumptions, as well as valuing for deferred taxes on a different basis.
Regulation XXX requires U.S. life insurers to establish additional statutory reserves for term life insurance policies with long-term premium guarantees and universal life policies with secondary guarantees (“ULSGs”). In addition, Guideline AXXX clarifies the application of Regulation XXX as to these guarantees, including certain ULSGs.
Domestic life insurance subsidiaries manage the capital impact of statutory reserve requirements under Regulation XXX and Guideline AXXX through unaffiliated and affiliated reinsurance transactions. The domestic affiliated life insurer providing reinsurance capacity for such transactions is a fully licensed insurance company and is not formed under captive insurance laws.
We have an intercompany reinsurance arrangement with AIG Bermuda whereby certain Regulation XXX and Guideline AXXX reserves related to a closed block of in-force business are ceded to AIG Bermuda. AIG Bermuda had a $250 million letter of credit guaranteed by AIG that is used to support the credit for reinsurance provided by AIG Bermuda. Effective May 9, 2022, the letter of credit was reduced from $250 million to $175 million, and effective May 12, 2022, Corebridge Parent has replaced AIG as the guarantor.
ITEM 8 | Notes to Consolidated Financial Statements | 19. Statutory Financial Data and Restrictions
STATUTORY PERMITTED ACCOUNTING PRACTICE
At December 31, 2022 and 2021, AGL used the following permitted practice that resulted in reported statutory surplus or risk-based capital that is significantly different from the statutory surplus or risk based capital that would have been reported had NAIC statutory accounting practices or the prescribed regulatory accounting practices of their respective state regulator been followed in all respects:
•Effective December 31, 2019 and periods through September 30, 2020, AGL, a life insurance subsidiary domiciled in Texas, implemented a permitted statutory accounting practice to recognize an admitted asset related to the notional value of coverage defined in an excess of loss reinsurance agreement. This reinsurance agreement has a 20-year term and provides coverage to AGL for aggregate claims incurred during the agreement term associated with guaranteed living benefits on certain fixed index annuities generally issued prior to April 2019 (“Block 1”) exceeding an attachment point as defined in the agreement.
•Effective October 1, 2020 and periods through September 30, 2023, this permitted practice was expanded to similarly recognize an additional admitted asset related to the net notional value of coverage as defined in a separate excess of loss reinsurance agreement. This additional reinsurance agreement has a 25-year term and provides coverage to the subsidiary for aggregate excess of loss claims associated with guaranteed living benefits on a block of fixed index annuities generally issued in April 2019 or later, including new business issued after the effective date (“Block 2”).
•Effective December 31, 2020, this expanded permitted practice also extended the term of the permitted practice for Block 1 from September 30, 2020 to September 30, 2023. The reinsurance agreement covering contracts in Block 1 was also amended to conform certain provisions with the Block 2 reinsurance agreement. Additionally, effective December 31, 2022, the reinsurance agreement for Block 2 was amended to update certain definitions contained in the agreement related to new business.
•Effective October 1, 2022 and periods through September 30, 2023, this permitted practice was expanded to similarly recognize an additional admitted asset related to the net notional value of coverage as defined in a separate excess of loss reinsurance agreement. This additional reinsurance agreement has a 25-year term and provides coverage to the subsidiary for aggregate excess of loss claims associated with the base contract along with the guaranteed living benefits rider on a block of fixed annuities inforce on the treaty effective date, including new business issued after the effective date (“Block 3”).
The permitted practice allows AGL to manage its reserves in a manner more in line with anticipated principle-based reserving requirements once they have been developed. This permitted practice resulted in an increase in the statutory surplus of AGL of approximately $1.0 billion and $584 million at December 31, 2022 and 2021, respectively. AGL may seek continuation of the permitted practice beyond September 30, 2023, subject to the approval of its domiciliary regulator.
SUBSIDIARY DIVIDEND RESTRICTIONS
Payments of dividends to us by our insurance subsidiaries are subject to certain restrictions imposed by laws and regulations of their respective domiciliary jurisdictions.
With respect to our domestic insurance subsidiaries, the payment of any dividend requires formal notice to the insurance department in which the particular insurance subsidiary is domiciled. Additionally, prior approval from such insurance regulator is required when the amount of the dividend is above certain regulatory thresholds.
For example, under the insurance law of the State of Texas, where two of our four domestic insurance subsidiaries are incorporated, our Texas-domiciled insurance companies (AGL and VALIC) are each permitted, without prior insurance regulatory approval, to pay a dividend to its shareholder as long as the amount of the dividend when aggregated with all other dividends made in the preceding 12 months does not exceed the greater of: (i) 10% of its policyholder surplus as of the end of the immediately preceding calendar year; or (ii) its net gain from operations for the immediately preceding calendar year (excluding realized gains), not including pro rata distributions of such insurance company’s own securities. AGL and VALIC, as the case may be, will be permitted to pay a dividend to its shareholder in excess of the greater of such two amounts (i.e., an extraordinary dividend) only if it files notice of the declaration of such an extraordinary dividend and the amount thereof with the Texas Commissioner of Insurance and the Texas Commissioner either approves the distribution of the extraordinary dividend or does not disapprove the distribution within 30 days of its filing. In addition, any dividend that exceeds earned surplus (generally defined as “unassigned funds (surplus)”) calculated as of the most recent financial information available requires insurance regulatory approval. Under the Texas insurance law, the Texas Commissioner has broad discretion in determining whether the financial condition of a stock life insurance company would support the payment of such dividends to its shareholder(s). Substantially similar provisions exist under Missouri law governing payment of dividends by our Missouri-domiciled insurance holding company (AGC Life), and more restrictive provisions exist under New York insurance laws governing payment of dividends by our New York-domiciled insurance company (USL). As our operating insurance subsidiaries (AGL, VALIC and USL) are wholly owned by AGC Life, all dividends from these subsidiaries must be distributed through AGC Life to us and are, thus, subject to notice and/or prior approval or non-disapproval of the Missouri Department of Insurance.
Based on the foregoing, the maximum amount that would qualify as an ordinary dividend, which would consequently be free from restriction and available for payment of dividends to AGC Life (as immediate parent company), by AGL, VALIC and USL in 2023, based upon financial information as of December 31, 2022, is estimated to be $2.0 billion. Specific to AGC Life, the maximum amount
ITEM 8 | Notes to Consolidated Financial Statements | 19. Statutory Financial Data and Restrictions
that would qualify as an ordinary dividend, which would consequently be free from restriction and available for payment of dividends to Corebridge in 2023, based upon financial information as of December 31, 2022 is estimated to be $3.5 billion, subject to availability of earned surplus as required under Missouri insurance law. The estimated ordinary dividend capacities of our insurance companies in Texas and Missouri are further limited by the fact that dividend tests under Texas and Missouri insurance laws are based on dividends previously paid over rolling twelve-month periods. Consequently, depending on the actual payment dates during 2023, some or all of the dividends estimated to be ordinary in 2023 may require regulatory approval or non-disapproval.
Similar to our domestic insurance companies, our international insurance subsidiaries’ ability to pay dividends to us is also subject to regulatory requirements imposed by the jurisdictions in which they are domiciled. These requirements include, for example, prior notification of intent to pay a dividend, satisfying certain earnings, reserve or solvency thresholds in order to pay a dividend, and obtaining regulatory approval for payment of any dividend in excess of stated limits.
To our knowledge, no Corebridge insurance company is currently on any regulatory or similar “watch list” with regard to solvency.
COREBRIDGE DIVIDEND RESTRICTIONS
At December 31, 2022, Corebridge’s ability to pay dividends is not subject to any significant contractual restrictions but remains subject to customary regulatory restrictions.
20. Share-Based Compensation Plans
AIG Equity Awards
Prior to the IPO, certain of our employees received grants of equity awards under the AIG Long Term Incentive Plan (as amended) and its predecessor plan, the AIG 2013 Long Term Incentive Plan (each as applicable, the “LTIP”), which are governed by the AIG 2013 Omnibus Incentive Plan (“Omnibus Plan”). The value of AIG equity awards are linked to the performance of AIG’s common stock. AIG granted equity awards to our employees primarily in the form of AIG restricted stock units (“RSUs”) but also granted AIG performance share units (“PSUs”) and AIG stock options to certain executives.
AIG RSUs and AIG stock options granted to our employees by AIG will be earned based solely on continued service by the participant while AIG PSUs will be earned based on both continued service and AIG achieving specified performance goals at the end of a three-year performance period. These performance goals were pre-established by AIG’s Compensation and Management Resources Committee (“CMRC”) for each annual grant. The actual number of PSUs earned can vary from zero to 200% of the amount granted. Vesting occurs on January 1 of the year immediately following the end of the three-year performance period.
Prior to 2021, LTI awards accrued dividend equivalent units (“DEUs”) in the form of additional PSUs and/or RSUs whenever a cash dividend is declared on shares of AIG Common Stock; the DEUs were subject to the same vesting terms and conditions as the underlying unit. Beginning in 2021, PSUs and RSUs granted via the annual 2021 LTI award (as of the date of grant), and those existing from the 2020 LTI awards (as of the third quarter) accrue dividend equivalent rights (DERs) as AIG’s dividends are declared. These DERs will be settled in cash only if the underlying units’ vesting conditions are met; previously accrued DEUs were not impacted by this change.
The fair value of AIG RSUs and AIG PSUs that are earned solely based on certain AIG-specific metrics was based on the closing price of AIG Common Stock on the grant date; while the fair value of AIG PSUs that are earned based on AIG’s relative total shareholder return (“TSR”) was determined on the grant date using a Monte Carlo simulation. The fair value of AIG stock options was estimated on the grant date using the Black-Scholes model.
Corebridge Equity Awards
On September 6, 2022, Corebridge Parent adopted the Corebridge Financial, Inc. 2022 Omnibus Incentive Plan (the “2022 Plan”) and the Corebridge Financial, Inc. Long-term Incentive Plan (the “LTIP,” together with the 2022 Plan, the “Corebridge Plans”). Following the IPO, equity awards may be granted under the Corebridge Plans to current employees or directors of the Company or, solely with respect to their final year of service, former employees.
Equity awards under the Corebridge Plans are linked to Corebridge Parent’s common stock (“CRBG Stock”). A total of 40,000,000 shares of CRBG Stock are authorized for delivery pursuant to awards granted or assumed under the Plans. Delivered shares may be newly-issued shares or shares held in treasury.
RSU Conversion
All AIG RSUs that were held by our active employees on September 14, 2022 (the pricing date for the IPO) were converted into RSUs linked to the performance of CRBG Stock (“Corebridge RSUs”), on terms and conditions that are substantially the same as the corresponding AIG RSUs, with the number of AIG RSUs adjusted in a manner intended to preserve their intrinsic value as of immediately before and immediately following the conversion (subject to rounding). Specifically, the AIG RSUs were converted to
ITEM 8 | Notes to Consolidated Financial Statements | 20. Share-Based Compensation Plans
Corebridge RSUs based on a conversion factor of 2.580952. The conversion factor was determined by the AIG closing stock price on September 14 ($54.20) divided by the public offering price for CRBG Stock in the IPO ($21.00).
The following table presents our total direct share-based compensation expense which is settled as part of our quarterly intercompany process. This table reflects both AIG equity awards and Corebridge RSUs:
| | | | | | | | | | | |
| Years Ended December 31, | | | |
| (in millions) | 2022 | 2021 | 2020 |
| Share-based compensation expense - pre-tax | $ | 75 | | $ | 88 | | $ | 74 | |
| Share-based compensation expense - after tax | 59 | | 70 | | 58 | |
The following table presents the Corebridge RSUs that were converted from AIG RSUs on September 14, 2022:
| | | | | | | | | | | |
| As of or for the Year Ended December 31, | 2022 |
| Number of Units | | Weighted Average
Grant Date Fair Value |
| Unvested, beginning of year | $ | — | | | $ | — | |
| Granted | 10,328,220 | | | 21.00 | |
| Vested | (3,674,973) | | | 21.00 | |
| Forfeited | (116,092) | | | 21.00 | |
| Unvested, end of year | $ | 6,537,155 | | | $ | 21.00 | |
At December 31, 2022, the total unrecognized compensation cost for outstanding RSUs was $40 million and the weighted-average and expected period of years over which that cost is expected to be recognized are 1.0 year and 2.25 years, respectively.
21. Employee Benefits
PENSION PLANS
Certain employees and retirees participate in U.S. defined benefit pension plans sponsored by AIG that include participants from other affiliates of AIG (the “Pension Plans”). These plans are closed to new participants and current participants no longer earn benefits (i.e., the plans are frozen). As sponsor of these plans, AIG is ultimately responsible for maintenance of these plans in compliance with applicable laws.
Following the IPO, we have ceased to be a participating affiliate in, and do not have any liability with respect to, the Pension Plans. Prior to the IPO, we accounted for the Pension Plans as multiemployer benefit plans. Accordingly, we did not record an asset or liability to recognize the funded status of the Pension Plans. We recognized a liability only for any required contributions to the Pension Plans that were accrued and unpaid at the balance sheet date. The Company’s allocated share of AIG’s net pension credits recorded in the Consolidated Statements of Income (Loss) was $27 million, $52 million and $31 million for the years ended December 31, 2022, 2021 and 2020, respectively.
In addition, certain employees in Ireland participate in a defined benefit pension plan sponsored by the Company (the “Irish Plan”), registered with the Irish Pensions Board under the Pensions Act of 1990 in Ireland. The Irish Plan does not include participants from other affiliates of AIG and was closed to new participants after December 2005, and to future service accrual for active members after July 2017. Members with benefits under the Irish Plan are not required to contribute to it. The obligations and related net periodic benefit expense associated with the Irish Plan is included in the Consolidated Financial Statements. The projected benefit obligation recorded in the Consolidated Balance Sheets was $15 million and $25 million as of December 31, 2022 and 2021, respectively. The fair value of plan assets recorded in the Consolidated Balance Sheets was $22 million and $28 million as of December 31, 2022 and 2021, respectively.
POSTRETIREMENT PLANS
Prior to August 22, 2022, AIG provided postemployment medical and life benefits for certain retired employees (the “Benefits”). The Company’s share of other postretirement benefit expense recorded in the Consolidated Statements of Income (Loss) was $1 million, $3 million and $3 million for the years ended December 31, 2022, 2021 and 2020 respectively.
Since August 22, 2022, the Benefits are provided by Corebridge Parent with certain limited exceptions. The related projected benefit obligation recorded in the Consolidated Balance Sheet was $37 million as of December 31, 2022.
ITEM 8 | Notes to Consolidated Financial Statements | 21. Employee Benefits
The Benefits are based upon the employee attaining the age of 55 and having a minimum of ten years of service, which was reduced to 5 years in 2019 for medical coverage only. Eligible employees who have medical coverage can enroll in retiree medical upon termination of employment. Medical benefits are contributory, while the life insurance benefits, which are closed to new employees, are generally non-contributory. Retiree medical contributions vary from none for pre-1989 retirees to actual premium payments reduced by certain subsidies for post-1992 retirees. These retiree contributions are subject to annual adjustments. Other cost sharing features of the medical plan include deductibles, coinsurance, Medicare coordination, and an employer subsidy for grandfathered employees only.
DEFINED CONTRIBUTION PLANS
Prior to August 22, 2022, employees participated in AIG’s qualified defined contribution plan that provided for contributions by employees, as well as an employer contribution. On August 22, 2022, participants’ accounts in the AIG plan were transferred to the Corebridge Financial Inc. Retirement Savings 401(k) Plan. The Company’s contributions relating to these plans were $76 million, $74 million and $72 million for the years ended December 31, 2022, 2021 and 2020, respectively.
In addition, the Company sponsors defined contribution plans for certain non-U.S. employees which also provide for contributions by employees, as well as an employer contribution. The Company’s contributions relating to these plans were $8 million, $8 million and $7 million for the years ended December 31, 2022, 2021 and 2020, respectively.
BASIS OF PRESENTATION
Prior to the IPO, Corebridge parent and certain U.S. subsidiaries were included in the consolidated federal income tax return of AIG as well as certain state tax returns where AIG files on a combined or unitary basis. Our provision for income taxes is calculated on a separate return basis. Following the IPO, AIG owns a less than 80% interest in Corebridge, resulting in tax deconsolidation of Corebridge from the AIG Consolidated Tax Group and in a small minority of state jurisdictions which follow federal consolidation rules, the most significant being Florida. In addition, under applicable tax law, AGC and its directly owned life insurance subsidiaries (the “AGC Group”) will not be permitted to join in the filing of a U.S. consolidated federal income tax return with our other subsidiaries (collectively, the “Non-Life Group”) for the five-year waiting period. Instead, the AGC Group is expected to file separately as members of the AGC consolidated U.S. federal income tax return during the five-year waiting period. Following the five-year waiting period, the AGC Group is expected to join the U.S. consolidated federal income tax return with the Non-Life Group.
As discussed in Note 1, Cap Corp and certain of its subsidiaries were not transferred to Corebridge parent as part of the internal reorganization executed during the fourth quarter of 2021 and have therefore been adjusted through Shareholders’ equity in the Company’s Consolidated Financial Statements. This adjustment includes historical reserves for uncertain tax positions and deferred tax assets related to the tax attribute carryforwards of Cap Corp and certain of its affiliates which were part of the prior period balance sheet.
Under our pre-existing federal tax sharing agreements with AIG, we settle our current tax liability as if the Corebridge entities are each a separate stand-alone taxpayer. Further, AIG credits us to the extent our net operating losses, tax credits, and other tax benefits are used in AIG’s consolidated tax return and charges us to the extent of our tax liability (calculated on a separate return basis). Accordingly, our net operating loss and tax credit carryforwards disclosed currently represent the estimated separate company tax attribute carryforwards that have not been utilized on a consolidated AIG basis. Under the U.S. tax rules, these tax attribute carryforwards remain with the relevant Corebridge entities and will be available for utilization by the respective Corebridge U.S. federal tax filing groups following tax deconsolidation from AIG. Our tax attribute carryforwards will continue to be adjusted based on the short-period 2022 Corebridge tax return included as part of the AIG consolidated federal income tax return as well as certain IRS and other adjustments identified in AIG’s consolidated prior year tax returns. The balance sheet classification of U.S. federal current and deferred tax assets/liabilities is based on the respective separate U.S. Federal tax filing groups.
Our provision for state income taxes includes jurisdictions in which we continue to file combined tax returns with AIG and certain other states in which we file separate tax returns. State and local net operating loss carryforwards represent separate company tax attribute carryforwards not utilized on a combined basis, as applicable.
We calculate our provision for income taxes using the asset and liability method. This method considers the future tax consequences of temporary differences between the financial reporting and the tax basis of assets and liabilities measured using currently enacted tax rates. Deferred tax assets and liabilities are measured using enacted tax rates expected to apply to taxable income in the years in which those temporary differences are expected to be recovered or settled.
RECENT U.S. TAX LAW CHANGES
On August 16, 2022, President Biden signed the Inflation Reduction Act of 2022 (H.R. 5376), (the “Inflation Reduction Act”), which finances climate and energy provisions and an extension of enhanced subsidies under the Affordable Care Act with a 15% corporate
ITEM 8 | Notes to Consolidated Financial Statements | 22. Income Taxes
alternative minimum tax (“CAMT”) on adjusted financial statement income for corporations with average profits over $1 billion over a three-year period, a 1% stock buyback tax, increased IRS enforcement funding, and Medicare's new ability to negotiate prescription drug prices. CAMT and the stock buyback tax are effective for tax years beginning after December 31, 2022. The tax provisions of Inflation Reduction Act are not expected to have a material impact on Corebridge’s financial results. However, the CAMT may impact our U.S. cash tax liabilities.
RECLASSIFICATION OF CERTAIN TAX EFFECTS FROM ACCUMULATED OTHER COMPREHENSIVE INCOME
Corebridge uses an item-by-item approach to release the stranded or disproportionate income tax effects in AOCI related to our available-for-sale securities. Under this approach, a portion of the disproportionate tax effects is assigned to each individual security lot at the date the amount becomes lodged. When the individual securities are sold, mature, or are otherwise impaired on an other-than-temporary basis, the assigned portion of the disproportionate tax effect is reclassified from AOCI to income (loss) from operations.
EFFECTIVE TAX RATE
The following table presents income (loss) before income tax expense (benefit) by U.S. and foreign location in which such pre-tax income (loss) was earned or incurred:
| | | | | | | | | | | | | | | | | |
| Years Ended December 31, | | | | | |
| (in millions) | 2022 | | 2021 | | 2020 |
| U.S. | $ | 10,449 | | | $ | 10,600 | | | $ | 827 | |
| Foreign | 42 | | | 654 | | | 24 | |
| Total | $ | 10,491 | | $ | 11,254 | | | $ | 851 | |
The following table presents the income tax expense (benefit) attributable to pre-tax income (loss):
| | | | | | | | | | | | | | | | | |
| Years Ended December 31, | | | | | |
| (in millions) | 2022 | | 2021 | | 2020 |
| U.S. and Foreign components of actual income tax expense: | | | | | |
| U.S.: | | | | | |
| Current | $ | 868 | | | $ | 1,943 | | | $ | 1,714 | |
| Deferred | 1,150 | | | 146 | | | (1,726) | |
| Foreign: | | | | | |
| Current | 10 | | | 3 | | | 10 | |
| Deferred | (16) | | | (10) | | | (13) | |
| Total | $ | 2,012 | | $ | 2,082 | | | $ | (15) | |
Our actual income tax (benefit) expense differs from the statutory U.S. federal amount computed by applying the federal income tax rate due to the following:
| | | | | | | | | | | | | | | | | | | | | | | | | | | | | | | | | | | |
| Years Ended December 31, | 2022 | | 2021 | | 2020 |
| (dollars in millions) | Pre-Tax
Income
(Loss) | Tax
Expense/
(Benefit) | Percent of
Pre-Tax
Income (Loss) | | Pre-Tax
Income
(Loss) | Tax
Expense/
(Benefit) | Percent of
Pre-Tax
Income (Loss) | | Pre-Tax
Income | Tax
Expense/
(Benefit) | Percent of
Pre-Tax
Income |
| | | | | | | | | | | |
| U.S. federal income tax at statutory rate | $ | 10,491 | | $ | 2,203 | | 21.0 | % | | $ | 11,254 | | $ | 2,363 | | 21.0 | % | | $ | 851 | | $ | 178 | | 21.0 | % |
| Adjustments: | | | | | | | | | | | |
| Uncertain tax positions | — | | 2 | | — | | | — | | (69) | | (0.6) | | | — | | 17 | | 2.0 | |
| Reclassifications from accumulated other comprehensive income | — | | (84) | | (0.7) | | | — | | (108) | | (1.0) | | | — | | (100) | | (11.8) | |
| Noncontrolling interest | — | | (67) | | (0.6) | | | — | | (197) | | (1.7) | | | — | | (47) | | (5.5) | |
| Dividends received deduction | — | | (36) | | (0.3) | | | — | | (37) | | (0.3) | | | — | | (39) | | (4.6) | |
| Tax deconsolidation and separation costs | — | | (104) | | (1.0) | | | — | | — | | — | | | — | | — | | — | |
| State and local income taxes | — | | 24 | | 0.2 | | | — | | 105 | | 0.9 | | | — | | (4) | | (0.5) | |
| Other | — | | (29) | | (0.3) | | | — | | (2) | | — | | | — | | 1 | | 0.1 | |
| Adjustments to prior year tax returns | — | | (48) | | (0.5) | | | — | | (3) | | — | | | — | | (27) | | (3.2) | |
| Share based compensation payments excess tax deduction | — | | (6) | | (0.1) | | | — | | 4 | | — | | | — | | 10 | | 1.2 | |
| Valuation allowance | — | | 157 | | 1.5 | | | — | | 26 | | 0.2 | | | — | | (4) | | (0.5) | |
| Consolidated total amounts | $ | 10,491 | | $ | 2,012 | | 19.2 | % | | $ | 11,254 | | $ | 2,082 | | 18.5 | % | | $ | 851 | | $ | (15) | | (1.8) | % |
ITEM 8 | Notes to Consolidated Financial Statements | 22. Income Taxes
For the year ended December 31, 2022, there was a tax expense on income from operations, resulting in an effective tax rate on income from operations of 19.2%. The effective tax rate on income from operations differs from the statutory tax rate of 21.0% primarily due to tax benefits of $104 million of associated with the tax deconsolidation from AIG, $84 million reclassifications from accumulated other comprehensive income to income from operations related to the disposal of available for sale securities, $67 million associated with noncontrolling interest, and $36 million dividends received deduction. These tax benefits were partially offset by a tax charge of $157 million additional valuation allowance establishment primarily as a result of the tax deconsolidation.
For the year ended December 31, 2021, there was a tax expense on income from operations, resulting in an effective tax rate on income from operations of 18.5%. The effective tax rate on income from operations differs from the statutory tax rate of 21% primarily due to tax benefits of $108 million of reclassifications from accumulated other comprehensive income to income from operations related to the disposal of available for sale securities, $197 million associated with noncontrolling interest, $37 million dividends received deduction, and $69 million primarily associated with the release of reserves for uncertain tax positions, penalties and interest related to the recent completion of audit activity by the IRS. These tax benefits were partially offset by a tax charge of $105 million related to state and local income taxes and $18 million associated with the establishment of U.S. federal valuation allowance related to certain tax attribute carryforwards.
For the year ended December 31, 2020, there was a tax benefit on income from operations, resulting in an effective tax rate on income from operations of (1.8)%. The effective tax rate on income from operations differs from the statutory tax rate of 21% primarily due to tax benefits of $100 million of reclassifications from accumulated other comprehensive income to income from operations related to the disposal of available for sale securities, $47 million associated with noncontrolling interest, $39 million dividends received deduction and $27 million associated with tax adjustments related to prior year returns. These tax benefits are partially offset by a tax charge of $17 million related to changes in uncertain tax positions, including the accrual of IRS interest.
For the year ended December 31, 2022, we consider our foreign earnings with respect to certain operations in Europe to be indefinitely reinvested. These earnings relate to ongoing operations and have been reinvested in active business operations. A deferred tax liability has not been recorded for those foreign subsidiaries whose earnings are considered to be indefinitely reinvested. If recorded, such deferred tax liability would not be material to our consolidated financial condition. Deferred taxes, if necessary, have been provided on earnings of non-U.S. affiliates whose earnings are not indefinitely reinvested.
The following table presents the components of the net deferred tax assets (liabilities):
| | | | | | | | |
| December 31, | | |
| (in millions) | 2022 | 2021 |
| Deferred tax assets: | | |
| Losses and tax credit carryforwards | $ | 572 | | $ | 214 | |
| Basis differences on investments | 2,989 | | 3,044 | |
| Fortitude Re funds withheld embedded derivative | — | | 541 | |
| Life policy reserves | 1,561 | | 2,811 | |
| Accruals not currently deductible, and other | 61 | | 2 | |
| Investments in foreign subsidiaries | — | | 1 | |
| Loss reserve discount | — | | — | |
| Fixed assets and intangible assets | 885 | | 1,160 | |
| Other | 439 | | 237 | |
| Employee benefits | 81 | | — | |
| Unrealized losses related to available for sale debt securities | 4,928 | | — | |
| Unearned premium reserve reduction | 144 | | — | |
| Market risk benefits | 828 | | 1,447 | |
| Total deferred tax assets | 12,488 | | 9,457 | |
| Deferred tax liabilities: | | |
| Employee benefits | — | | (32) | |
| Fortitude Re funds withheld embedded derivative | (863) | | — | |
| | |
| Deferred policy acquisition costs | (1,504) | | (1,528) | |
| Unrealized gains related to available for sale debt securities | — | | (3,166) | |
| Total deferred tax liabilities | (2,367) | | (4,726) | |
| Net deferred tax assets before valuation allowance | 10,121 | | 4,731 | |
| Valuation allowance | (1,752) | | (169) | |
| Net deferred tax assets (liabilities) | $ | 8,369 | | $ | 4,562 | |
As of December 31, 2022, on a U.S. GAAP basis, we have U.S. federal net operating loss carryforwards of $459 million. Our net operating loss carryforwards of the AGC group have unlimited carryforward periods while net operating loss carryforwards of the Non-
ITEM 8 | Notes to Consolidated Financial Statements | 22. Income Taxes
Life Group have carryforward periods expiring after 2028. A valuation allowance has been recorded on net operating loss carryforwards of the Non-Life Group, as discussed below.
ASSESSMENT OF DEFERRED TAX ASSET VALUATION ALLOWANCE
The evaluation of the recoverability of our deferred tax asset and the need for a valuation allowance requires us to weigh all positive and negative evidence to reach a conclusion that it is more likely than not that all or some portion of the deferred tax asset will not be realized. The weight given to the evidence is commensurate with the extent to which it can be objectively verified. The more negative evidence that exists, the more positive evidence is necessary and the more difficult it is to support a conclusion that a valuation allowance is not needed.
Our framework for assessing the recoverability of the deferred tax asset requires us to consider all available evidence, including:
•the nature, frequency, and amount of cumulative financial reporting income and losses in recent years;
•the sustainability of recent operating profitability of our subsidiaries;
•the predictability of future operating profitability of the character necessary to realize the net deferred tax asset, including forecasts of future income for each of our businesses and actual and planned business and operational changes;
•the carryforward periods for the net operating loss, capital loss and foreign tax credit carryforwards, including the effect of reversing taxable temporary differences; and
•prudent and feasible actions and tax planning strategies that would be implemented, if necessary, to protect against the loss of the deferred tax asset.
Recent events, including the IPO, multiple changes in target interest rates by the Board of Governors of the Federal Reserve System and significant market volatility, impacted actual and projected results of our business operations as well as our views on potential effectiveness of certain prudent and feasible tax planning strategies. In order to demonstrate the predictability and sufficiency of future taxable income necessary to support the realizability of the net operating losses and foreign tax credit carryforwards, we have considered forecasts of future income for each of our businesses, including assumptions about future macroeconomic and Corebridge-specific conditions and events, and any impact these conditions and events may have on our prudent and feasible tax planning strategies.
The completion of the IPO resulted in the tax deconsolidation from the AIG Consolidated Tax Group. As discussed above, under applicable tax law, the AGC Group will not be permitted to join in the filing of a U.S. consolidated federal income tax return with the Non-Life Group for the five-year waiting period. Instead, the AGC Group is expected to file separately as members of the AGC consolidated U.S. federal income tax return during this period. Following the five-year waiting period, the AGC Group is expected to join U.S. consolidated federal income tax return with the Non-Life Group. Each separate U.S. federal tax filing group or separate U.S. tax filer is required to consider this five-year waiting period when assessing realization of their respective deferred tax assets including net operating loss and tax credit carryforwards. Taking into account the IPO and subsequent tax deconsolidation and their impact on projections of income and our analysis of their potential impact on utilization of our deferred tax assets for our U.S. federal tax filing groups, during 2022 we recorded an additional $133 million valuation allowance related to our tax attribute carryforwards and a portion of certain other deferred tax assets that are no longer more-likely-than-not to be realized.
As of December 31, 2022, the balance sheet reflects a valuation allowance of $151 million related to our tax attribute carryforwards and a portion of certain other deferred tax assets that are no longer more-likely-than-not to be realized.
Estimates of future taxable income, including income generated from prudent and feasible actions and tax planning strategies, impact of settlements with taxing authorities, and any changes to interpretations and assumptions related to the impact of the Inflation Reduction Act or the Tax Act could change in the near term, perhaps materially, which may require us to consider any potential impact to our assessment of the recoverability of the deferred tax asset. Such potential impact could be material to our consolidated financial condition or results of operations for an individual reporting period.
For the year ended December 31, 2022, recent changes in market conditions, including rising interest rates, impacted the unrealized tax capital gains and losses in the U.S. Life Insurance Companies’ available-for-sale securities portfolio, resulting in a deferred tax asset related to net unrealized tax capital losses. The deferred tax asset relates to the unrealized capital losses for which the carryforward period has not yet begun, and as such, when assessing its recoverability, we consider our ability and intent to hold the underlying securities to recovery. As of December 31, 2022, based on all available evidence, we concluded that a valuation allowance should be established on a portion of the deferred tax asset related to unrealized capital losses that are not more likely than not to be realized. For the year ended December 31, 2022, we established $1.4 billion of valuation allowance associated with the unrealized tax capital losses in the U.S. Life Insurance Companies’ available-for-sale securities portfolio. All of the valuation allowance established was allocated to other comprehensive income.
For the year ended December 31, 2022, we recognized a net increase of $24 million in deferred tax asset valuation allowance associated with certain state and foreign jurisdictions, primarily attributable to current year activity.
ITEM 8 | Notes to Consolidated Financial Statements | 22. Income Taxes
TAX EXAMINATIONS AND LITIGATION
Corebridge Parent and certain U.S. subsidiaries are included in a consolidated U.S. federal income tax return with AIG through the date of IPO (short-period tax year 2022), and income tax expense is recorded, based on applicable U.S. and foreign laws. The AIG U.S. consolidated tax group is currently under IRS examination for the tax years 2011 through 2019 and is continuing to engage in the appeals process for years 2007 through 2010.
We are periodically advised of certain IRS and other adjustments identified in AIG’s consolidated tax return which are attributable to our operations. Under our tax sharing arrangement, we provide a charge or credit for the effect of the adjustments and the related interest in the period we are advised of such adjustments and interest.
The IRS challenged certain foreign tax credits claimed by Corebridge and certain U.S. subsidiaries related to the cross border financing transactions entered into in the years 2002-2004 while Corebridge and such subsidiaries were not part of the AIG Consolidated Tax Group. During the fourth quarter of 2020, Corebridge and the IRS executed a binding settlement agreement with respect to the underlying issues in those tax years. Review of the related interest calculations based on the settlement agreement concluded in the first quarter of 2022.
ACCOUNTING FOR UNCERTAINTY IN INCOME TAXES
The following table presents a reconciliation of the beginning and ending balances of the total amounts of gross unrecognized tax benefits:
| | | | | | | | | | | | | | | | | |
| Years Ended December 31, | | | | | |
| (in millions) | 2022 | | 2021 | | 2020 |
| Gross unrecognized tax benefits, beginning of year | $ | 18 | | | $ | 917 | | $ | 1,173 |
| Increases in tax positions for prior years | 3 | | | — | | 1 |
| Decreases in tax positions for prior years | (1) | | | (899) | | | (5) |
| Increases in tax positions for current year | — | | | — | | — |
| Settlements | — | | | — | | | (252) |
| Gross unrecognized tax benefits, end of year | $ | 20 | | $ | 18 | | $ | 917 |
At December 31, 2022, 2021 and 2020, Corebridge subsidiaries had unrecognized tax benefits, excluding interest and penalties, which were $20 million, $18 million and $917 million, respectively. The activity for the years ended December 31, 2021 and 2020 is primarily attributable to the recent completion of audit activity by the IRS. Additionally, the activity for the year ended December 31, 2021 includes decreases of $846 million related to amounts for Cap Corp and certain of its affiliates that were adjusted through Shareholders’ equity in the Company’s Consolidated Financial Statements.
For December 31, 2020, our unrecognized tax benefit related to tax positions that, if recognized, would not affect the effective tax rate because they relate to such factors as the timing, rather than the permissibility, of the deduction were $10 million. Accordingly, at December 31, 2022, 2021 and 2020, the amounts of unrecognized tax benefits that, if recognized, would favorably affect the effective tax rate were $20 million, $18 million, and $907 million, respectively.
Interest and penalties related to unrecognized tax benefits are recognized in income tax expense. At December 31, 2022 and 2021, we had no accrued liabilities, and at December 31, 2020, we had accrued liabilities of $52 million. There was no interest activity related to unrecognized tax benefits for the year ended December 31, 2022. For the years ended December 31, 2021 and 2020, we accrued (benefit) expense of $(26) million and $2 million, respectively, for the payment of interest and penalties. Additionally, the activity for the year ended December 31, 2021 includes decreases of $26 million related to amounts for Cap Corp and certain of its affiliates that were adjusted through Shareholders’ equity in the Company’s Consolidated Financial Statements.
Although it is reasonably possible that a change in the balance of unrecognized tax benefits may occur within the next 12 months, based on the information currently available, we do not expect any change to be material to our consolidated financial condition.
Listed below are the tax years that remain subject to examination by major tax jurisdictions:
| | | | | |
| December 31, 2022 | Open Tax Years |
| Major Tax Jurisdiction | |
| United States | 2007-2021 |
| United Kingdom | 2021 |
ITEM 8 | Notes to Consolidated Financial Statements | 23. Related Parties
RELATED PARTY TRANSACTIONS
We may enter into a significant number of transactions with related parties in the normal course of business. Parties are considered to be related if one party has the ability to control or exercise significant influence over the other party in making financial or operating decisions, or if a party, directly or indirectly through one or more of its intermediaries, controls, is controlled by or is under common control with an entity. Our material transactions with related parties are described below.
The table below summarizes the material revenues and expenses of Corebridge, in connection with agreements with affiliated companies described below for the years ended December 31, 2022, 2021 and 2020:
| | | | | | | | | | | | | | | | | | | | |
| | Years Ended December 31, |
| (in millions) | | 2022 | | 2021 | | 2020 |
| Revenues: | | | | | | |
| Other income | | $ | 95 | | $ | 85 | | $ | 88 |
| Net investment income - excluding Fortitude Re funds withheld assets | | (1) | | (14) | | (12) |
| Total revenues | | $ | 94 | | $ | 71 | | $ | 76 |
| Expenses: | | | | | | |
| General operating and other expenses | | $ | 131 | | $ | 349 | | $ | 317 |
| Interest expense | | 79 | | 82 | | 146 |
| Loss on extinguishment of debt | | — | | 145 | | — |
| Total expenses | | $ | 210 | | $ | 576 | | $ | 463 |
Related Party Transactions with AIG
We have historically entered into various transactions with AIG, some of which are continuing. These transactions are described below. In addition, on September 14, 2022, we entered into a separation agreement with AIG (the “Separation Agreement”). The Separation Agreement governs the relationship between AIG and us following the IPO, including matters related to the allocation of assets and liabilities between the parties, indemnification obligations, our corporate governance, information rights for each party and consent rights of AIG with respect to certain business activities that we may undertake.
Reorganization Transactions
Transfer of Investment Management Operations
In connection with the IPO, we and AIG entered into agreements to effectuate the transfer of substantially all of the entities that conducted AIG Group’s investment management operations from AIG to us. Specifically, AIG formed a new investment management holding company, SAFG Capital LLC, to which it transferred subsidiaries which conducted its investment management operations, subject to certain limited exceptions. SAFG Capital LLC was contributed to us, effective December 31, 2021.
Transfer of Fortitude Re Interest
On October 1, 2021, AIG contributed to us its entire 3.5% ownership interest in Fortitude Re Bermuda. Currently, we hold a less than 3% interest in Fortitude Re Bermuda.
Transfer of AIG Technologies, Inc. and Eastgreen, Inc.
We purchased AIGT and Eastgreen from AIG on February 28, 2022 for total consideration of $107 million. AIGT provides data processing, technology and infrastructure services to AIG entities in the United States, including management of AIG hardware and networks. AIGT utilizes two data centers to provide its services. The real estate related to the two data centers is owned by Eastgreen. To the extent needed, AIGT will continue to provide services to AIG for a transition period.
European Insurance Entities
In 2021, AIG transferred AIG Life (United Kingdom) and Laya to us.
Advisory Transactions
Certain of our investment management subsidiaries, including AMG, AMG Europe and AIG Credit Management (“AIGCM”), LLC, provide advisory, management, allocation, structuring, planning, oversight, administration and similar services (collectively, “Investment Services”) with respect to the investment portfolios of AIG. Investment Services are provided primarily pursuant to investment management, investment advisory and similar agreements (“IMAs”), under which our subsidiaries are appointed as investment manager and are authorized to manage client investment portfolios on a fully discretionary basis, subject to agreed investment guidelines. Certain of our subsidiaries are also authorized under the IMAs to retain, oversee and direct third-party
ITEM 8 | Notes to Consolidated Financial Statements | 23. Related Parties
investment advisers and managers for and on behalf of these AIG clients. In some cases, Investment Services are provided through the clients’ participation in private investment funds, RMBS, CLO and other pooled investment vehicles and investment products (collectively, “Funds”) sponsored or managed by us.
Separately, certain of our subsidiaries provide portfolio administration and investment planning, performance evaluation and oversight services to AIG PC International, LLC (“AIGPCI”), on a non-discretionary basis, with respect to the investment portfolios of various of AIGPCI’s non-U.S. subsidiaries. In some cases, these services are directly provided to AIGPCI’s non-US subsidiaries. We offer our Funds to AIGPCI’s non-U.S. subsidiaries. Our subsidiaries earn investment management and advisory fees under the IMAs and other service agreements, as well as management fees and carried interest distributions or similar performance-based compensation under the Funds’ operating agreements, the majority of which are based on, or calibrated to approximate, the costs of providing the services. With respect to a minority of the AIG client portfolios, which relate to assets backing risks that have been transferred to third parties, our subsidiaries earn market-based fees. Management and advisory fee income for these Investment Services and related services reflected in Other income on the Consolidated Statements of Income (Loss) was $95 million, $85 million and $88 million for the years ended December 31, 2022, 2021 and 2020, respectively.
Capital Markets Agreements
We receive a suite of capital markets services from AIG, including securities lending, collateral management, repurchase transactions, derivatives execution and support, and operational support services, for which we pay a fee. AIGM provides these services through various services agreements. In addition, in the ordinary course of business, we enter into OTC derivative transactions with AIGM under standard ISDA Master Agreements. The total expenses incurred for services provided by AIGM reflected in Net investment income - excluding Fortitude Re funds withheld assets on the Consolidated Statements of Income (Loss) were $15 million, $17 million and $19 million for the years ended December 31, 2022, 2021 and 2020, respectively. The derivative assets, net of gross assets and gross liabilities after collateral were $12 million and $256 million as of December 31, 2022 and December 31, 2021, respectively. The derivative liabilities, net of gross assets and gross liabilities after collateral were $— million and $2 million as of December 31, 2022 and December 31, 2021, respectively. The collateral posted to AIGM was $1,518 million and $803 million as of December 31, 2022 and December 31, 2021, respectively. The collateral held by us was $380 million and $770 million as of December 31, 2022 and December 31, 2021, respectively.
In addition, we entered into certain unsecured derivative transactions with AIG. The derivative assets, net of gross assets and gross liabilities after collateral were $253 million and $406 million as of December 31, 2022 and December 31, 2021, respectively. There were no derivative net liabilities as of December 31, 2022 and December 31, 2021, respectively. In relation to these derivatives, there was no collateral posted to AIG or collateral held by us as of December 31, 2022 and December 31, 2021, respectively.
For further details regarding derivatives, see Note 10.
General Services Agreements
Pursuant to the provisions of a Service and Expense Agreement (the “AIG Service and Expense Agreement”) effective February 1, 1974, as amended, we and AIG have provided various services to each other at cost, including, but not limited to, advertising, accounting, actuarial, tax, legal, data processing, claims adjustment, employee cafeteria, office space, payroll, information technology services, capital markets services, services that support financial transactions and budgeting, risk management and compliance services, human resources services, insurance, operations and other support services.
On September 14, 2022, we entered into a Transitional Services Agreement (the “TSA”) with AIG regarding the continued provision of services between the Company and AIG on a transitional basis. The TSA has generally replaced the AIG Service and Expense Agreement for services provided between the parties.
Amounts due to AIG under these agreements were $311 million and $262 million as of December 31, 2022 and December 31, 2021, respectively. Amounts due from AIG were $54 million and $43 million as of December 31, 2022 and December 31, 2021, respectively. The total service expenses incurred specific to these agreements reflected in General operating and other expenses on the Consolidated Statements of Income (Loss) were $114 million, $229 million and $204 million for the years ended December 31, 2022, 2021 and 2020, respectively.
Reinsurance Transactions
From time to time, AIG Life (United Kingdom) has entered into various coinsurance agreements with AIRCO as follows:
•In 2018, AIG Life (United Kingdom) ceded risks to AIRCO relating to the payment of obligations of life-contingent annuity claims in the annuitization phase of the contracts on or after June 30, 2018.
• In 2019 and 2020, AIG Life (United Kingdom) ceded risks to AIRCO relating to certain whole life policies issued prior to and subsequent to July 1, 2019, respectively.
ITEM 8 | Notes to Consolidated Financial Statements | 23. Related Parties
Reinsurance assets related to these agreements were $70 million and $167 million as of December 31, 2022 and December 31, 2021, respectively. Amounts payable to AIRCO were $32 million and $7 million as of December 31, 2022 and December 31, 2021, respectively. Ceded premiums related to these agreements were $41 million, $42 million and $33 million for the years ended December 31, 2022, 2021 and 2020, respectively.
For further details of reinsurance transactions, see Note 7.
Guarantees
Prior to the IPO, AIG provided certain guarantees to us as described below. Pursuant to the Separation Agreement, we will indemnify, defend and hold harmless AIG against or from any liability arising from or related to these guarantees.
Certain of our insurance subsidiaries benefit from General Guarantee Agreements under which AHAC or NUFIC has unconditionally and irrevocably guaranteed all present and future obligations arising from certain insurance policies issued by these subsidiaries (a “Guaranteed Policy” or the “Guaranteed Policies”). AHAC and NUFIC are required to perform under the agreements if one of the insurance subsidiaries fails to make payments due under a Guaranteed Policy. These General Guarantee Agreements have all been terminated as to insurance policies issued after the date of termination. AHAC and NUFIC have not been required to perform under any of the agreements but remain contingently liable for all policyholder obligations associated with the Guaranteed Policies. We did not pay any fees under these agreements for the years ended December 31, 2022 and 2021.
AGC is a party to a CMA with AIG. Among other things, the CMA provides that AIG will maintain the total adjusted capital of AGC at or above a specified minimum percentage of AGC’s projected Company Action Level Risk Based Capital. AIG did not make any capital contributions to AGC under the CMA during the year ended December 31, 2022. As of December 31, 2022, 2021 and 2020, the specified minimum capital percentage in the CMA was 250%.
AIG provides a full and unconditional guarantee of all outstanding notes and junior subordinated debentures of AIGLH. This includes:
•the AIGLH External Debt Guarantee; and
•a guarantee in connection with a sale-leaseback transaction in 2020. Pursuant to this transaction, AIGLH issued promissory notes to AGL with maturity dates of up to five years. These promissory notes are guaranteed by AIG for the benefit of AGL. We paid no fees for these guarantees for the years ended December 31, 2022 and 2021.
In addition to the Separation Agreement, we have entered into a guarantee reimbursement agreement with AIG which provides that we will reimburse AIG for the full amount of any payment made by or on behalf of AIG pursuant to the AIGLH External Debt Guarantee. We have also entered into a collateral agreement with AIG which provides that in the event of: (i) a ratings downgrade of Corebridge Parent or AIGLH long-term unsecured indebtedness below specified levels or (ii) the failure by AIGLH to pay principal and interest on the External Debt when due, we must collateralize an amount equal to the sum of: (i) 100% of the principal amount outstanding, (ii) accrued and unpaid interest and (iii) 100% of the net present value of scheduled interest payments through the maturity dates of the AIGLH External Debt.
We were the guarantor on two letters of credit which were further guaranteed by AIG in support of two affordable housing properties. On June 1, 2021, the loan associated with one of the properties was fully repaid and the letter of credit was subsequently released. On March 22, 2022, the remaining letter of credit was cancelled and replaced by April Housing, a subsidiary of Blackstone.
In addition to the guarantees above, we may provide to or receive from AIG, or to or from third-parties on behalf of AIG, customary guarantees in relation to certain lending and real estate transactions. These guarantees of certain amounts in connection with borrowings or environmental indemnifications and non-recourse carve-outs are limited to situations in which the borrower commits certain “bad acts” as defined in each applicable transaction document, including fraud or intentional misrepresentation, intentional waste or willful misconduct. As of December 31, 2022, none of these guarantees became payable.
For further details regarding guarantees provided by AIG, see Note 16
Credit Facilities and Funding Arrangements
We were party to certain revolving credit facilities with AIG which terminated on September 19, 2022.
Also, prior to September 19, 2022, we participated in funding arrangements whereby each participating subsidiary placed funds on deposit with AIG in exchange for a stated rate of interest. These funding arrangements terminated on September 19, 2022. Our receivables under these arrangements of $0.4 billion and $1.0 billion as of December 31, 2022 and December 31, 2021, respectively, were recorded in Short-term investments on the Consolidated Balance Sheets. Interest earned on these deposits, reflected in Net investment income - excluding Fortitude Re funds withheld assets on the Consolidated Statements of Income (Loss), was $14 million, $3 million and $7 million for the years ended December 31, 2022, 2021 and 2020, respectively.
ITEM 8 | Notes to Consolidated Financial Statements | 23. Related Parties
Promissory Notes
In 2019, AIG Global Real Estate Investment Corp. issued a note to Lexington Insurance Company of $250 million. This note was repaid on February 12, 2021.
In November 2021, we issued a promissory note to AIG in the amount of $8.3 billion. Interest expense incurred specific to this note reflected in Interest expense on the Consolidated Statements of Income (Loss) was $46 million for the year ended December 31, 2022. We repaid the principal and accrued interest of this note during the year ended December 31, 2022.
For further details on debt, see Note 15.
Purchase of Securitized Notes from AIG
On September 9, 2022, certain of our insurance companies purchased from AIG senior debt issued by, as well as 100% of the ownership interests in, special purpose entities that held collateralized debt obligations for a total value of approximately $800 million. As a result of these transactions, we owned all the interests related to these investments and consolidate them in our financial statements. As of December 31, 2022, we sold the underlying collateralized debt obligations.
Purchase of Residential Mortgage Loans
On December 23, 2022, certain Corebridge subsidiaries executed four Sale Transfer and Assignment agreements with certain AIG subsidiaries to purchase certain participation interests in residential mortgage loans.
Tax Sharing Agreements
Prior to the IPO, Corebridge and SAFG Capital LLC were included in the consolidated federal income tax return of AIG as well as certain state tax returns where AIG files on a combined or unitary basis. The table below summarizes payments to or refunds from AIG in connection with the tax sharing agreements for the years ended December 31, 2022, 2021 and 2020.
For further details on tax impact of the IPO, see Note 22.
| | | | | | | | | | | | | | | | | | | | |
| Years Ended December 31, | | | | | | |
| (in millions) | | 2022 | | 2021 | | 2020 |
| Payment or (refund): | | | | | | |
| Corebridge | | $ | 1,018 | | | $ | 1,537 | | | $ | 1,716 | |
| SAFG Capital LLC | | 14 | | | (5) | | | (9) | |
| Total | | $ | 1,032 | | | $ | 1,532 | | | $ | 1,707 | |
On September 14, 2022, we entered into a tax matters agreement with AIG that governs the parties’ respective rights, responsibilities and obligations with respect to taxes, including the allocation of current and historic tax liabilities (whether income or non-income consolidated or stand-alone) between us and AIG (the “Tax Matters Agreement”). The Tax Matters Agreement governs, among other things, procedural matters, such as filing of tax returns, tax elections, control and settlement of tax controversies and entitlement to tax refunds and tax attributes.
Employee Compensation and Benefits
Our employees participate in certain of AIG’s employee benefit programs. We had a payable of $59 million and $66 million as of December 31, 2022 and December 31, 2021, respectively, with respect to these programs. On September 14, 2022, we entered into an employee matters agreement with AIG (the “EMA”). The EMA allocates liabilities and responsibilities relating to employment matters, employee compensation and benefits plans and programs, and other related matters between us and AIG. The EMA generally provides that, unless otherwise specified, each party is responsible for liabilities associated with their current and former employees for purposes of compensation and benefit matters following the IPO.
Related Party Transactions with Blackstone
We entered into a long-term asset management relationship with Blackstone to manage a portion of our investment portfolio beginning in the fourth quarter of 2021 and the investment expense incurred was $147 million and $18 million for the years ended December 31, 2022 and 2021, respectively.
For further details of our strategic partnership with Blackstone, see Note 1.
Related Party Transactions with Variable Interest Entities
In the ordinary course of business, we enter into various arrangements with VIEs, and we consolidate the VIE if we are determined to be the primary beneficiary. In certain situations, we may have a variable interest in a VIE that is consolidated by an affiliate, and in other instances, affiliates may have variable interests in a VIE that is consolidated by us. The total debt of consolidated VIEs held by
ITEM 8 | Notes to Consolidated Financial Statements | 23. Related Parties
affiliates was $308 million and $760 million as of December 31, 2022 and December 31, 2021, respectively. The interest expense incurred on the debt reflected in Interest expense on the Consolidated Statements of Income (Loss) was $33 million, $64 million and $141 million for the years ended December 31, 2022, 2021 and 2020, respectively.
Additionally, during 2021, we terminated six VIEs and recorded a loss on extinguishment of debt of $145 million. There was no VIE terminated during 2022. The noncontrolling interest included in the Consolidated Balance Sheets related to the VIEs held by affiliates was $537 million and $1.5 billion as of December 31, 2022 and December 31, 2021, respectively. The gain/(loss) attributable to noncontrolling interest of consolidated VIEs held by affiliates was $52 million, $499 million and $169 million for the years ended December 31, 2022, 2021 and 2020, respectively.
In addition to transactions with VIEs, Corebridge has entered into other structured financing arrangements supporting real estate properties and other types of assets with other AIG affiliates. These financing arrangements are reported in Other invested assets in the Consolidated Balance Sheets. Certain of these and the VIE structures above also include commitments for funding from other AIG affiliates.
For additional information related to VIEs and other investments, see Notes 5 and 9.
Summary of Investments – Other than Investments in Related Parties
| | | | | | | | | | | | | | | | | |
| | | | | Schedule I |
| December 31, 2022 | | | | | Amount at
which shown in
the Balance Sheet |
| (in millions) | Cost(a)(b) | | Fair Value(b) | |
| Fixed maturities: | | | | | |
| U.S. government and government sponsored entities | $ | 1,405 | | $ | 1,198 | | $ | 1,198 |
| Obligations of states, municipalities and political subdivisions | 6,845 | | 5,963 | | 5,963 |
| Non-U.S. governments | 5,273 | | 4,414 | | 4,414 |
| Public utilities | 20,187 | | 16,611 | | 16,611 |
| All other corporate debt securities | 106,103 | | 90,303 | | 90,303 |
| Mortgage-backed, asset-backed and collateralized | 45,230 | | 42,073 | | 42,073 |
| Total fixed maturity securities | 185,043 | | 160,562 | | 160,562 |
| Equity securities and mutual funds: | | | | | |
| Common stock: | | | | | |
| Public utilities | — | | | — | | — |
| Banks, trust and insurance companies | 2 | | 2 | | 2 |
| Industrial, miscellaneous and all other | 64 | | 64 | | 64 |
| Total common stock | 66 | | 66 | | 66 |
| Preferred stock | 27 | | 27 | | 27 |
| Mutual funds | 77 | | 77 | | 77 |
| Total equity securities and mutual funds | 170 | | 170 | | 170 |
| Mortgage and other loans receivable, net of allowance | | | | | |
| Commercial mortgages | 32,993 | | 29,998 | | 32,993 |
| Residential mortgages | 5,856 | | 4,950 | | 5,856 |
| Life insurance policy loans | 1,750 | | 1,752 | | 1,750 |
| Commercial loans, other loans and notes receivable | 4,567 | | 4,430 | | 4,567 |
| Total mortgage and other loans receivable | 45,166 | | 41,130 | | 45,166 |
| Allowance for credit losses | (600) | | — | | (600) |
| Total mortgage and other loans receivable, net of allowance | 44,566 | | 41,130 | | 44,566 |
Other invested assets(c) | 11,034 | | 10,418 | | 10,418 |
| Short-term investments, at cost (approximates fair value) | 4,400 | | 4,400 | | 4,400 |
Derivative assets(d) (e) | 299 | | 299 | | 299 |
| Total investments | $ | 245,512 | | $ | 216,979 | | $ | 220,415 |
(a)Original cost of fixed maturities is reduced by repayments and adjusted for amortization of premiums or accretion of discounts.
(b)The table above includes available for sale securities issued by related parties. This includes RMBS securities which had a fair value of $39 million and an amortized cost of $43 million.
(c)Includes $6 million of investments in related parties.
(d)Includes $265 million of derivative assets with related parties.
(e)Excludes $97 million of derivative liabilities.
Condensed Financial Information of Registrant
Balance Sheets - Parent Company Only
| | | | | | | | | | | |
| Schedule II |
| December 31, | | | |
| (in millions, except per common share data) | 2022 | | 2021 |
| Assets: | | | |
| Short-term investments | $ | 1,499 | | $ | 465 |
| Other investments | 198 | | 142 |
| Total investments | 1,697 | | 607 |
| Cash | 9 | | 2 |
| Due from affiliates - net* | 42 | | 1 |
| Current tax receivable | 292 | | 25 |
| Deferred income taxes | 108 | | 141 |
| Investment in consolidated subsidiaries* | 16,543 | | 34,984 |
| Other assets | 83 | | 43 |
| Total assets | $ | 18,774 | | $ | 35,803 |
| Liabilities: | | | |
| Due to affiliate* | $ | 271 | | $ | 58 |
| Deferred tax liabilities | 10 | | — |
| Short term debt | 1,500 | | 8,317 |
| Long term debt | 7,441 | | — |
| Other liabilities | 172 | | 198 |
| Total liabilities | 9,394 | | 8,573 |
| Corebridge Shareholders’ equity: | | | |
Common stock, $0.01 par value; 2,500,000,000 shares authorized; 645,000,000 shares issued | 6 | | — |
Common stock class A, $0.01 par value; 2,252,500,000 shares authorized; 581,145,000 shares issued | — | | 5 |
Common stock class B, $0.01 par value; 247,500,000 shares authorized; 63,855,000 shares issued | — | | 1 |
| Additional paid-in capital | 8,030 | | 8,054 |
| Retained earnings | 18,207 | | 10,937 |
| | | |
| Accumulated other comprehensive income | (16,863) | | 8,233 |
| Total Corebridge Shareholders’ equity | 9,380 | | 27,230 |
| Total liabilities and equity | $ | 18,774 | | $ | 35,803 |
* Eliminated for the consolidated Corebridge financial statements.
See accompanying Notes to Condensed Financial Information of Registrant.
Condensed Financial Information of Registrant (Continued)
Statements of Income (Loss) and Comprehensive Income (Loss) - Parent Company Only
| | | | | | | | | | | | | | | | | |
| | | Schedule II |
| Years Ended December 31, | | | | | |
| (in millions) | 2022 | | 2021 | | 2020 |
| Revenues: | | | | | |
Equity in undistributed net income (loss) of consolidated subsidiaries* | $ | 6,897 | | | $ | 4,392 | | | $ | 113 | |
Dividend income from consolidated subsidiaries* | 1,781 | | | 1,893 | | | 422 | |
| Interest income | 79 | | | 365 | | | 235 | |
| Net realized gains (losses) | 4 | | | 62 | | | (3) | |
| Total revenues | 8,761 | | 6,712 | | 767 |
| Expenses: | | | | | |
| Interest expense | 266 | | | 18 | | | 2 | |
| Net (gain) loss on sale of divested businesses | — | | | (2,438) | | | — | |
| Other expenses | 507 | | | 191 | | | 130 | |
| Total expenses | 773 | | (2,229) | | 132 |
| Income from continuing operations before income tax expense (benefit) | 7,988 | | | 8,941 | | | 635 | |
| Income tax expense (benefit) | (171) | | | 698 | | | (7) | |
| Net income attributable to Corebridge Parent | 8,159 | | | 8,243 | | | 642 | |
| Other comprehensive income (loss) | (25,096) | | | (4,091) | | | 5,324 | |
| Total comprehensive income (loss) attributable to Corebridge Parent | $ | (16,937) | | | $ | 4,152 | | | $ | 5,966 | |
* Eliminated for the consolidated Corebridge financial statements.
See accompanying Notes to Condensed Financial Information of Registrant.
Condensed Financial Information of Registrant (Continued)
Statements of Cash Flows - Parent Company Only
| | | | | | | | | | | | | | | | | |
| | | Schedule II |
| Years Ended December 31, | | | | | |
| (in millions) | 2022 | | 2021 | | 2020 |
| Net cash provided by (used in) operating activities | $ | 1,149 | | | $ | 519 | | $ | 405 |
| Cash flows from investing activities: | | | | | |
| Contributions to subsidiaries | — | | — | | | (135) |
| Sales or distributions of: | | | | | |
| Available for sale securities | 1 | | 132 | | 2 | |
| Other invested assets | — | | 232 | | 187 |
| Maturities of fixed maturity securities available for sale | — | | 86 | | 13 |
| Principal payments received on mortgage and other loans receivable | — | | 61 | | 59 |
| Purchase of: | | | | | |
| Other invested assets | — | | (23) | | | (7) | |
| Mortgage and other loans receivable issued | — | | (26) | | | (17) | |
| Acquisition of businesses, net of cash and restricted cash acquired | (107) | | — | | | — | |
| Net change in short-term investments | (1,034) | | 54 | | | (191) | |
| Net change in derivative assets and liabilities | 223 | | — | | — |
| Net cash provided by (used in) investing activities | (917) | | 516 | | | (89) | |
| Cash flows from financing activities: | | | | | |
| Dividends paid on common stock | (876) | | — | | | — | |
| Issuance of long-term debt | 7,451 | | — | | | — | |
| Issuance of short-term debt | 1,500 | | | — | | | — | |
| Repayments of short-term debt | (8,300) | | | — | | | — | |
| Distributions to AIG | — | | (1,008) | | | (450) | |
| Distributions to Class B shareholder | — | | (34) | | — |
| Contributions from AIG | — | | — | | 135 |
| Net cash used in financing activities | (225) | | (1,042) | | | (315) | |
| Net increase (decrease) in cash and restricted cash | 7 | | | (7) | | 1 | |
| Cash and restricted cash at beginning of year | 2 | | 9 | | 8 |
| Cash and restricted cash at end of year | $ | 9 | | $ | 2 | | $ | 9 |
| | | | | |
| Supplementary disclosure of cash flow information: | | | | | |
| Years ended December 31, |
| (in millions) | 2022 | | 2021 | | 2020 |
| Cash | $ | 9 | | $ | 2 | | | $ | — | |
| Restricted cash included in Other assets | — | | — | | 9 |
| Total cash and restricted cash shown in Statements of Cash Flows – | | | | | |
| Corebridge Parent Company Only | $ | 9 | | $ | 2 | | $ | 9 |
| Cash (paid) received during the period for: | | | | | |
| Taxes: | | | | | |
| Income tax authorities | $ | 116 | | $ | 32 | | $ | 39 |
| Intercompany non-cash financing and investing activities: | | | | | |
| Capital distributions | $ | — | | $ | 12,144 | | $ | — |
| Capital contributions | $ | — | | $ | 403 | | $ | 126 |
See accompanying Notes to Condensed Financial Information of Registrant.
NOTES TO CONDENSED FINANCIAL INFORMATION OF REGISTRANT
Corebridge’s investments in consolidated subsidiaries are stated at cost plus equity in undistributed income of consolidated subsidiaries. The condensed financial statements of Corebridge Parent (the “Registrant”) should be read in conjunction with the consolidated financial statements of Corebridge and the notes thereto (the “Consolidated Financial Statements”). The accounting policies of the Registrant are consistent with the accounting policies disclosed on the consolidated financial statements as applicable.
The Registrant includes in its Statement of Income dividends from its subsidiaries and equity in undistributed income (loss) of consolidated subsidiaries, which represents the net income (loss) of each of its wholly owned subsidiaries.
Financial information presented for prior years were retrospectively adjusted to reflect the internal reorganization discussed in Note 1 of the consolidated financial statements of Corebridge.
We identified a misclassification related to the balance sheet presentation of the deferred tax assets which resulted in an overstatement of Deferred tax assets and an overstatement of deferred tax liabilities. These balance sheet-only items had no impact to total equity, the statements of income (loss) and comprehensive income (loss)and statement of cash flows. Accordingly, the deferred tax assets and deferred tax liabilities were decreased by $3.9 billion as of December 31, 2021.2. Debt Short-term and long-term debt is carried at the principal amount borrowed, including unamortized discounts, and fair value adjustments, when applicable.
The following table lists our total debt outstanding at December 31, 2022 and December 31, 2021. The interest rates presented in the following table are the range of contractual rates in effect at December 31, 2022, including fixed and variable rates:
| | | | | | | | | | | | | | | | | | | | | | | |
| (in millions) | Range of
Interest Rate(s) | | Maturity
Date(s) | | December 31, 2022 | | December 31, 2021 |
| Short-term debt issued or borrowed by Corebridge: | | | | | | | |
Affiliated senior promissory note with AIG | LIBOR+100bps | | 2022 | | $ | — | | $ | 8,317 |
Three-Year DDTL Facility | 5.80 | % | | 2023 | | 1,500 | | — |
| | | | | | | |
| Total short-term debt | | | | | $ | 1,500 | | $ | 8,317 |
| Long-term debt issued by Corebridge: | | | | | | | |
| Senior unsecured notes* | 3.50% - 4.40% | | 2025 - 2052 | | $ | 6,500 | | $ | — |
| Hybrid junior subordinated notes | 6.875% | | 2052 | | 1,000 | | — |
| Total long-term debt | | | | | 7,500 | | — |
| Debt issuance costs | | | | | (59) | | — |
| Total long-term debt, net of debt issuance costs | | | | | $ | 7,441 | | $ | — |
* Interest rates reflect contractual amounts and do not reflect the effective borrowing rate after giving effect to the cash flow hedges.
SENIOR UNSECURED NOTES AND DELAYED DRAW TERM LOAN
For further details regarding the Senior unsecured notes and Three-Year DDTL Facility, see Note 15 to our audited annual consolidated financial statements.
HYBRID JUNIOR SUBORDINATED NOTES
For further details regarding the Hybrid junior subordinated notes, see Note 15 to our audited annual consolidated financial statements.
AFFILIATED NOTE
In November 2021, Corebridge Parent issued an $8.3 billion senior promissory note to AIG. We used the net proceeds from the senior unsecured notes, the net proceeds from the hybrid junior subordinated notes and a portion of the borrowing of the Three-Year DDTL Facility, discussed in Note 15 to our audited annual consolidated financial statements, to repay the principal balance and accrued interest of this note to AIG. The interest rate per annum was equal to LIBOR plus 100 basis points and accrued semi-annually in arrears on March 1 and September 1 of each year, beginning on March 1, 2022.
AFFILIATED CREDIT FACILITIES
Corebridge Parent has entered into two revolving loan facilities where our participating subsidiaries can, on a several basis, borrow monies from Corebridge Parent subject to the terms and conditions stated therein. Principal amounts borrowed under each of these facilities could be repaid and re-borrowed, in whole or in part, from time to time, without penalty. As of December 31, 2022, there were no amounts owed under these facilities.
INTERCOMPANY LENDING FACILITIES
Corebridge Parent maintains two uncommitted intercompany lending facilities for its life insurance companies and certain other affiliates for short-term financing needs.
REVOLVING CREDIT AGREEMENT
On May 12, 2022, Corebridge Parent entered into the Revolving Credit Agreement (the “Credit Agreement”).
For further details regarding the Revolving credit agreement, see Note 15 to our audited annual consolidated financial statements.
LETTERS OF CREDIT
Effective July 28, 2022, Corebridge Parent replaced AIG as applicant and guarantor on two letters of credit totaling £80 million, for the benefit of AIG Life (United Kingdom). Effective January 1, 2023, Corebridge Parent replaced this letter of credit with a single letter of credit of £80 million. The letter of credit supports AIG Life (United Kingdom)’s capital position and will be counted as Tier 2 capital under EU Solvency II regulations as approved by the Prudential Regulation Authority.
AIG Bermuda had a $250 million letter of credit guaranteed by AIG that is used to support the credit for reinsurance provided by AIG Bermuda. Effective May 9, 2022, the letter of credit was reduced from $250 million to $175 million, and effective May 12, 2022, Corebridge Parent has replaced AIG as the guarantor.
For further details regarding the letters of credits, see Note 15 to our audited annual consolidated financial statements.
Corebridge Parent is the guarantor of a promissory note between AGL and SAFG Capital LLC to fund warehousing the origination of GRE transactions and CLO transactions.
Corebridge Parent entered into a general guarantee in favor of each holder of any monetary obligation or liability of Corebridge Markets, LLC, which transacts in various capital markets instruments.
Corebridge Parent entered into a Capital and Liquidity Support Agreement with VALIC Trust Company Inc. for regulatory reasons.
Supplementary Insurance Information
| | | | | | | | | | | | | | | | | | | | | | | |
| At December 31, 2022 and 2021 | | | | | | | Schedule III |
| Segment (in millions) |
Deferred Policy
Acquisition Costs
and
Value of Business Acquired | | Future Policy
Benefits | | Policy and
Contract
Claims | | Unearned
Premiums |
| 2022 | | | | | | | |
| Individual Retirement | $ | 4,646 | | | $ | 1,359 | | | $ | 41 | | | $ | — | |
| Group Retirement | 1,061 | | | 223 | | | 1 | | | — | |
| Life Insurance | 4,805 | | | 13,354 | | | 1,229 | | | 54 | |
| Institutional Markets | 51 | | | 13,745 | | | 40 | | | — | |
| Corporate and Other | — | | | 21,837 | | | 122 | | | 6 | |
| Total Corebridge | $ | 10,563 | | | $ | 50,518 | | | $ | 1,433 | | | $ | 60 | |
| 2021 | | | | | | | |
| Individual Retirement | $ | 4,607 | | | $ | 1,496 | | | $ | 30 | | | $ | — | |
| Group Retirement | 1,079 | | | 275 | | | 1 | | | — | |
| Life Insurance | 4,874 | | | 18,535 | | | 1,370 | | | 62 | |
| Institutional Markets | 38 | | | 15,109 | | | 59 | | | — | |
| Corporate and Other | — | | | 28,855 | | | 67 | | | 6 | |
| Total Corebridge | $ | 10,598 | | | $ | 64,270 | | | $ | 1,527 | | | $ | 68 | |
| | | | | | | | | | | | | | | | | | | | | | | | | | | | | | | | | | | |
| For the years ended December 31, 2022, 2021 and 2020 |
| Segment (in millions) | Premiums
and
Policy
Fees | | Net
Investment
Income | | Other Income(a) | | Benefits(b) | | Amortization of
Deferred Policy
Acquisition Costs
and
Value of
Business Acquired | | Other
Operating Expenses |
| 2022 | | | | | | | | | | | |
| Individual Retirement | $ | 976 | | | $ | 3,872 | | | $ | 463 | | | $ | 2,222 | | | $ | 523 | | | $ | 936 | |
| Group Retirement | 435 | | | 1,976 | | | 312 | | | 1,186 | | | 80 | | | 705 | |
| Life Insurance | 3,427 | | | 1,386 | | | 126 | | | 3,338 | | | 410 | | | 740 | |
| Institutional Markets | 3,085 | | | 1,017 | | | 3 | | | 3,706 | | | 7 | | | 96 | |
| Corporate and Other | 82 | | | 1,325 | | | 121 | | | — | | | — | | | 680 | |
| Total Corebridge | $ | 8,005 | | | $ | 9,576 | | | $ | 1,025 | | | $ | 10,452 | | | $ | 1,020 | | | $ | 3,157 | |
| 2021 | | | | | | | | | | | |
| Individual Retirement | $ | 991 | | | $ | 4,356 | | | $ | 592 | | | $ | 2,112 | | | $ | 451 | | | $ | 1,049 | |
| Group Retirement | 502 | | | 2,396 | | | 337 | | | 1,191 | | | 78 | | | 722 | |
| Life Insurance | 3,126 | | | 1,614 | | | 110 | | | 3,211 | | | 416 | | | 790 | |
| Institutional Markets | 3,953 | | | 1,134 | | | 2 | | | 4,435 | | | 6 | | | 103 | |
| Corporate and Other | 86 | | | 2,172 | | | 134 | | | — | | | — | | | 385 | |
| Total Corebridge | $ | 8,658 | | | $ | 11,672 | | | $ | 1,175 | | | $ | 10,949 | | | $ | 951 | | | $ | 3,049 | |
| 2020 | | | | | | | | | | | |
| Individual Retirement | $ | 1,013 | | | $ | 4,154 | | | $ | 577 | | | $ | 2,170 | | | $ | 523 | | | $ | 1,011 | |
| Group Retirement | 462 | | | 2,193 | | | 275 | | | 1,200 | | | 7 | | | 741 | |
| Life Insurance | 2,909 | | | 1,520 | | | 96 | | | 3,593 | | | 8 | | | 764 | |
| Institutional Markets | 2,757 | | | 917 | | | 2 | | | 3,167 | | | 5 | | | 117 | |
| Corporate and Other | 74 | | | 1,732 | | | 122 | | | — | | | — | | | 314 | |
| Total Corebridge | $ | 7,215 | | | $ | 10,516 | | | $ | 1,072 | | | $ | 10,130 | | | $ | 543 | | | $ | 2,947 | |
(a) Other income represents advisory fee income and other income balances.
(b) Benefits represents policyholder benefits and interest credited to policyholder account balances.
Reinsurance
At December 31, 2022, 2021 and 2020 and for the years then ended
| | | | | | | | | | | | | | | | | | | | | | | | | | | | | |
| | | | | | | | | Schedule IV |
| (in millions) | Gross
Amount | | Ceded to
Other
Companies | | Assumed
from Other
Companies | | Net Amount | | Percent of
Amount Assumed
to Net |
| 2022 | | | | | | | | | |
| Life insurance in force | $ | 1,280,831 | | $ | 346,879 | | $ | 188 | | $ | 934,140 | | —% |
| Premiums Earned: | | | | | | | | | |
| Life Insurance and Annuities | $ | 4,651 | | 934 | | 1,318 | | 5,035 | | 26.2% |
| Accident and Health | 88 | | 32 | | — | | 56 | | — |
| Total | $ | 4,739 | | 966 | | 1,318 | | 5,091 | | 25.9% |
| 2021 | | | | | | | | | |
| Life insurance in force | $ | 1,280,090 | | $ | 363,008 | | $ | 192 | | $ | 917,274 | | — |
| Premiums Earned: | | | | | | | | | |
| Life Insurance and Annuities | $ | 4,503 | | 1,179 | | 2,265 | | 5,589 | | 40.5% |
| Accident and Health | 100 | | 36 | | — | | 64 | | — |
| Total | $ | 4,603 | | 1,215 | | 2,265 | | 5,653 | | 40.1% |
| 2020 | | | | | | | | | |
| Life insurance in force | $ | 1,243,389 | | $ | 349,453 | | $ | 225 | | $ | 894,161 | | — |
| Premiums Earned: | | | | | | | | | |
| Life Insurance and Annuities | $ | 4,273 | | 1,072 | | 1,073 | | 4,274 | | 25.1% |
| Accident and Health | 111 | | 44 | | — | | 67 | | — |
| Total | $ | 4,384 | | $ | 1,116 | | $ | 1,073 | | $ | 4,341 | | 24.7% |