Fiscal Year |
Summary Compensation Table Total for PEO1 ($) |
Compensation Actually Paid to PEO1,2,3 ($) |
Average Summary Compensation Table Total for Non-PEO NEOs1 ($) |
Average Compensation Actually Paid to Non-PEO NEOs1,2,3 ($) |
Value of Initial Fixed $100 Investment based on Total Stockholder Return (“TSR”)4 ($) |
Net Income ($ Millions) |
2022 |
5,411,291 |
13,264,512 |
1,881,353 |
3,867,364 |
166.96 |
(68.9) |
2021 |
4,059,119 |
2,805,866 |
1,426,477 |
1,147,131 |
81.71 |
(55.0) |
2021 |
2022 |
Marianne Mancini |
Marianne Mancini |
Greg Zante |
Greg Zante |
Fiscal Year |
Summary Compensation Table Total for PEO |
Exclusion of Stock Awards and Option Awards for PEO |
Inclusion of Equity Values for PEO |
Compensation Actually Paid to PEO |
2022 |
5,411,291 |
(4,446,176) |
12,299,397 |
13,264,512 |
2021 |
4,059,119 |
(3,187,119) |
1,933,866 |
2,805,866 |
Fiscal Year |
Average Summary Compensation Table Total for Non-PEO NEOs |
Average Exclusion of Stock Awards and Option Awards for Non-PEO NEOs |
Average Inclusion of Equity Values for Non-PEO NEOs |
Average Compensation Actually Paid to Non-PEO NEOs |
2022 |
1,881,353 |
(1,262,943) |
3,248,955 |
3,867,364 |
2021 |
1,426,477 |
(886,977) |
607,631 |
1,147,131 |
(a) Represents the aggregate amount of the “Stock Awards” and “Option Awards” columns for our PEO reported in the Summary Compensation Table for the applicable fiscal year.
(b) Amounts reported in this column are derived from the amounts set forth in the following table for the applicable fiscal year:
Fiscal Year |
Year-End Fair Value of Equity Awards Granted During the Year That Remained Unvested as of the Last Day of the Year for PEO |
Change in Fair Value from the Last Day of the Prior Year to the Last Day of the Year of Unvested Equity Awards for PEO |
Change in Fair Value from the Last Day of the Prior Year to the Vesting Date of Unvested Equity Awards that Vested During the Year for PEO |
Total - Inclusion of |
2022 |
8,750,448 |
3,011,128 |
537,821 |
12,299,397 |
2021 |
2,472,781 |
(633,970) |
95,055 |
1,933,866 |
(c) Represents the average of the aggregate amount of the “Stock Awards” and “Option Awards” columns for the Non-PEO NEOs reported in the Summary Compensation Table for the applicable fiscal year.
(d) Amounts reported in this column are derived from the amounts set forth in the following table for the applicable fiscal year:
Fiscal Year |
Average Year-End Fair Value of Equity Awards Granted During the Year That Remained Unvested as of the Last Day of the Year for Non-PEO NEOs |
Average Change in Fair Value from the Last Day of the Prior Year to the Last Day of the Year of Unvested Equity Awards for Non-PEO NEOs |
Average Change in Fair Value from the Last Day of the Prior Year to the Vesting Date of Unvested Equity Awards that Vested During the Year for Non-PEO NEOs |
Total - Average Inclusion of |
2022 |
2,508,346 |
667,006 |
73,603 |
3,248,955 |
2021 |
693,542 |
(113,247) |
27,336 |
607,631 |
2021 |
2022 |
Marianne Mancini |
Marianne Mancini |
Greg Zante |
Greg Zante |
Fiscal Year |
Summary Compensation Table Total for PEO |
Exclusion of Stock Awards and Option Awards for PEO |
Inclusion of Equity Values for PEO |
Compensation Actually Paid to PEO |
2022 |
5,411,291 |
(4,446,176) |
12,299,397 |
13,264,512 |
2021 |
4,059,119 |
(3,187,119) |
1,933,866 |
2,805,866 |
(a) Represents the aggregate amount of the “Stock Awards” and “Option Awards” columns for our PEO reported in the Summary Compensation Table for the applicable fiscal year.
(b) Amounts reported in this column are derived from the amounts set forth in the following table for the applicable fiscal year:
Fiscal Year |
Year-End Fair Value of Equity Awards Granted During the Year That Remained Unvested as of the Last Day of the Year for PEO |
Change in Fair Value from the Last Day of the Prior Year to the Last Day of the Year of Unvested Equity Awards for PEO |
Change in Fair Value from the Last Day of the Prior Year to the Vesting Date of Unvested Equity Awards that Vested During the Year for PEO |
Total - Inclusion of |
2022 |
8,750,448 |
3,011,128 |
537,821 |
12,299,397 |
2021 |
2,472,781 |
(633,970) |
95,055 |
1,933,866 |
Fiscal Year |
Average Summary Compensation Table Total for Non-PEO NEOs |
Average Exclusion of Stock Awards and Option Awards for Non-PEO NEOs |
Average Inclusion of Equity Values for Non-PEO NEOs |
Average Compensation Actually Paid to Non-PEO NEOs |
2022 |
1,881,353 |
(1,262,943) |
3,248,955 |
3,867,364 |
2021 |
1,426,477 |
(886,977) |
607,631 |
1,147,131 |
(c) Represents the average of the aggregate amount of the “Stock Awards” and “Option Awards” columns for the Non-PEO NEOs reported in the Summary Compensation Table for the applicable fiscal year.
(d) Amounts reported in this column are derived from the amounts set forth in the following table for the applicable fiscal year:
Fiscal Year |
Average Year-End Fair Value of Equity Awards Granted During the Year That Remained Unvested as of the Last Day of the Year for Non-PEO NEOs |
Average Change in Fair Value from the Last Day of the Prior Year to the Last Day of the Year of Unvested Equity Awards for Non-PEO NEOs |
Average Change in Fair Value from the Last Day of the Prior Year to the Vesting Date of Unvested Equity Awards that Vested During the Year for Non-PEO NEOs |
Total - Average Inclusion of |
2022 |
2,508,346 |
667,006 |
73,603 |
3,248,955 |
2021 |
693,542 |
(113,247) |
27,336 |
607,631 |
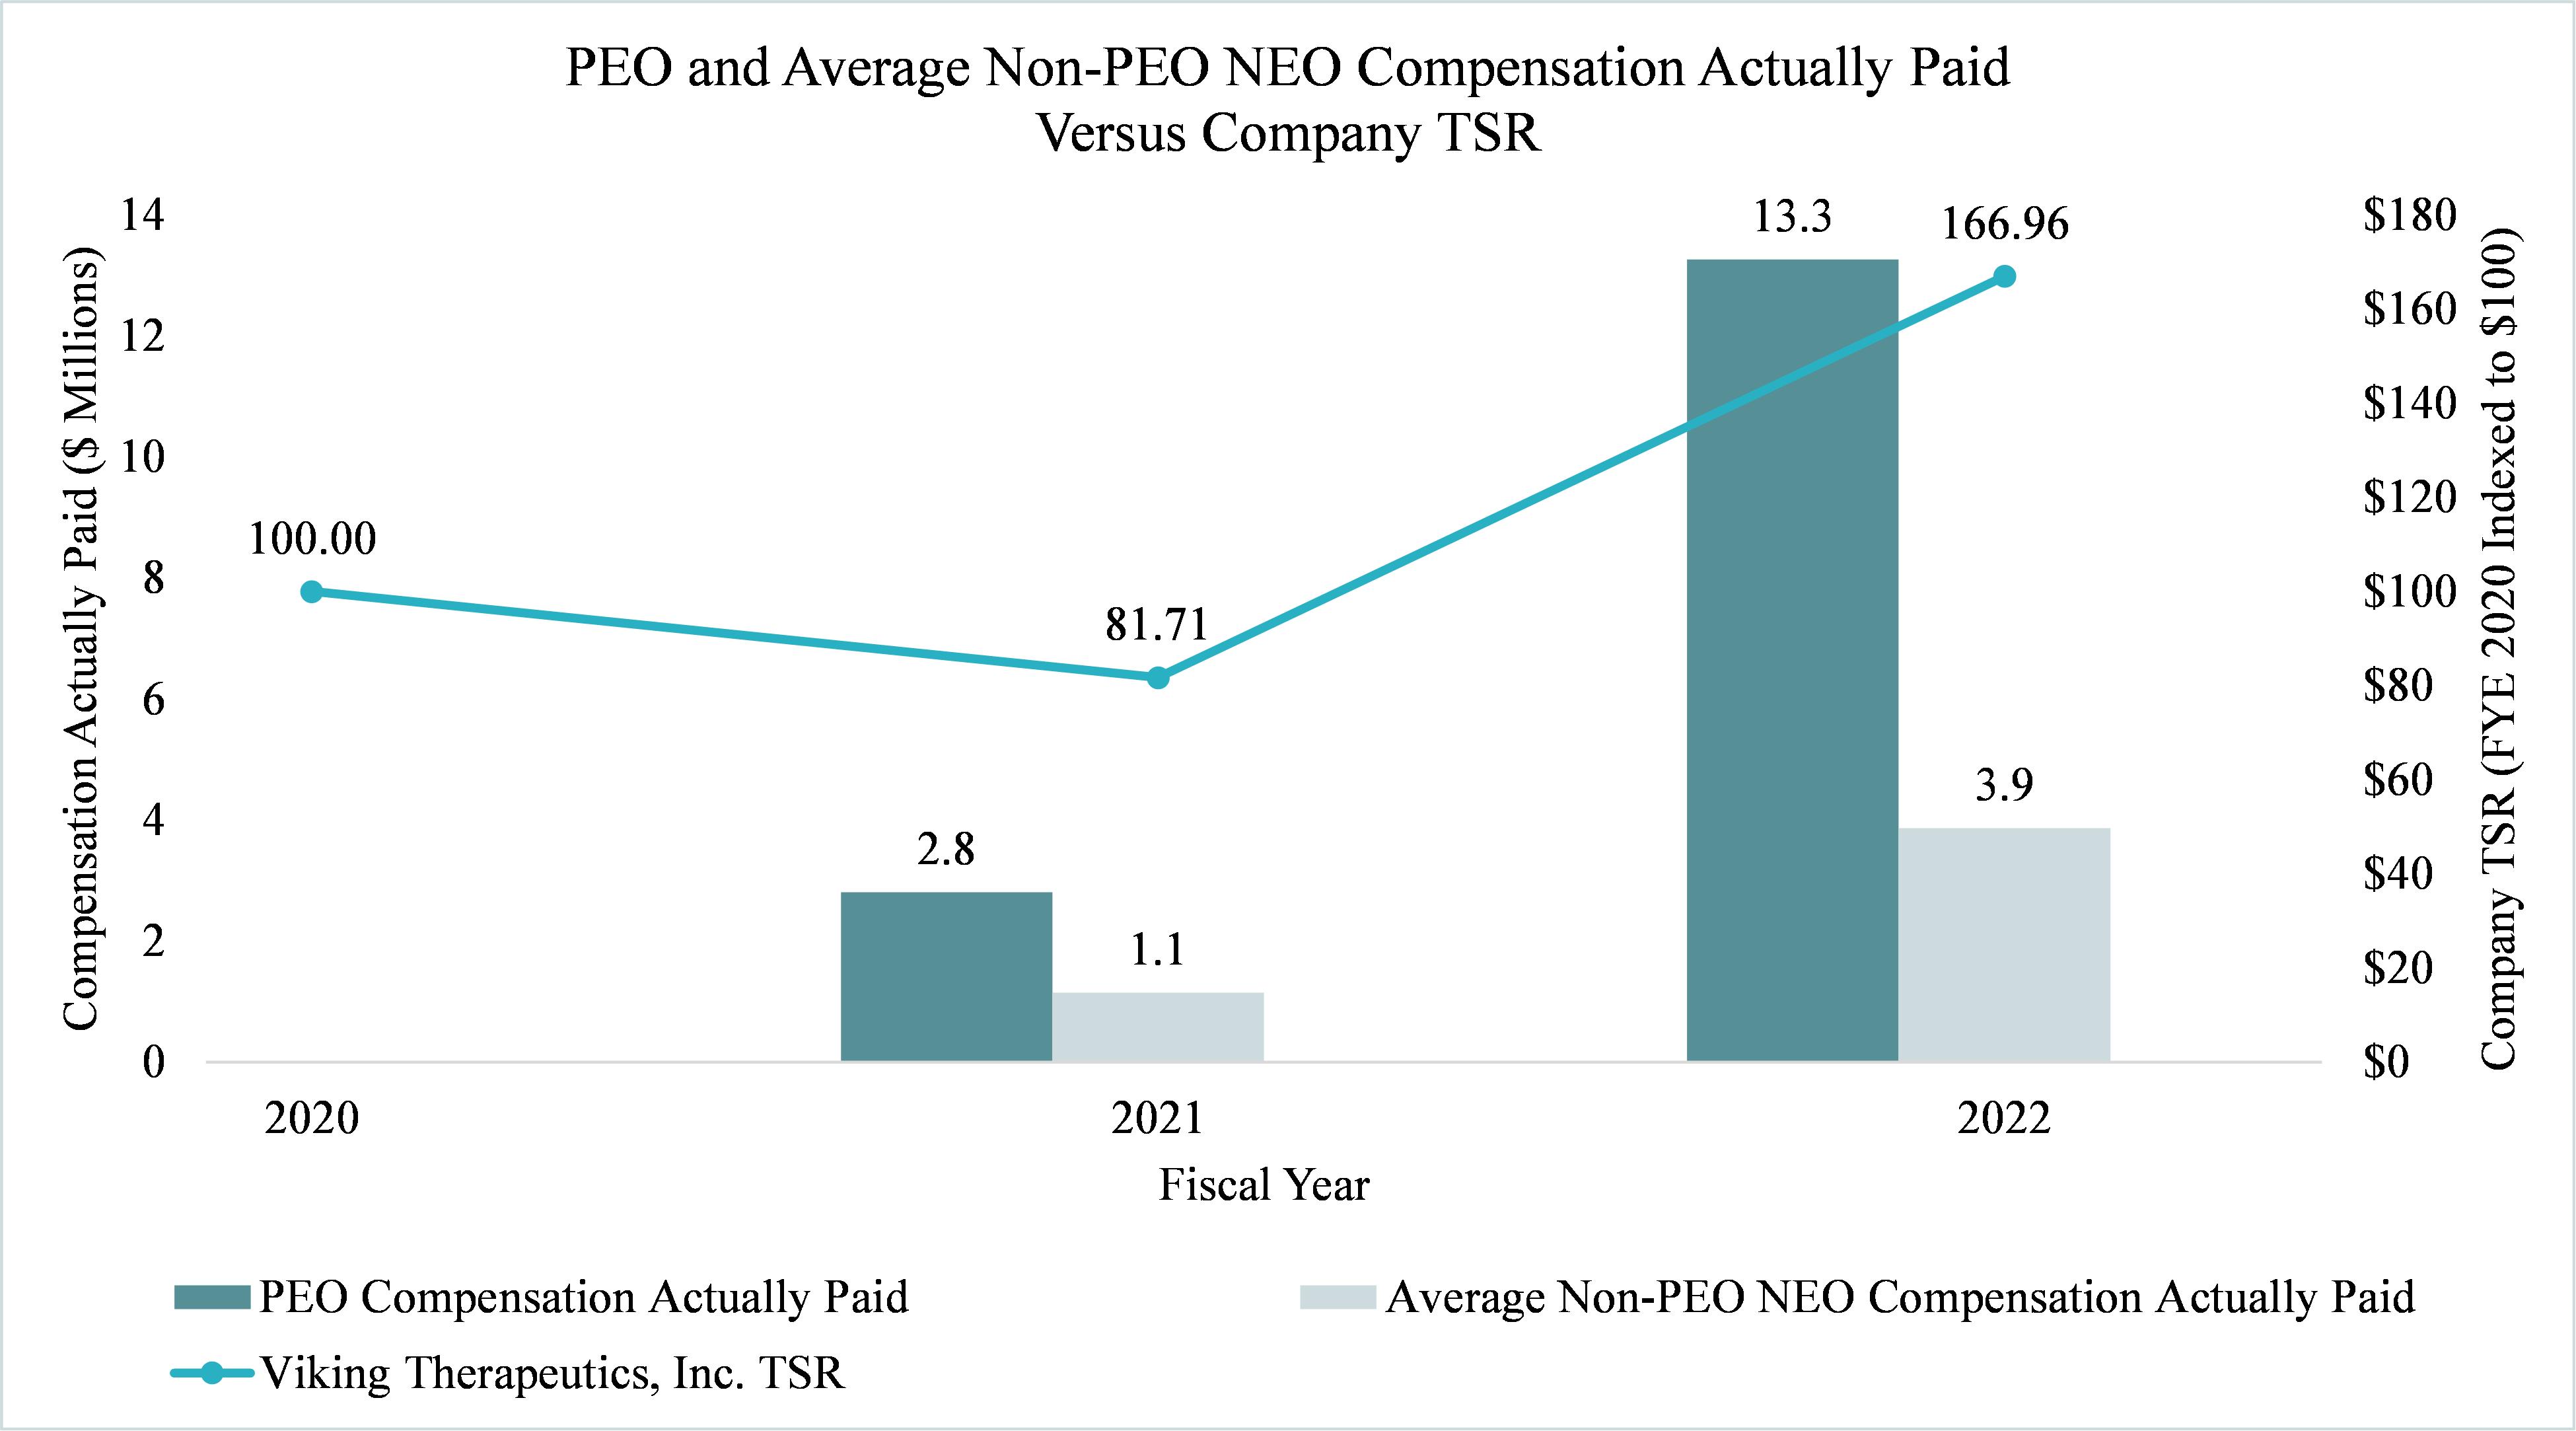
The following chart sets forth the relationship between the CAP to our PEO, the average of the CAP to our Non-PEO NEOs, and our cumulative TSR over the two most recently completed fiscal years.
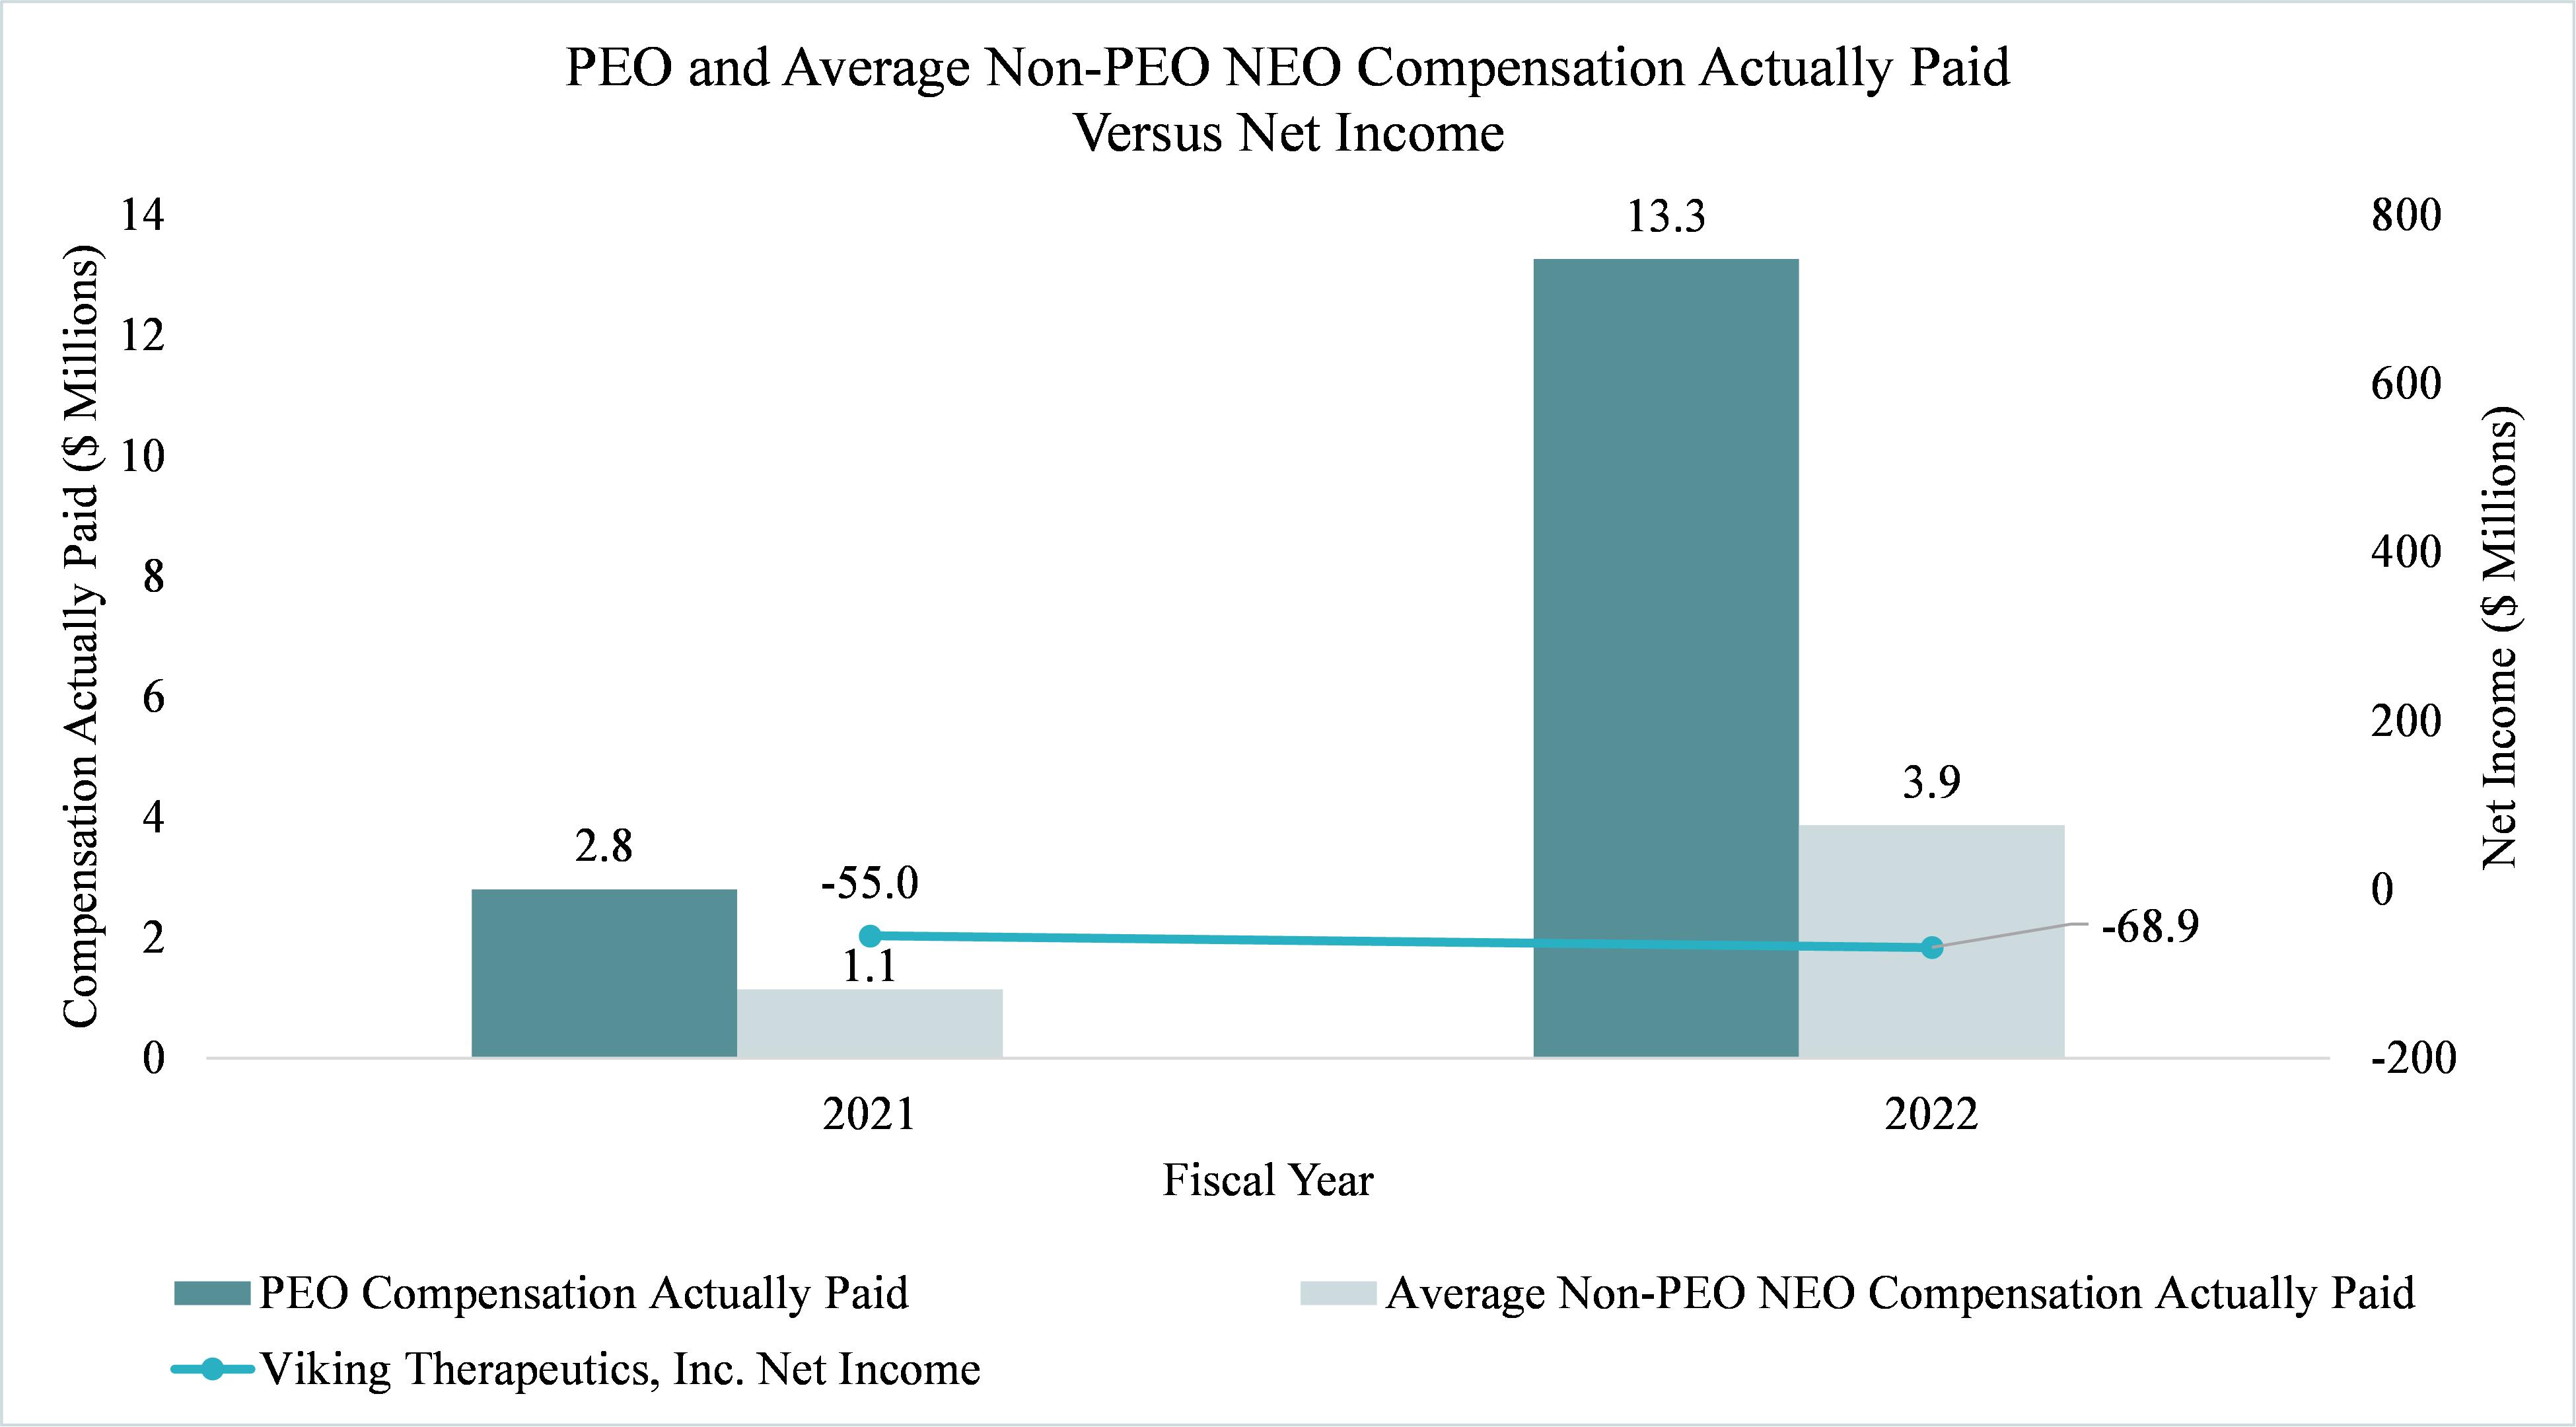
The following chart sets forth the relationship between the CAP to our PEO, the average of the CAP to our Non-PEO NEOs, and our Net Income during the two most recently completed fiscal years.