Pay vs Performance Disclosure - USD ($)
Dec. 31, 2022
Dec. 31, 2021
Dec. 31, 2020
Pay Versus Performance
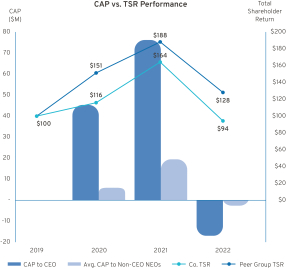
Pursuant to Item 402(v) of Regulation S-K, we are providing the following information about the relationship between CAP for the Company’s CEO and non-CEO NEOs and certain aspects of the financial performance of the Company. The CAP values disclosed do not reflect the actual amount of compensation paid to our NEOs during the applicable year. The Compensation Committee does not utilize CAP as a basis for making compensation decisions. For information regarding compensation decisions made by our Compensation Committee, refer to the “Compensation Discussion and An
alysis
” section beginning on page 51
. Year |
Summary Compensation Table Total for CEO (1) ($) |
CAP to CEO (3) ($) |
Average Summary Compensation Table Total for Non-CEO NEOs (2) ($) |
Average CAP to Non-CEO NEOs (3) ($) |
|
Value of Initial Fixed $100 Investment Based On: |
|
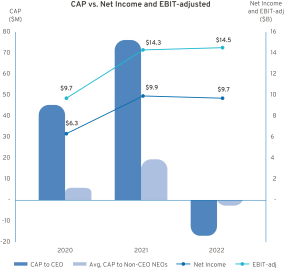
Net Income (6) ($B) |
EBIT- adjusted (7) ($B) |
|||||||||||||||||||||||||||
| |
TSR (4) ($) |
Peer Group TSR (5) ($) |
|
|||||||||||||||||||||||||||||||||
2022 |
28,979,570 |
(16,991,516) |
10,539,930 |
(2,724,335) |
94 |
128 |
9.708 |
14.474 |
||||||||||||||||||||||||||||
2021 |
29,136,780 |
76,096,506 |
9,982,519 |
19,443,928 |
164 |
188 |
9.945 |
14.295 |
||||||||||||||||||||||||||||
2020 |
23,657,987 |
45,185,399 |
6,632,869 |
5,817,820 |
116 |
151 |
6.321 |
9.710 |
||||||||||||||||||||||||||||
(1) |
Ms. Barra served as our CEO in 2022, 2021, and 2020. |
(2) |
Non-CEO NEOs in 2022 and 2021 included Messrs. Jacobson, Reuss, Parks, and Carlisle. Non-CEO NEOs in 2020 included Messrs. Jacobson, Reuss, Parks, and Carlisle, Ms. Dhivya Suryadevara (Former Executive Vice President and Chief Financial Officer), Mr. John Stapleton (Vice President and Chief Financial Officer, North America and Former Acting Chief Financial Officer), and Mr. Barry Engle (Former Executive Vice President and President, North America). |
(3) |
Reflects CAP values computed in accordance with Item 402(v) of Regulation S-K and FASB ASC Topic 718. |
2022 |
2021 |
2020 |
||||||||||||||||||||||||||||||
CEO |
Average Non-CEO NEOs |
CEO |
Average Non-CEO NEOs |
CEO |
Average Non-CEO NEOs |
|||||||||||||||||||||||||||
SCT Total |
28,979,570 |
10,539,930 |
29,136,780 |
9,982,519 |
23,657,987 |
6,632,869 |
||||||||||||||||||||||||||
Less: Change in Actuarial Present Value Reported in the “Change in Pension Value and NQ Deferred Compensation Earnings” Column of the SCT |
— |
— |
— |
— |
(423,608 |
) |
(141,675 |
) | ||||||||||||||||||||||||
Plus: Service Cost for Pension Plans |
— |
— |
— |
— |
— |
149 |
||||||||||||||||||||||||||
Less: Amount Reported in the “Stock Awards” Column of the SCT |
(14,625,000 |
) |
(5,470,294 |
) |
(14,582,198 |
) |
(5,069,059 |
) |
(13,093,722 |
) |
(3,793,686 |
) | ||||||||||||||||||||
Plus: Year-end Fair Value of Outstanding and Unvested Stock Awards Granted in the Covered Year |
8,629,590 |
3,227,799 |
18,914,281 |
6,574,982 |
18,050,565 |
3,545,877 |
||||||||||||||||||||||||||
Change in Fair Value of Outstanding and Unvested Stock Awards Granted in Prior Years |
(25,258,220 |
) |
(7,683,634 |
) |
25,646,494 |
5,307,302 |
10,087,483 |
768,879 |
||||||||||||||||||||||||
Change in Fair Value of Stock Awards that Vested in the Covered Year |
(4,942,601 |
) |
(732,230 |
) |
5,626,432 |
646,960 |
(847,866 |
) |
(1,522 |
) | ||||||||||||||||||||||
Less: Fair Value of Stock Awards Forfeited During the Covered Year |
— |
— |
— |
— |
— |
(1,617,289 |
) | |||||||||||||||||||||||||
Less: Amount Reported in the “Option Awards” Column of the SCT |
(4,875,010 |
) |
(1,823,438 |
) |
(3,937,507 |
) |
(1,368,752 |
) |
(3,750,002 |
) |
(974,378 |
) | ||||||||||||||||||||
Plus: Year-end Fair Value of Outstanding and Unvested Option Awards Granted in the Covered Year |
2,584,980 |
966,880 |
3,694,210 |
1,284,177 |
10,379,470 |
1,434,466 |
||||||||||||||||||||||||||
Change in Fair Value of Outstanding and Unvested Option Awards Granted in Prior Years |
(5,055,582 |
) |
(1,267,702 |
) |
6,628,520 |
1,281,139 |
2,881,004 |
231,707 |
||||||||||||||||||||||||
2022 |
2021 |
2020 |
||||||||||||||||||||||||||||||
CEO |
Average Non-CEO NEOs |
CEO |
Average Non-CEO NEOs |
CEO |
Average Non-CEO NEOs |
|||||||||||||||||||||||||||
Change in Fair Value of Option Awards that Vested in the Covered Year |
(2,429,243 |
) |
(481,646 |
) |
4,969,494 |
804,660 |
(1,755,912 |
) |
(177,797 |
) | ||||||||||||||||||||||
Less: Fair Value of Option Awards Forfeited During the Covered Year |
— |
— |
— |
— |
— |
(89,780 |
) | |||||||||||||||||||||||||
CAP Total |
(16,991,516 |
) |
(2,724,335 |
) |
76,096,506 |
19,443,928 |
45,185,399 |
5,817,820 |
||||||||||||||||||||||||
(4) |
Represents the cumulative TSR of the Company of an initial investment of $100 for the measurement period beginning December 31, 2019, and ending December 31, 2022, 2021, or 2020, respectively, calculated in accordance with Item 201(e) of Regulation S-K as required under Item 402(v) of Regulation S-K. |
(5) |
Represents the cumulative TSR of the Dow Jones Automobiles & Parts Titans 30 Index (the “Peer Group TSR”) of an initial investment of $100 for the measurement period beginning December 31, 2019, and ending December 31, 2022, 2021, or 2020, respectively, calculated in accordance with Item 201(e) of Regulation S-K as required under Item 402(v) of Regulation S-K. |
(6) |
Reflects net income as shown in the Company’s Annual Report on Form 10-K for the years ended December 31, 2022, 2021, and 2020. |
(7) |
Reflects EBIT-adjusted, the company-selected measure for 2022, as shown in the Company’s Annual Report on Form 10-K for the years ended December 31, 2022, 2021, and 2020. Refer to Appendix A for a reconciliation of EBIT-adjusted to its closest comparable GAAP measure. Please note EBIT-adjusted may not have been the company-selected measure for 2021 and 2020, and we may determine a different measure to be the company-selected measure in future years. |
Non-CEO
NEOs in 2020 included Messrs. Jacobson, Reuss, Parks, and Carlisle, Ms. Dhivya Suryadevara (Former Executive Vice President and Chief Financial Officer), Mr. John Stapleton (Vice President and Chief Financial Officer, North America and Former Acting Chief Financial Officer), and Mr. Barry Engle (Former Executive Vice President and President, North America).
(3) |
Reflects CAP values computed in accordance with Item 402(v) of Regulation S-K and FASB ASC Topic 718. |
2022 |
2021 |
2020 |
||||||||||||||||||||||||||||||
CEO |
Average Non-CEO NEOs |
CEO |
Average Non-CEO NEOs |
CEO |
Average Non-CEO NEOs |
|||||||||||||||||||||||||||
SCT Total |
28,979,570 |
10,539,930 |
29,136,780 |
9,982,519 |
23,657,987 |
6,632,869 |
||||||||||||||||||||||||||
Less: Change in Actuarial Present Value Reported in the “Change in Pension Value and NQ Deferred Compensation Earnings” Column of the SCT |
— |
— |
— |
— |
(423,608 |
) |
(141,675 |
) | ||||||||||||||||||||||||
Plus: Service Cost for Pension Plans |
— |
— |
— |
— |
— |
149 |
||||||||||||||||||||||||||
Less: Amount Reported in the “Stock Awards” Column of the SCT |
(14,625,000 |
) |
(5,470,294 |
) |
(14,582,198 |
) |
(5,069,059 |
) |
(13,093,722 |
) |
(3,793,686 |
) | ||||||||||||||||||||
Plus: Year-end Fair Value of Outstanding and Unvested Stock Awards Granted in the Covered Year |
8,629,590 |
3,227,799 |
18,914,281 |
6,574,982 |
18,050,565 |
3,545,877 |
||||||||||||||||||||||||||
Change in Fair Value of Outstanding and Unvested Stock Awards Granted in Prior Years |
(25,258,220 |
) |
(7,683,634 |
) |
25,646,494 |
5,307,302 |
10,087,483 |
768,879 |
||||||||||||||||||||||||
Change in Fair Value of Stock Awards that Vested in the Covered Year |
(4,942,601 |
) |
(732,230 |
) |
5,626,432 |
646,960 |
(847,866 |
) |
(1,522 |
) | ||||||||||||||||||||||
Less: Fair Value of Stock Awards Forfeited During the Covered Year |
— |
— |
— |
— |
— |
(1,617,289 |
) | |||||||||||||||||||||||||
Less: Amount Reported in the “Option Awards” Column of the SCT |
(4,875,010 |
) |
(1,823,438 |
) |
(3,937,507 |
) |
(1,368,752 |
) |
(3,750,002 |
) |
(974,378 |
) | ||||||||||||||||||||
Plus: Year-end Fair Value of Outstanding and Unvested Option Awards Granted in the Covered Year |
2,584,980 |
966,880 |
3,694,210 |
1,284,177 |
10,379,470 |
1,434,466 |
||||||||||||||||||||||||||
Change in Fair Value of Outstanding and Unvested Option Awards Granted in Prior Years |
(5,055,582 |
) |
(1,267,702 |
) |
6,628,520 |
1,281,139 |
2,881,004 |
231,707 |
||||||||||||||||||||||||
2022 |
2021 |
2020 |
||||||||||||||||||||||||||||||
CEO |
Average Non-CEO NEOs |
CEO |
Average Non-CEO NEOs |
CEO |
Average Non-CEO NEOs |
|||||||||||||||||||||||||||
Change in Fair Value of Option Awards that Vested in the Covered Year |
(2,429,243 |
) |
(481,646 |
) |
4,969,494 |
804,660 |
(1,755,912 |
) |
(177,797 |
) | ||||||||||||||||||||||
Less: Fair Value of Option Awards Forfeited During the Covered Year |
— |
— |
— |
— |
— |
(89,780 |
) | |||||||||||||||||||||||||
CAP Total |
(16,991,516 |
) |
(2,724,335 |
) |
76,096,506 |
19,443,928 |
45,185,399 |
5,817,820 |
||||||||||||||||||||||||
Tabular List of Most-Important Measures |
EBIT-adjusted |
EBIT-adjusted Margin |
Relative TSR |