| Value of Initial Fixed $100 Investment Based On: | ||||||||||||||||||||||||||||||||
| Year | Summary Compensation Table Total for PEO1 | Compensation Actually Paid to PEO2 | Average Summary Compensation Table Total for Non-PEO NEOs3 | Average Compensation Actually Paid to Non-PEO NEOs4 | Total Shareholder Return5 | Peer Group Total Shareholder Return6 |
Net Income (in thousands)7 |
Adjusted EBIT (in thousands)8 |
||||||||||||||||||||||||
| (a) | (b) | (c) | (d) | (e) | (f) | (g) | (h) | (i) | ||||||||||||||||||||||||
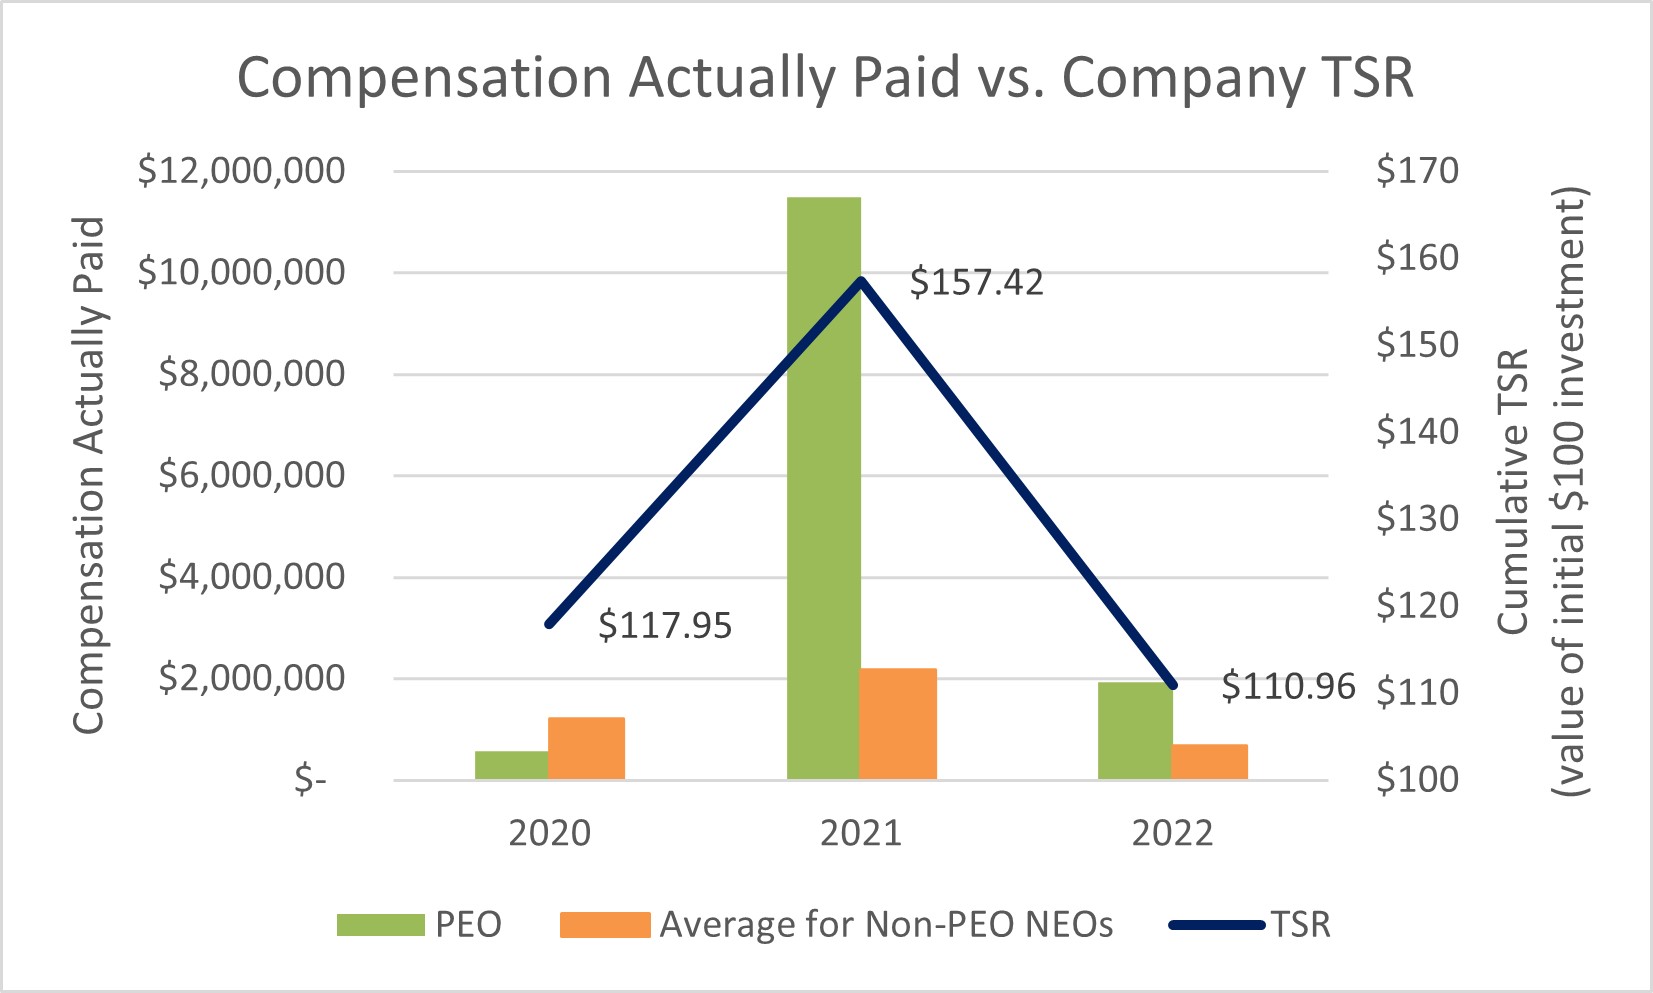
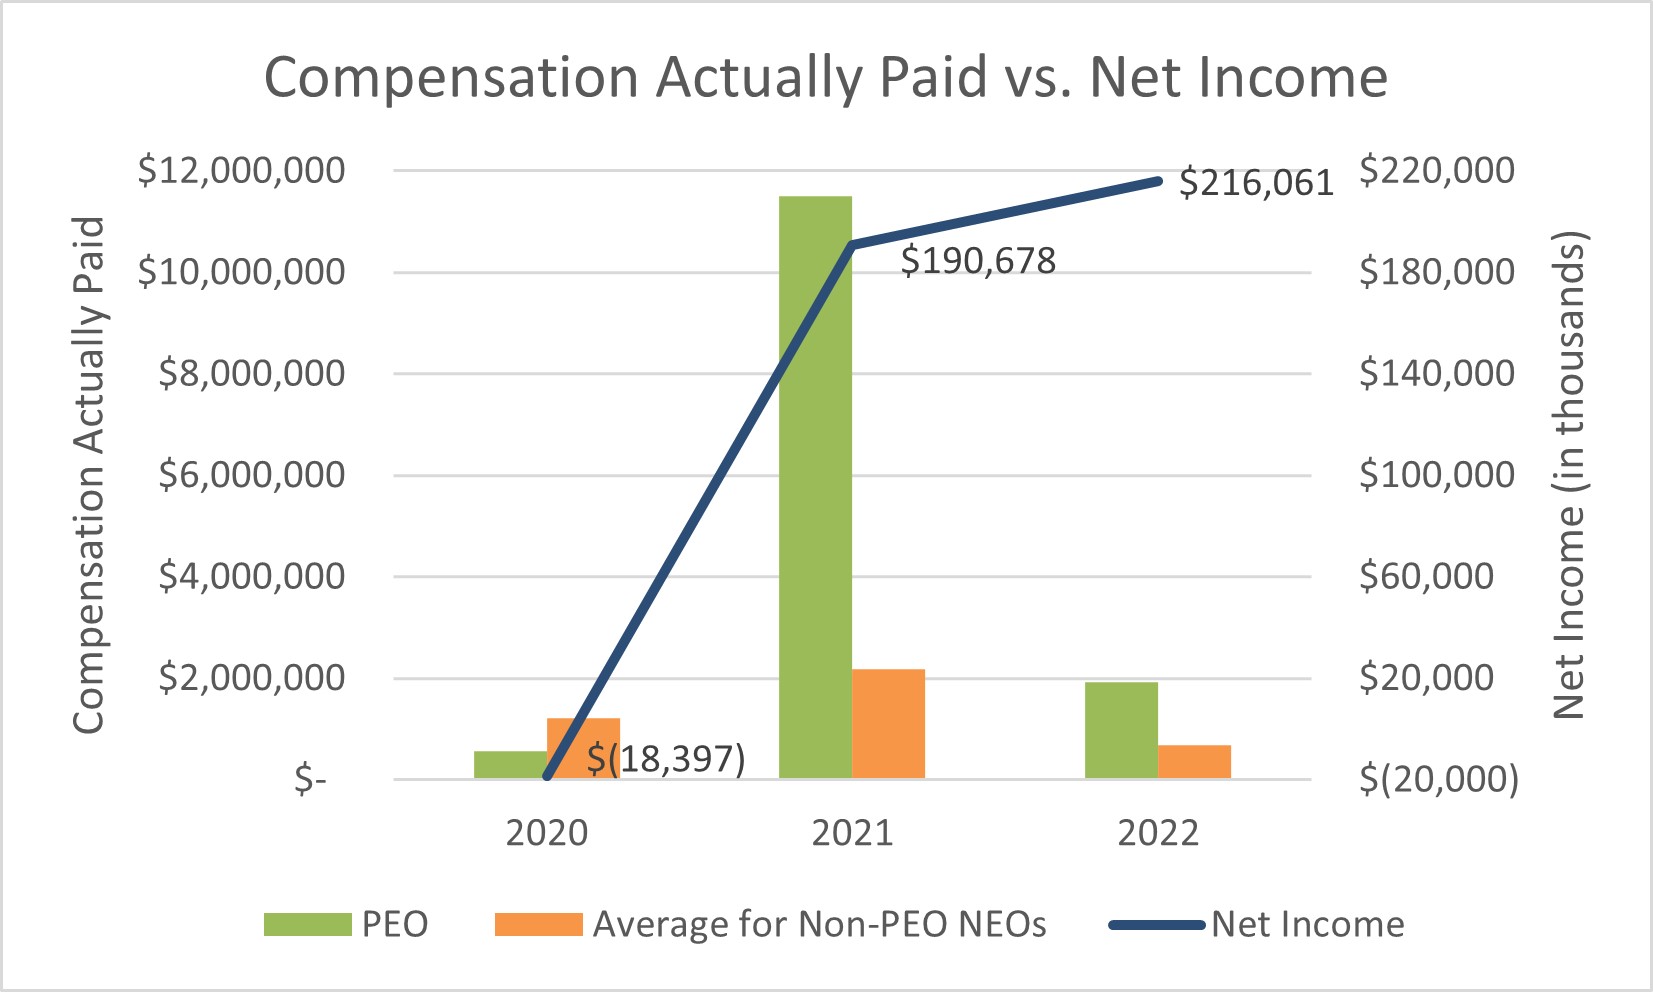
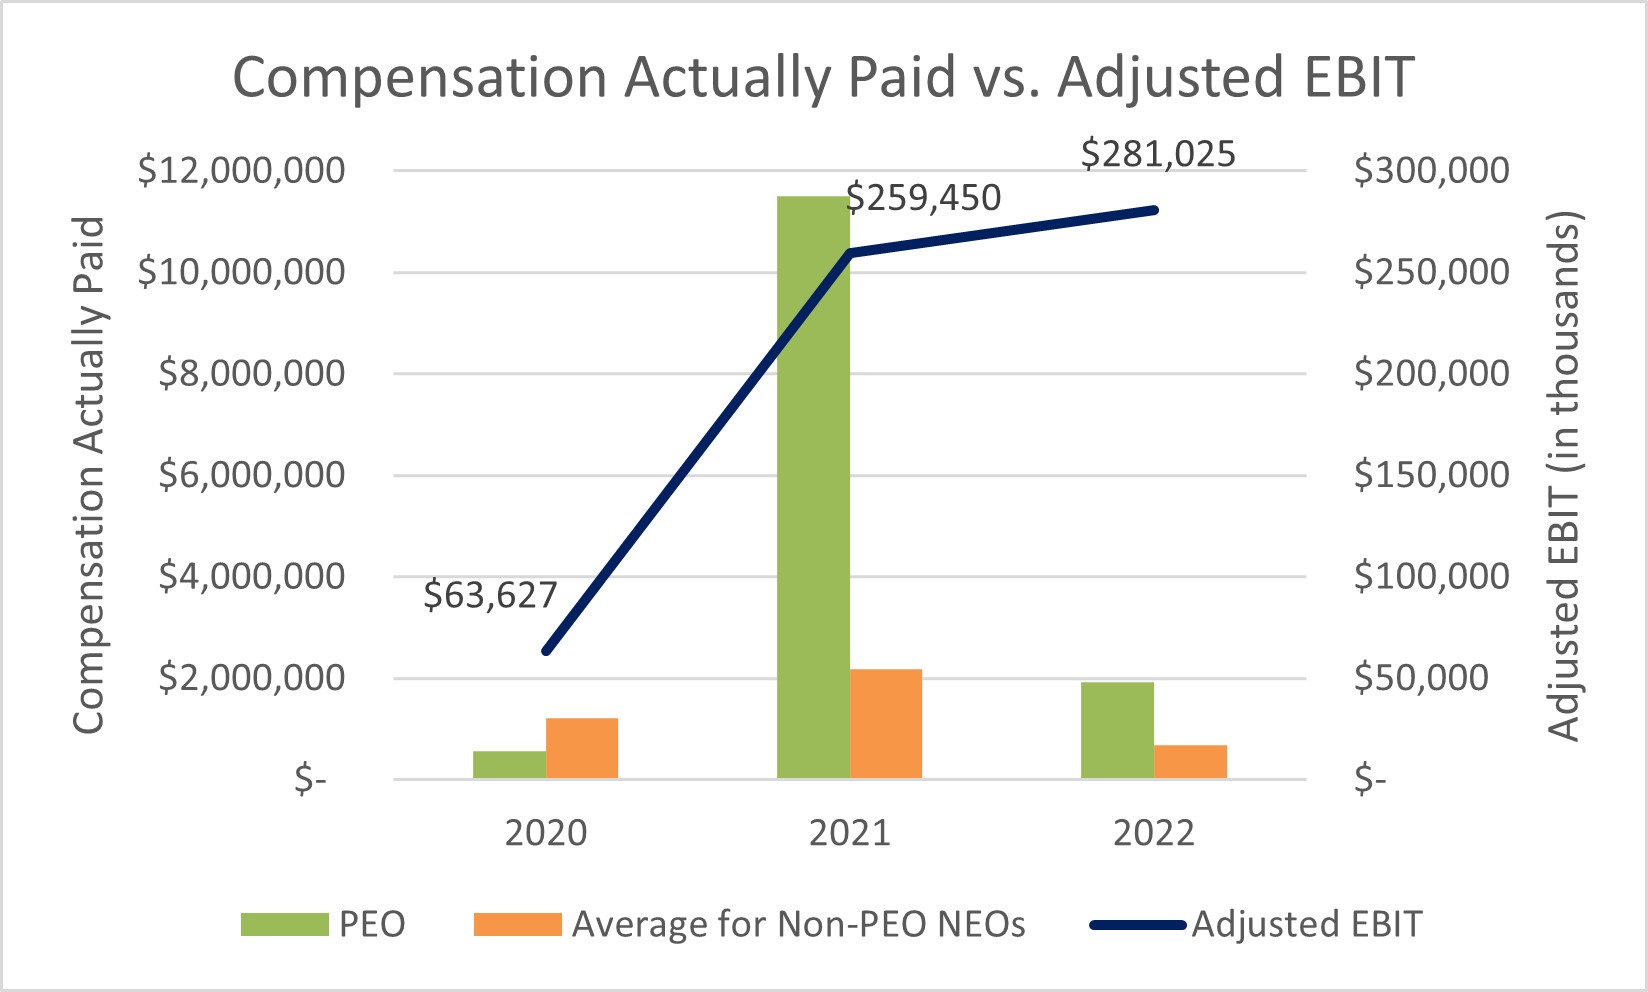
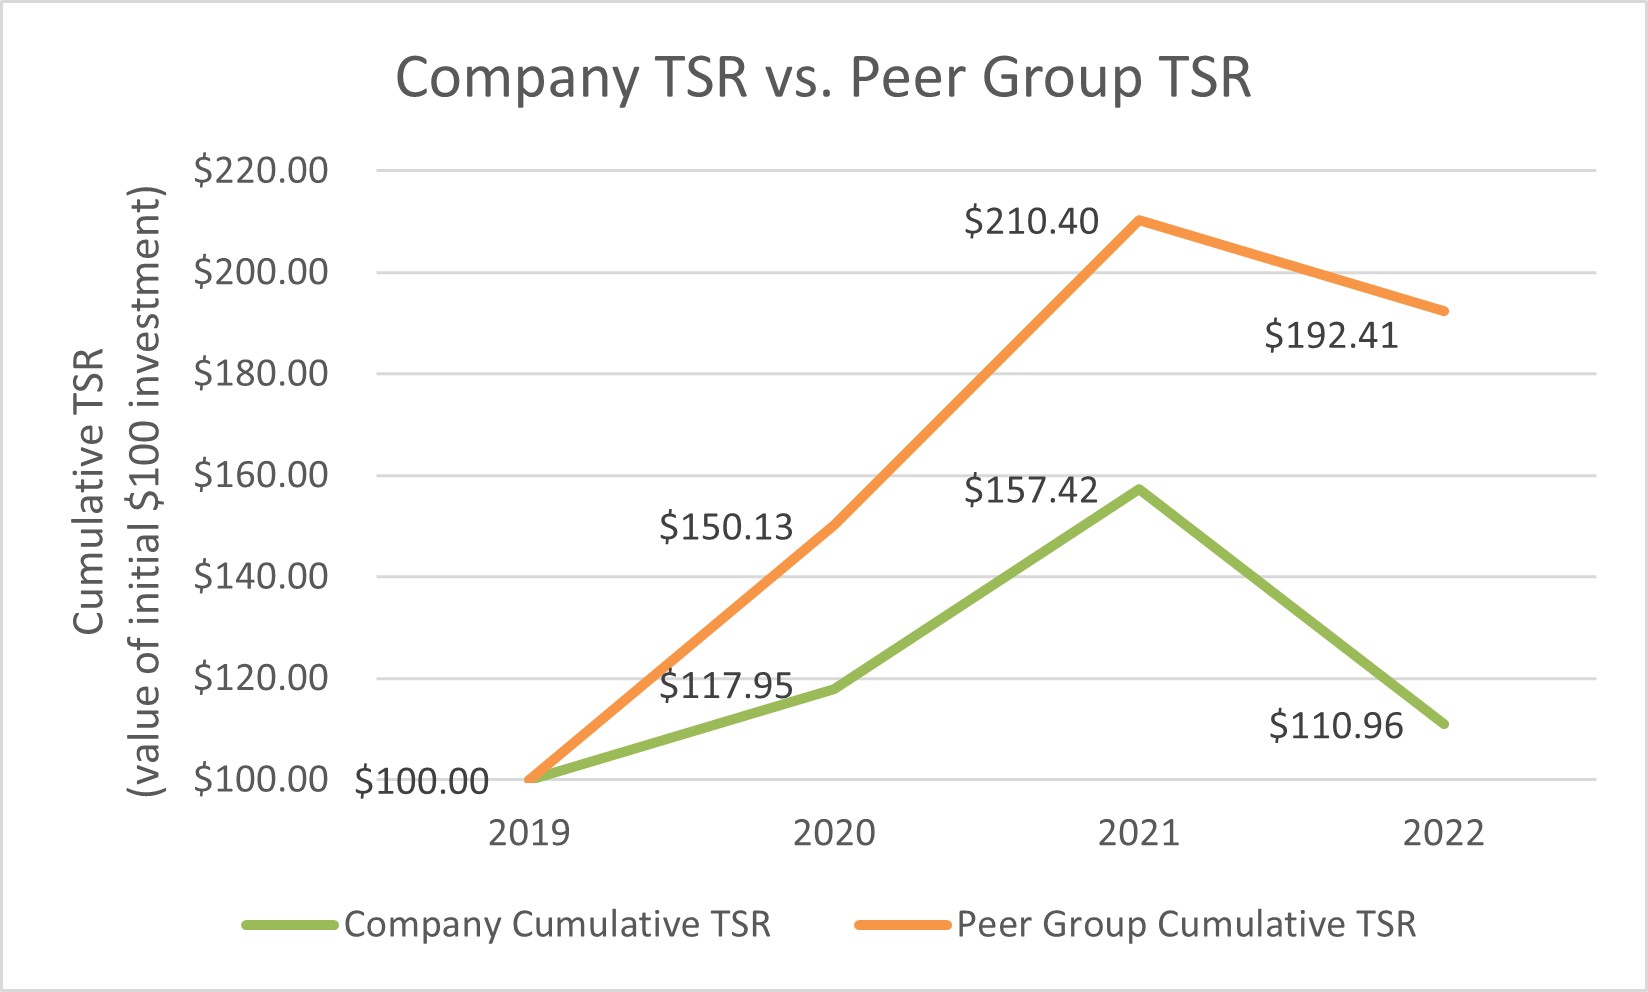
| 2022 | $ | 7,609,075 | $ | 1,935,729 | $ | 1,148,601 | $ | 686,226 | $ | 110.96 | $ | 192.41 | $ | 216,061 | $ | 281,025 | ||||||||||||||||
| 2021 | $ | 7,566,831 | $ | 11,498,936 | $ | 1,711,424 | $ | 2,175,266 | $ | 157.42 | $ | 210.40 | $ | 190,678 | $ | 259,450 | ||||||||||||||||
| 2020 | $ | 2,872,859 | $ | 562,398 | $ | 1,074,114 | $ | 1,210,677 | $ | 117.95 | $ | 150.13 | $ | (18,397 | ) | $ | 63,627 | |||||||||||||||
| Year | Reported Summary Compensation Table Total for PEO | Reported Value of Equity Awards(a) | Equity Award Adjustments(b) | Compensation Actually Paid to PEO | |||||||||||||
| 2022 | $ | 7,609,075 | $ | (5,499,990 | ) | $ | (173,356 | ) | $ | 1,935,729 | |||||||
| 2021 | $ | 7,566,831 | $ | (5,499,985 | ) | $ | 9,432,090 | $ | 11,498,936 | ||||||||
| 2020 | $ | 2,872,859 | $ | (2,360,456 | ) | $ | 49,995 | $ | 562,398 | ||||||||
| Year | Average Reported Summary Compensation Table Total for Non-PEO NEOs | Average Reported Value of Equity Awards | Average Equity Award Adjustments(a) | Average Compensation Actually Paid to Non-PEO NEOs | |||||||||||||
| 2022 | $ | 1,148,601 | $ | (250,002 | ) | $ | (212,373 | ) | $ | 686,226 | |||||||
| 2021 | $ | 1,711,424 | $ | (650,003 | ) | $ | 1,113,845 | $ | 2,175,266 | ||||||||
| 2020 | $ | 1,074,114 | $ | (804,706 | ) | $ | 583,231 | $ | 1,210,677 | ||||||||
| Year | Year End Fair Value of Equity Awards | Year over Year Change in Fair Value of Outstanding and Unvested Equity Awards | Year over Year Change in Fair Value of Equity Awards Granted in Prior Years that Vested in the Year | Value of Dividends or other Earnings Paid on Stock or Option Awards not Otherwise Reflected in Fair Value or Total Compensation | Total Equity Award Adjustments | ||||||||||||||||
| 2022 | $ | 4,406,389 | $ | (3,985,142 | ) | $ | (945,391 | ) | $ | 350,788 | $ | (173,356 | ) | ||||||||
| 2021 | $ | 5,849,922 | $ | 3,131,154 | $ | 244,307 | $ | 206,707 | $ | 9,432,090 | |||||||||||
| 2020 | $ | 3,815,620 | $ | (2,387,322 | ) | $ | (1,447,074 | ) | $ | 68,771 | $ | 49,995 | |||||||||
The following graph reflects the relationship between the amount of compensation actually paid to Mr. Rosenfeld, the average amount of compensation actually paid to the Company’s NEOs as a group (excluding Mr. Rosenfeld) and the Company’s cumulative TSR over the three years presented in the table.
The following graph reflects the relationship between the amount of compensation actually paid to Mr. Rosenfeld, the average amount of compensation actually paid to the Company’s NEOs as a group (excluding Mr. Rosenfeld) and the Company’s net income over the three years presented in the table.
The following graph reflects the relationship between the amount of compensation actually paid to Mr. Rosenfeld, the average amount of compensation actually paid to the Company’s NEOs as a group (excluding Mr. Rosenfeld) and the Company’s Adjusted EBIT over the three years presented in the table.
The following graph reflects the relationship between the cumulative TSR of the Company and its peer group over the three year period presented in the table. For detail regarding the composition of the peer group, see footnote 6 to the table above.
The following graph reflects the relationship between the cumulative TSR of the Company and its peer group over the three year period presented in the table. For detail regarding the composition of the peer group, see footnote 6 to the table above.
Financial Performance Measures
As described in greater detail in “Executive Compensation – Compensation Discussion and Analysis,” the Company’s executive compensation program reflects a variable pay-for-performance philosophy. The metrics that the Company uses for both our long-term and short-term incentive awards are selected based on an objective of incentivizing our NEOs to increase the value of our enterprise for our stockholders. The most important financial performance measures used by the Company to link executive compensation actually paid to the Company’s NEOs, for the most recently completed fiscal year, to the Company’s performance are as follows:
| ● | Adjusted EBIT |
| ● | Adjusted EBITDA |
| ● | Adjusted Diluted Earnings per Share |
| ● | Revenue |
| ● | Return on Invested Capital |
| [1] | The grant date fair value of equity awards represents the total of the amounts reported in the “Stock Awards” and “Option Awards” columns in the Summary Compensation Table for the applicable year. |
| [2] | The equity award adjustments for each applicable year include the addition (or subtraction, as applicable) of the following: (i) the year-end fair value of any equity awards granted in the applicable year that are outstanding and unvested as of the end of the year; (ii) the amount of change as of the end of the applicable year (from the end of the prior fiscal year) in fair value of any awards granted in prior years that are outstanding and unvested as of the end of the applicable year; (iii) for awards that are granted and vest in same applicable year, the fair value as of the vesting date; (iv) for awards granted in prior years that vest in the applicable year, the amount equal to the change as of the vesting date (from the end of the prior fiscal year) in fair value; (v) for awards granted in prior years that are determined to fail to meet the applicable vesting conditions during the applicable year, a deduction for the amount equal to the fair value at the end of the prior fiscal year; and (vi) the dollar value of any dividends or other earnings paid on stock or option awards in the applicable year prior to the vesting date that are not otherwise reflected in the fair value of such award or included in any other component of total compensation for the applicable year. The amounts deducted or added in calculating the equity award adjustments are as follows: |
| [3] | The amounts deducted or added in calculating the total average equity award adjustments are as follows: |
| [4] | The dollar amounts reported in column (b) are the amounts of total compensation reported for Mr. Rosenfeld (our Chief Executive Officer) for each corresponding year in the “Total” column of the Summary Compensation Table. Refer to “Executive Compensation – Summary Compensation Table for the 2022 Fiscal Year.” |
| [5] | The dollar amounts reported in column (c) represent the amount of “compensation actually paid” to Mr. Rosenfeld, as computed in accordance with Item 402(v) of Regulation S-K. The dollar amounts do not reflect the actual amount of compensation earned by or paid to Mr. Rosenfeld during the applicable year. In accordance with the requirements of Item 402(v) of Regulation S-K, the following adjustments were made to Mr. Rosenfeld’s total compensation for each year to determine the compensation actually paid: |