
Investor Presentation Fourth Quarter 2022 Exhibit 99.2
Information Related to Forward-Looking Statements Statements concerning interest rates, portfolio allocation, financing costs, portfolio hedging, prepayments, dividends, book value, utilization of loss carryforwards, any change in long-term tax structures (including any REIT election), use of equity raise proceeds and any other guidance on present or future periods, as well as the Company’s estimates for certain financial information post year-end, constitute forward-looking statements that are subject to a number of factors, risks and uncertainties that might cause actual results to differ materially from stated expectations or current circumstances. These factors include, but are not limited to, inflation, changes in interest rates, increased costs of borrowing, decreased interest spreads, credit risks underlying the Company’s assets, especially related to the Company’s mortgage credit investments, changes in political and monetary policies, changes in default rates, changes in prepayment rates and other assumptions underlying our estimates related to our projections of future earnings available for distribution, changes in the Company’s returns, changes in the use of the Company’s tax benefits, the Company’s ability to qualify and maintain qualification as a REIT, changes in the agency MBS asset yield, changes in the Company’s monetization of net operating loss carryforwards, changes in the Company’s investment strategy, changes in the Company’s ability to generate cash earnings and dividends, preservation and utilization of the Company’s net operating loss and net capital loss carryforwards, impacts of changes to and changes by Fannie Mae and Freddie Mac, actions taken by the U.S. Federal Reserve, the Federal Housing Finance Agency and the U.S. Treasury, availability of opportunities that meet or exceed the Company’s risk adjusted return expectations, ability and willingness to make future dividends, ability to generate sufficient cash through retained earnings to satisfy capital needs, the uncertainty and economic impact of a resurgence of the coronavirus (COVID-19) pandemic, and the effect of general economic, political, regulatory and market conditions, including the impact of a potential recessionary environment. These and other material risks are described in the Company's most recent Annual Report on Form 10-K and any other documents filed by the Company with the SEC from time to time, which are available from the Company and from the SEC, and you should read and understand these risks when evaluating any forward-looking statement. All forward-looking statements speak only as of the date on which they are made. New risks and uncertainties arise over time, and it is not possible to predict those events or how they may affect the Company. Except as required by law, the Company is not obligated to, and does not intend to, update or revise any forward-looking statements, whether as a result of new information, future events or otherwise.
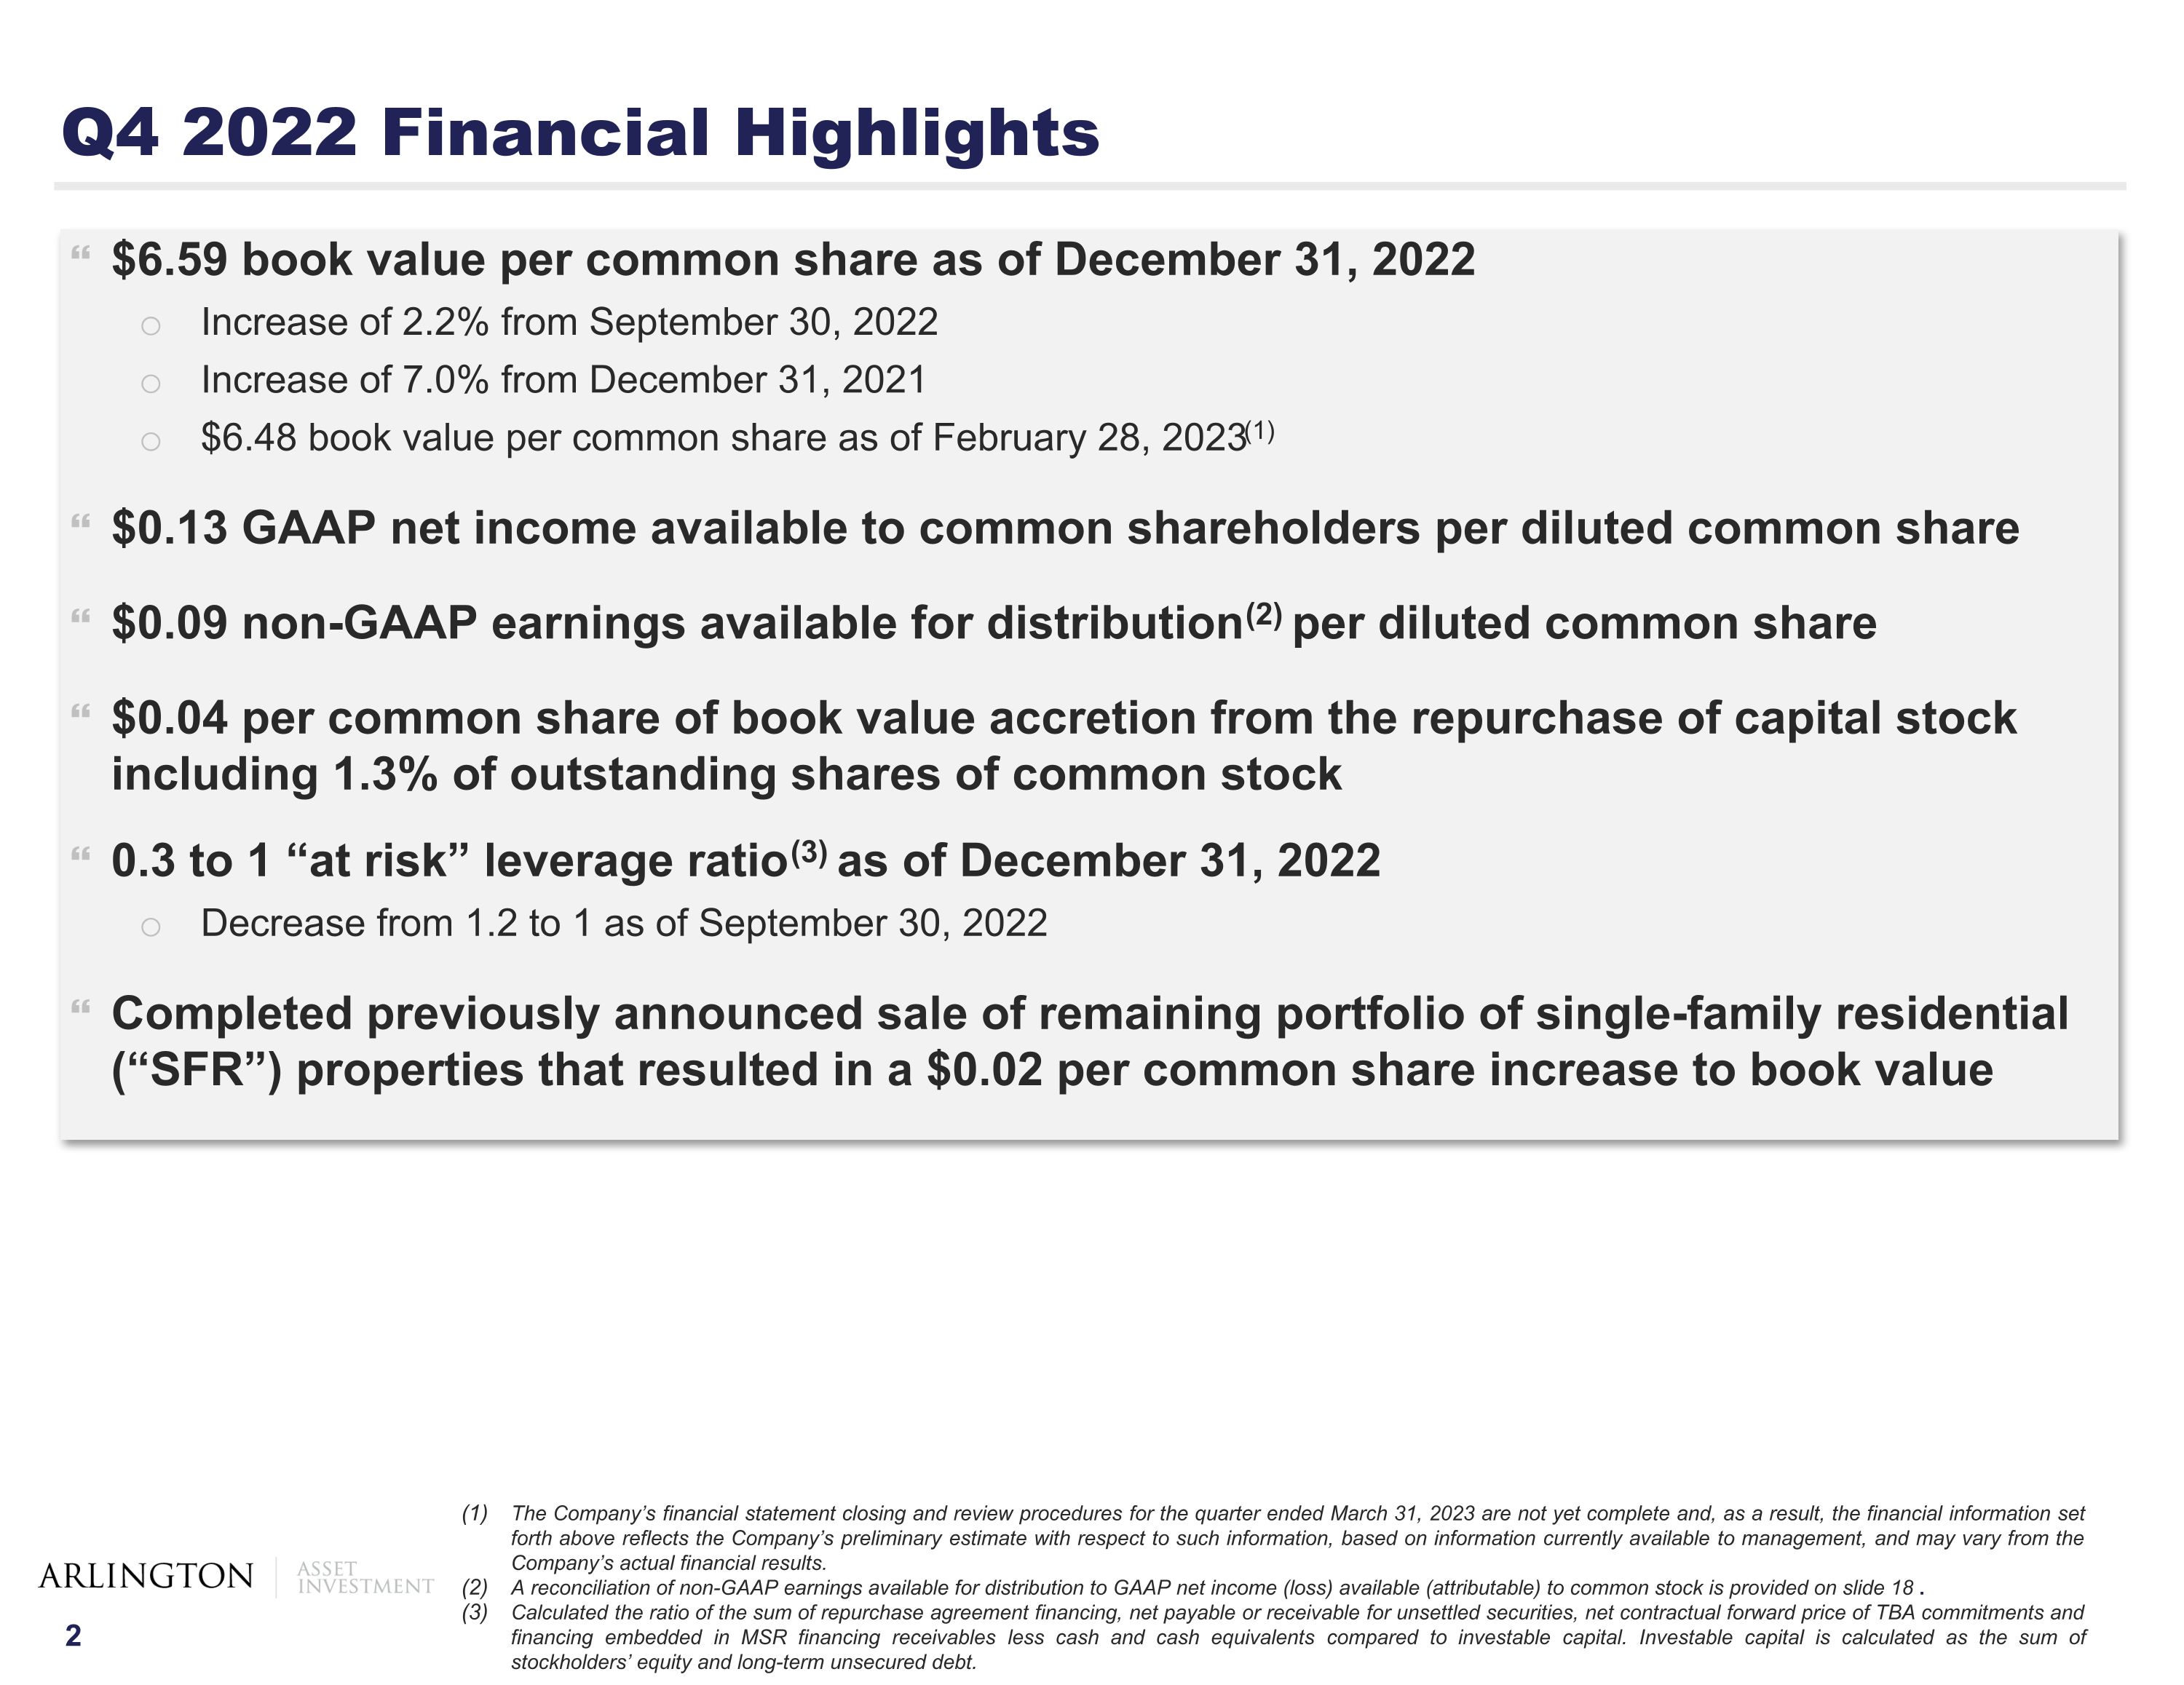
Q4 2022 Financial Highlights $6.59 book value per common share as of December 31, 2022 Increase of 2.2% from September 30, 2022 Increase of 7.0% from December 31, 2021 $6.48 book value per common share as of February 28, 2023(1) $0.13 GAAP net income available to common shareholders per diluted common share $0.09 non-GAAP earnings available for distribution(2) per diluted common share $0.04 per common share of book value accretion from the repurchase of capital stock including 1.3% of outstanding shares of common stock 0.3 to 1 “at risk” leverage ratio(3) as of December 31, 2022 Decrease from 1.2 to 1 as of September 30, 2022 Completed previously announced sale of remaining portfolio of single-family residential (“SFR”) properties that resulted in a $0.02 per common share increase to book value The Company’s financial statement closing and review procedures for the quarter ended March 31, 2023 are not yet complete and, as a result, the financial information set forth above reflects the Company’s preliminary estimate with respect to such information, based on information currently available to management, and may vary from the Company’s actual financial results. A reconciliation of non-GAAP earnings available for distribution to GAAP net income (loss) available (attributable) to common stock is provided on slide 18. Calculated the ratio of the sum of repurchase agreement financing, net payable or receivable for unsettled securities, net contractual forward price of TBA commitments and financing embedded in MSR financing receivables less cash and cash equivalents compared to investable capital. Investable capital is calculated as the sum of stockholders’ equity and long-term unsecured debt.
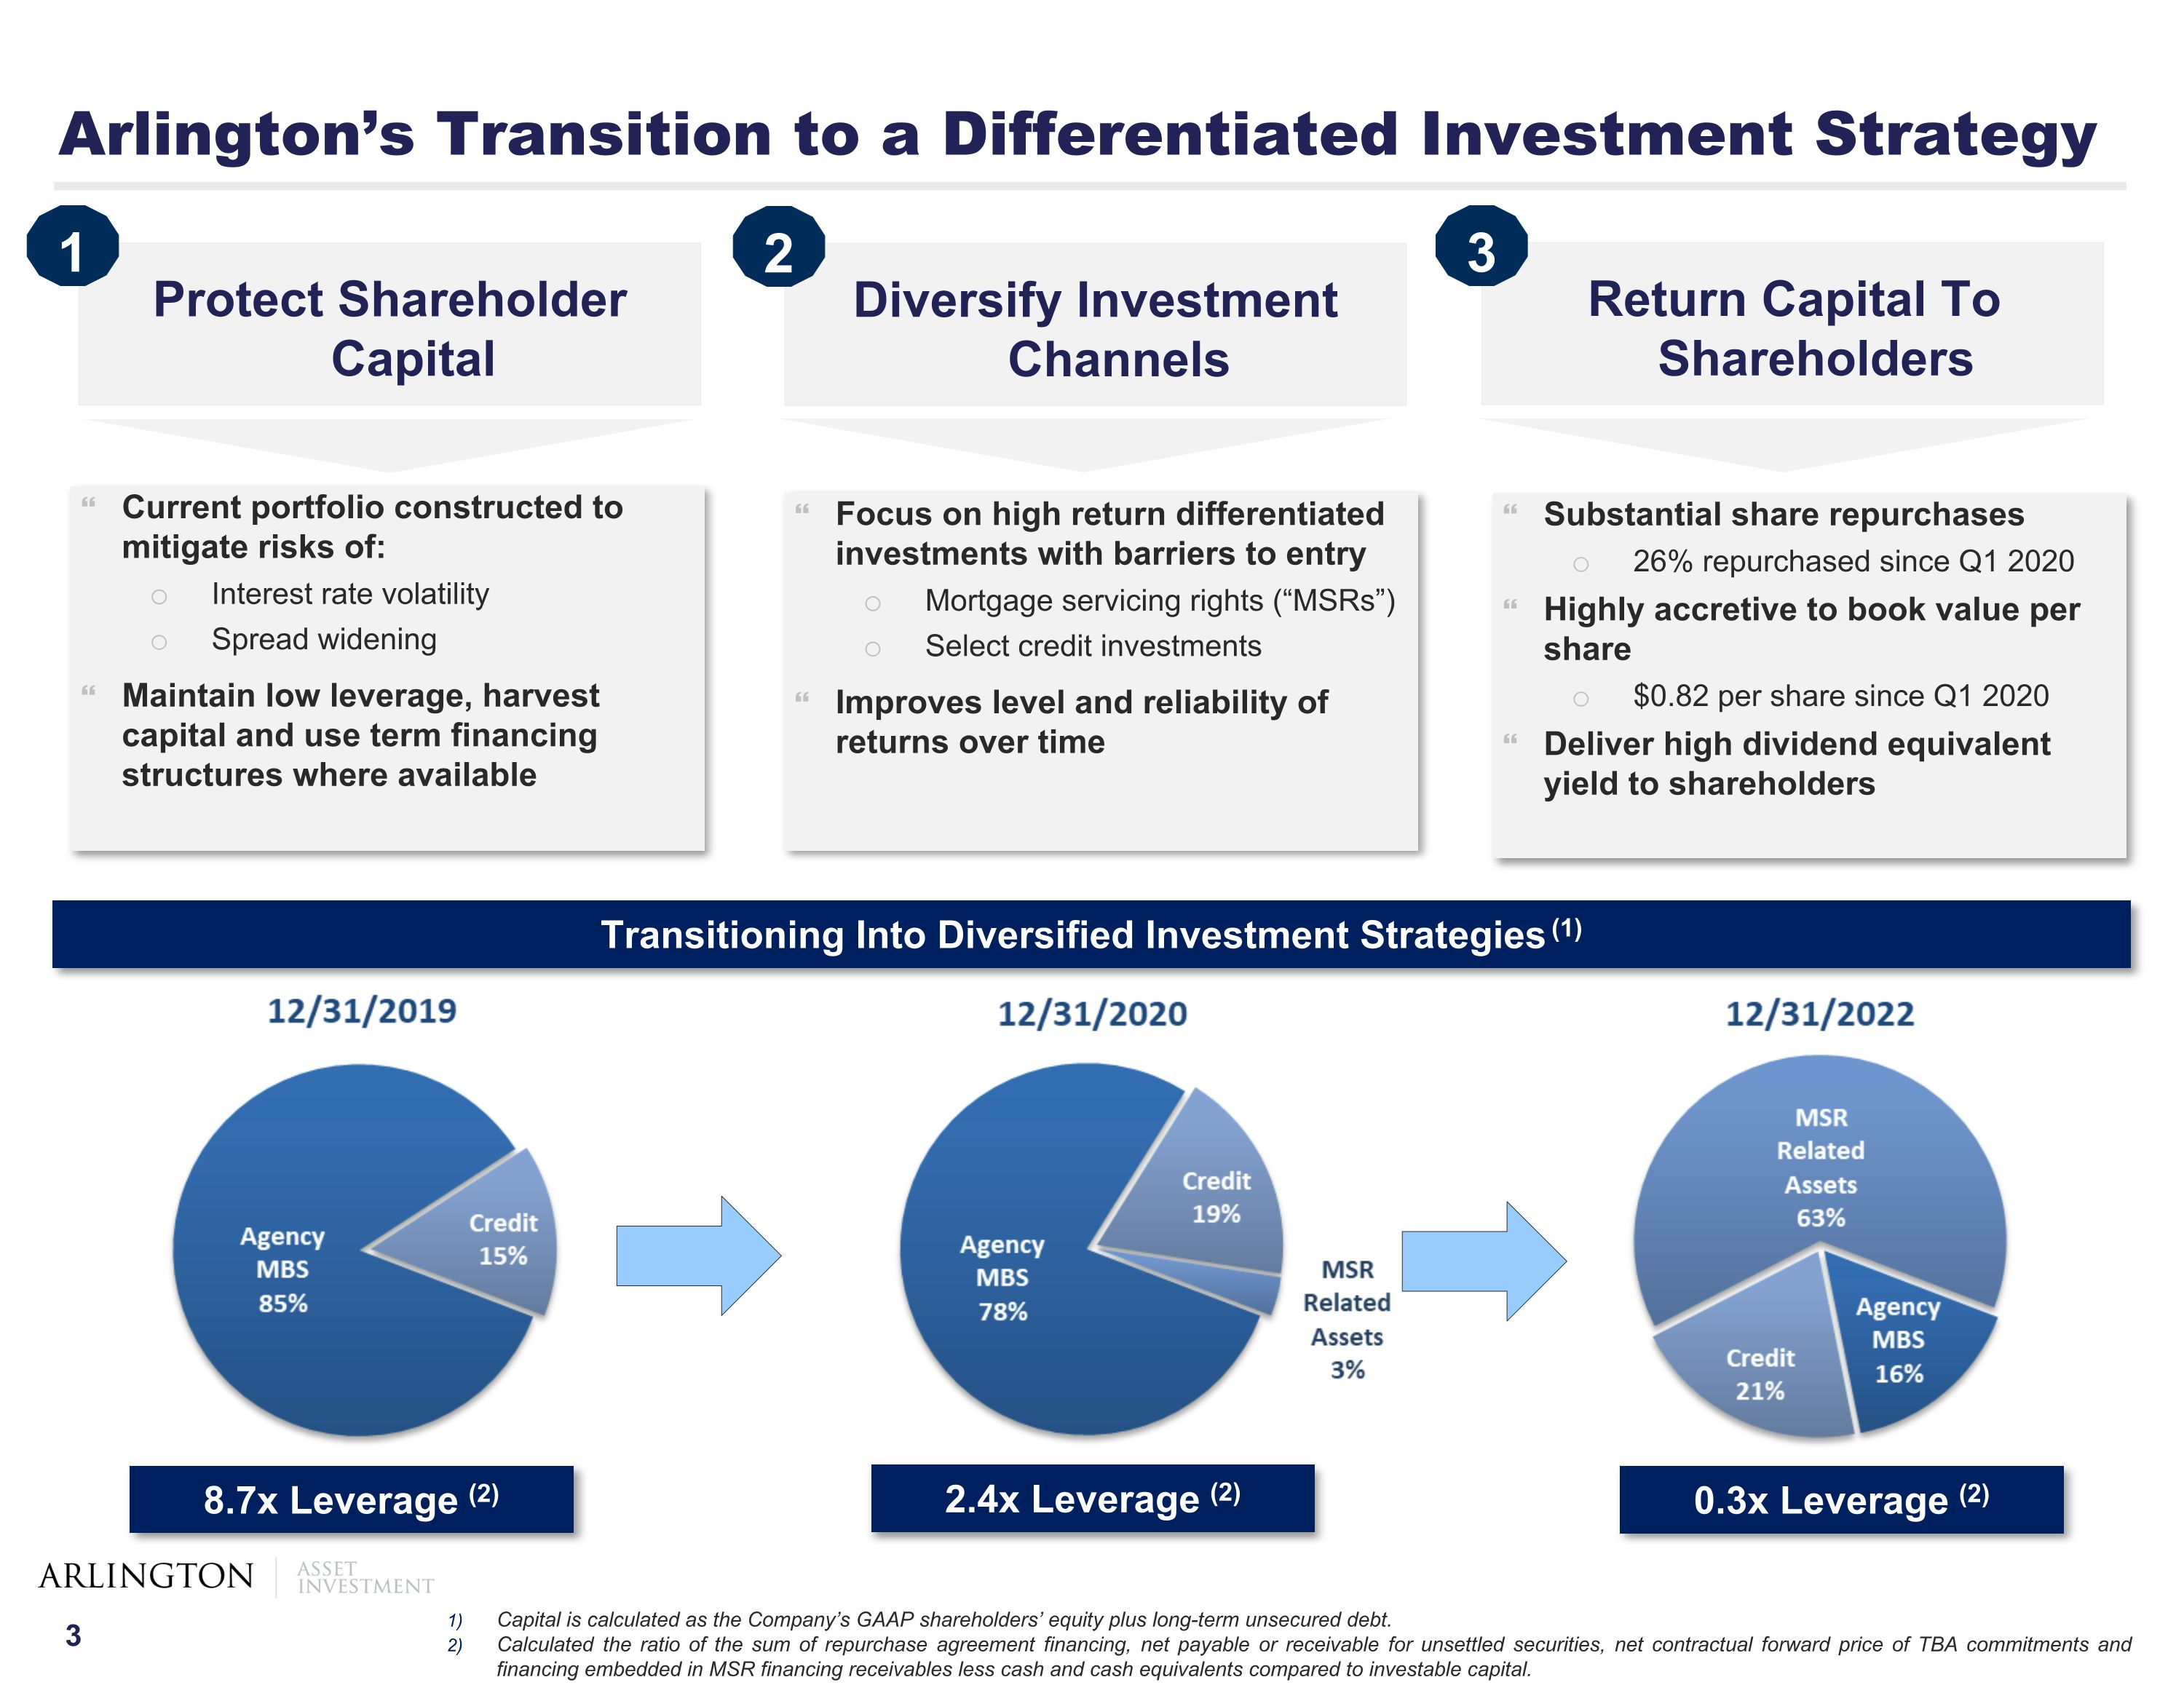
Arlington’s Transition to a Differentiated Investment Strategy Return Capital To Shareholders 3 Focus on high return differentiated investments with barriers to entry Mortgage servicing rights (“MSRs”) Select credit investments Improves level and reliability of returns over time Substantial share repurchases 26% repurchased since Q1 2020 Highly accretive to book value per share $0.82 per share since Q1 2020 Deliver high dividend equivalent yield to shareholders Transitioning Into Diversified Investment Strategies (1) Protect Shareholder Capital Diversify Investment Channels 2 Current portfolio constructed to mitigate risks of: Interest rate volatility Spread widening Maintain low leverage, harvest capital and use term financing structures where available 1 8.7x Leverage (2) 2.4x Leverage (2) 0.3x Leverage (2) Capital is calculated as the Company’s GAAP shareholders’ equity plus long-term unsecured debt. Calculated the ratio of the sum of repurchase agreement financing, net payable or receivable for unsettled securities, net contractual forward price of TBA commitments and financing embedded in MSR financing receivables less cash and cash equivalents compared to investable capital.
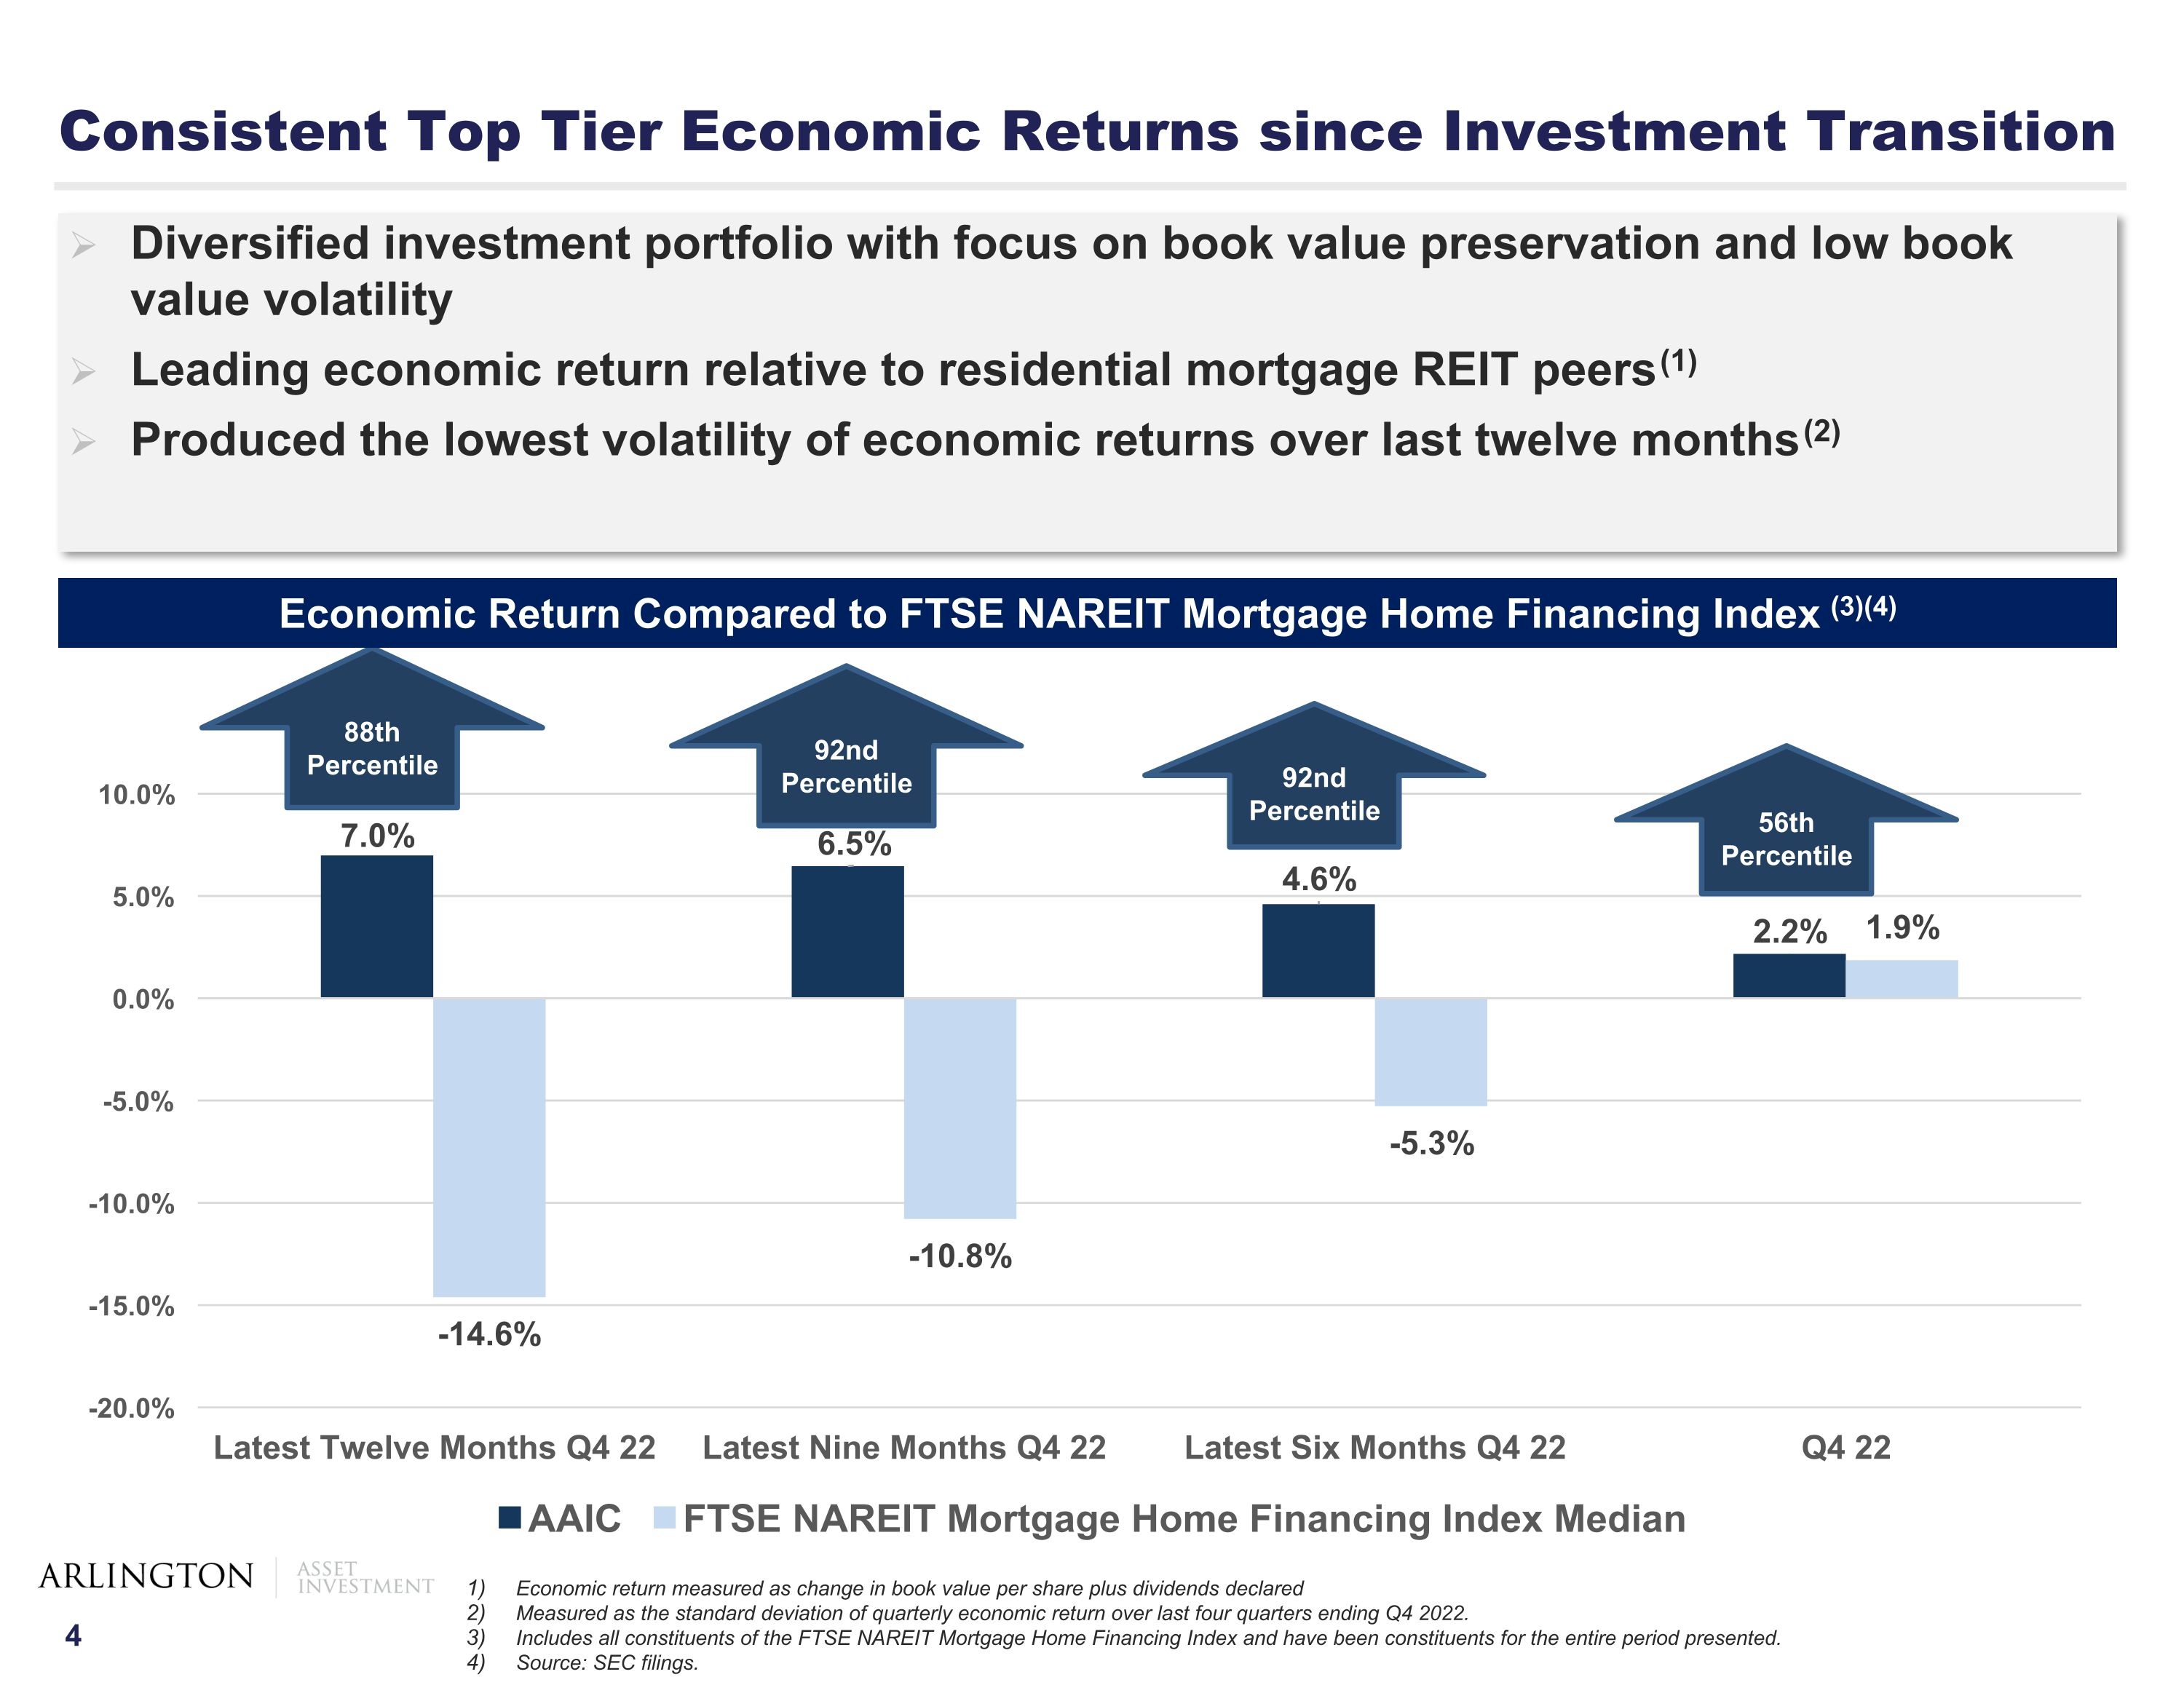
Consistent Top Tier Economic Returns since Investment Transition Economic Return Compared to FTSE NAREIT Mortgage Home Financing Index (3)(4) Diversified investment portfolio with focus on book value preservation and low book value volatility Leading economic return relative to residential mortgage REIT peers(1) Produced the lowest volatility of economic returns over last twelve months(2) Economic return measured as change in book value per share plus dividends declared Measured as the standard deviation of quarterly economic return over last four quarters ending Q4 2022. Includes all constituents of the FTSE NAREIT Mortgage Home Financing Index and have been constituents for the entire period presented. Source: SEC filings. 88th Percentile 92nd Percentile 92nd Percentile 56th Percentile
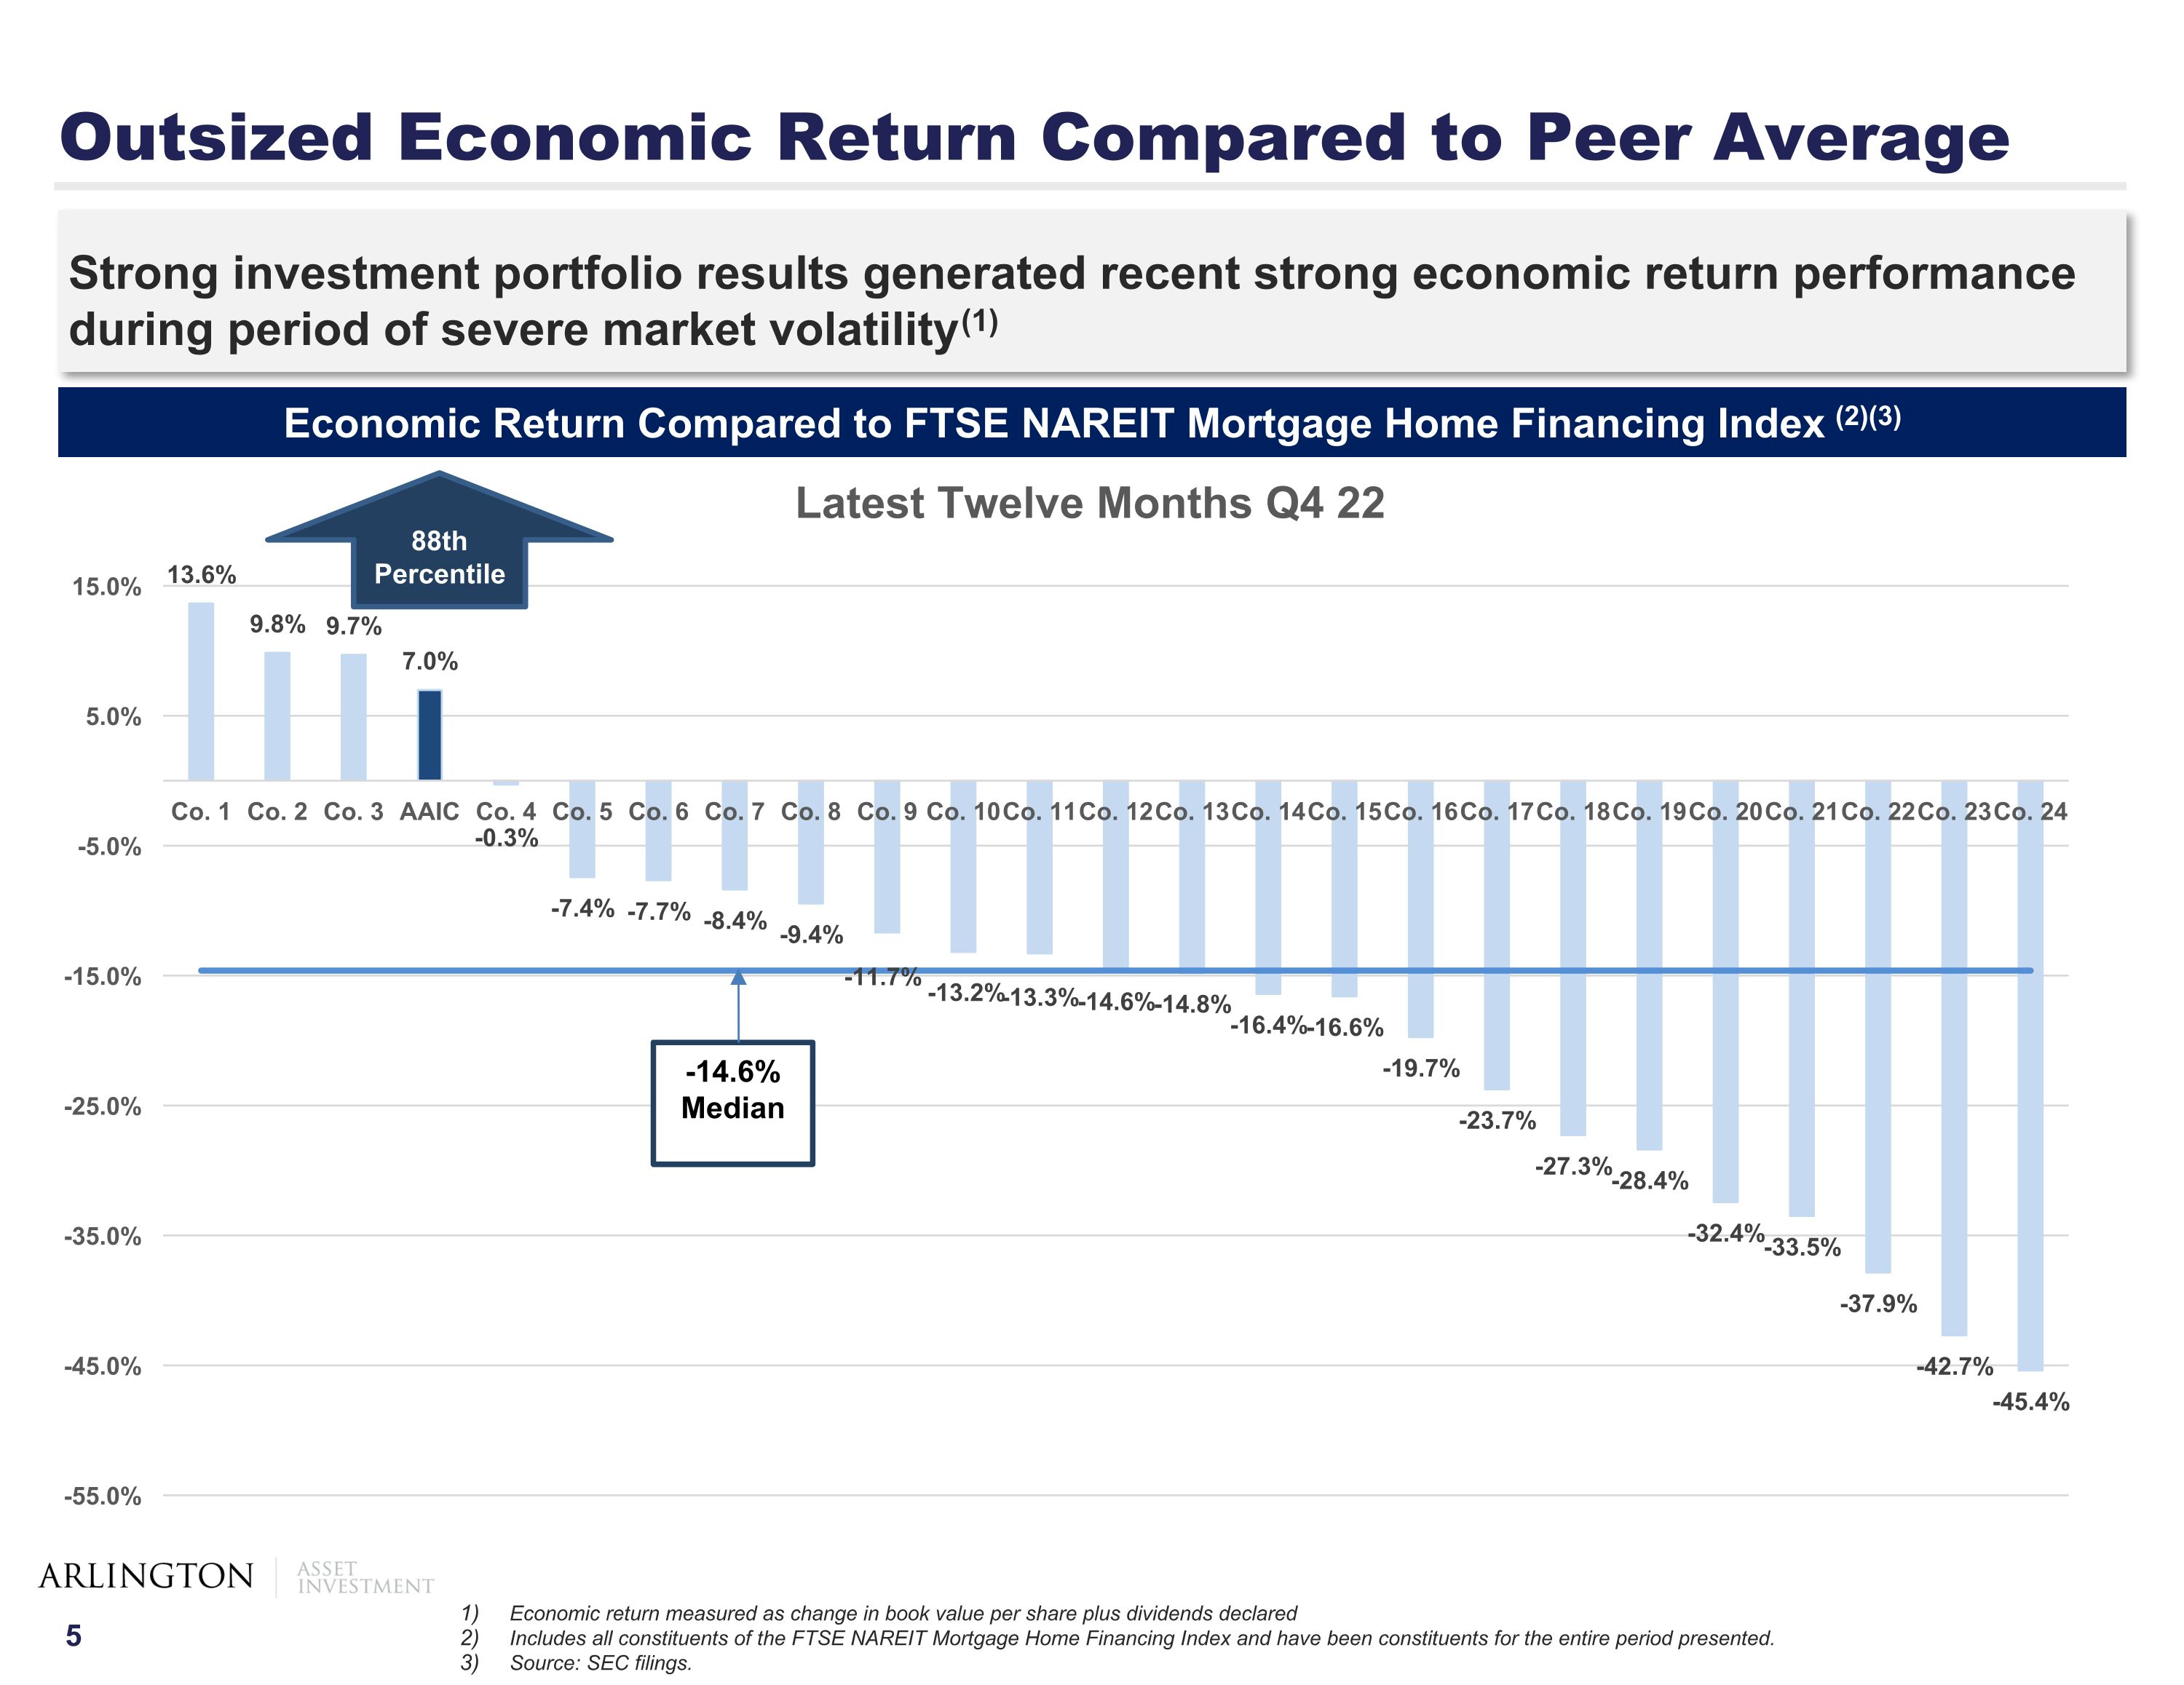
Outsized Economic Return Compared to Peer Average Strong investment portfolio results generated recent strong economic return performance during period of severe market volatility(1) Economic Return Compared to FTSE NAREIT Mortgage Home Financing Index (2)(3) Economic return measured as change in book value per share plus dividends declared Includes all constituents of the FTSE NAREIT Mortgage Home Financing Index and have been constituents for the entire period presented. Source: SEC filings. -14.6% Median Economic Return 88th Percentile
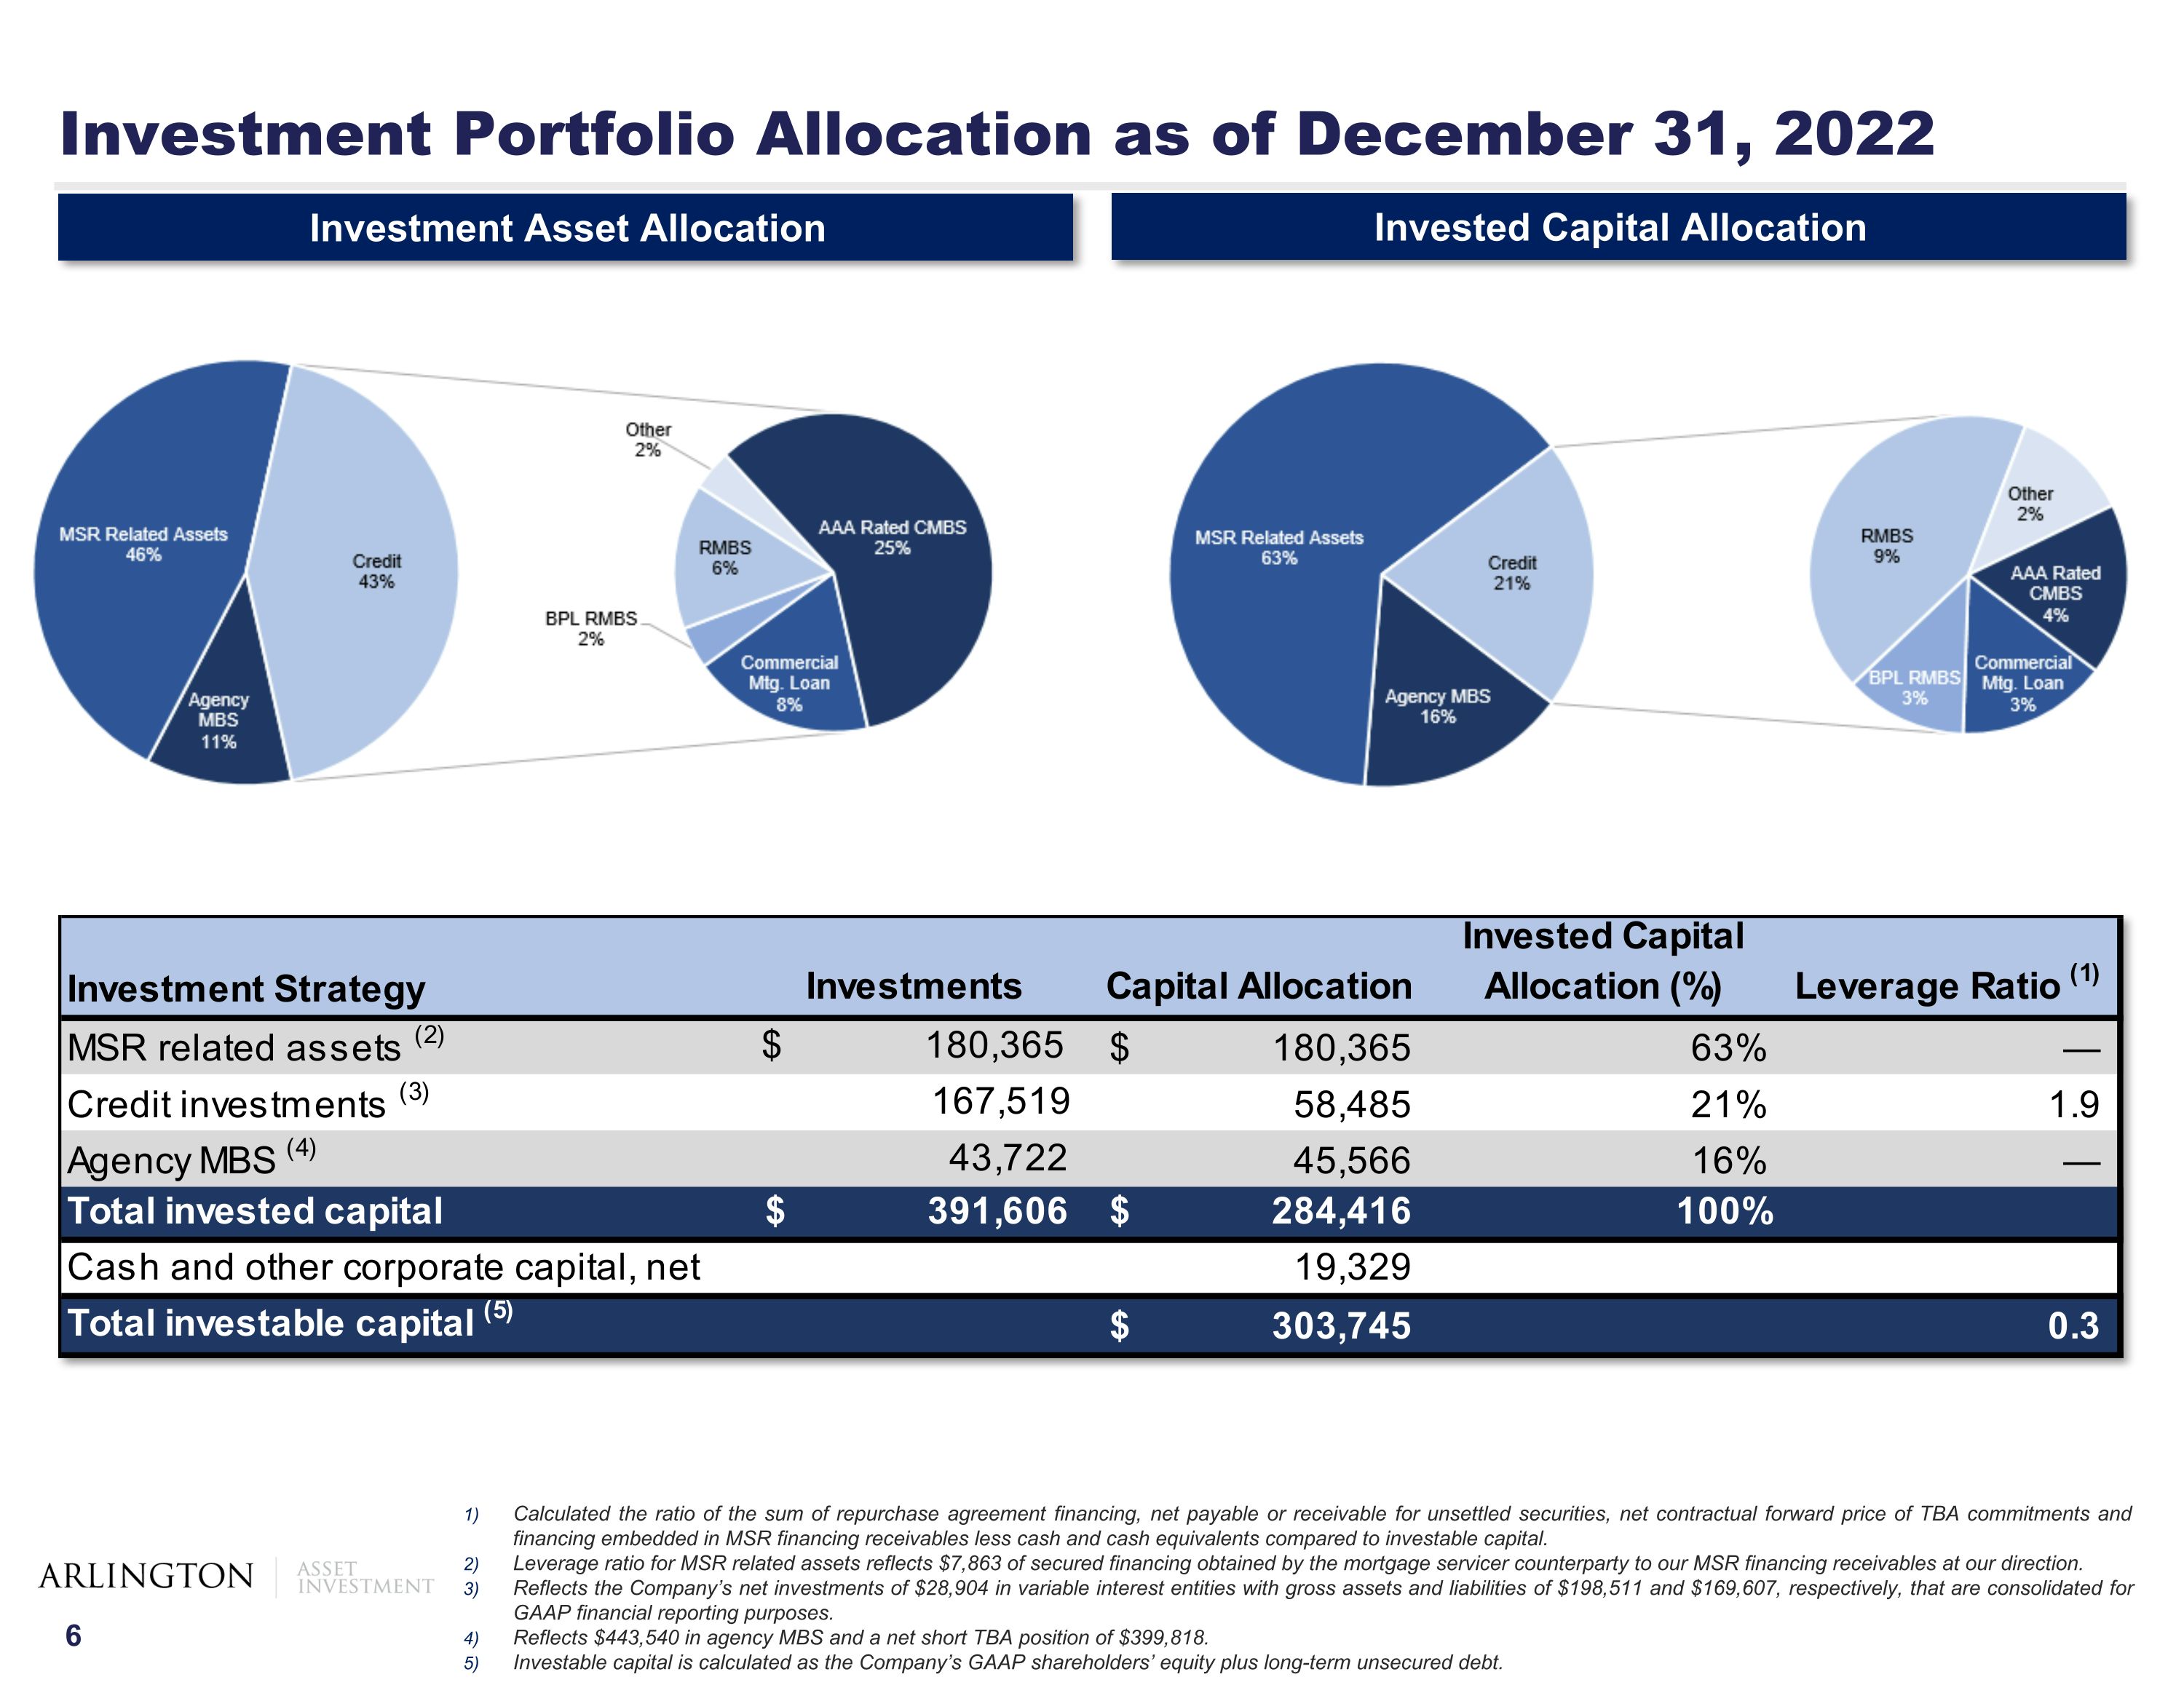
Investment Portfolio Allocation as of December 31, 2022 Investment Asset Allocation Invested Capital Allocation Calculated the ratio of the sum of repurchase agreement financing, net payable or receivable for unsettled securities, net contractual forward price of TBA commitments and financing embedded in MSR financing receivables less cash and cash equivalents compared to investable capital. Leverage ratio for MSR related assets reflects $7,863 of secured financing obtained by the mortgage servicer counterparty to our MSR financing receivables at our direction. Reflects the Company’s net investments of $28,904 in variable interest entities with gross assets and liabilities of $198,511 and $169,607, respectively, that are consolidated for GAAP financial reporting purposes. Reflects $443,540 in agency MBS and a net short TBA position of $399,818. Investable capital is calculated as the Company’s GAAP shareholders’ equity plus long-term unsecured debt.
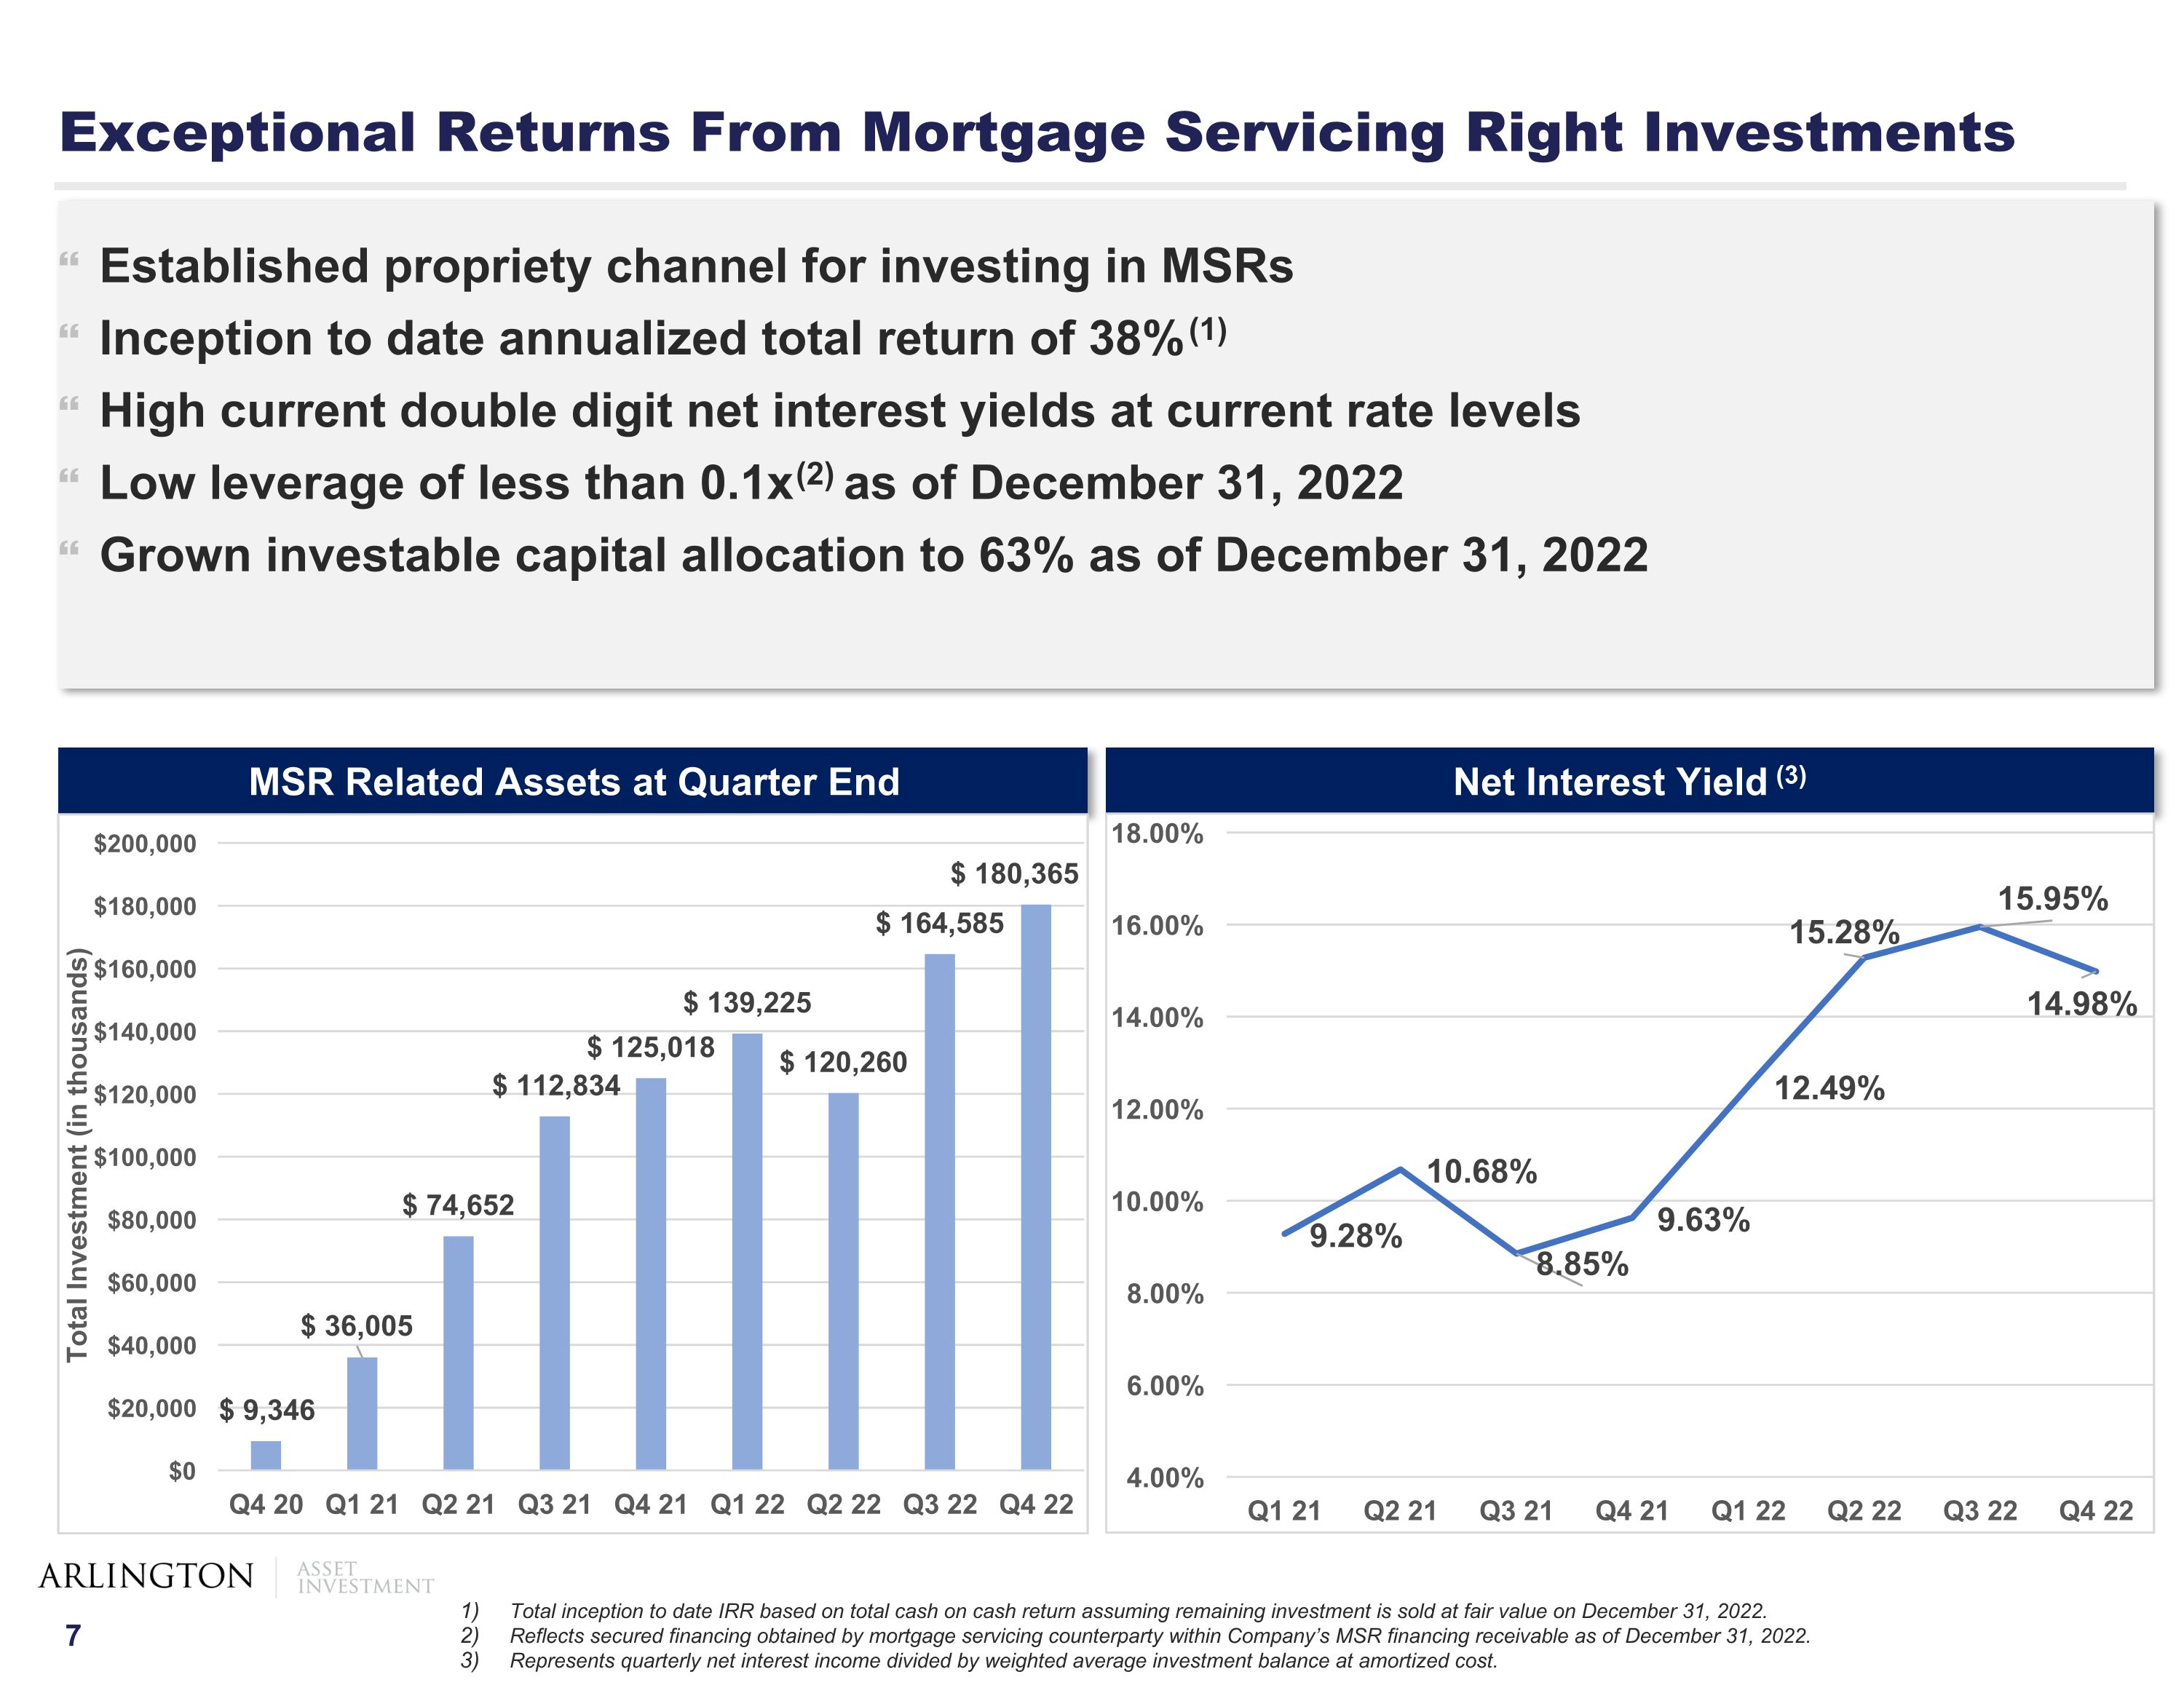
Exceptional Returns From Mortgage Servicing Right Investments Established propriety channel for investing in MSRs Inception to date annualized total return of 38%(1) High current double digit net interest yields at current rate levels Low leverage of less than 0.1x(2) as of December 31, 2022 Grown investable capital allocation to 63% as of December 31, 2022 Total inception to date IRR based on total cash on cash return assuming remaining investment is sold at fair value on December 31, 2022. Reflects secured financing obtained by mortgage servicing counterparty within Company’s MSR financing receivable as of December 31, 2022. Represents quarterly net interest income divided by weighted average investment balance at amortized cost. MSR Related Assets at Quarter End Net Interest Yield (3)
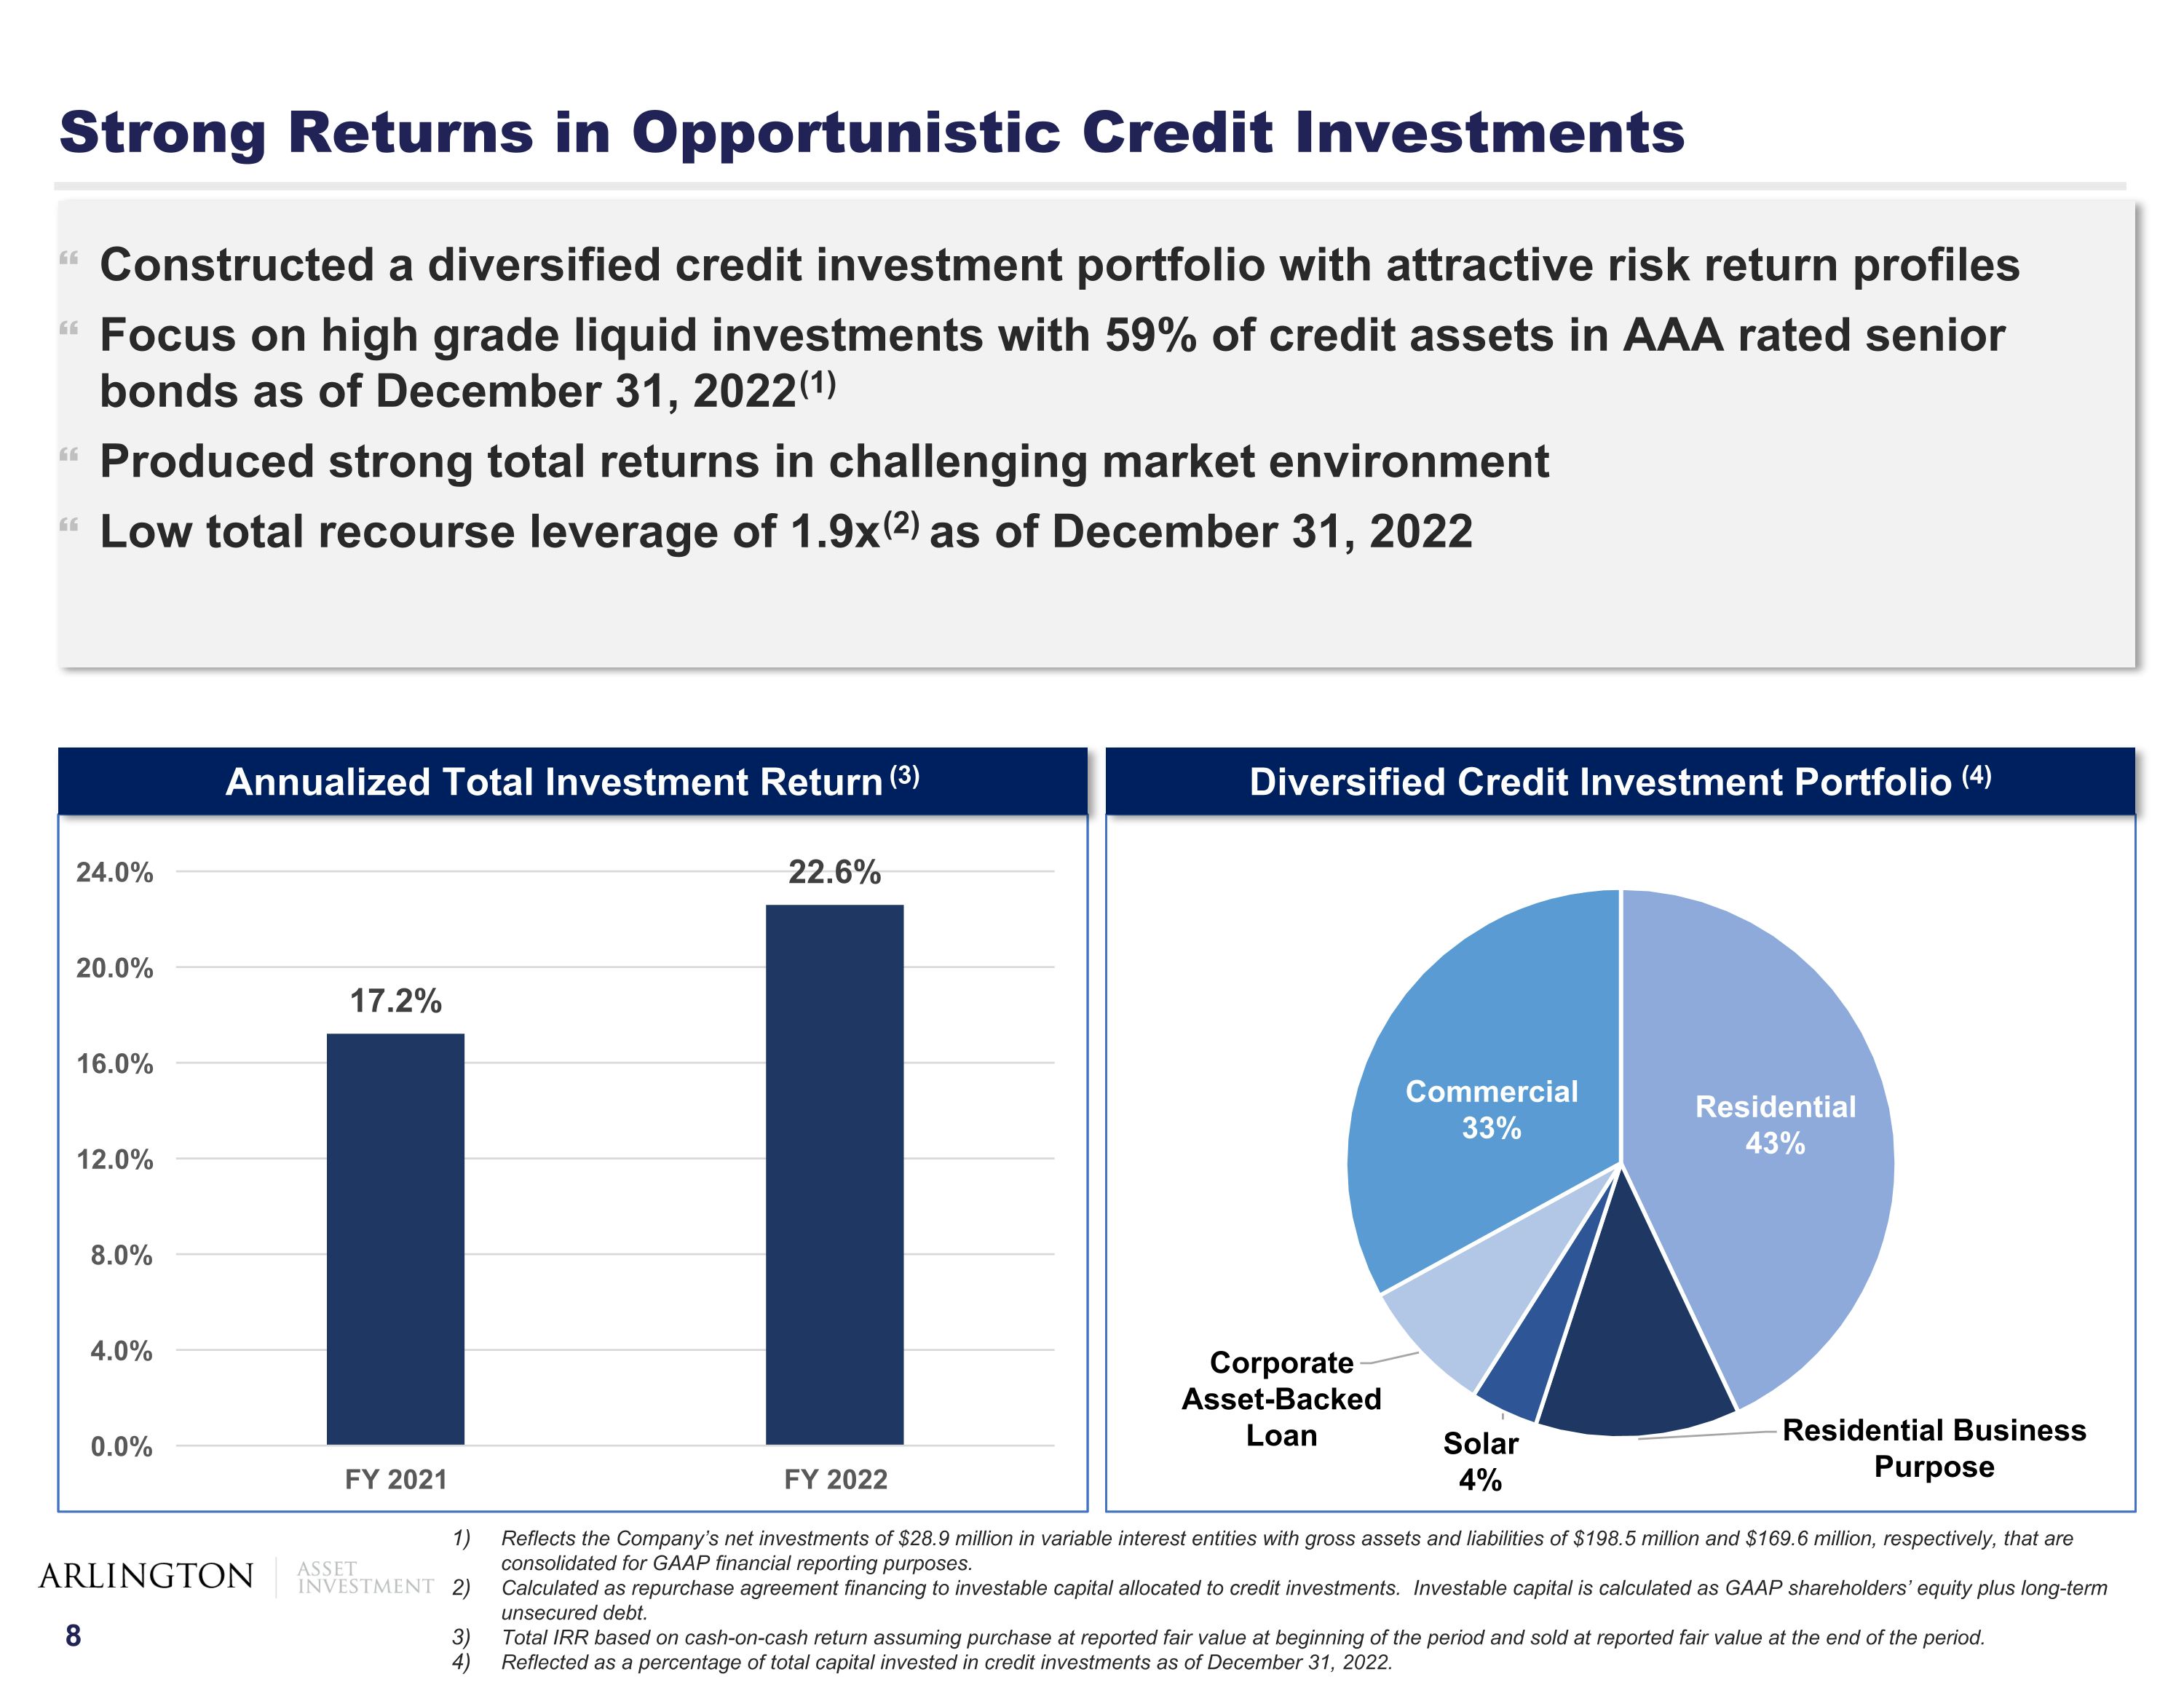
Strong Returns in Opportunistic Credit Investments Constructed a diversified credit investment portfolio with attractive risk return profiles Focus on high grade liquid investments with 59% of credit assets in AAA rated senior bonds as of December 31, 2022(1) Produced strong total returns in challenging market environment Low total recourse leverage of 1.9x(2) as of December 31, 2022 Reflects the Company’s net investments of $28.9 million in variable interest entities with gross assets and liabilities of $198.5 million and $169.6 million, respectively, that are consolidated for GAAP financial reporting purposes. Calculated as repurchase agreement financing to investable capital allocated to credit investments. Investable capital is calculated as GAAP shareholders’ equity plus long-term unsecured debt. Total IRR based on cash-on-cash return assuming purchase at reported fair value at beginning of the period and sold at reported fair value at the end of the period. Reflected as a percentage of total capital invested in credit investments as of December 31, 2022. Annualized Total Investment Return (3) Diversified Credit Investment Portfolio (4)
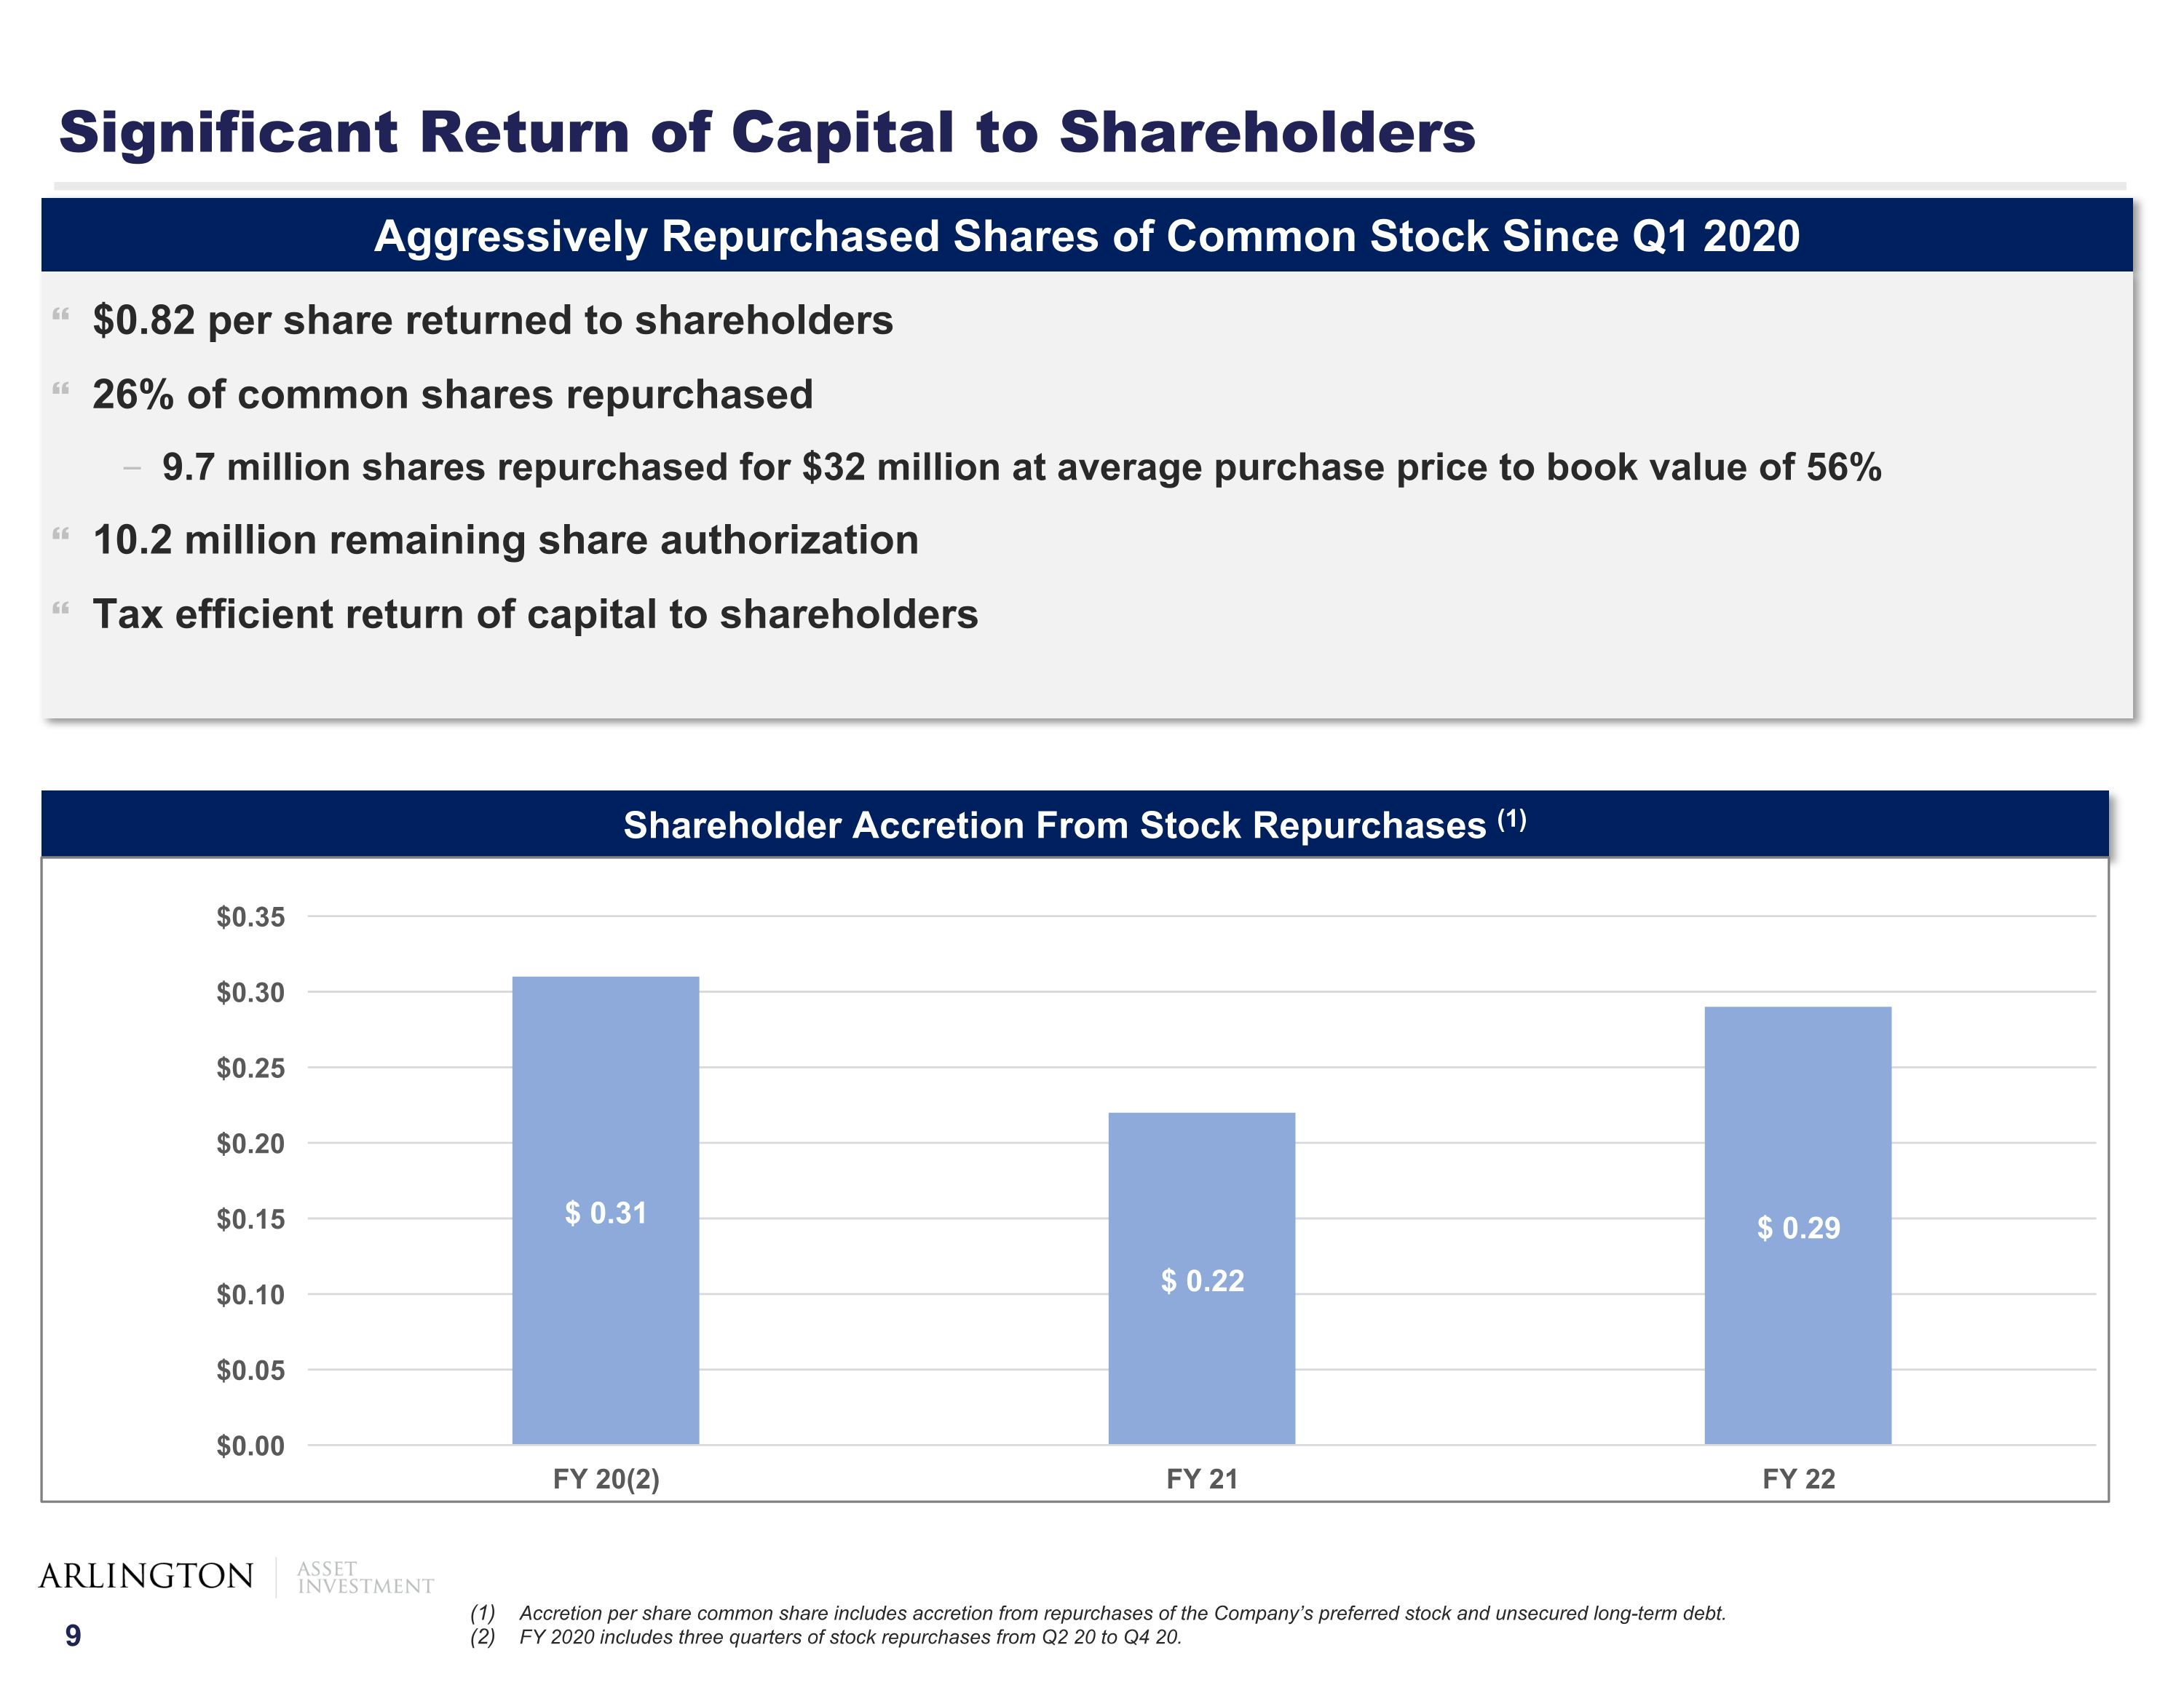
Significant Return of Capital to Shareholders Accretion per share common share includes accretion from repurchases of the Company’s preferred stock and unsecured long-term debt. FY 2020 includes three quarters of stock repurchases from Q2 20 to Q4 20. Shareholder Accretion From Stock Repurchases (1) Aggressively Repurchased Shares of Common Stock Since Q1 2020 $0.82 per share returned to shareholders 26% of common shares repurchased 9.7 million shares repurchased for $32 million at average purchase price to book value of 56% 10.2 million remaining share authorization Tax efficient return of capital to shareholders
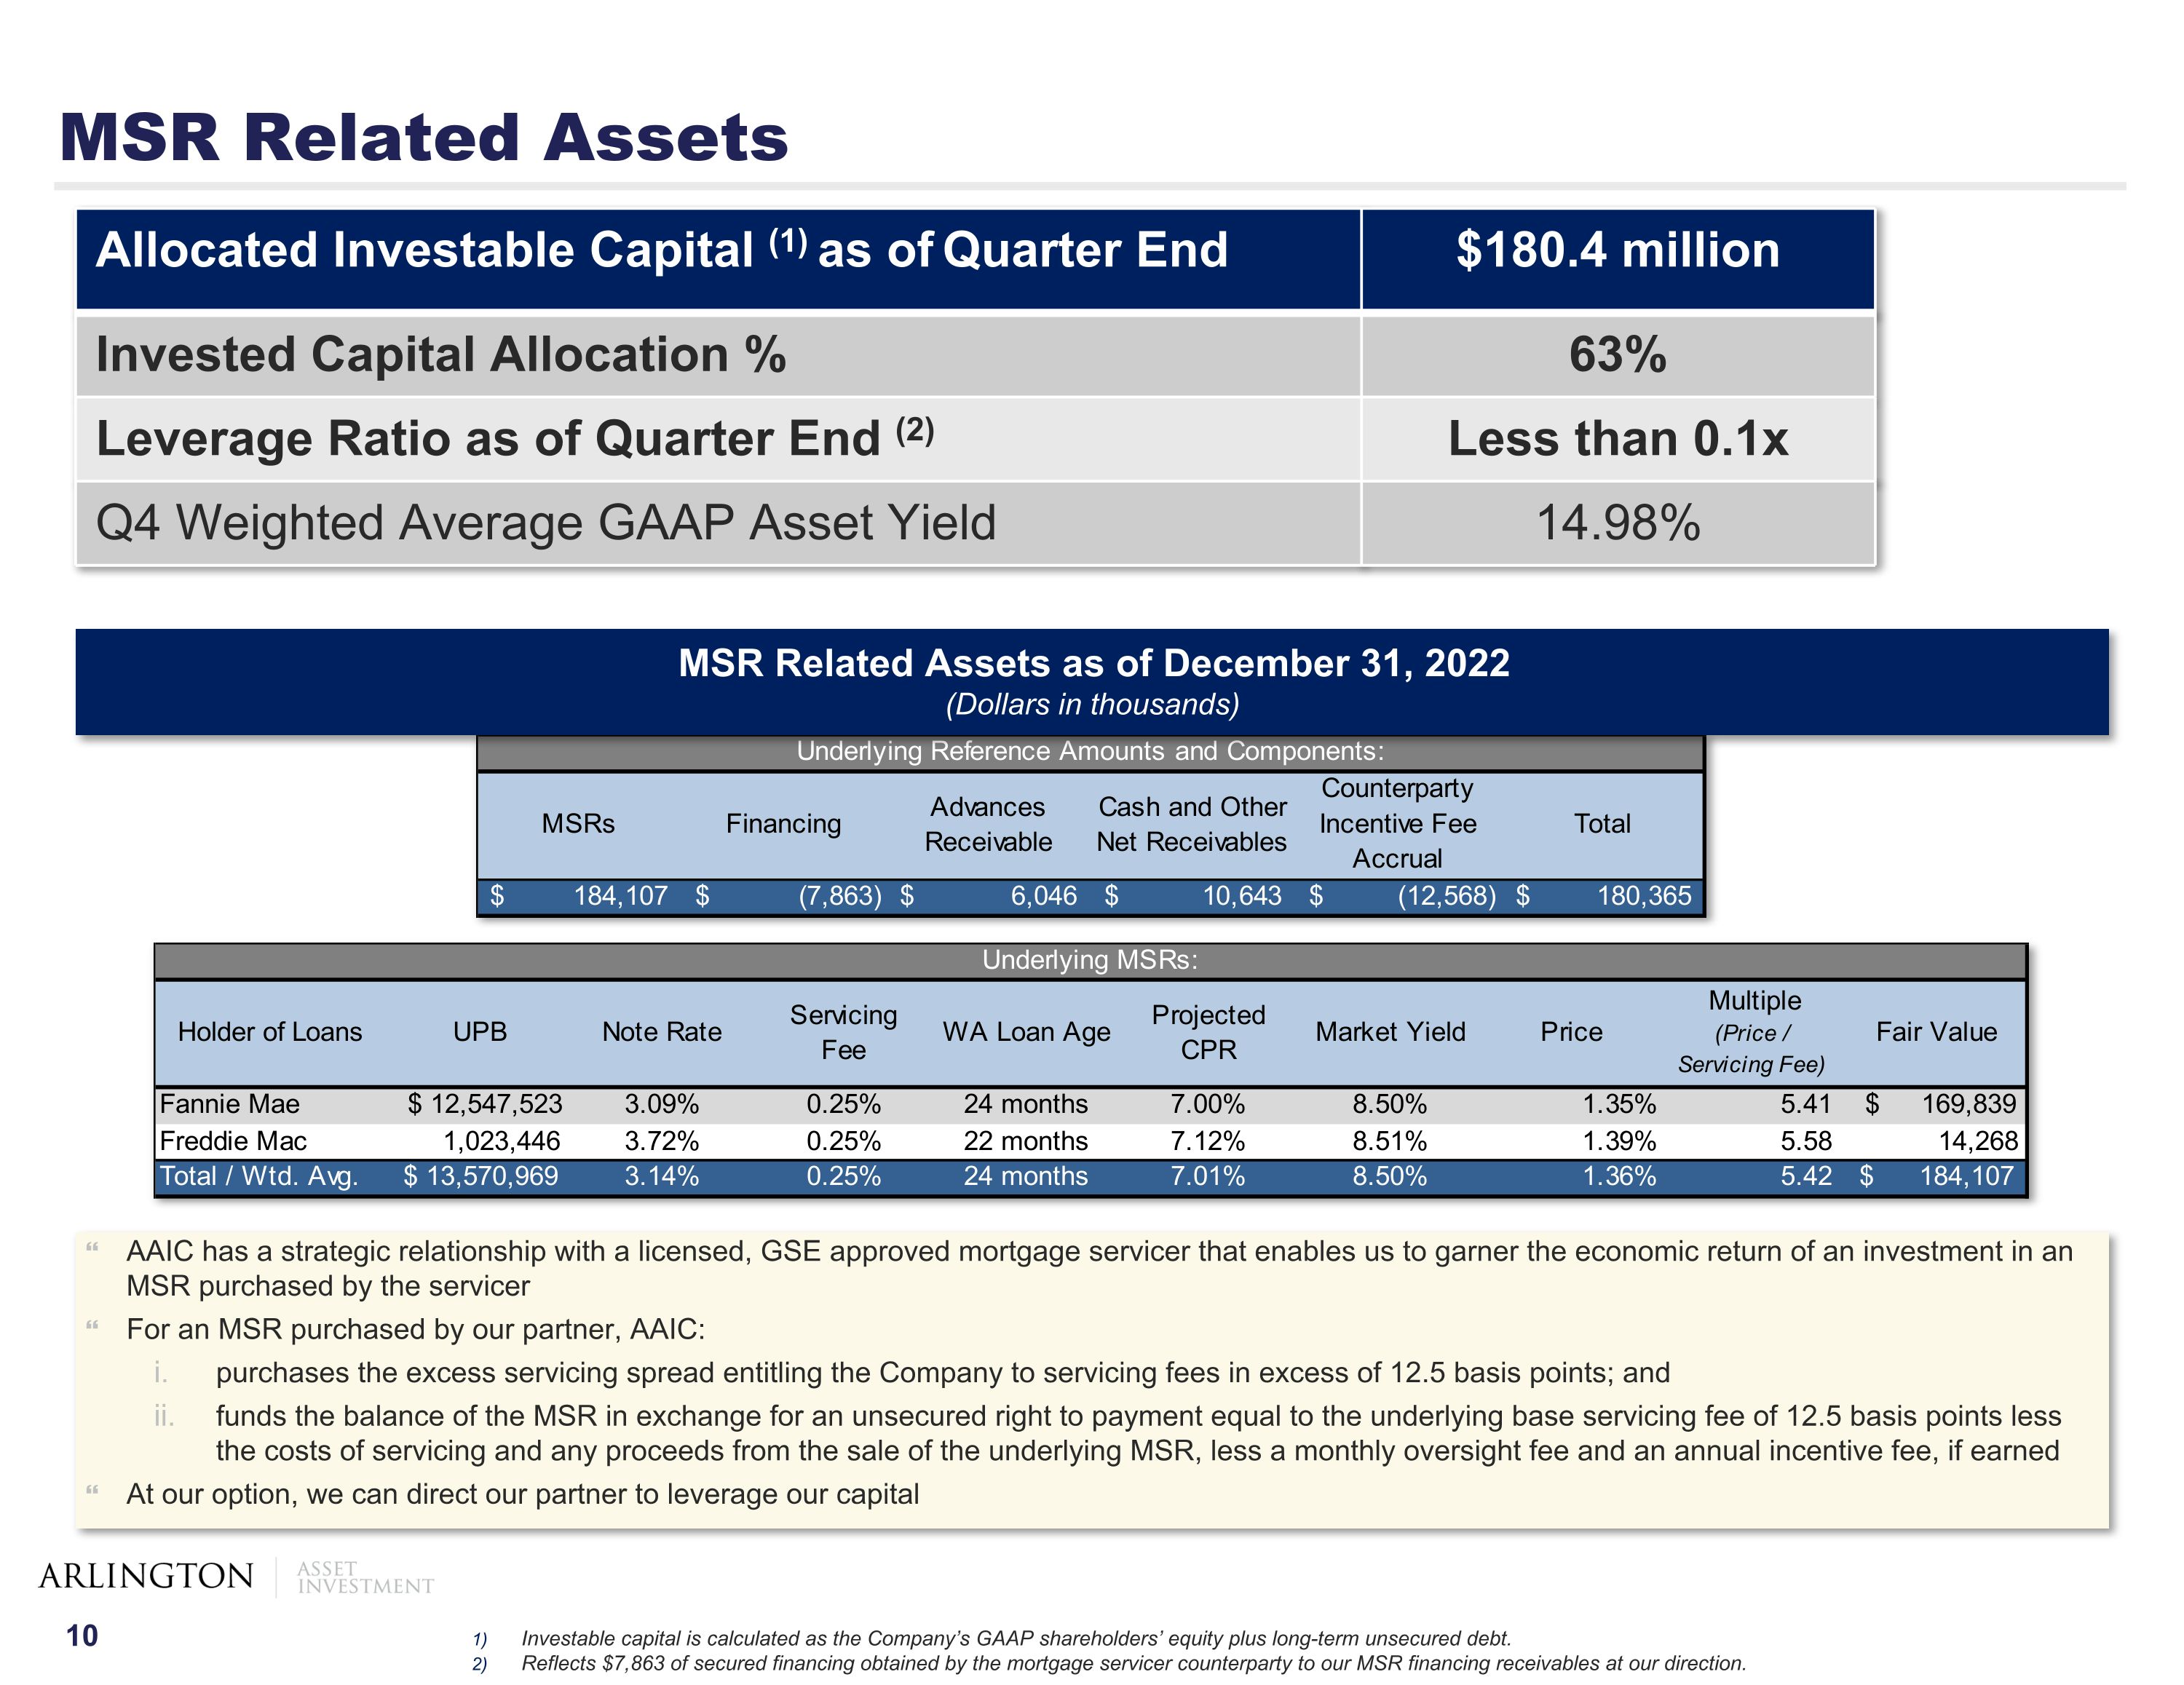
MSR Related Assets Allocated Investable Capital (1) as of Quarter End $180.4 million Invested Capital Allocation % 63% Leverage Ratio as of Quarter End (2) Less than 0.1x Q4 Weighted Average GAAP Asset Yield 14.98% MSR Related Assets as of December 31, 2022 (Dollars in thousands) AAIC has a strategic relationship with a licensed, GSE approved mortgage servicer that enables us to garner the economic return of an investment in an MSR purchased by the servicer For an MSR purchased by our partner, AAIC: purchases the excess servicing spread entitling the Company to servicing fees in excess of 12.5 basis points; and funds the balance of the MSR in exchange for an unsecured right to payment equal to the underlying base servicing fee of 12.5 basis points less the costs of servicing and any proceeds from the sale of the underlying MSR, less a monthly oversight fee and an annual incentive fee, if earned At our option, we can direct our partner to leverage our capital Investable capital is calculated as the Company’s GAAP shareholders’ equity plus long-term unsecured debt. Reflects $7,863 of secured financing obtained by the mortgage servicer counterparty to our MSR financing receivables at our direction.
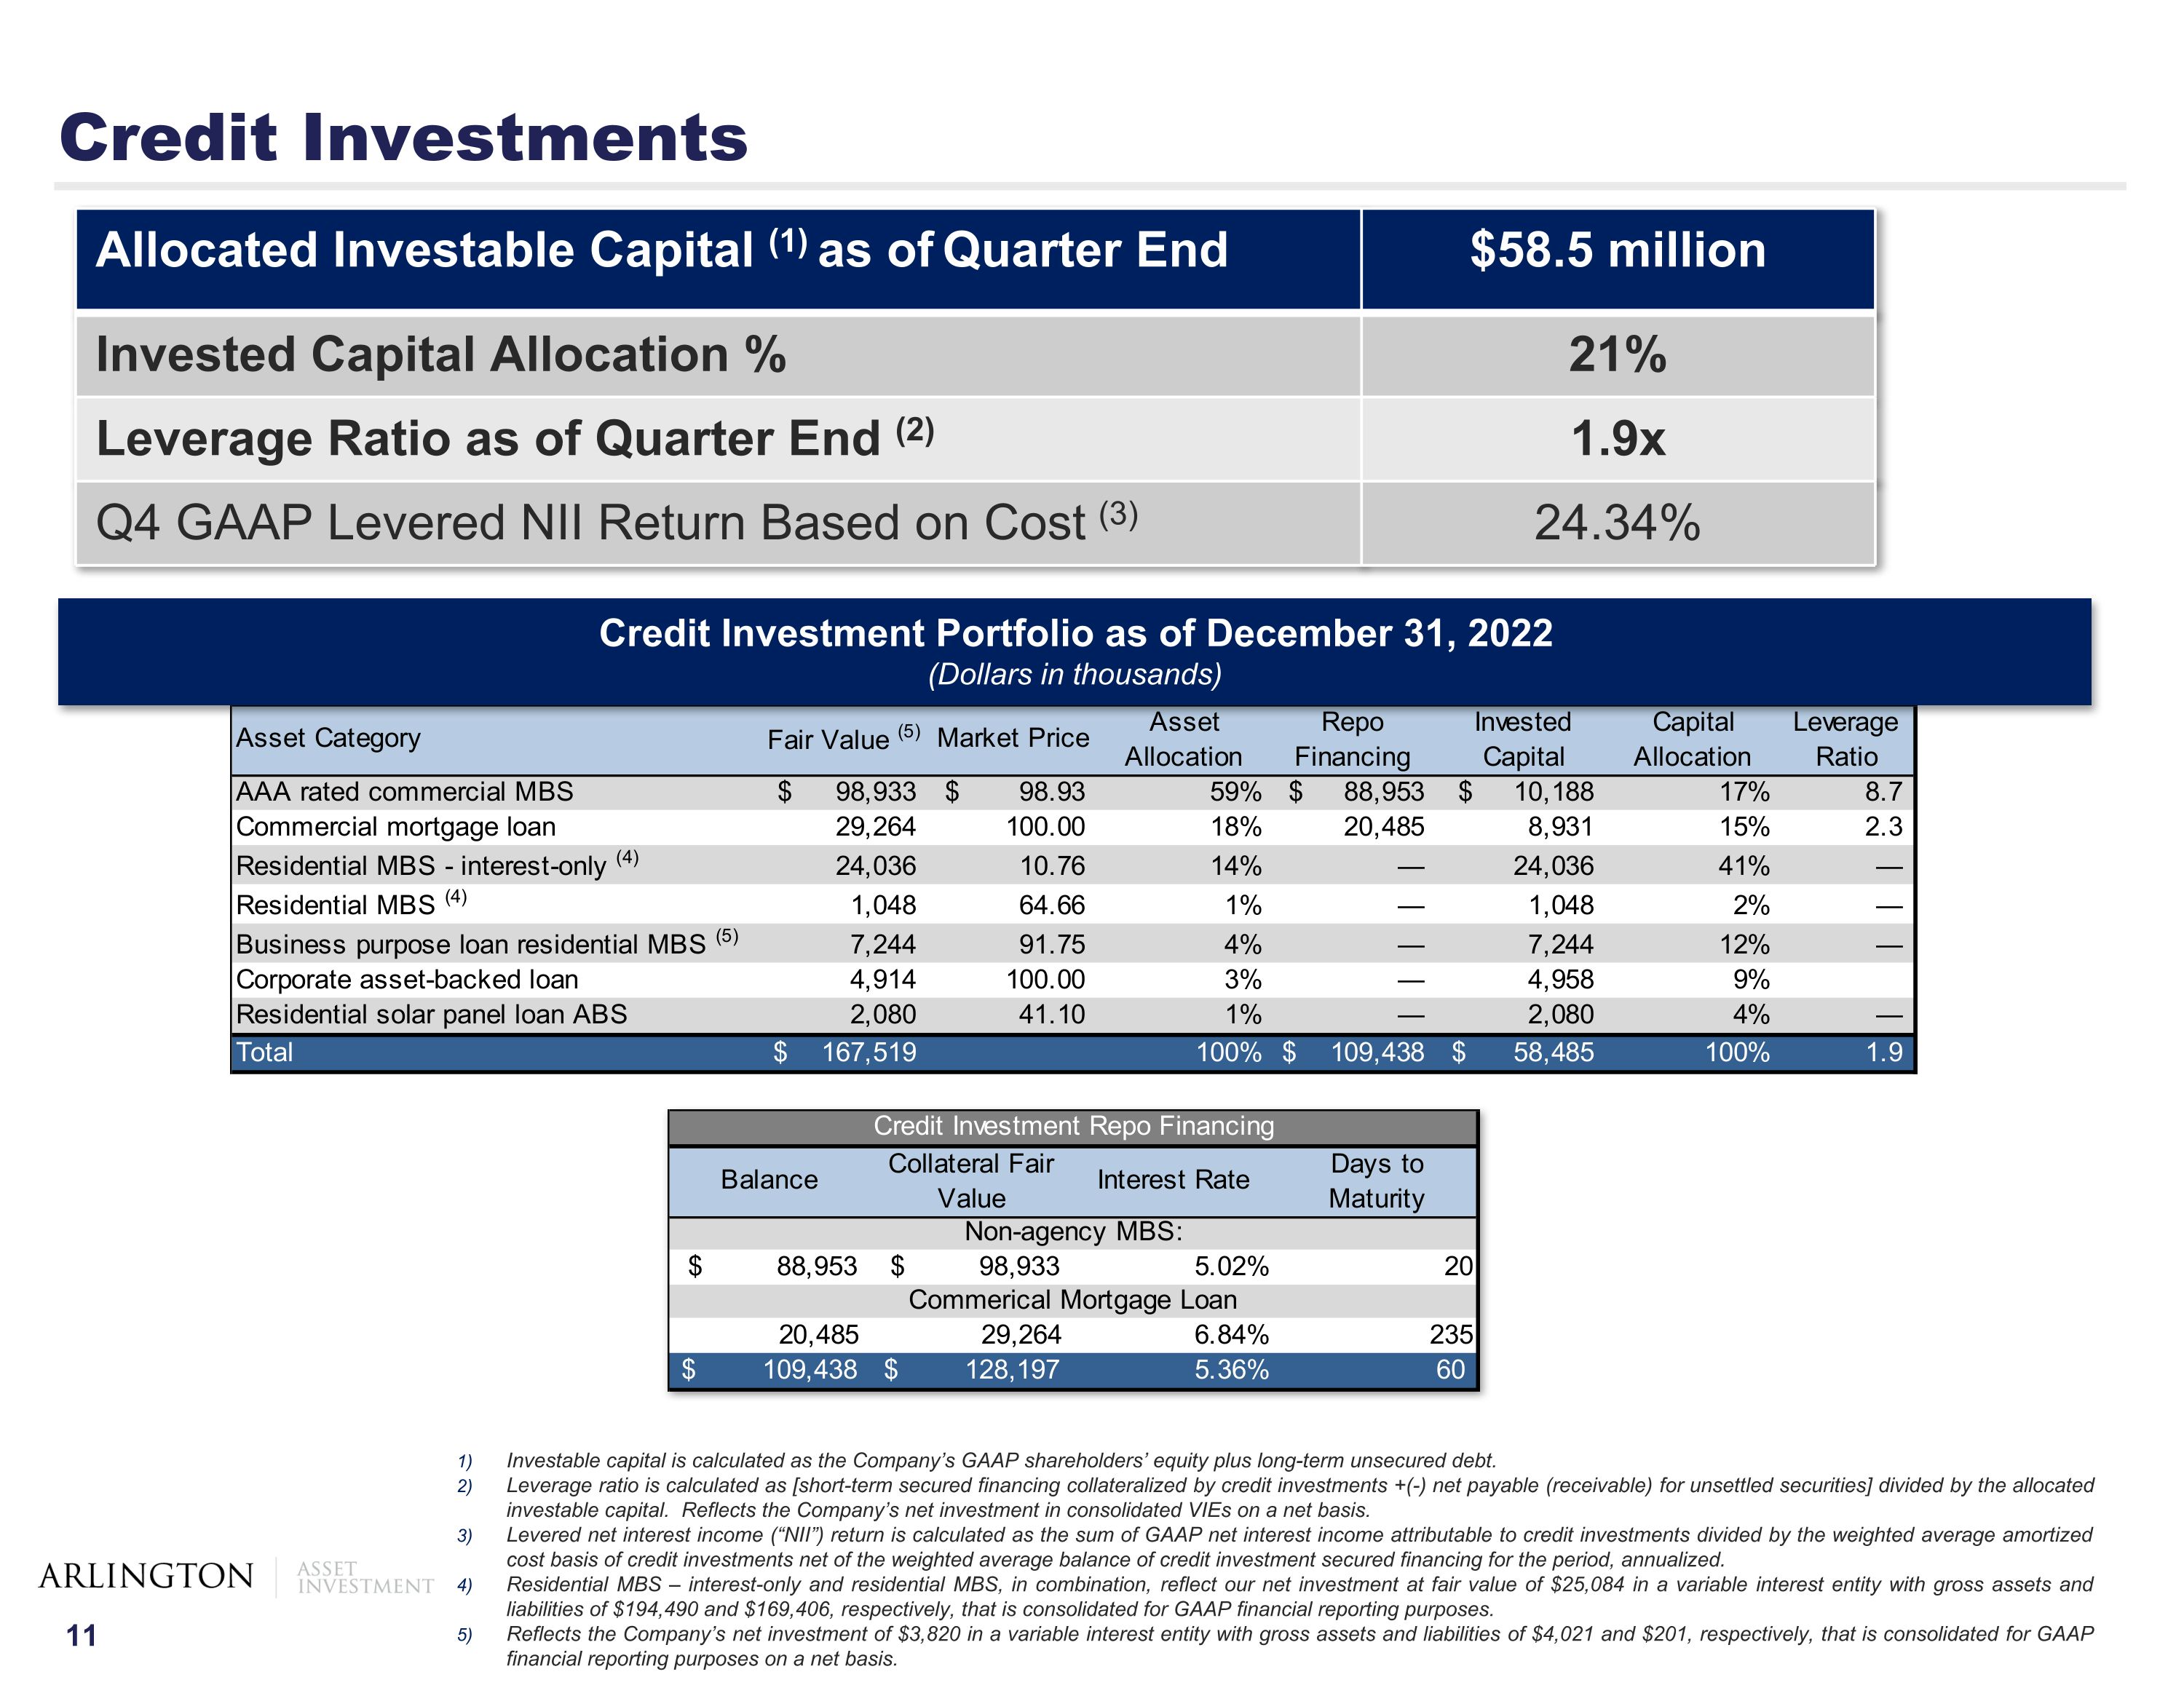
Credit Investments Investable capital is calculated as the Company’s GAAP shareholders’ equity plus long-term unsecured debt. Leverage ratio is calculated as [short-term secured financing collateralized by credit investments +(-) net payable (receivable) for unsettled securities] divided by the allocated investable capital. Reflects the Company’s net investment in consolidated VIEs on a net basis. Levered net interest income (“NII”) return is calculated as the sum of GAAP net interest income attributable to credit investments divided by the weighted average amortized cost basis of credit investments net of the weighted average balance of credit investment secured financing for the period, annualized. Residential MBS – interest-only and residential MBS, in combination, reflect our net investment at fair value of $25,084 in a variable interest entity with gross assets and liabilities of $194,490 and $169,406, respectively, that is consolidated for GAAP financial reporting purposes. Reflects the Company’s net investment of $3,820 in a variable interest entity with gross assets and liabilities of $4,021 and $201, respectively, that is consolidated for GAAP financial reporting purposes on a net basis. Allocated Investable Capital (1) as of Quarter End $58.5 million Invested Capital Allocation % 21% Leverage Ratio as of Quarter End (2) 1.9x Q4 GAAP Levered NII Return Based on Cost (3) 24.34% Credit Investment Portfolio as of December 31, 2022 (Dollars in thousands)

Agency MBS Investments Agency MBS Investment Portfolio as of December 31, 2022 (Dollars in thousands) Investable capital is calculated as the Company’s GAAP shareholders’ equity plus long-term unsecured debt and SFR accumulated depreciation Leverage ratio is calculated as [repurchase agreement financing collateralized by agency MBS +(-) net payable (receivable) for unsettled securities +(-) net long (short) TBA position] divided by the allocated investable capital. Levered net interest income (“NII”) return is calculated as the sum of GAAP net interest income attributable to agency MBS, TBA dollar roll income (expense) and interest rate swap net income (expense) divided by the weighted average amortized cost basis of agency MBS net of the weighted average balance of agency MBS repurchase agreement financing for the period, annualized. To-be-announced (“TBA”) forward purchase and sale agreements are reflected on the balance sheets as derivative assets and liabilities at fair value with a net carrying amount of $5,630 as of December 31, 2022. Allocated Investable Capital (1) as of Quarter End $45.6 million Invested Capital Allocation % 16% Leverage Ratio as of Quarter End (2) 0.0x Q4 Weighted Average Constant Prepayment Rate 4.07% Q4 Weighted Average GAAP Asset Yield 4.16% Q4 Levered NII Return Based on Cost (3) 4.63%
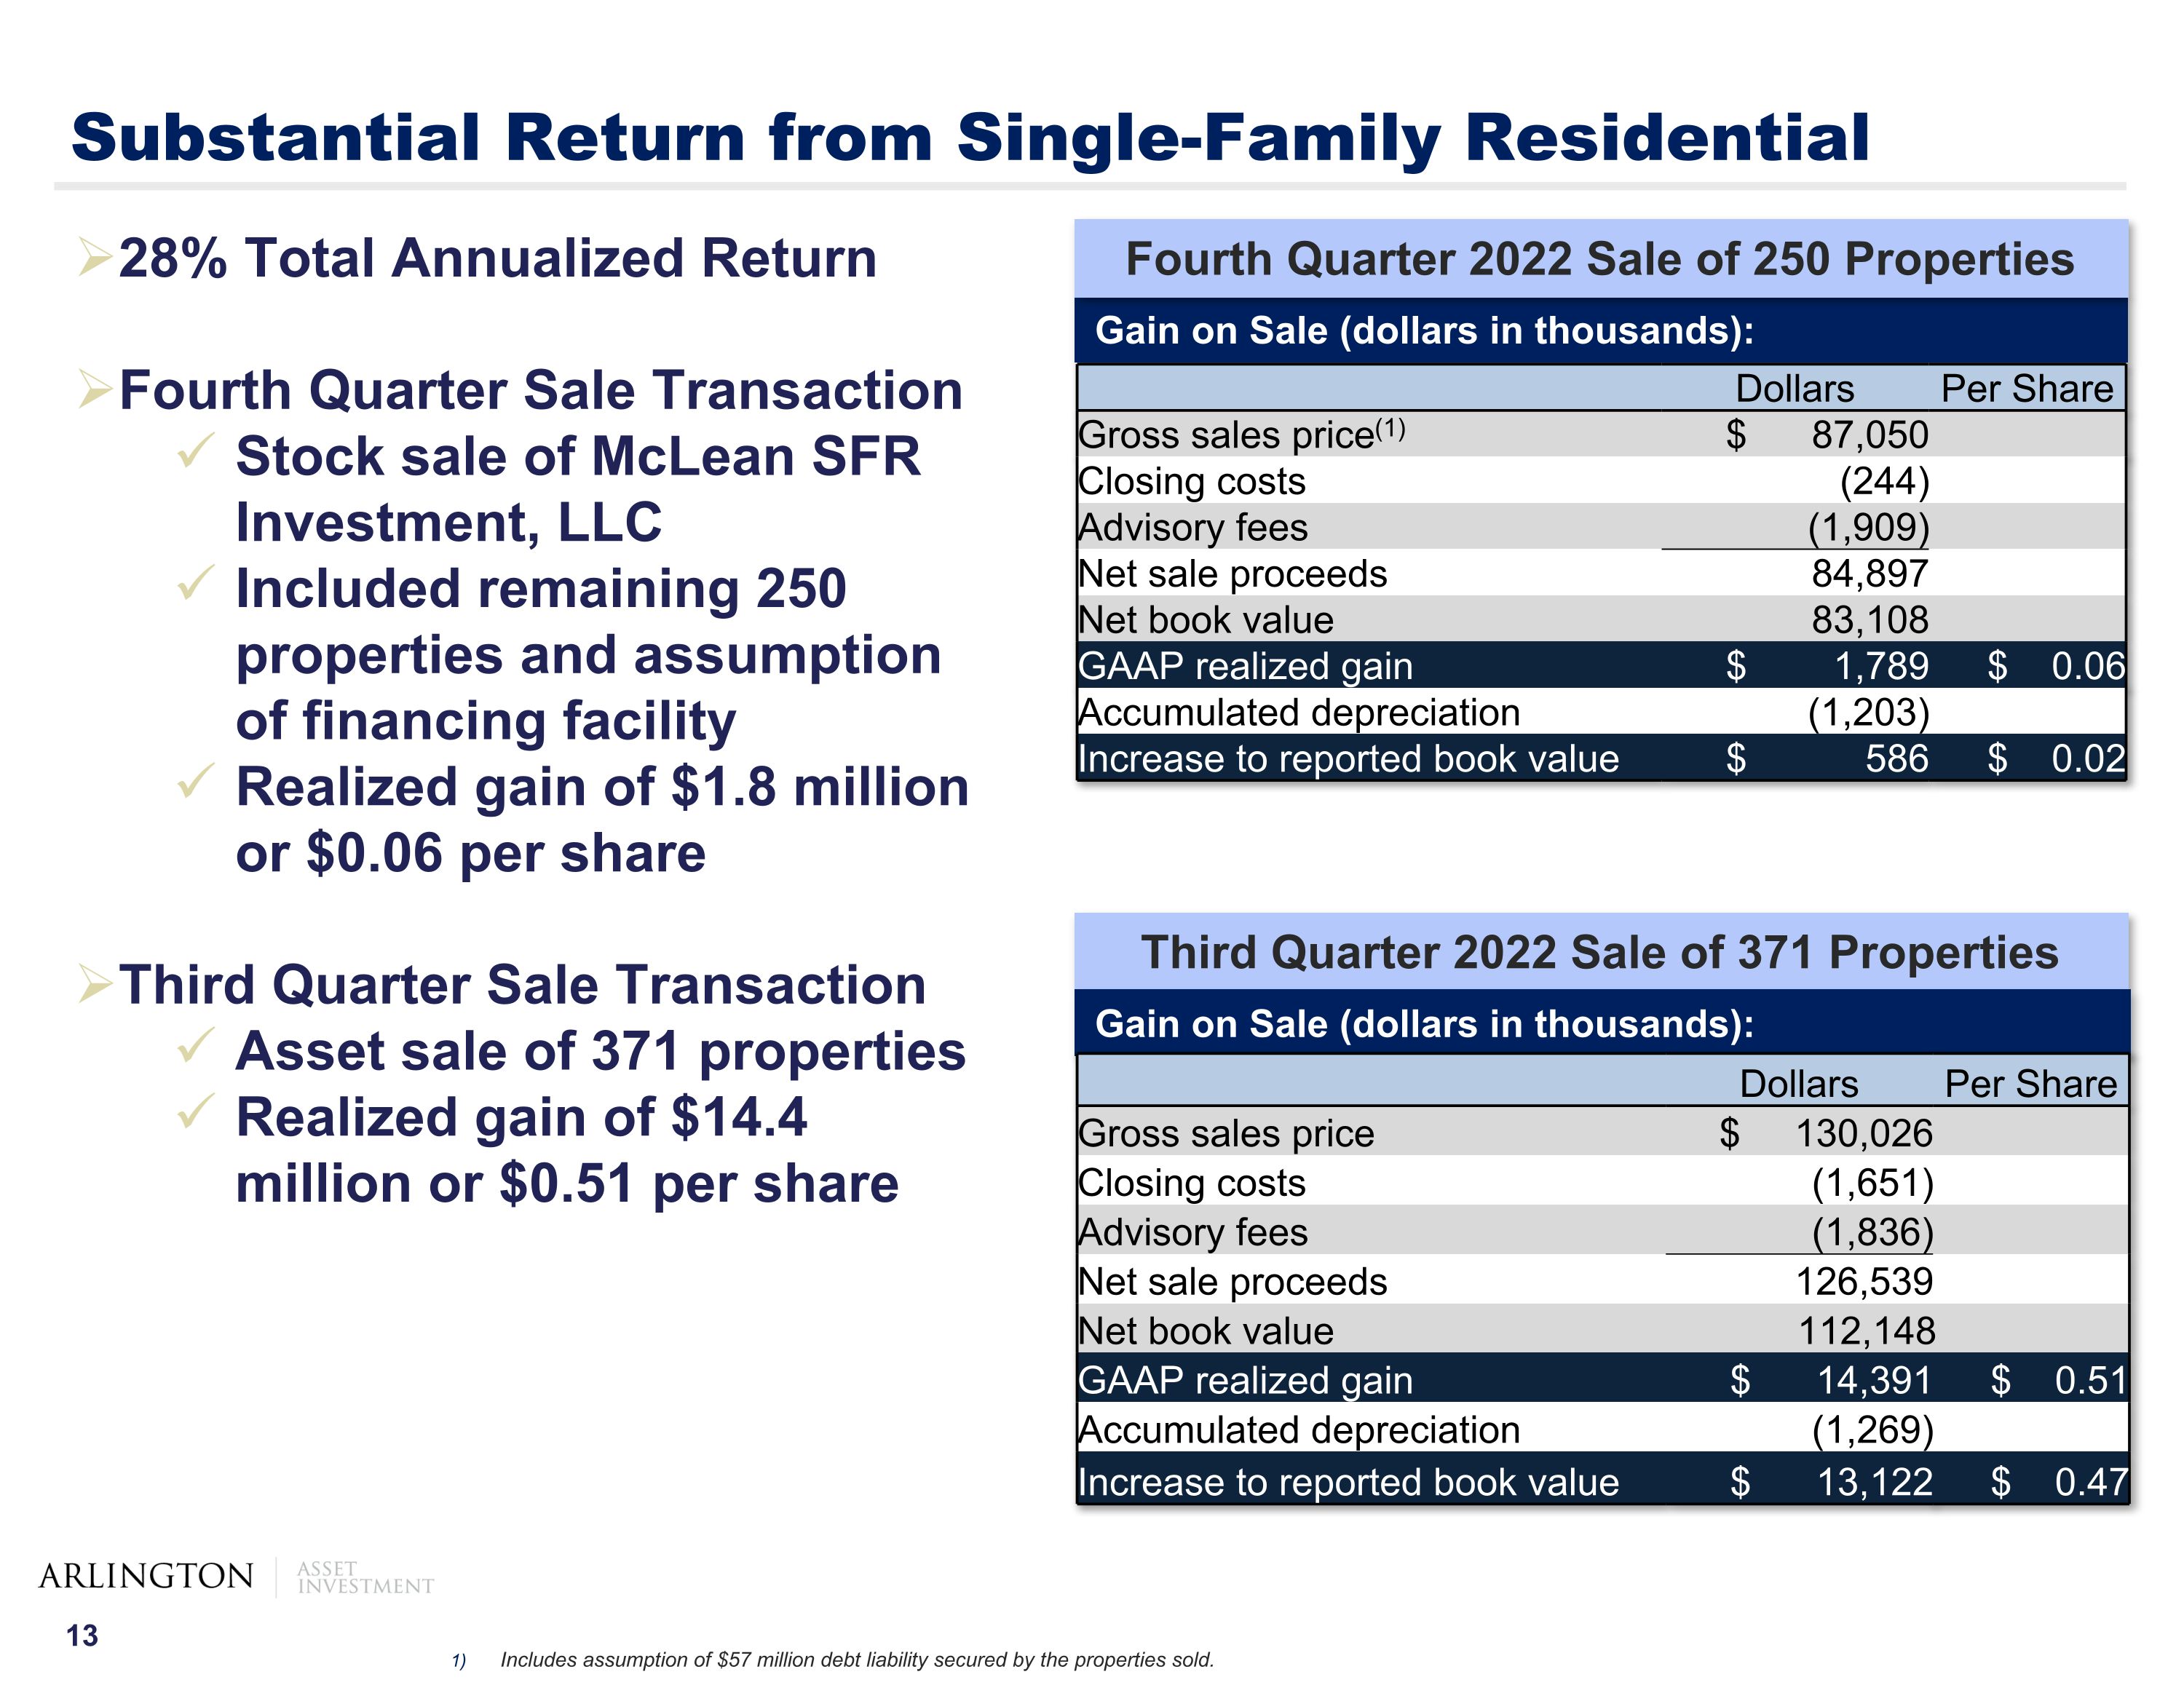
Substantial Return from Single-Family Residential Gain on Sale (dollars in thousands): Third Quarter 2022 Sale of 371 Properties Fourth Quarter 2022 Sale of 250 Properties Gain on Sale (dollars in thousands): 28% Total Annualized Return Fourth Quarter Sale Transaction Stock sale of McLean SFR Investment, LLC Included remaining 250 properties and assumption of financing facility Realized gain of $1.8 million or $0.06 per share Third Quarter Sale Transaction Asset sale of 371 properties Realized gain of $14.4 million or $0.51 per share Includes assumption of $57 million debt liability secured by the properties sold. Dollars Per Share Gross sales price(1) $ 87,050 Closing costs (244) Advisory fees (1,909) Net sale proceeds 84,897 Net book value 83,108 GAAP realized gain $ 1,789 $ 0.06 Accumulated depreciation (1,203) Increase to reported book value $ 586 $ 0.02 Dollars Per Share Gross sales price $ 130,026 Closing costs (1,651) Advisory fees (1,836) Net sale proceeds 126,539 Net book value 112,148 GAAP realized gain $ 14,391 $ 0.51 Accumulated depreciation (1,269) Increase to reported book value $ 13,122 $ 0.47
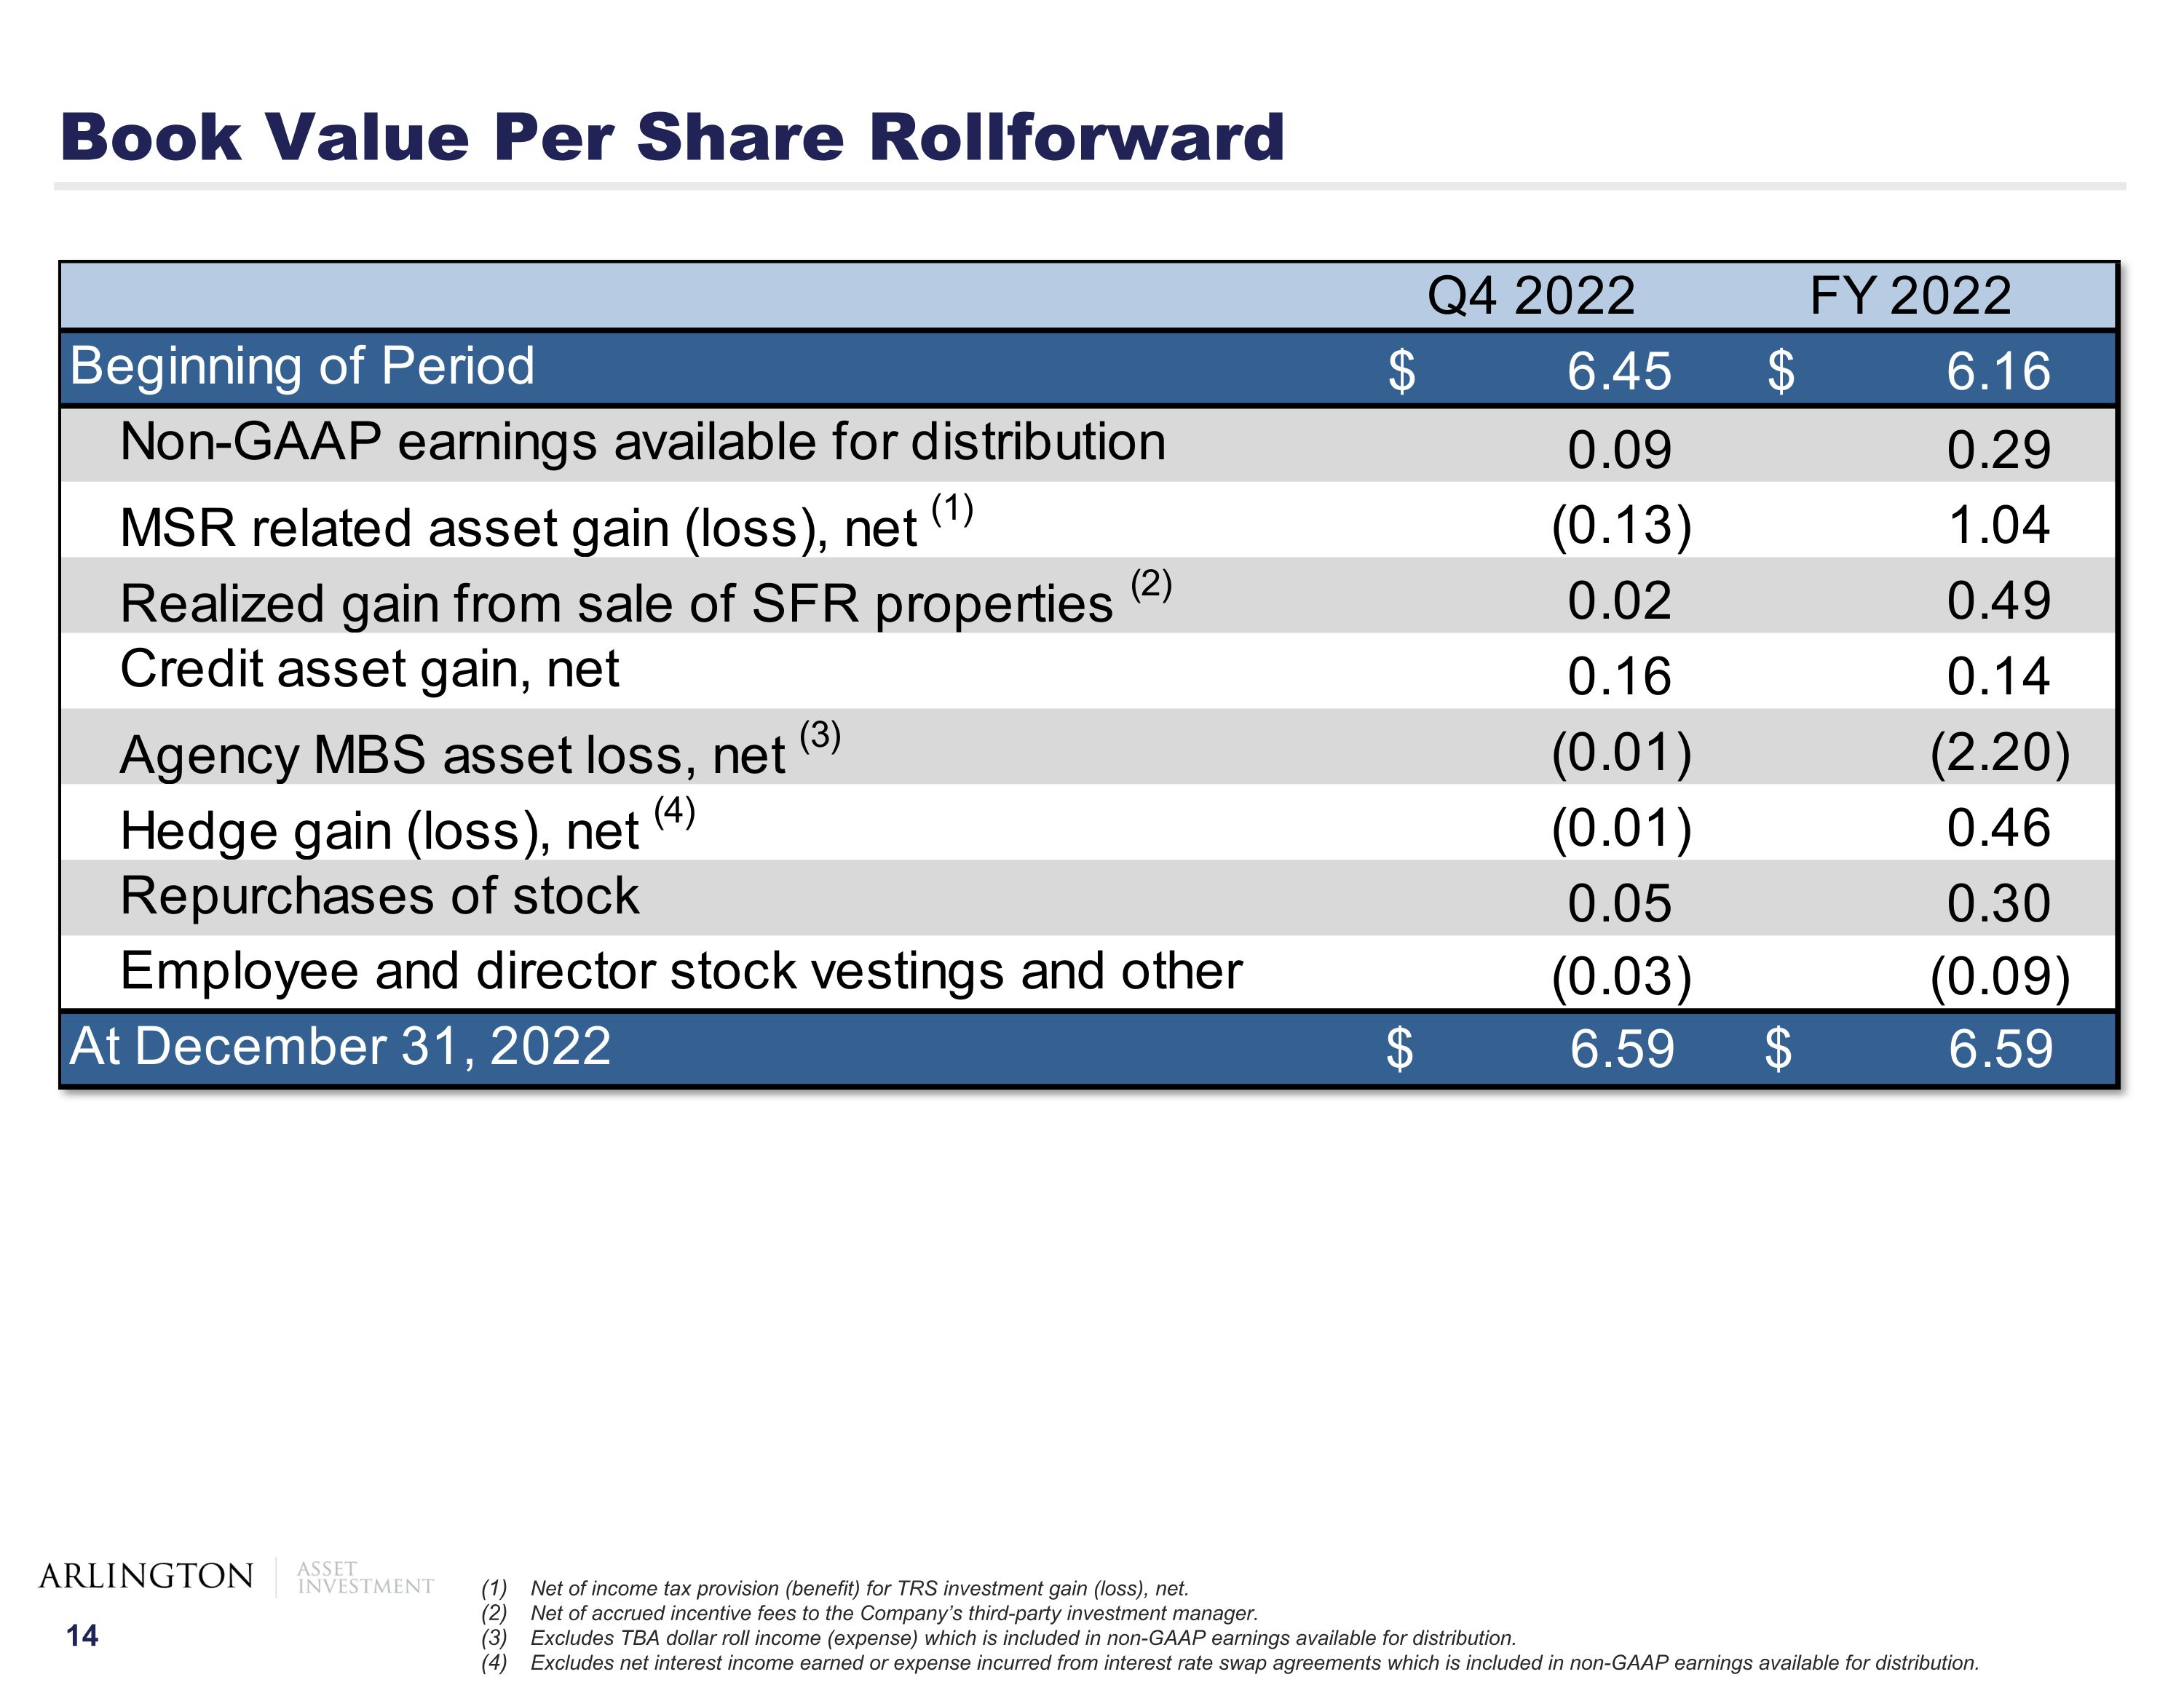
Book Value Per Share Rollforward Net of income tax provision (benefit) for TRS investment gain (loss), net. Net of accrued incentive fees to the Company’s third-party investment manager. Excludes TBA dollar roll income (expense) which is included in non-GAAP earnings available for distribution. Excludes net interest income earned or expense incurred from interest rate swap agreements which is included in non-GAAP earnings available for distribution.
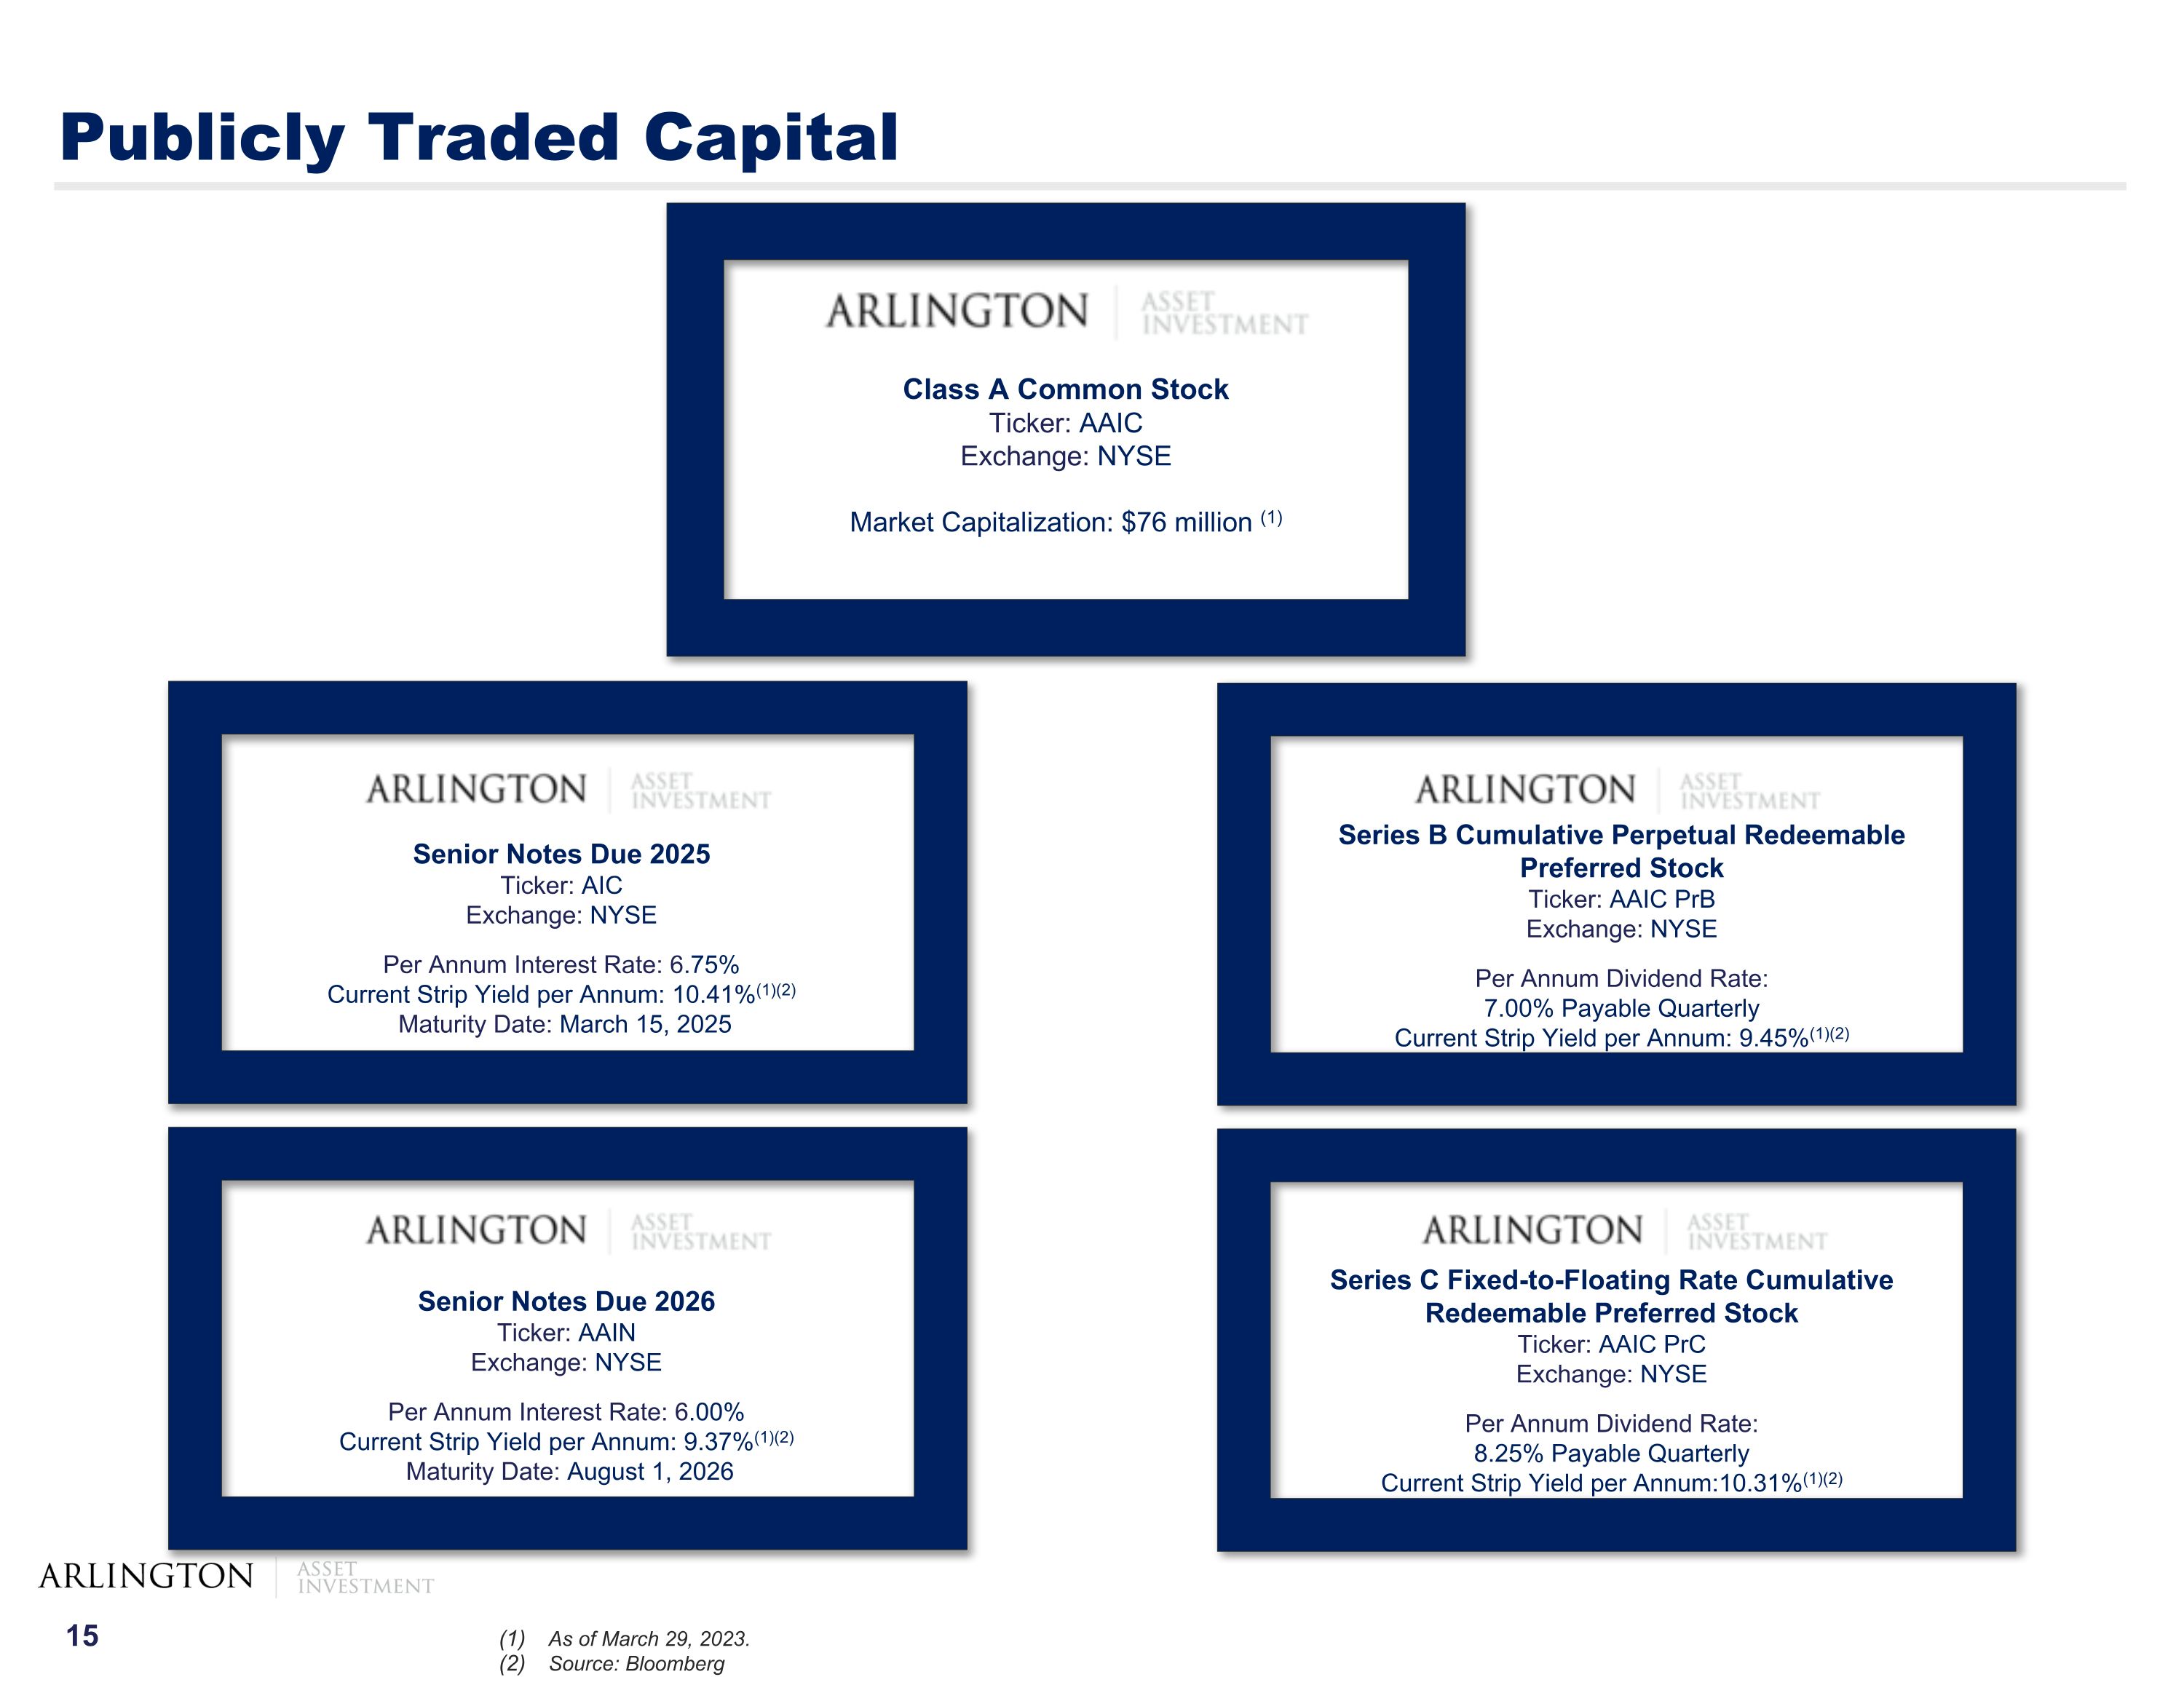
Publicly Traded Capital Class A Common Stock Ticker: AAIC Exchange: NYSE Market Capitalization: $76 million (1) Senior Notes Due 2026 Ticker: AAIN Exchange: NYSE Per Annum Interest Rate: 6.00% Current Strip Yield per Annum: 9.37%(1)(2) Maturity Date: August 1, 2026 Series B Cumulative Perpetual Redeemable Preferred Stock Ticker: AAIC PrB Exchange: NYSE Per Annum Dividend Rate: 7.00% Payable Quarterly Current Strip Yield per Annum: 9.45%(1)(2) As of March 29, 2023. Source: Bloomberg Series C Fixed-to-Floating Rate Cumulative Redeemable Preferred Stock Ticker: AAIC PrC Exchange: NYSE Per Annum Dividend Rate: 8.25% Payable Quarterly Current Strip Yield per Annum:10.31%(1)(2) Senior Notes Due 2025 Ticker: AIC Exchange: NYSE Per Annum Interest Rate: 6.75% Current Strip Yield per Annum: 10.41%(1)(2) Maturity Date: March 15, 2025
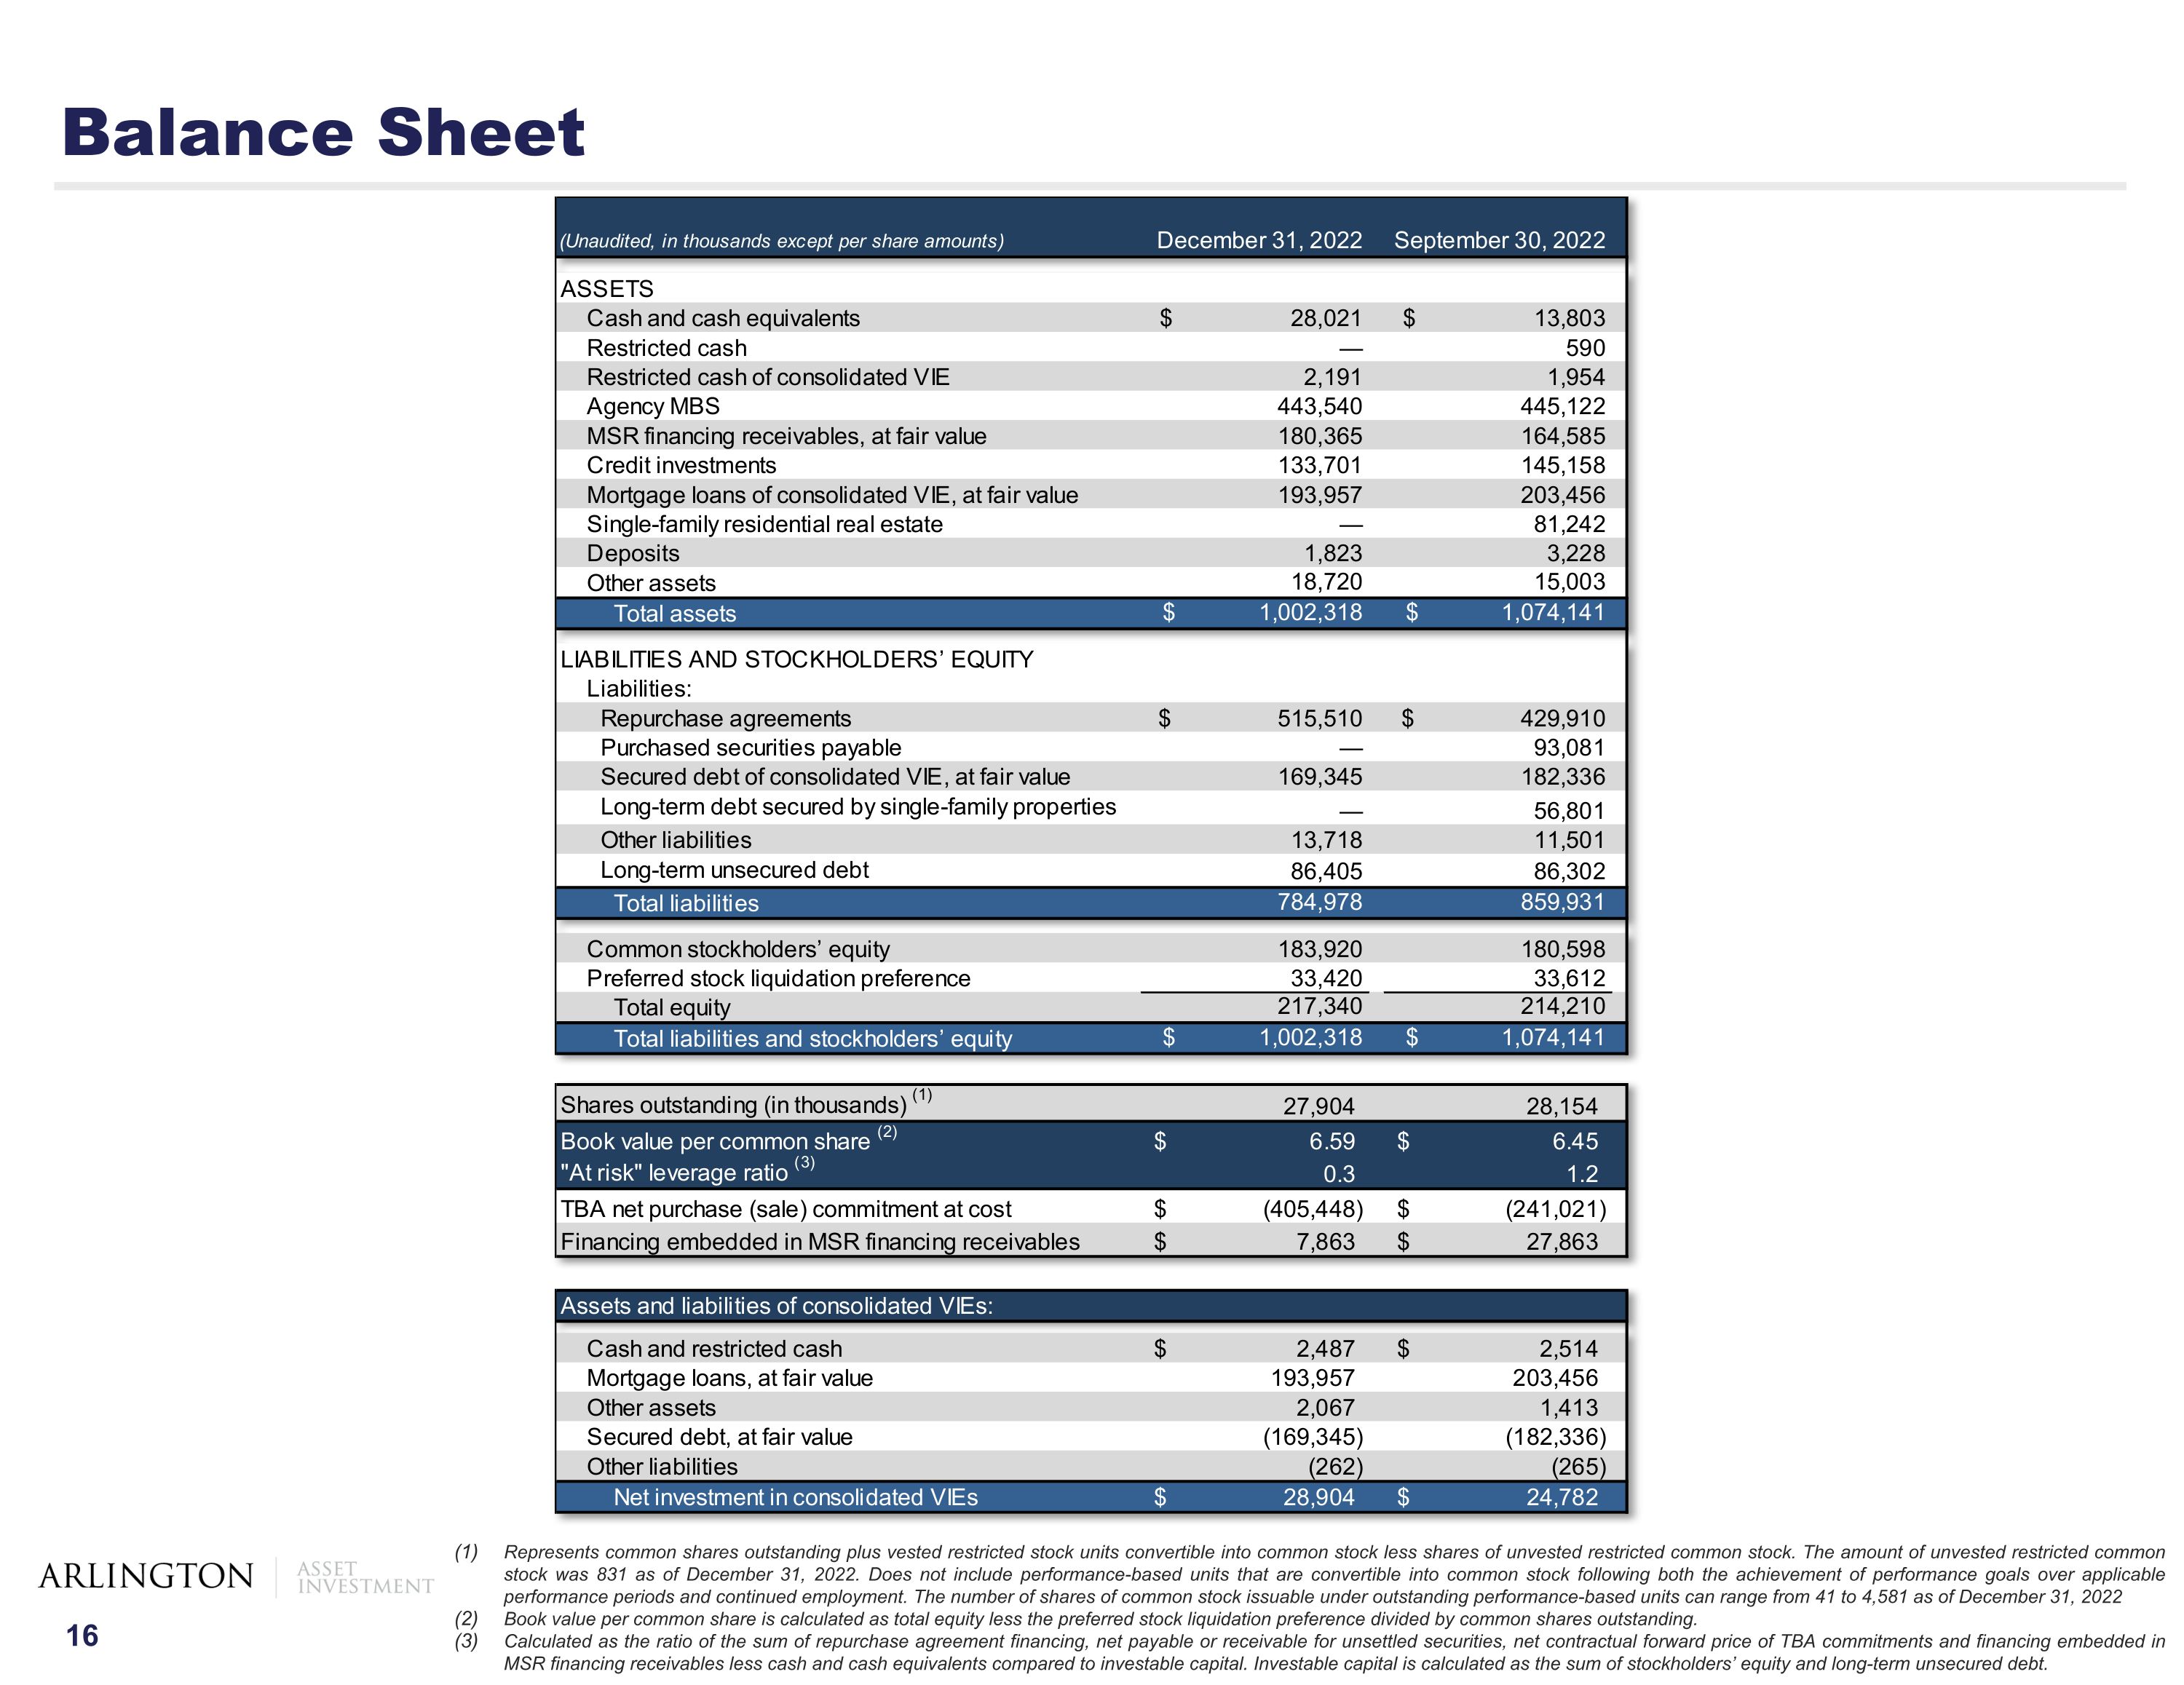
Balance Sheet Represents common shares outstanding plus vested restricted stock units convertible into common stock less shares of unvested restricted common stock. The amount of unvested restricted common stock was 831 as of December 31, 2022. Does not include performance-based units that are convertible into common stock following both the achievement of performance goals over applicable performance periods and continued employment. The number of shares of common stock issuable under outstanding performance-based units can range from 41 to 4,581 as of December 31, 2022 Book value per common share is calculated as total equity less the preferred stock liquidation preference divided by common shares outstanding. Calculated as the ratio of the sum of repurchase agreement financing, net payable or receivable for unsettled securities, net contractual forward price of TBA commitments and financing embedded in MSR financing receivables less cash and cash equivalents compared to investable capital. Investable capital is calculated as the sum of stockholders’ equity and long-term unsecured debt.
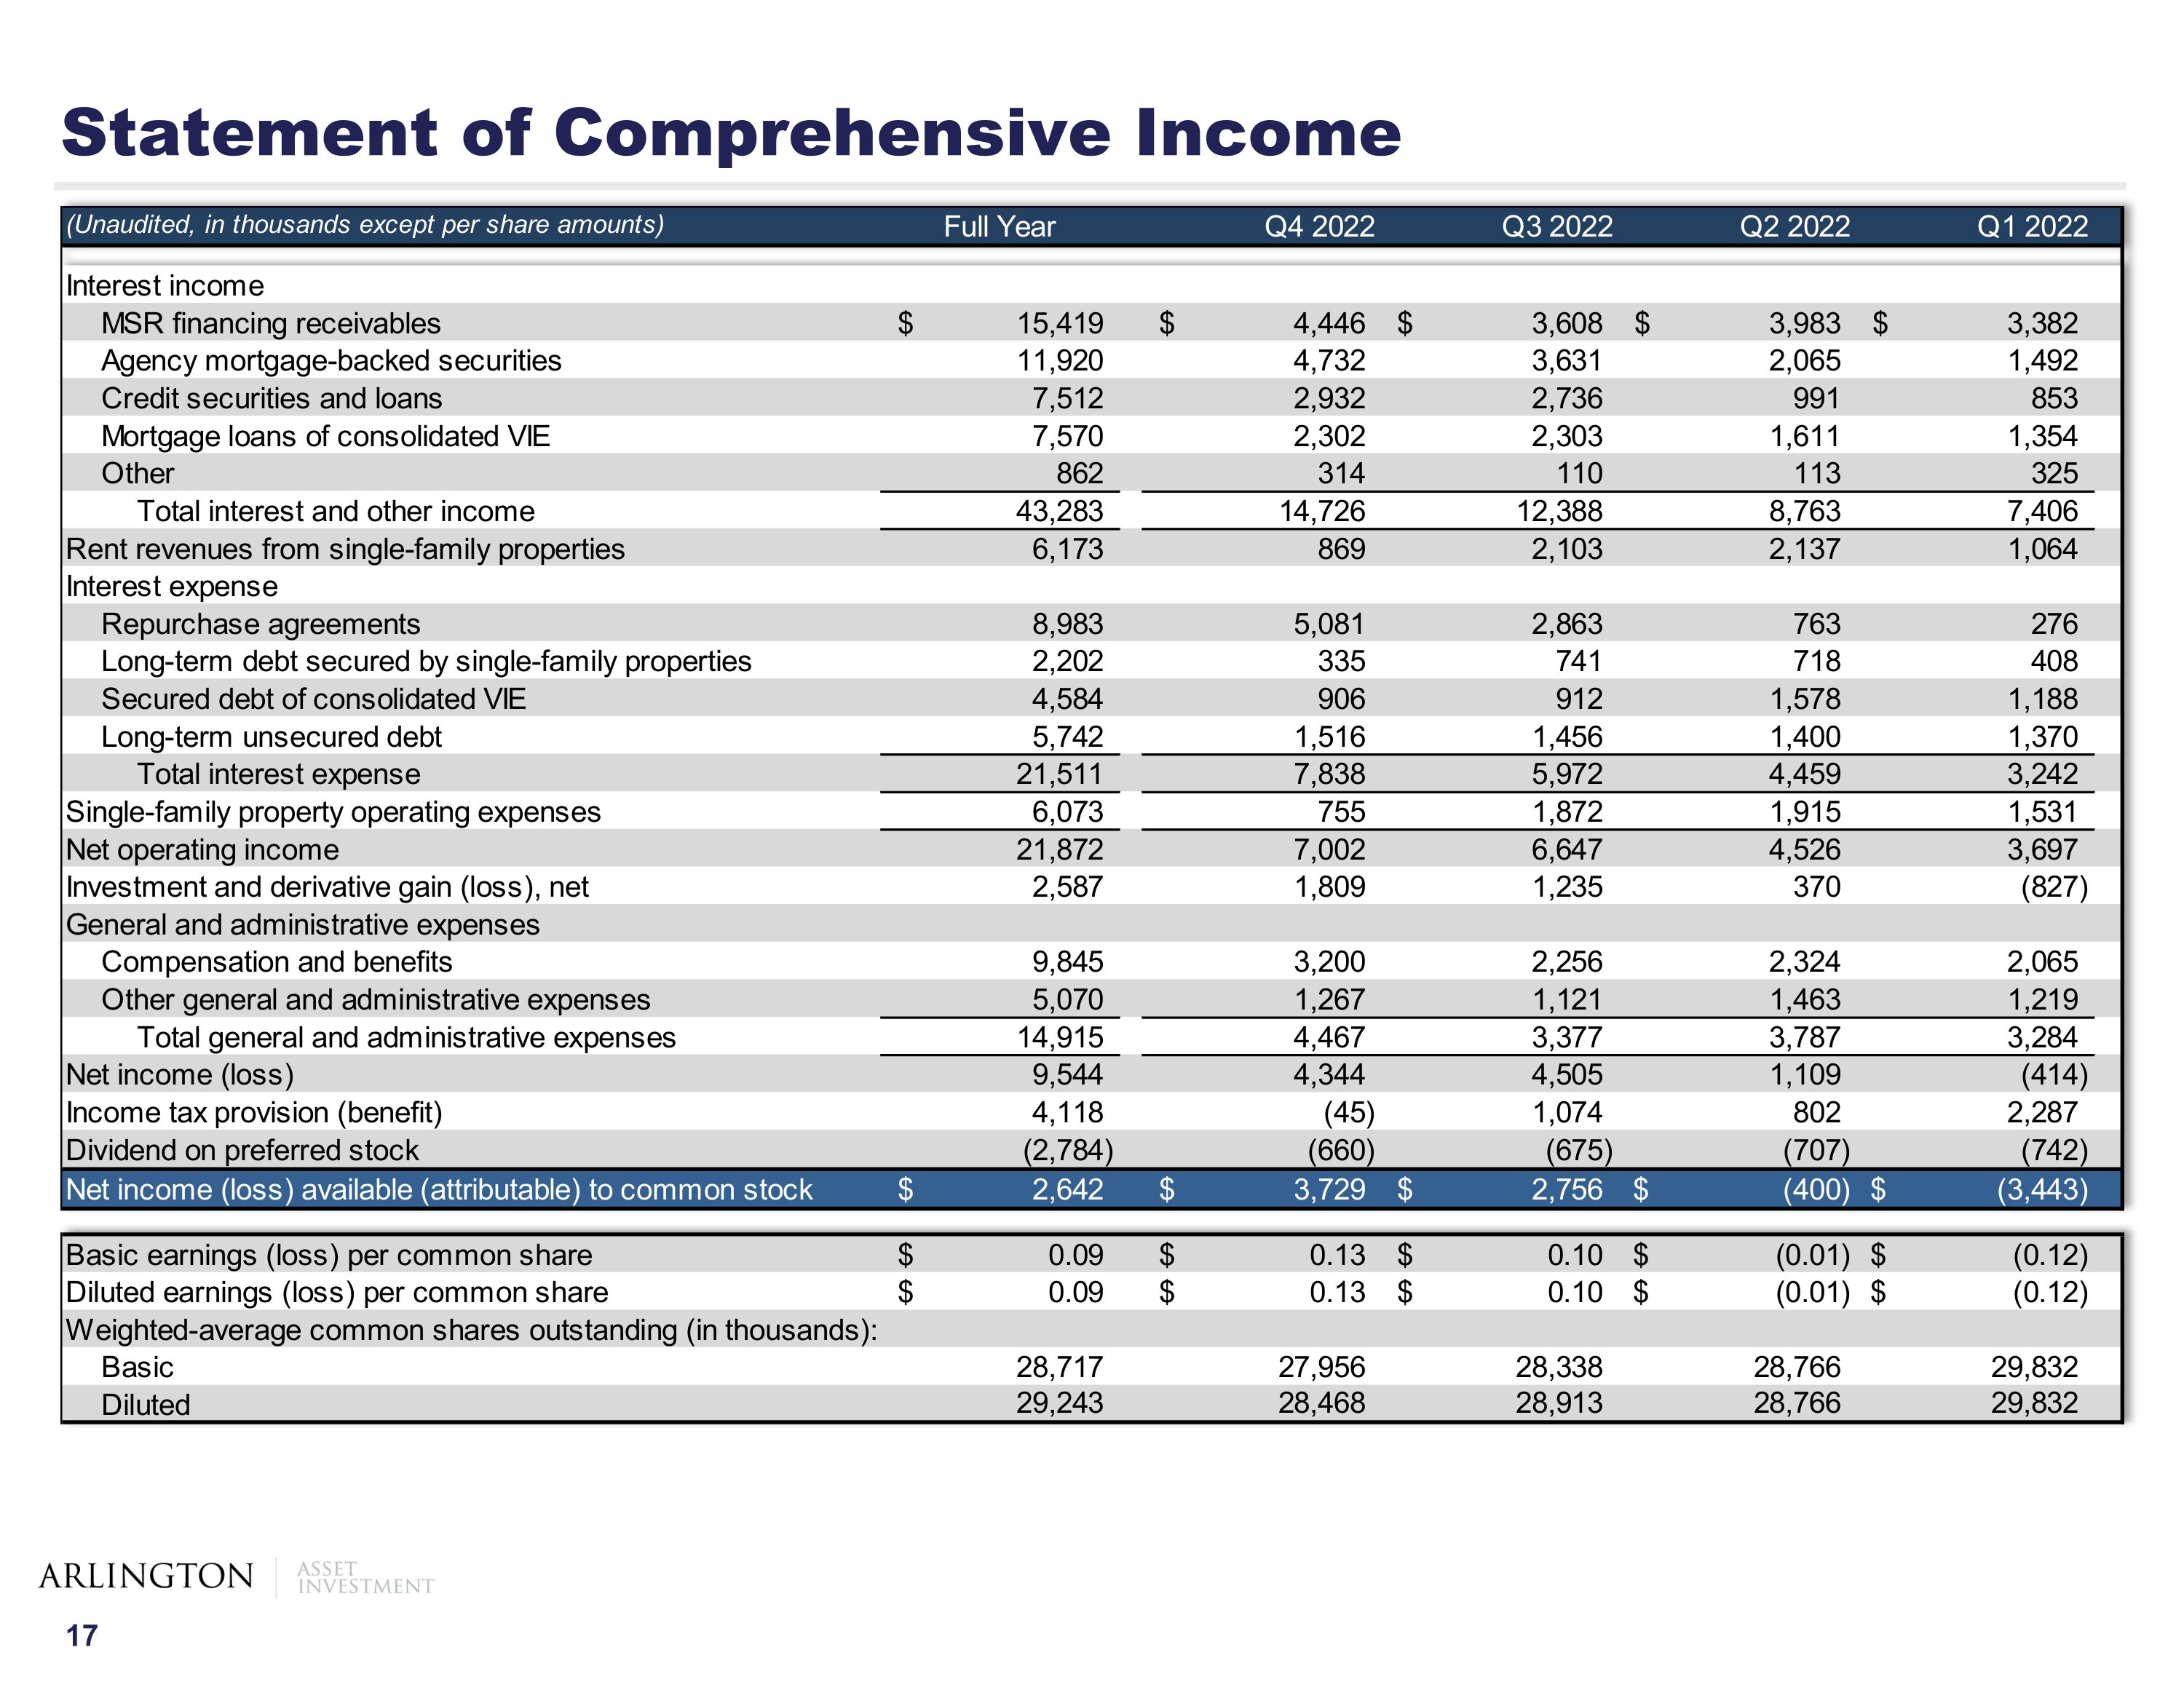
Statement of Comprehensive Income
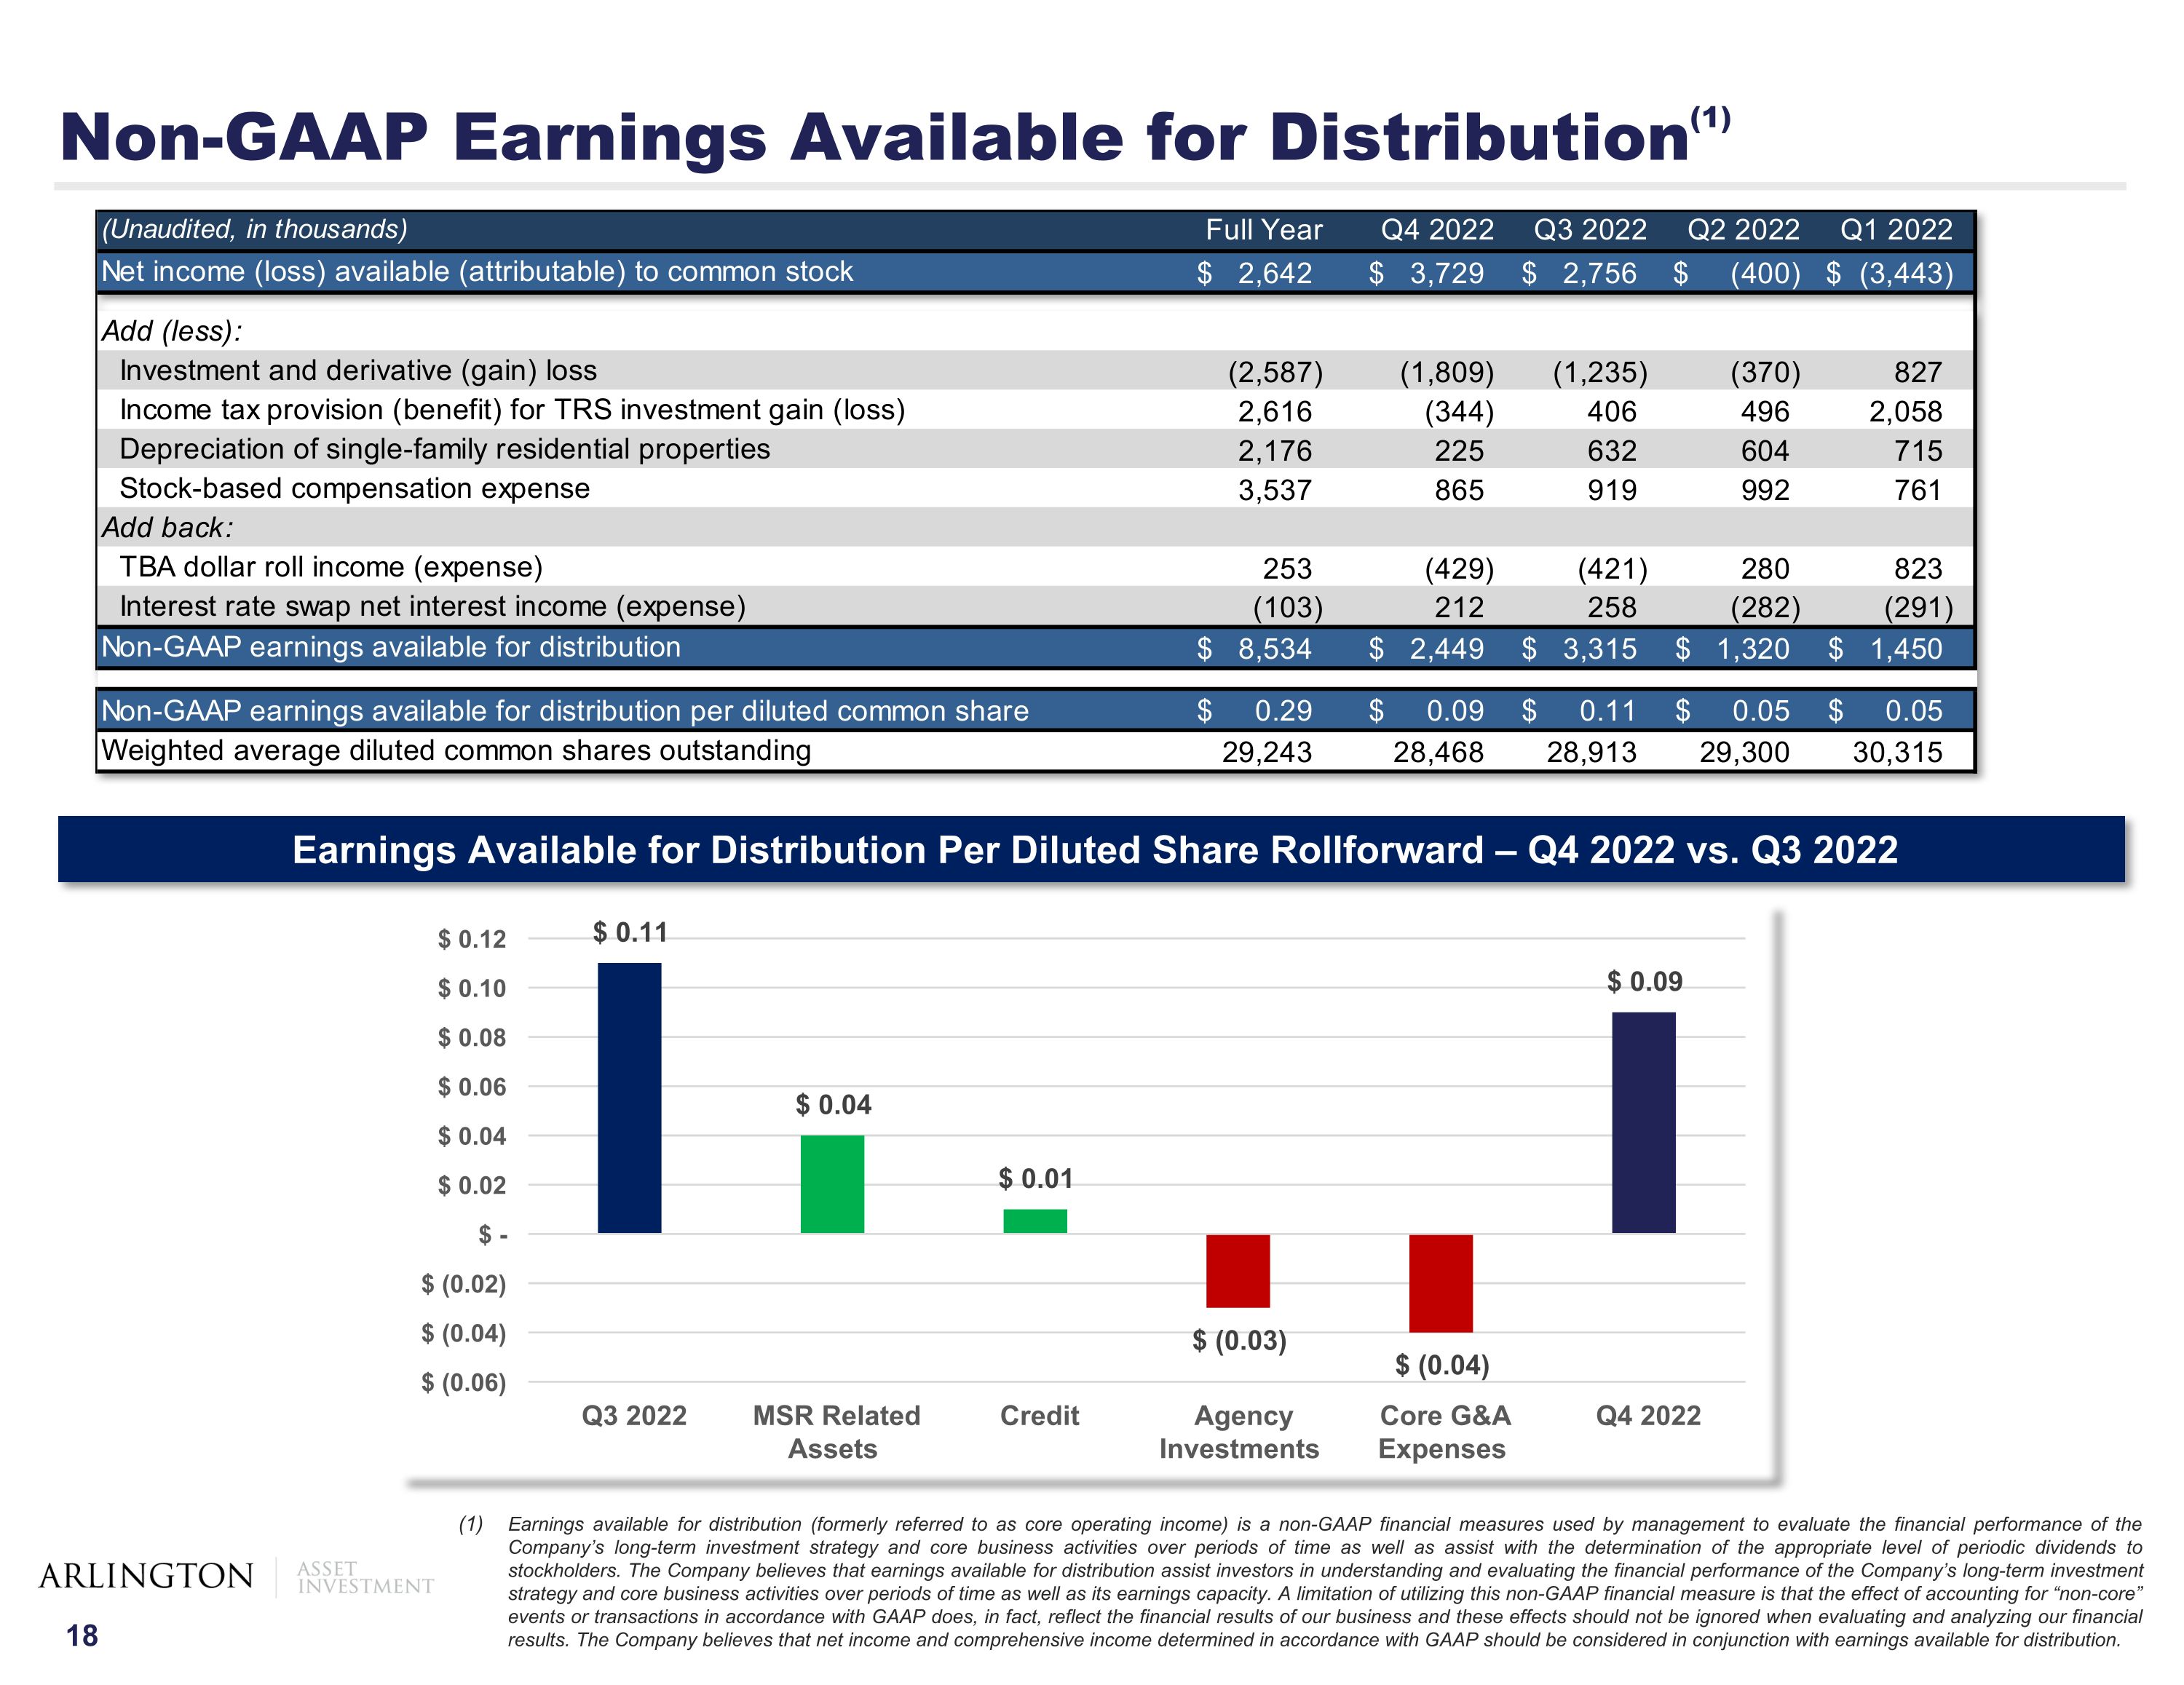
Non-GAAP Earnings Available for Distribution(1) Earnings available for distribution (formerly referred to as core operating income) is a non-GAAP financial measures used by management to evaluate the financial performance of the Company’s long-term investment strategy and core business activities over periods of time as well as assist with the determination of the appropriate level of periodic dividends to stockholders. The Company believes that earnings available for distribution assist investors in understanding and evaluating the financial performance of the Company’s long-term investment strategy and core business activities over periods of time as well as its earnings capacity. A limitation of utilizing this non-GAAP financial measure is that the effect of accounting for “non-core” events or transactions in accordance with GAAP does, in fact, reflect the financial results of our business and these effects should not be ignored when evaluating and analyzing our financial results. The Company believes that net income and comprehensive income determined in accordance with GAAP should be considered in conjunction with earnings available for distribution. Earnings Available for Distribution Per Diluted Share Rollforward – Q4 2022 vs. Q3 2022

Interest rate sensitivity of MBS and TBA commitments is derived from The Yield Book, a third-party model. Interest rate sensitivity of MSR financing receivables is derived from an internal model. Actual results could differ significantly from these estimates. Interest rate sensitivity is based on assumptions resulting in certain limitations, including (i) an instantaneous shift in rates with no changes to the slope of the yield curve, (ii) the effect of negative interest rates, (iii) no changes in MBS spreads, and (iv) no changes to the investment or hedge portfolio. Duration for agency MBS is derived from the Citi’s “The Yield Book,” a third-party model. Duration for MSR financing receivables is derived from an internal model. Duration is a measure of how much the price of an asset or liability is expected to change if interest rates move in a parallel manner and is dependent upon several subjective inputs and assumptions. Actual results could differ materially from these estimates. In addition, different models could generate materially different estimates using similar inputs and assumptions. Total liability and hedge duration is expressed in asset units. Excludes unsecured debt. Agency MBS spread sensitivity is derived from The Yield Book, a third-party model. Actual results could differ significantly from these estimates. The estimated change in book value reflects an assumed spread weighted average duration of 4.6 years, which is a model-based assumption that is dependent upon the size and composition of our portfolio as well as economic conditions present as of December 31, 2022. The agency MBS spread sensitivity is based on assumptions resulting in certain limitations, including (i) no changes in interest rates, and (ii) no changes to the investment or hedge portfolio. Interest Rate Sensitivity as of December 31, 2022 (1) Book Value Sensitivity to Interest Rates and Spreads Agency MBS Spread Sensitivity as of December 31, 2022 (4) Agency MBS and MSR Portfolio Net Duration Gap as of December 31, 2022