Pay vs Performance Disclosure - USD ($)
Dec. 31, 2022
Dec. 31, 2021
Dec. 31, 2020
Pay vs. Performance
In accordance with Item 402(v) of Regulation S-K, we are providing
the following information regarding the relationship between compensation of our Chief Executive Officer (“CEO”) and named executive officers (“NEOs”) and certain
financial performance measures of Primo Water. For further information on Primo Water’s pay-for-performance philosophy and how executive compensation aligns with the Company’s performance, refer to the “Compensation
Discussion and Analysis” section of this proxy statement.
Pay vs. Performance Table
| |
|
| |
|
| |
|
| |
|
| |
|
| |
Value of Initial Fixed $100
Investment Based On:
|
| |
|
| |
|
| |||
| |
Year
|
| |
Summary
Compensation
Table Total
for CEO(1)
|
| |
Compensation
Actually Paid
to CEO(2)
|
| |
Average
Summary
Compensation
Table Total for
Non-CEO
NEOs(3)
|
| |
Average
Compensation
Actually Paid
to Non-CEO
NEOs(4)
|
| |
Total
Shareholder
Return(5)
|
| |
Peer Group
Total
Shareholder
Return(6)
|
| |
Net Income
(millions)(7)
|
| |
Bonus-Adjusted EBITDA
(millions)(8)
|
|
| |
(a)
|
| |
(b)
|
| |
(c)
|
| |
(d)
|
| |
(e)
|
| |
(f)
|
| |
(g)
|
| |
(h)
|
| |
(i)
|
|
| |
2022
|
| |
$5,889,707
|
| |
$4,828,690
|
| |
$1,417,865
|
| |
$1,039,138
|
| |
$121.50
|
| |
$140.50
|
| |
$29.6
|
| |
$431.9
|
|
| |
2021
|
| |
$5,332,744
|
| |
$7,696,386
|
| |
$2,690,759
|
| |
$3,394,000
|
| |
$135.20
|
| |
$153.94
|
| |
-$3.20
|
| |
$374.7
|
|
| |
2020
|
| |
$6,999,545
|
| |
$5,874,930
|
| |
$2,010,274
|
| |
$1,924,436
|
| |
$118.58
|
| |
$128.45
|
| |
-$131.70
|
| |
$360.0
|
|
|
(1)
|
The dollar amounts reported in column (b) reflect the total compensation reported for Mr. Harrington, our CEO during the covered years, in the “Total” column in the “Summary
Compensation Table” for each corresponding year.
|
|
(2)
|
The dollar amounts reported in column (c) represent the amount of “compensation actually paid” to Mr. Harrington, by applying
the following adjustments to Mr. Harrington’s total compensation for each year, as computed in accordance with Item 402(v). The dollar amounts do not reflect the actual amount of compensation earned by or paid to Mr. Harrington during the
applicable year.
|
| |
Year
|
| |
Reported Summary
Compensation Table
Total for CEO
|
| |
Less: Reported
Value of Equity
Awards to CEO(a)
|
| |
Add: Equity Award
Adjustments to
CEO (b),(c)
|
| |
Compensation
Actually Paid to
CEO
|
|
| |
2022
|
| |
$5,889,707
|
| |
$4,000,000
|
| |
$2,938,983
|
| |
$4,828,690
|
|
| |
2021
|
| |
$5,332,744
|
| |
$3,500,000
|
| |
$5,863,642
|
| |
$7,696,386
|
|
| |
2020
|
| |
$6,999,545
|
| |
$5,426,981
|
| |
$4,302,366
|
| |
$5,874,930
|
|
|
(a)
|
The amounts in this column reflect the aggregate grant-date fair value reported in the “Stock
Awards” and “Option/SAR Awards” columns in the Summary Compensation Table for the applicable year.
|
|
(b)
|
The amounts deducted or added in calculating the total equity award adjustments are as follows:
|
| |
Year
|
| |
Year End Fair
Value of
Outstanding
and Unvested
Equity
Awards
Granted in the
Year
|
| |
Year over Year
Change in Fair
Value of Equity
Awards Granted
in Prior Years
that Vested in the
Year
|
| |
Year over Year
Change in Fair
Value of
Outstanding and
Unvested Equity
Awards Granted in
Prior Years
|
| |
Value of
Dividends or
other Earnings
Paid on Stock
or Option
Awards not
Otherwise Reflected in
Fair Value or
Total
Compensation
|
| |
Total Equity
Award
Adjustments
|
|
| |
2022
|
| |
$4,084,083
|
| |
($708,578)
|
| |
($650,162)
|
| |
$213,639
|
| |
$2,938,983
|
|
| |
2021
|
| |
$3,619,051
|
| |
$292,642
|
| |
$1,844,792
|
| |
$107,157
|
| |
$5,863,642
|
|
| |
2020
|
| |
$2,899,519
|
| |
$624,422
|
| |
$706,574
|
| |
$71,851
|
| |
$4,302,366
|
|
|
(c)
|
In accordance with Item 402(v) requirements, the fair values of unvested and outstanding equity awards to our NEOs were
remeasured as of the end of each fiscal year, and as of each vesting date for each award that vested in a covered year, during the years displayed in the table above. For options, the fair values as of each measurement date were
determined using a binomial lattice model, which considers the circumstances of the grant at the measurement date, with assumptions and methodologies regarding volatility, dividend yield, and risk-free rates that are generally consistent
with those used to estimate fair value at grant under U.S. GAAP. The range of estimates used in the fair value calculations are as follows: (i) for 2022, remaining option contractual life between 7.0 years – 8.0 years, volatility of 35%, dividend yield between 1.8%-1.9%, and risk-free rate between 3.1%-3.9%; (ii) for 2021, remaining option contractual life between 7.0 years – 9.0 years, volatility between 33%-36%, dividend yield of 1.4%, and risk-free rate between 1.2%-1.5%; (iii) for 2020, remaining option contractual life between 3.0 years – 9.9 years, volatility between 29%-35%, dividend yield between
1.5%-2.7%, and
risk-free rate between 0.5%-1.1%.
For performance-based awards, the fair values reflect the probable outcome of the performance vesting conditions as of each measurement date.
|
|
(3)
|
The dollar amounts reported in column (d) represent the average of the total compensation reported for the NEOs (excluding
Mr. Harrington) in the “Total” column of the Summary Compensation Table for each corresponding year. The NEOs (excluding Mr. Harrington) included for purposes of calculating the average amounts in
each applicable year are as follows: (i) for 2022 and 2021, Mr. Wells, Ms. Morgan Poe, Ms. Gutowski, and Ms. Melaragni; and (ii) for 2020, Mr. Wells, Ms. Morgan Poe, Ron Hinson, David Muscato, and Jamie Jamieson.
|
|
(4)
|
The dollar amounts reported in column (e) represent the average amount of “compensation actually paid” to the NEOs as a group
(excluding Mr. Harrington), by applying the following adjustments to each NEO’s total compensation for each year, as computed in accordance with Item 402(v). The dollar amounts do not reflect the actual amount of compensation earned by or
paid to each NEO during the applicable year.
|
| |
Year
|
| |
Average
Reported
Summary
Compensation
Table Total for
Non-CEO NEOs
|
| |
Less: Average
Reported
Value of Equity
Awards for Non-
CEO NEOs
|
| |
Add: Average
Equity Award
Adjustments for
Non-CEO
NEOs(a)
|
| |
Average
Compensation
Actually Paid
to Non-CEO
NEOs
|
|
| |
2022
|
| |
$1,417,865
|
| |
$356,250
|
| |
($22,477)
|
| |
$1,039,138
|
|
| |
2021
|
| |
$2,690,759
|
| |
$1,925,000
|
| |
$2,628,241
|
| |
$3,394,000
|
|
| |
2020
|
| |
$2,010,274
|
| |
$1,083,060
|
| |
$997,222
|
| |
$1,924,436
|
|
|
(a)
|
The amounts deducted or added in calculating the total average equity award adjustments are as follows:
|
| |
Year
|
| |
Year End Fair
Value of
Outstanding
and Unvested
Equity Awards
Granted in the
Year
|
| |
Year over Year
Change in Fair
Value of Equity
Awards
Granted in
Prior Years
that Vested in
the Year
|
| |
Fair Value as of
Vesting Date of
Equity Awards
Granted and
Vested in the
Year
|
| |
Year over Year
Change in Fair
Value of
Outstanding
and Unvested
Equity Awards
Granted in
Prior Years
|
| |
Value of
Dividends or
other Earnings
Paid on Stock
or Option
Awards not
Otherwise
Reflected in
Fair Value or
Total
Compensation
|
| |
Total Equity
Award
Adjustments
|
|
| |
2022
|
| |
$368,158
|
| |
($242,524)
|
| |
$0
|
| |
($199,945)
|
| |
$51,833
|
| |
($22,477)
|
|
| |
2021
|
| |
$2,084,783
|
| |
$48,829
|
| |
$159,070
|
| |
$312,561
|
| |
$22,998
|
| |
$2,628,241
|
|
| |
2020
|
| |
$512,235
|
| |
$93,935
|
| |
$0
|
| |
$369,842
|
| |
$21,210
|
| |
$997,222
|
|
|
(5)
|
The amounts in column (f) show changes over our past three fiscal years in the value of $100 (assuming reinvestment of
dividends) invested in Primo Water’s common shares traded on the NYSE.
|
|
(6)
|
The amounts in column (g) show changes over our past three fiscal years in the value of $100 (assuming reinvestment of
dividends), invested in a market-capitalization weighted index of our peer group, which consists of publicly-traded companies used to determine target compensation for each fiscal year. The peer group for 2022 is comprised of ADT Inc., A.
O. Smith Corporation, The Brink’s Company, Chemed Corp., Cintas Corporation, Evoqua Water Technologies Corp, Franklin Electric Co., Inc., IDEX Corporation, Mueller Water Products, Inc., Pentair plc, Rollins, Inc., Regal Rexnord
Corporation, Stericycle Inc., Terminix, Tetra Tech, Inc., UniFirst Corp., Watts Water Technologies, and Xylem Inc. The peer group for 2021 also includes Windstream Holdings, Inc. The peer group for 2020 excludes ADT Inc., Franklin
Electric Co. Inc,, and Mueller Water Products, Inc. and includes AquaVenture Holdings Limited, Farmer Bros. Co., Frontier Communications Corporation.
|
|
(7)
|
The dollar amounts reported represent the net income reflected in Primo Water’s audited financial statements for the applicable
year.
|
|
(8)
|
“Bonus-Adjusted EBITDA” is GAAP earnings before interest, taxes, depreciation, and amortization, adjusted to exclude the impact
of certain items as approved by the Compensation Committee, as more particularly set forth on Appendix E. While we use numerous financial and non-financial performance measures to evaluate performance under our compensation programs,
Bonus-Adjusted EBITDA is the financial performance measure that, in Primo Water’s assessment, represents the most important performance measure (that is not otherwise required to be disclosed in the table) used to link compensation
actually paid to NEOs, for the most recently completed fiscal year, to Company performance.
|
|
(3)
|
The dollar amounts reported in column (d) represent the average of the total compensation reported for the NEOs (excluding
Mr. Harrington) in the “Total” column of the Summary Compensation Table for each corresponding year. The NEOs (excluding Mr. Harrington) included for purposes of calculating the average amounts in
each applicable year are as follows: (i) for 2022 and 2021, Mr. Wells, Ms. Morgan Poe, Ms. Gutowski, and Ms. Melaragni; and (ii) for 2020, Mr. Wells, Ms. Morgan Poe, Ron Hinson, David Muscato, and Jamie Jamieson.
|
|
(6)
|
The amounts in column (g) show changes over our past three fiscal years in the value of $100 (assuming reinvestment of
dividends), invested in a market-capitalization weighted index of our peer group, which consists of publicly-traded companies used to determine target compensation for each fiscal year. The peer group for 2022 is comprised of ADT Inc., A.
O. Smith Corporation, The Brink’s Company, Chemed Corp., Cintas Corporation, Evoqua Water Technologies Corp, Franklin Electric Co., Inc., IDEX Corporation, Mueller Water Products, Inc., Pentair plc, Rollins, Inc., Regal Rexnord
Corporation, Stericycle Inc., Terminix, Tetra Tech, Inc., UniFirst Corp., Watts Water Technologies, and Xylem Inc. The peer group for 2021 also includes Windstream Holdings, Inc. The peer group for 2020 excludes ADT Inc., Franklin
Electric Co. Inc,, and Mueller Water Products, Inc. and includes AquaVenture Holdings Limited, Farmer Bros. Co., Frontier Communications Corporation.
|
|
(2)
|
The dollar amounts reported in column (c) represent the amount of “compensation actually paid” to Mr. Harrington, by applying
the following adjustments to Mr. Harrington’s total compensation for each year, as computed in accordance with Item 402(v). The dollar amounts do not reflect the actual amount of compensation earned by or paid to Mr. Harrington during the
applicable year.
|
| |
Year
|
| |
Reported Summary
Compensation Table
Total for CEO
|
| |
Less: Reported
Value of Equity
Awards to CEO(a)
|
| |
Add: Equity Award
Adjustments to
CEO (b),(c)
|
| |
Compensation
Actually Paid to
CEO
|
|
| |
2022
|
| |
$5,889,707
|
| |
$4,000,000
|
| |
$2,938,983
|
| |
$4,828,690
|
|
| |
2021
|
| |
$5,332,744
|
| |
$3,500,000
|
| |
$5,863,642
|
| |
$7,696,386
|
|
| |
2020
|
| |
$6,999,545
|
| |
$5,426,981
|
| |
$4,302,366
|
| |
$5,874,930
|
|
|
(a)
|
The amounts in this column reflect the aggregate grant-date fair value reported in the “Stock
Awards” and “Option/SAR Awards” columns in the Summary Compensation Table for the applicable year.
|
|
(b)
|
The amounts deducted or added in calculating the total equity award adjustments are as follows:
|
| |
Year
|
| |
Year End Fair
Value of
Outstanding
and Unvested
Equity
Awards
Granted in the
Year
|
| |
Year over Year
Change in Fair
Value of Equity
Awards Granted
in Prior Years
that Vested in the
Year
|
| |
Year over Year
Change in Fair
Value of
Outstanding and
Unvested Equity
Awards Granted in
Prior Years
|
| |
Value of
Dividends or
other Earnings
Paid on Stock
or Option
Awards not
Otherwise Reflected in
Fair Value or
Total
Compensation
|
| |
Total Equity
Award
Adjustments
|
|
| |
2022
|
| |
$4,084,083
|
| |
($708,578)
|
| |
($650,162)
|
| |
$213,639
|
| |
$2,938,983
|
|
| |
2021
|
| |
$3,619,051
|
| |
$292,642
|
| |
$1,844,792
|
| |
$107,157
|
| |
$5,863,642
|
|
| |
2020
|
| |
$2,899,519
|
| |
$624,422
|
| |
$706,574
|
| |
$71,851
|
| |
$4,302,366
|
|
|
(c)
|
In accordance with Item 402(v) requirements, the fair values of unvested and outstanding equity awards to our NEOs were
remeasured as of the end of each fiscal year, and as of each vesting date for each award that vested in a covered year, during the years displayed in the table above. For options, the fair values as of each measurement date were
determined using a binomial lattice model, which considers the circumstances of the grant at the measurement date, with assumptions and methodologies regarding volatility, dividend yield, and risk-free rates that are generally consistent
with those used to estimate fair value at grant under U.S. GAAP. The range of estimates used in the fair value calculations are as follows: (i) for 2022, remaining option contractual life between 7.0 years – 8.0 years, volatility of 35%, dividend yield between 1.8%-1.9%, and risk-free rate between 3.1%-3.9%; (ii) for 2021, remaining option contractual life between 7.0 years – 9.0 years, volatility between 33%-36%, dividend yield of 1.4%, and risk-free rate between 1.2%-1.5%; (iii) for 2020, remaining option contractual life between 3.0 years – 9.9 years, volatility between 29%-35%, dividend yield between
1.5%-2.7%, and
risk-free rate between 0.5%-1.1%.
For performance-based awards, the fair values reflect the probable outcome of the performance vesting conditions as of each measurement date.
|
|
(4)
|
The dollar amounts reported in column (e) represent the average amount of “compensation actually paid” to the NEOs as a group
(excluding Mr. Harrington), by applying the following adjustments to each NEO’s total compensation for each year, as computed in accordance with Item 402(v). The dollar amounts do not reflect the actual amount of compensation earned by or
paid to each NEO during the applicable year.
|
| |
Year
|
| |
Average
Reported
Summary
Compensation
Table Total for
Non-CEO NEOs
|
| |
Less: Average
Reported
Value of Equity
Awards for Non-
CEO NEOs
|
| |
Add: Average
Equity Award
Adjustments for
Non-CEO
NEOs(a)
|
| |
Average
Compensation
Actually Paid
to Non-CEO
NEOs
|
|
| |
2022
|
| |
$1,417,865
|
| |
$356,250
|
| |
($22,477)
|
| |
$1,039,138
|
|
| |
2021
|
| |
$2,690,759
|
| |
$1,925,000
|
| |
$2,628,241
|
| |
$3,394,000
|
|
| |
2020
|
| |
$2,010,274
|
| |
$1,083,060
|
| |
$997,222
|
| |
$1,924,436
|
|
|
(a)
|
The amounts deducted or added in calculating the total average equity award adjustments are as follows:
|
| |
Year
|
| |
Year End Fair
Value of
Outstanding
and Unvested
Equity Awards
Granted in the
Year
|
| |
Year over Year
Change in Fair
Value of Equity
Awards
Granted in
Prior Years
that Vested in
the Year
|
| |
Fair Value as of
Vesting Date of
Equity Awards
Granted and
Vested in the
Year
|
| |
Year over Year
Change in Fair
Value of
Outstanding
and Unvested
Equity Awards
Granted in
Prior Years
|
| |
Value of
Dividends or
other Earnings
Paid on Stock
or Option
Awards not
Otherwise
Reflected in
Fair Value or
Total
Compensation
|
| |
Total Equity
Award
Adjustments
|
|
| |
2022
|
| |
$368,158
|
| |
($242,524)
|
| |
$0
|
| |
($199,945)
|
| |
$51,833
|
| |
($22,477)
|
|
| |
2021
|
| |
$2,084,783
|
| |
$48,829
|
| |
$159,070
|
| |
$312,561
|
| |
$22,998
|
| |
$2,628,241
|
|
| |
2020
|
| |
$512,235
|
| |
$93,935
|
| |
$0
|
| |
$369,842
|
| |
$21,210
|
| |
$997,222
|
|
|
(c)
|
In accordance with Item 402(v) requirements, the fair values of unvested and outstanding equity awards to our NEOs were
remeasured as of the end of each fiscal year, and as of each vesting date for each award that vested in a covered year, during the years displayed in the table above. For options, the fair values as of each measurement date were
determined using a binomial lattice model, which considers the circumstances of the grant at the measurement date, with assumptions and methodologies regarding volatility, dividend yield, and risk-free rates that are generally consistent
with those used to estimate fair value at grant under U.S. GAAP. The range of estimates used in the fair value calculations are as follows: (i) for 2022, remaining option contractual life between 7.0 years – 8.0 years, volatility of 35%, dividend yield between 1.8%-1.9%, and risk-free rate between 3.1%-3.9%; (ii) for 2021, remaining option contractual life between 7.0 years – 9.0 years, volatility between 33%-36%, dividend yield of 1.4%, and risk-free rate between 1.2%-1.5%; (iii) for 2020, remaining option contractual life between 3.0 years – 9.9 years, volatility between 29%-35%, dividend yield between
1.5%-2.7%, and
risk-free rate between 0.5%-1.1%.
For performance-based awards, the fair values reflect the probable outcome of the performance vesting conditions as of each measurement date.
|
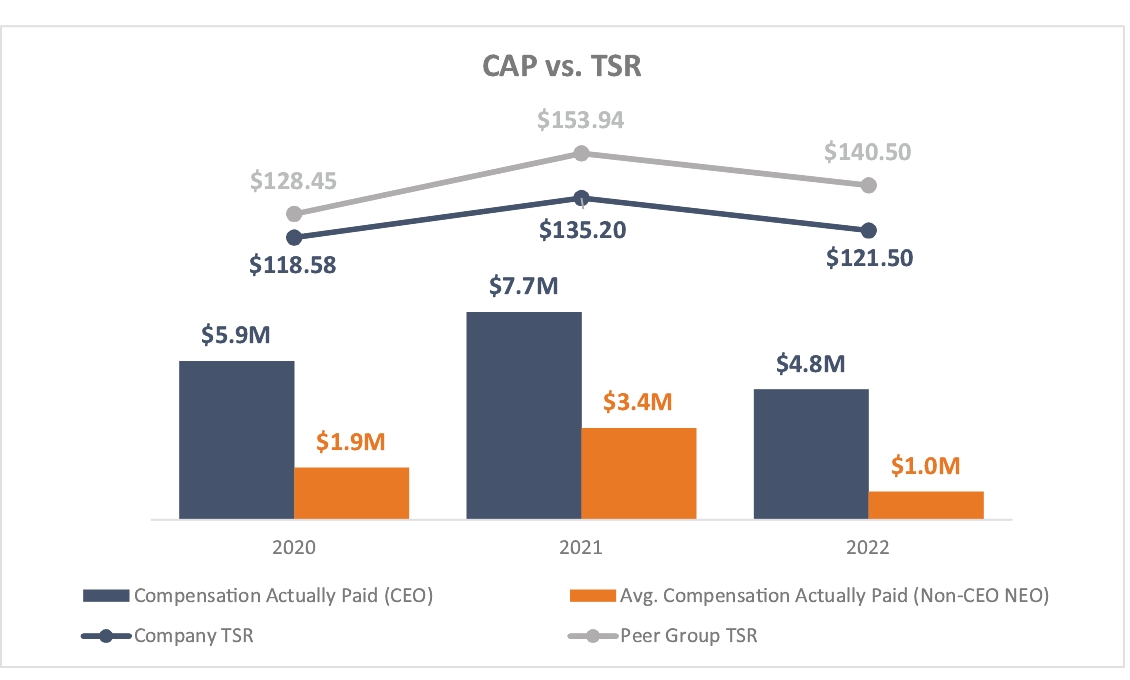
Relationship Between Compensation Actually Paid (CAP) for CEO and
NEOs (Average) vs. Cumulative Total Shareholder Return (TSR) of Company and the Peer Group
The following chart shows the relationship between Compensation
Actually Paid to our CEO and Average Compensation Actually Paid to our Other NEOs, and Primo Water’s TSR, as well as the relationship between Primo Water’s TSR and the TSR of our peer group. As shown in the chart, the value of Compensation
Actually Paid is aligned with the movement of our TSR over the last three fiscal years. Similarly, the fluctuation in Primo Water’s TSR is correlated with the fluctuation in the TSR of our peer group.
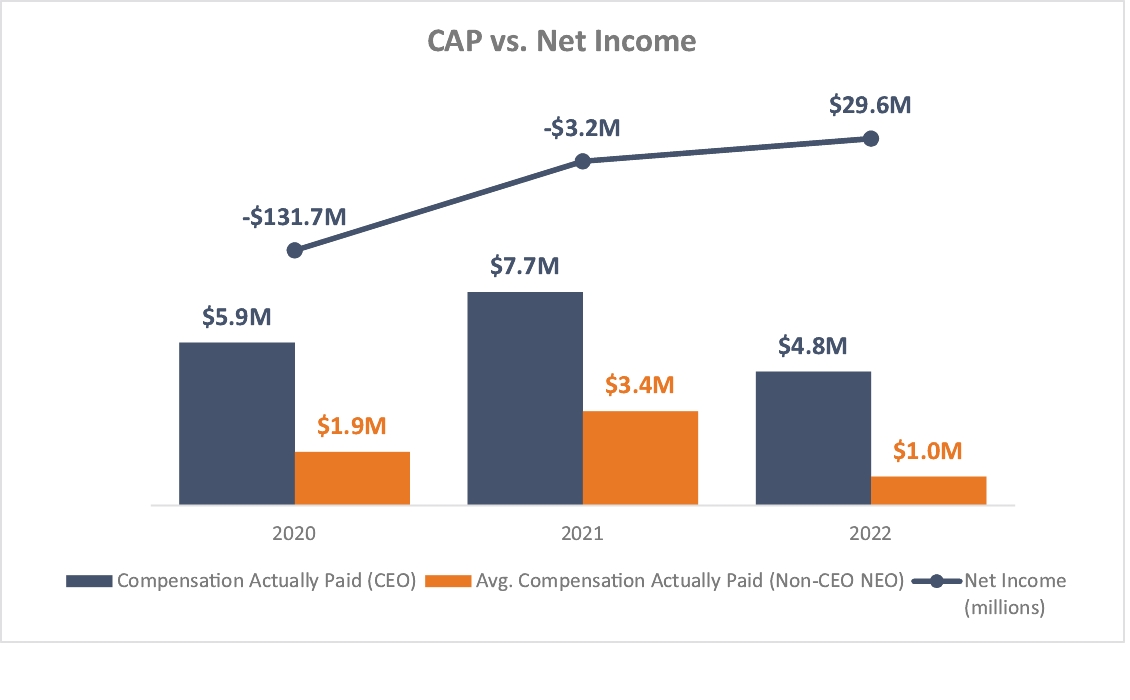
Relationship Between Compensation Actually Paid for CEO and NEOs
(Average) vs. Net Income
The following chart shows the relationship between Compensation
Actually Paid to our CEO and Average Compensation Actually Paid to our Other NEOs, and Primo Water’s Net Income. As discussed in more detail in our Compensation Discussion & Analysis, Net Income is not currently utilized directly in setting
executive pay. As such, we believe that its relationship to Compensation Actually Paid and Primo Water’s performance is less illustrative than other metrics that factor more directly into our executive compensation program, including
Bonus-Adjusted EBITDA.
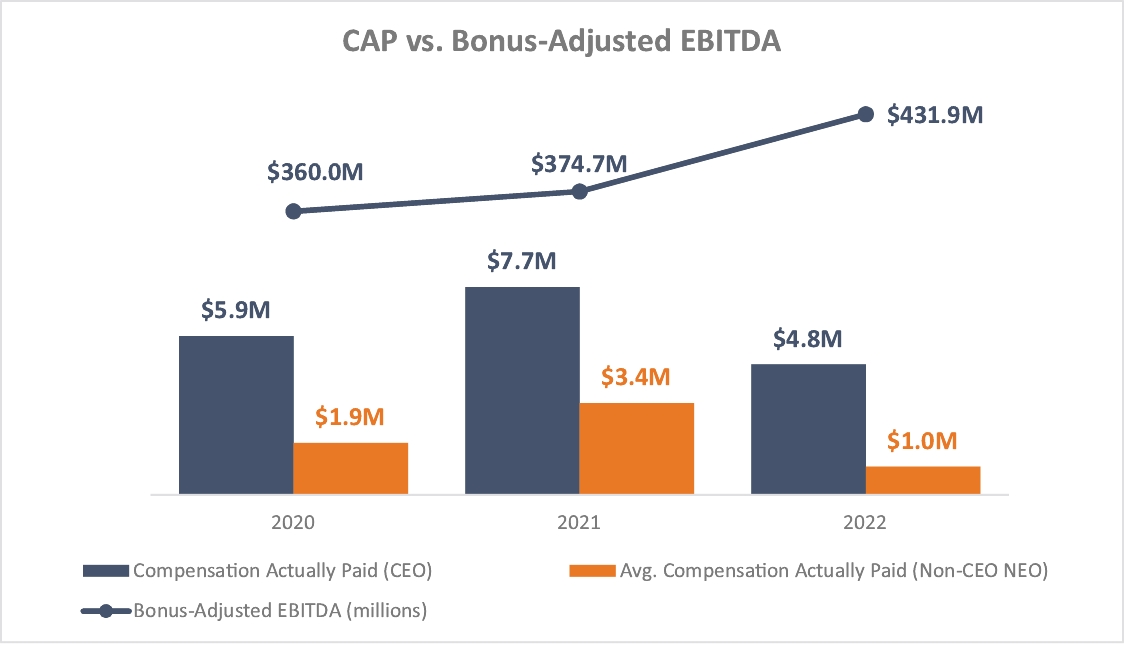
Relationship Between Compensation Actually Paid for CEO and NEOs
(Average) vs. Bonus-Adjusted EBITDA
The following chart shows the relationship between Compensation
Actually Paid to our CEO(s) and Average Compensation Actually Paid to our other NEOs, and Primo Water’s Bonus-Adjusted EBITDA. As shown in the chart, from 2020 to 2021, Compensation Actually Paid is aligned with our Bonus-Adjusted EBITDA, as both
increased. From 2021 to 2022, Bonus-Adjusted EBITDA increased again, but Compensation Actually Paid decreased, due primarily to a decline in the value of the equity award adjustment over such period (driven by a decrease in our common share price
from 2021 to 2022), indicating that the relationship between the movement in price of our common shares is not always correlated to the movement in our Bonus-Adjusted EBITDA.
Relationship Between Compensation Actually Paid (CAP) for CEO and
NEOs (Average) vs. Cumulative Total Shareholder Return (TSR) of Company and the Peer Group
The following chart shows the relationship between Compensation
Actually Paid to our CEO and Average Compensation Actually Paid to our Other NEOs, and Primo Water’s TSR, as well as the relationship between Primo Water’s TSR and the TSR of our peer group. As shown in the chart, the value of Compensation
Actually Paid is aligned with the movement of our TSR over the last three fiscal years. Similarly, the fluctuation in Primo Water’s TSR is correlated with the fluctuation in the TSR of our peer group.
Most Important Company Performance Measures for
Determining Executive Compensation
The most important financial performance measures used by Primo
Water to link executive compensation to Company performance during fiscal year 2022 were:
|
•
|
Bonus-Adjusted EBITDA
|
|
•
|
Bonus-Adjusted Operating Free Cash Flow
|
|
•
|
Bonus-Adjusted Revenue
|
|
•
|
Adjusted Pre-Tax Income
|