Pay vs Performance Disclosure
Dec. 31, 2022
USD ($)
Dec. 31, 2021
USD ($)
Dec. 31, 2020
USD ($)
Pay Versus Performance
The following table sets forth the compensation for our Chief Executive Officer (PEO) and the average compensation for our other named executive officers
(Non-PEO),
both as reported in the Summary Compensation Table, on page 38, and with certain adjustment
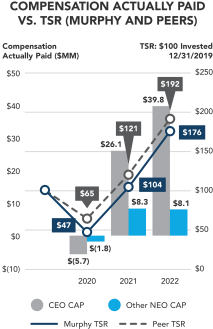
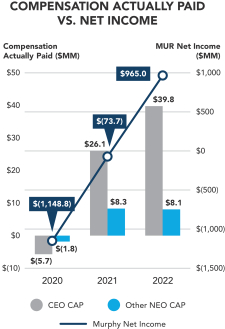
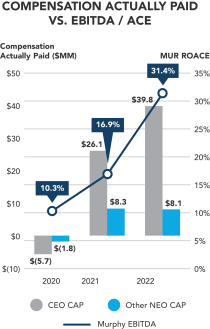
s to reflect the “compensation actually paid” to such individuals, as defined under SEC rules, for each of 2022, 2021 and 2020. The table also provides information on our cumulative TSR, the cumulative TSR of our peer group, Net Income and Return on Average Capital Employed over such years in accordance with SEC rules. Pay Versus Performance | ||||||||||||||||||||||||||||||||||||||||
Value of Initial Fixed $100 Investment Based On: |
||||||||||||||||||||||||||||||||||||||||
Year (a) |
Summary Compensation Table Total for PEO (1) ($) (b) |
Compensation Actually Paid to PEO (2) ($) (c) |
Average Summary Compensation Table Total for Non-PEO Named Executive Officers (1) ($) (d) |
Average Compensation Actually Paid to Non-PEO Named Executive Officers (2) ($) (e) |
Total Shareholder Return (3) ($) (f) |
Peer Group Total Shareholder Return (3) ($) (g) |
Net Income (in Thousands) (4) ($) (h) |
Return on Average Capital Employed (5) (%) (i) | ||||||||||||||||||||||||||||||||
2022 |
13,444,418 | 39,752,198 | 3,741,335 | 8,083,159 | 175.84 | 191.50 | 965,047 | 31.4 | % | |||||||||||||||||||||||||||||||
2021 |
11,381,012 | 26,071,102 | 3,111,741 | 8,330,184 | 104.46 | 120.82 | (73,664 | ) | 16.9 | % | ||||||||||||||||||||||||||||||
2020 |
13,180,178 | (5,712,287 | ) | 4,065,562 | (1,804,274 | ) | 47.21 | 64.58 | (1,148,777 | ) | 10.3 | % | ||||||||||||||||||||||||||||
| (1) | Compensation for our PEO, Roger W. Jenkins, reflects the amounts reported in the “Summary Compensation Table” for the respective years. Average compensation for non-PEOs includes the following named executive officers: (i) in 2022, Thomas J. Mireles, Eric M. Hambly, E. Ted Botner, Daniel R. Hanchera and David R. Looney, (ii) in 2021, David R. Looney, Eric M. Hambly, E. Ted Botner and Thomas J. Mireles and (iii) in 2020, David R. Looney, Eric M. Hambly, E. Ted Botner, Thomas J. Mireles, Michael K. McFadyen and Walter K. Compton. |
| (2) | Compensation “actually paid” for the PEO and average compensation “actually paid” for our non-PEOs in each of 2022, 2021 and 2020 reflects the respective amounts set forth in columns (b) and (d) of the table above, adjusted as set forth in the table below, as determined in accordance with SEC rules (Item 402(v) of Regulation S-K). The dollar amounts reflected in columns (b) and (d) of the table above do not reflect the actual amount of compensation earned by or paid to the PEO and our non-PEOs during the applicable year. For information regarding the decisions made by our Compensation Committee in regards to the PEO’s and our non-PEOs’ compensation for fiscal year 2022, see “Compensation Discussion and Analysis” above. |
PEO 2022 |
PEO 2021 |
PEO 2020 |
Non-PEOs 2022 |
Non-PEOs 2021 |
Non-PEOs 2020 | |||||||||||||||||||||||||
Summary Compensation Table Total |
13,444,418 |
11,381,012 |
13,180,178 |
3,741,335 |
3,111,741 |
4,065,562 |
||||||||||||||||||||||||
Less Covered Year |
(10,174,740 | ) | (7,549,063 | ) | (8,297,910 | ) | (2,642,889 | ) | (1,929,541 | ) | (1,702,683 | ) | ||||||||||||||||||
Plus |
13,293,592 | 10,471,250 | 3,560,300 | 2,670,881 | 4,703,679 | 450,283 | ||||||||||||||||||||||||
Change |
17,265,340 | 8,909,580 | (13,700,600 | ) | 3,126,077 | 1,770,789 | (3,500,506 | ) | ||||||||||||||||||||||
Change Covered Year |
2,557,473 | 352,888 | 942,170 | 721,571 | 168,957 | 154,404 | ||||||||||||||||||||||||
Less |
— | — | — | — | — | — | ||||||||||||||||||||||||
Plus |
2,690,261 | 2,170,966 | 1,132,350 | 432,224 | 461,715 | 138,868 | ||||||||||||||||||||||||
Less Under Pension Plans |
— | (477,905 | ) | (3,250,213 | ) | — | (28,560 | ) | (1,488,996 | ) | ||||||||||||||||||||
Plus |
675,854 | 812,374 | 721,438 | 33,960 | 71,404 | 78,794 | ||||||||||||||||||||||||
Compensation Actually Paid |
39,752,198 |
26,071,102 |
(5,712,287 |
) | 8,083,159 |
8,330,184 |
(1,804,274 |
) | ||||||||||||||||||||||
Fair values of equity awards set forth in the table above are computed in accordance with FASB ASC Topic 718 as of the end of the respective fiscal year, other than fair values of equity awards that vest in the covered year, which are valued as of the applicable vesting date. |
The aggregate change in actuarial present value of accumulated benefit under pension plans reflects the amount reported for the applicable year in the Summary Compensation Table. Service cost is calculated as the actuarial present value of benefits under all pension plans attributable to services rendered during the applica ble fiscal ye ar. Prior service cost is calculated as the entire cost of benefits granted (or credit for benefits reduced) in a plan amendment (or initiation) during the cove red fiscal year that are attributable by the benefit formula to services rendered in periods prior to the applicable amendment. |
| (3) | TSR is cumulative for the measurement periods beginning on December 31, 2019 and ending on December 31 of each of 2022, 2021 and 2020, respectively, calculated in accordance with Item 201(e) of Regulation S-K. The peer group for purposes of this table is the S&P Oil & Gas Exploration & Production Select Industry Index (XOP), which is the same peer group as for the Shareholder Return Performance Presentation of the Company’s Annual Reports on Form 10-K for the year ended December 31, 2022. |
| (4) | Reflects “Net Income” in the Company’s Consolidated Statements of Income included in the Company’s Annual Reports on Form 10-K for each of the years ended December 31, 2022, 2021 and 2020. |
| (5) | The following table sets forth an unranked list of the performance measures which we view as the “most important” measures for linking our named executive officers’ compensation actually paid to Company performance, as specifically listed below. For additional details on how these measures are utilized in our compensation program to link pay with performance, see “Compensation Discussion and Analysis” above. |
| (1) | Compensation for our PEO, Roger W. Jenkins, reflects the amounts reported in the “Summary Compensation Table” for the respective years. Average compensation for non-PEOs includes the following named executive officers: (i) in 2022, Thomas J. Mireles, Eric M. Hambly, E. Ted Botner, Daniel R. Hanchera and David R. Looney, (ii) in 2021, David R. Looney, Eric M. Hambly, E. Ted Botner and Thomas J. Mireles and (iii) in 2020, David R. Looney, Eric M. Hambly, E. Ted Botner, Thomas J. Mireles, Michael K. McFadyen and Walter K. Compton. |
| (3) | TSR is cumulative for the measurement periods beginning on December 31, 2019 and ending on December 31 of each of 2022, 2021 and 2020, respectively, calculated in accordance with Item 201(e) of Regulation S-K. The peer group for purposes of this table is the S&P Oil & Gas Exploration & Production Select Industry Index (XOP), which is the same peer group as for the Shareholder Return Performance Presentation of the Company’s Annual Reports on Form 10-K for the year ended December 31, 2022. |
| (2) | Compensation “actually paid” for the PEO and average compensation “actually paid” for our non-PEOs in each of 2022, 2021 and 2020 reflects the respective amounts set forth in columns (b) and (d) of the table above, adjusted as set forth in the table below, as determined in accordance with SEC rules (Item 402(v) of Regulation S-K). The dollar amounts reflected in columns (b) and (d) of the table above do not reflect the actual amount of compensation earned by or paid to the PEO and our non-PEOs during the applicable year. For information regarding the decisions made by our Compensation Committee in regards to the PEO’s and our non-PEOs’ compensation for fiscal year 2022, see “Compensation Discussion and Analysis” above. |
PEO 2022 |
PEO 2021 |
PEO 2020 |
Non-PEOs 2022 |
Non-PEOs 2021 |
Non-PEOs 2020 | |||||||||||||||||||||||||
Summary Compensation Table Total |
13,444,418 |
11,381,012 |
13,180,178 |
3,741,335 |
3,111,741 |
4,065,562 |
||||||||||||||||||||||||
Less Covered Year |
(10,174,740 | ) | (7,549,063 | ) | (8,297,910 | ) | (2,642,889 | ) | (1,929,541 | ) | (1,702,683 | ) | ||||||||||||||||||
Plus |
13,293,592 | 10,471,250 | 3,560,300 | 2,670,881 | 4,703,679 | 450,283 | ||||||||||||||||||||||||
Change |
17,265,340 | 8,909,580 | (13,700,600 | ) | 3,126,077 | 1,770,789 | (3,500,506 | ) | ||||||||||||||||||||||
Change Covered Year |
2,557,473 | 352,888 | 942,170 | 721,571 | 168,957 | 154,404 | ||||||||||||||||||||||||
Less |
— | — | — | — | — | — | ||||||||||||||||||||||||
Plus |
2,690,261 | 2,170,966 | 1,132,350 | 432,224 | 461,715 | 138,868 | ||||||||||||||||||||||||
Less Under Pension Plans |
— | (477,905 | ) | (3,250,213 | ) | — | (28,560 | ) | (1,488,996 | ) | ||||||||||||||||||||
Plus |
675,854 | 812,374 | 721,438 | 33,960 | 71,404 | 78,794 | ||||||||||||||||||||||||
Compensation Actually Paid |
39,752,198 |
26,071,102 |
(5,712,287 |
) | 8,083,159 |
8,330,184 |
(1,804,274 |
) | ||||||||||||||||||||||
Performance Measure |
Return on Average Capital Employed (EBITDA / ACE) |
AIP Free Cash Flow ($MM) |
G&A ($MM) |
LOE/BOE ($/BOE) |
TRIR |
Spill Rate |
GHG Emissions (metric ton CO 2 e per MMBOE) |