Pay vs Performance Disclosure
Unit_pure in Thousands
Unit_pure in Thousands
Dec. 31, 2022
USD ($)
Dec. 31, 2021
USD ($)
Dec. 31, 2020
USD ($)
Pay Versus Performance
The following information provides detail on the relationship between executive compensation actually paid and certain financial performance metrics. For additional information on how the Company aligns executive compensation with Company performance, see “”.
Compensation Discussion and Analysis
Pay Versus Performance |
||||||||||||||||||||||||||||||||
Value of $100 Initial Investment Based On: |
||||||||||||||||||||||||||||||||
Year |
Summary Compensation Table Total for CEO ($) |
Compensation Actually Paid to CEO ($)(1) |
Average Summary Compensation Table Total for Non-CEO Named Executive Officers ($)(2) |
Average Compensation Actually Paid to Non-CEO Named Executive Officers ($)(3) |
Total Shareholder Return ($)(4) |
Peer Group Total Shareholder Return ($)(5) |
Net Income (Loss) (in thousands) ($) |
Adjusted EBITDAR (in thousands) ($) |
||||||||||||||||||||||||
2022 |
10,369,721 |
7,120,582 |
3,431,198 |
2,958,368 |
184.16 |
58.28 |
639,377 |
1,390,509 |
||||||||||||||||||||||||
2021 |
14,740,782 |
25,387,421 |
4,531,494 |
7,532,905 |
219.00 |
78.17 |
463,846 |
1,365,985 |
||||||||||||||||||||||||
2020 |
2,973,606 |
8,720,802 |
1,331,123 |
2,975,201 |
143.35 |
89.66 |
(134,700 |
) |
609,894 |
|||||||||||||||||||||||
| (1) | Compensation actually paid to Mr. Smith for each of the fiscal years reported is calculated as follows: |
2022($) |
2021($) |
2020($) |
||||||||||
Total compensation reported in Summary Compensation Table |
10,369,721 |
14,740,782 |
2,973,606 |
|||||||||
Less: |
6,430,512 |
8,940,265 |
213,746 |
|||||||||
Plus: |
||||||||||||
Fair value as of December 31 of awards granted during and outstanding at the end of the fiscal year |
4,952,415 |
10,841,081 |
— |
|||||||||
Change in fair value of outstanding awards granted in prior fiscal years(b) |
(2,628,668 |
) |
6,743,562 |
6,085,478 |
||||||||
Vesting date fair value of equity awards granted and vested during the fiscal year |
217,516 |
213,759 |
213,746 |
|||||||||
Change in fair value of awards granted in prior fiscal years and vested during the covered fiscal year(c) |
640,110 |
1,788,502 |
(338,282 |
) | ||||||||
Earnings paid on unvested awards for dividends or other earnings |
— |
— |
— |
|||||||||
Less: |
— |
— |
— |
|||||||||
Compensation actually paid(d) |
7,120,582 |
25,387,421 |
8,720,802 |
|||||||||
| (a) | Includes time-based restricted shares and performance-based restricted shares, which do not vest during the fiscal year awarded, and career shares, which vest 100% when granted. |
| (b) | Change in fair value from December 31 of the covered fiscal year compared to December 31 of the prior fiscal year. Each performance share included as part of the calculation represents a contingent right to receive up to a maximum of two shares of common stock, subject to satisfaction of certain performance metrics. Amounts reported assume the performance metrics will be achieved at the target performance level, which is the most probable outcome as of the end of the fiscal year, unless otherwise noted. Interim values based on assumption of the most probable outcome may not ultimately reflect actual payouts. |
| (c) | Change in fair value from vesting date compared to December 31 of the prior fiscal year. |
| (d) | The valuation assumptions used to calculate fair values did not materially differ from those disclosed at the time of grant. |
| (2) | Named Executive Officers included in the calculation for each of 2022, 2021 and 2020 are William S. Boyd, Josh Hirsberg, Stephen Thompson, and Theodore Bogich. |
| (3) | Average compensation actually paid to non-CEO named executive officers (“NEOs”) reported on an average basis is calculated as follows: |
2022($) |
2021($) |
2020($) |
||||||||||
Total compensation reported in Summary Compensation Table |
3,431,198 |
4,531,494 |
1,331,123 |
|||||||||
Less: (a) |
1,751,000 |
2,350,193 |
110,058 |
|||||||||
Plus: |
||||||||||||
Fair value as of December 31 of awards granted during and outstanding at the end of the fiscal year |
1,457,644 |
2,826,067 |
42,043 |
|||||||||
Change in fair value of outstanding awards granted in prior fiscal years (b) |
(432,994 |
) |
2,023,149 |
1,676,692 |
||||||||
Vesting date fair value of equity awards granted and vested during the fiscal year |
94,075 |
94,086 |
91,872 |
|||||||||
Change in fair value of awards granted in prior fiscal years and vested during the covered fiscal year (c) |
159,445 |
408,302 |
(56,471 |
) | ||||||||
Earnings paid on unvested awards for dividends or other earnings |
— |
— |
— |
|||||||||
Less: |
— |
— |
— |
|||||||||
Compensation actually paid (d) |
2,958,368 |
7,532,905 |
2,975,201 |
|||||||||
| (a) | Includes time-based restricted shares and performance-based restricted shares, which do not vest during the fiscal year awarded, and career shares, which vest 100% when granted. |
| (b) | Change in fair value from December 31 of the covered fiscal year compared to December 31 of the prior fiscal year. Each performance share included as part of the calculation represents a contingent right to receive up to a maximum of two shares of common stock, subject to satisfaction of certain performance metrics. Amounts reported assume the performance metrics will be achieved at the target performance level, which is the most probable outcome as of the end of the fiscal year, unless otherwise noted. Interim values based on assumption of the most probable outcome may not ultimately reflect actual payouts. |
| (c) | Change in fair value from vesting date compared to December 31 of the prior fiscal year. |
| (d) | The valuation assumptions used to calculate fair values did not materially differ from those disclosed at the time of grant. |
| (4) | Assumes $100 was invested on December 31, 2019. |
| (5) | Represents the cumulative total return of the Dow Jones U.S. Gambling Index and assumes $100 was invested on December 31, 2019. |
2022($) |
2021($) |
2020($) |
||||||||||
Total compensation reported in Summary Compensation Table |
10,369,721 |
14,740,782 |
2,973,606 |
|||||||||
Less: |
6,430,512 |
8,940,265 |
213,746 |
|||||||||
Plus: |
||||||||||||
Fair value as of December 31 of awards granted during and outstanding at the end of the fiscal year |
4,952,415 |
10,841,081 |
— |
|||||||||
Change in fair value of outstanding awards granted in prior fiscal years(b) |
(2,628,668 |
) |
6,743,562 |
6,085,478 |
||||||||
Vesting date fair value of equity awards granted and vested during the fiscal year |
217,516 |
213,759 |
213,746 |
|||||||||
Change in fair value of awards granted in prior fiscal years and vested during the covered fiscal year(c) |
640,110 |
1,788,502 |
(338,282 |
) | ||||||||
Earnings paid on unvested awards for dividends or other earnings |
— |
— |
— |
|||||||||
Less: |
— |
— |
— |
|||||||||
Compensation actually paid(d) |
7,120,582 |
25,387,421 |
8,720,802 |
|||||||||
| (a) | Includes time-based restricted shares and performance-based restricted shares, which do not vest during the fiscal year awarded, and career shares, which vest 100% when granted. |
| (b) | Change in fair value from December 31 of the covered fiscal year compared to December 31 of the prior fiscal year. Each performance share included as part of the calculation represents a contingent right to receive up to a maximum of two shares of common stock, subject to satisfaction of certain performance metrics. Amounts reported assume the performance metrics will be achieved at the target performance level, which is the most probable outcome as of the end of the fiscal year, unless otherwise noted. Interim values based on assumption of the most probable outcome may not ultimately reflect actual payouts. |
| (c) | Change in fair value from vesting date compared to December 31 of the prior fiscal year. |
| (d) | The valuation assumptions used to calculate fair values did not materially differ from those disclosed at the time of grant. |
2022($) |
2021($) |
2020($) |
||||||||||
Total compensation reported in Summary Compensation Table |
3,431,198 |
4,531,494 |
1,331,123 |
|||||||||
Less: (a) |
1,751,000 |
2,350,193 |
110,058 |
|||||||||
Plus: |
||||||||||||
Fair value as of December 31 of awards granted during and outstanding at the end of the fiscal year |
1,457,644 |
2,826,067 |
42,043 |
|||||||||
Change in fair value of outstanding awards granted in prior fiscal years (b) |
(432,994 |
) |
2,023,149 |
1,676,692 |
||||||||
Vesting date fair value of equity awards granted and vested during the fiscal year |
94,075 |
94,086 |
91,872 |
|||||||||
Change in fair value of awards granted in prior fiscal years and vested during the covered fiscal year (c) |
159,445 |
408,302 |
(56,471 |
) | ||||||||
Earnings paid on unvested awards for dividends or other earnings |
— |
— |
— |
|||||||||
Less: |
— |
— |
— |
|||||||||
Compensation actually paid (d) |
2,958,368 |
7,532,905 |
2,975,201 |
|||||||||
| (a) | Includes time-based restricted shares and performance-based restricted shares, which do not vest during the fiscal year awarded, and career shares, which vest 100% when granted. |
| (b) | Change in fair value from December 31 of the covered fiscal year compared to December 31 of the prior fiscal year. Each performance share included as part of the calculation represents a contingent right to receive up to a maximum of two shares of common stock, subject to satisfaction of certain performance metrics. Amounts reported assume the performance metrics will be achieved at the target performance level, which is the most probable outcome as of the end of the fiscal year, unless otherwise noted. Interim values based on assumption of the most probable outcome may not ultimately reflect actual payouts. |
| (c) | Change in fair value from vesting date compared to December 31 of the prior fiscal year. |
| (d) | The valuation assumptions used to calculate fair values did not materially differ from those disclosed at the time of grant. |
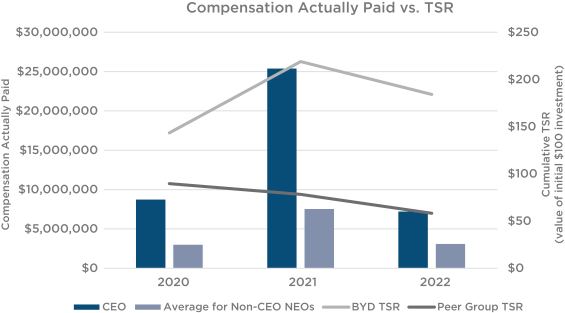
Compensation Actually Paid and Cumulative Total Shareholder Return (“TSR”)
As described in “”, equity awards comprise approximately 60% of our CEO’s compensation awarded during the fiscal year. These awards consist of performance-based restricted shares, time-based restricted shares, and career shares. Time-based restricted shares and performance-based restricted shares do not vest during the year awarded. Subject to certain exceptions as noted above, the degree to which career shares may be distributed at reitrement depends on the satisfaction of certain age and service criteria. The following graph demonstrates the relationship between compensation actually paid and cumulative TSR considering the Company’s emphasis on long-term equity awards.
Compensation Discussion and Analysis
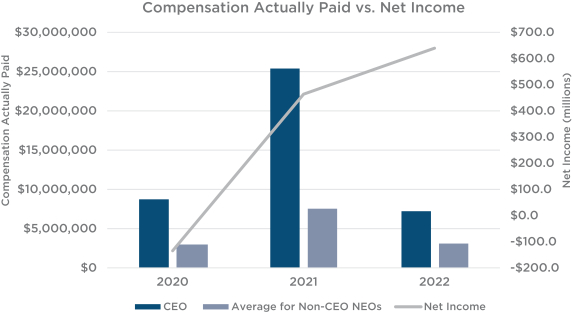
Compensation Actually Paid and Net Income
The following table demonstrates the relationship between compensation actually paid and net income, which is not a performance metric used in our overall compensation program but is related to Adjusted EBITDAR, which is included in our compensation program. See “”.
—
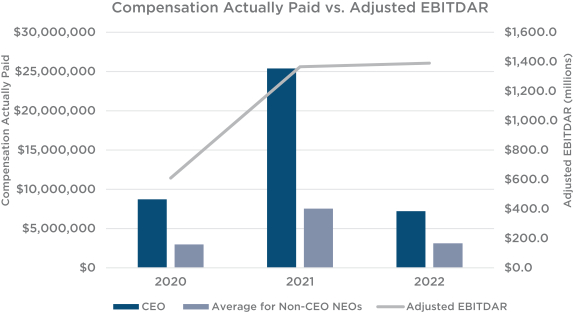
Compensation Actually Paid and Adjusted EBITDAR
Compensation Actually Paid and Adjusted EBITDAR
We believe Adjusted EBITDAR is the most important indicator of our financial performance, which is indicated by the relative significance it bears in achievement of short- and long-term incentives. See “”. The graph below demonstrates the relationship between compensation actually paid and Adjusted EBITDAR.
—
Compensation Discussion and Analysis
Financial Performance Measures
We structure our pay principles to balance achievement of short- and long-term goals with a focus on Company performance, as described in “”. We view the following financial performance measures as the most important financial performance measures in determining compensation actually paid to our CEO and other NEOs for the most recently completed fiscal year:
Compensation Discussion and Analysis
| • | Adjusted EBITDAR; |
| • | Adjusted EBITDAR Growth; and |
| • | Net Revenue Growth. |