Pay vs Performance Disclosure
|
12 Months Ended |
|
Dec. 31, 2022
USD ($)
|
Dec. 31, 2021
USD ($)
|
Dec. 31, 2020
USD ($)
|
| Pay vs Performance Disclosure [Table] |
|
|
|
| Pay vs Performance [Table Text Block] |
| | | | | | | | | | | | | | | | | | | | | | | | | | | | | | | | | | Year | Summary Compen- sation Table Total for PEO ($)(1) | Summary Compensation Table Total for PEO ($)(2) | Compensation Actually Paid to PEO ($)(1)(5) | Compensation Actually Paid to PEO ($)(2)(6) | Average Summary Compensation Table Total for Non-PEO NEOs ($)(3) | Average Compensation Actually Paid to Non-PEO NEOs ($)(3)(7) | Value of Initial Fixed $100 Investment Based On: | GAAP Consolidated Net Income/(Loss) ($)(9) | Utility Adjusted Net Income ($)(10) | TSR(8) | Peer Group TSR(4) | | 2022 | 4,355,798 | 6,129,727 | 3,648,614 | 1,664,481 | 1,823,386 | 1,319,319 | 89.96 | 104.87 | (203,290,000) | | 177,110,000 | | | 2021 | — | | 5,674,579 | — | | 6,424,725 | 2,139,255 | 2,303,196 | 98.48 | 101.63 | 200,779,000 | 182,135,000 | | | 2020 | — | | 6,511,777 | — | | 4,293,622 | 2,499,520 | 1,790,098 | 82.51 | 83.11 | 232,324,000 | 149,918,000 |
|
|
|
| Company Selected Measure Name |
utility adjusted net income
|
|
|
| Named Executive Officers, Footnote [Text Block] |
Amounts shown in this column relate to Ms. Haller, who became CEO of the Company in May 2022.Amounts shown in this column relate to Mr. Hester, who retired as CEO of the Company in May 2022.The non-principal executive officer (“PEO”) NEOs reflected in this column for 2022 were: Messrs. Stefani, Peterson, Brown and Daily and Ms. Williams. The non-PEO NEOs reflected in this column for 2021 and 2020 were: Messrs. Peterson, Daily and DeBonis, and Ms. Haller.
|
|
|
| Peer Group Issuers, Footnote [Text Block] |
The Company’s peer group for Pay Versus Performance Table purposes is the S&P 1500 Gas Utilities Index, the same index the Company uses for purposes of the stock performance graph in the Company’s Annual Report to Stockholders.
|
|
|
| Adjustment To PEO Compensation, Footnote [Text Block] |
Compensation Actually Paid (“CAP”) was calculated according to the SEC’s definition of CAP as directed by Item 402(v) of Regulation S-K, and is not the same as compensation received. To calculate CAP to Ms. Haller, the following amounts were deducted from and added to Summary Compensation Table (“SCT”) total compensation: | | | | | | | | | | | | | | | | | | | | | | Year | Fair Value Increase of Unvested Awards Granted in Applicable Fiscal Year As of Fiscal Year End ($) | Change from Prior Year End Fair Value of Unvested Awards Granted in Prior Fiscal Year to Applicable Fiscal Year End Fair Value ($) | Change from Prior Year End Fair Value of Awards Granted in Prior Fiscal Year That Vested in Applicable Fiscal Year to Vesting Date Fair Value ($) | Deduction for Stock Awards Column in SCT ($) | Deduction for Change in Pension Value in SCT ($) | Increase for Service Cost for Pension Plan ($) | 2022 | 2,672,255 | | (131,245) | | (297,267) | | (2,921,572) | | (93,225) | | 63,870 | |
CAP was calculated according to the SEC’s definition of CAP as directed by Item 402(v) of Regulation S-K, and is not the same as compensation received. To calculate CAP to Mr. Hester, the following amounts were deducted from and added to SCT total compensation: | | | | | | | | | | | | | | | | | | | | | | | | | Year | Fair Value Increase of Unvested Awards Granted in Applicable Fiscal Year As of Fiscal Year End ($) | Fair Value Increase of Awards Granted in Applicable Fiscal Year that Vested in Applicable Fiscal Year as of Vesting Date ($) | Change from Prior Year End Fair Value of Unvested Awards Granted in Prior Fiscal Year to Applicable Fiscal Year End Fair Value ($) | Change from Prior Year End Fair Value of Awards Granted in Prior Fiscal Year That Vested in Applicable Fiscal Year to Vesting Date Fair Value ($) | Deduction for Awards Forfeited During Applicable Fiscal Year ($) | Deduction for Stock Awards Column in SCT ($) | Deduction for Change in Pension Value in SCT ($) | 2022 | 268,639 | 784,294 | (202,244) | | (887,742) | | (1,613,185) | | (2,815,007) | | — | | 2021 | 3,534,898 | | — | | 459,881 | | 58,423 | | — | | (2,921,469) | | (381,587) | | 2020 | 2,279,181 | | — | | (242,928) | | (197,723) | | — | | (2,558,720) | | (1,497,964) | |
|
|
|
| Non-PEO NEO Average Total Compensation Amount |
$ 1,823,386
|
$ 2,139,255
|
$ 2,499,520
|
| Non-PEO NEO Average Compensation Actually Paid Amount |
$ 1,319,319
|
2,303,196
|
1,790,098
|
| Adjustment to Non-PEO NEO Compensation Footnote [Text Block] |
CAP was calculated according to the SEC’s definition of CAP as directed by Item 402(v) of Regulation S-K, and is not the same as compensation received. To calculate average CAP paid to the non-PEO NEOs, the following amounts were deducted from and added to average SCT total compensation: | | | | | | | | | | | | | | | | | | | | | | | | | Year | Average Fair Value Increase of Unvested Awards Granted in Applicable Fiscal Year As of Fiscal Year End ($) | Average Change from Prior Year End Fair Value of Unvested Awards Granted in Prior Fiscal Year to Applicable Fiscal Year End Fair Value ($) | Average Change from Prior Year End Fair Value of Awards Granted in Prior Fiscal Year That Vested in Applicable Fiscal Year to Vesting Date Fair Value ($) | Average Deduction for Awards Forfeited During Applicable Fiscal Year ($) | Average Deduction for Stock Awards Column in SCT ($) | Average Deduction for Change in Pension Value in SCT ($) | Average Increase for Service Cost for Pension Plan ($) | 2022 | 842,425 | | (51,419) | | (232,109) | | (39,754) | | (1,076,123) | | — | | 52,913 | | 2021 | 881,896 | | 109,394 | | 29,838 | | — | | (753,874) | | (153,986) | | 50,673 | | 2020 | 551,533 | | (56,154) | | (19,625) | | — | | (639,270) | | (590,334) | | 44,429 | |
|
|
|
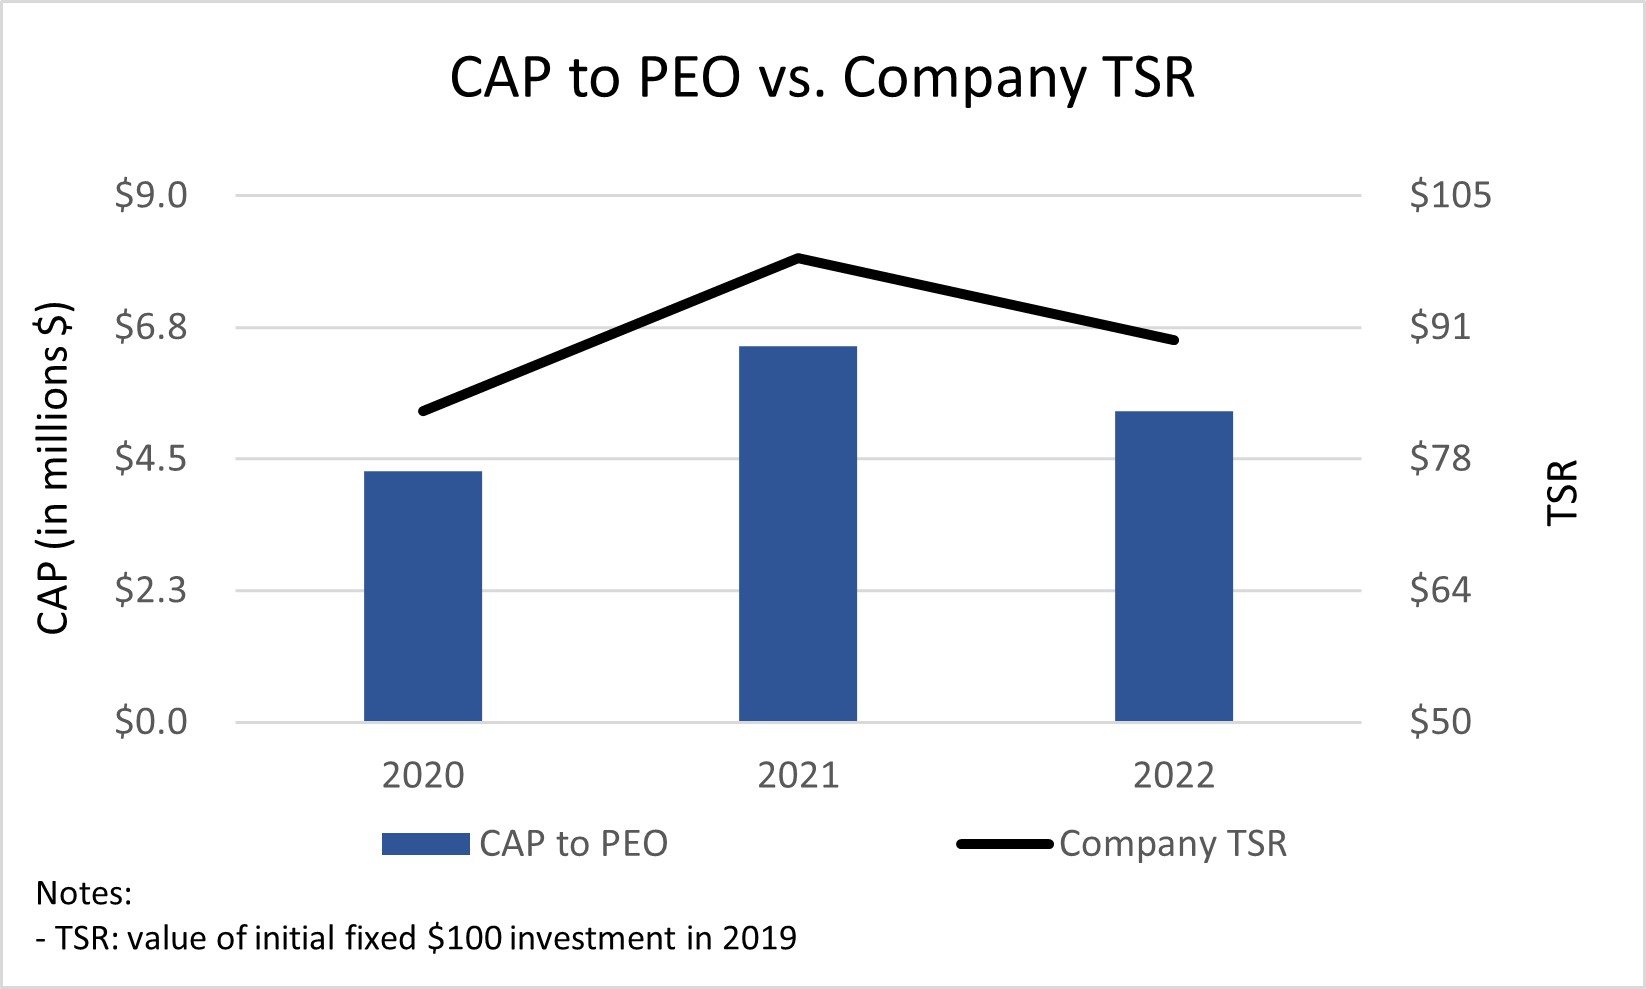
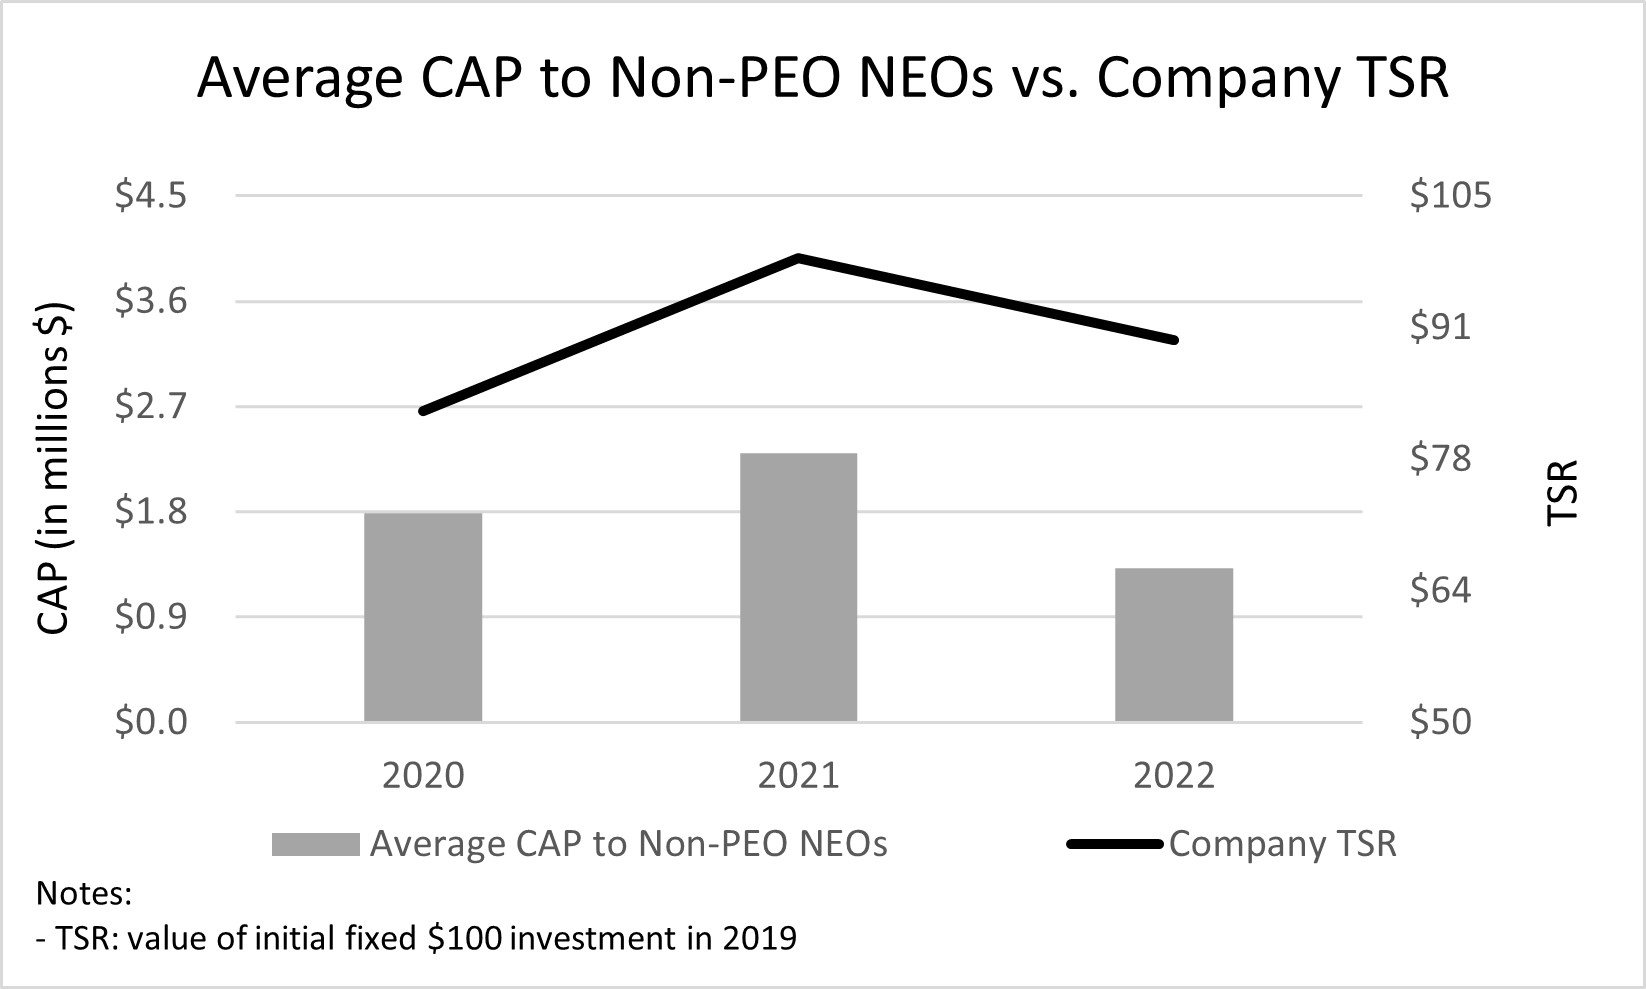
| Compensation Actually Paid vs. Total Shareholder Return [Text Block] |
CAP Versus Company TSR As shown on the graphs below, as the Company’s absolute TSR increases and decreases, so does CAP paid to the PEO and non-PEO NEOs. The Company does not use Company absolute TSR as a measure to determine compensation levels or incentive plan payouts. Rather, relative TSR using the TSR for the 20-member peer group created for compensation benchmarking purposes is used as a modifier to increase or decrease long-term incentive payouts by up to 30%. For more information on the Company’s use of relative TSR as a modifier in its long-term incentive program, see “Executive Compensation - Compensation Discussion and Analysis - Details of Compensation Program” above.
|
|
|
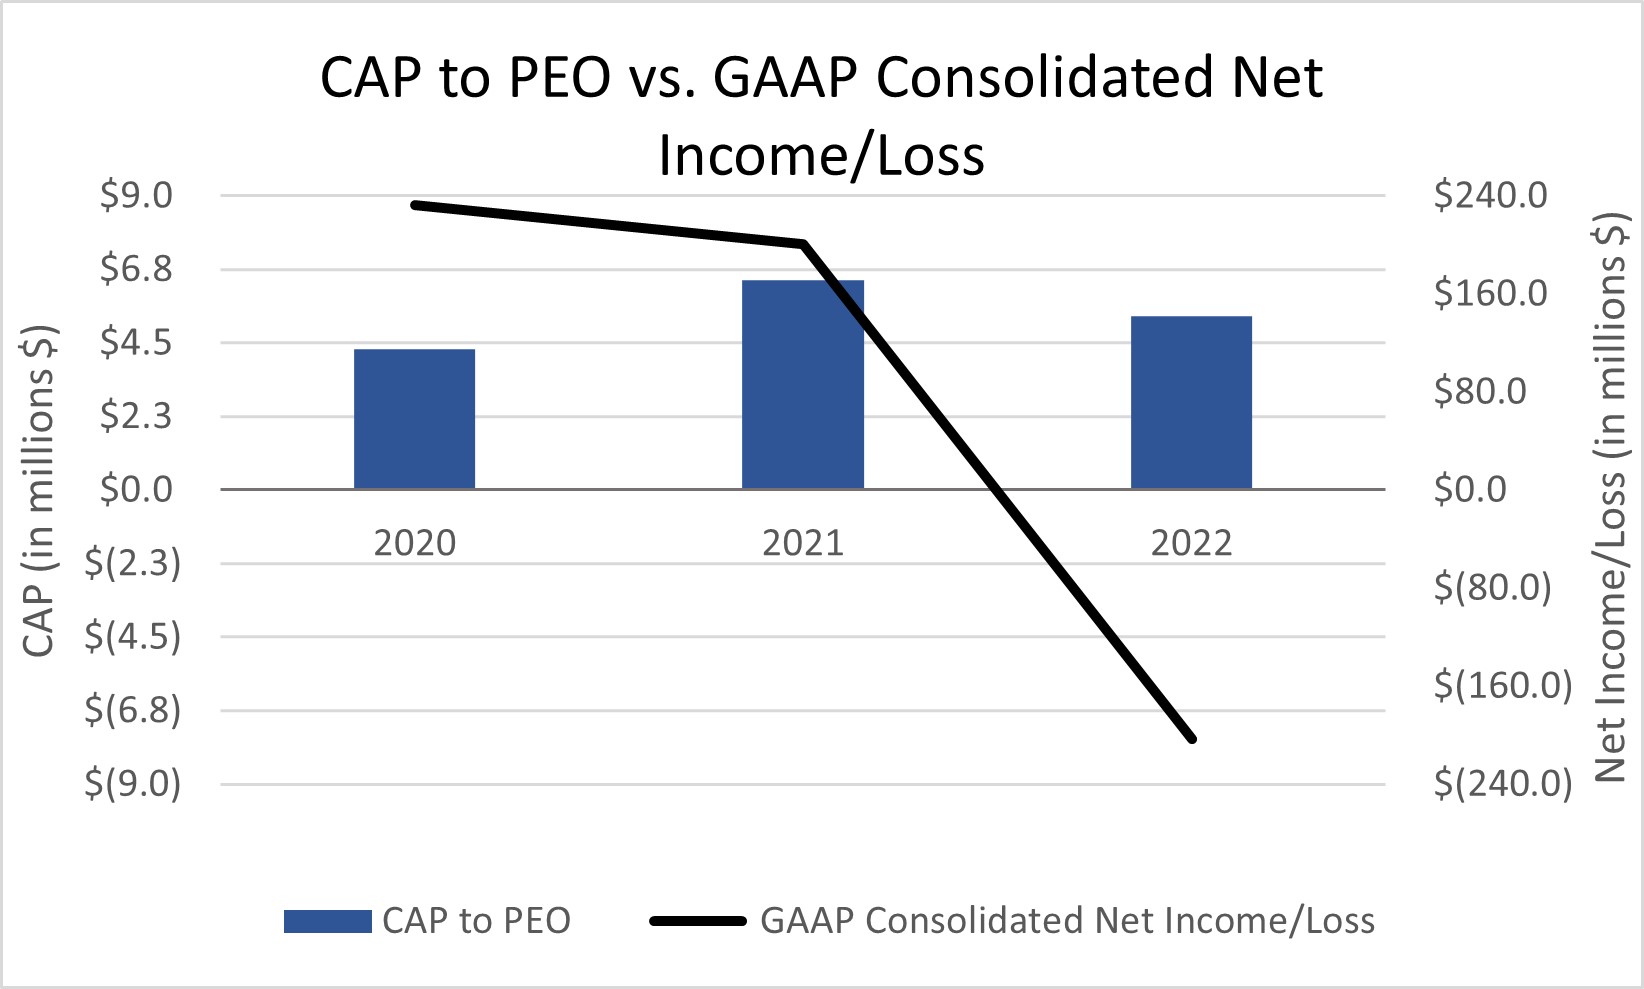
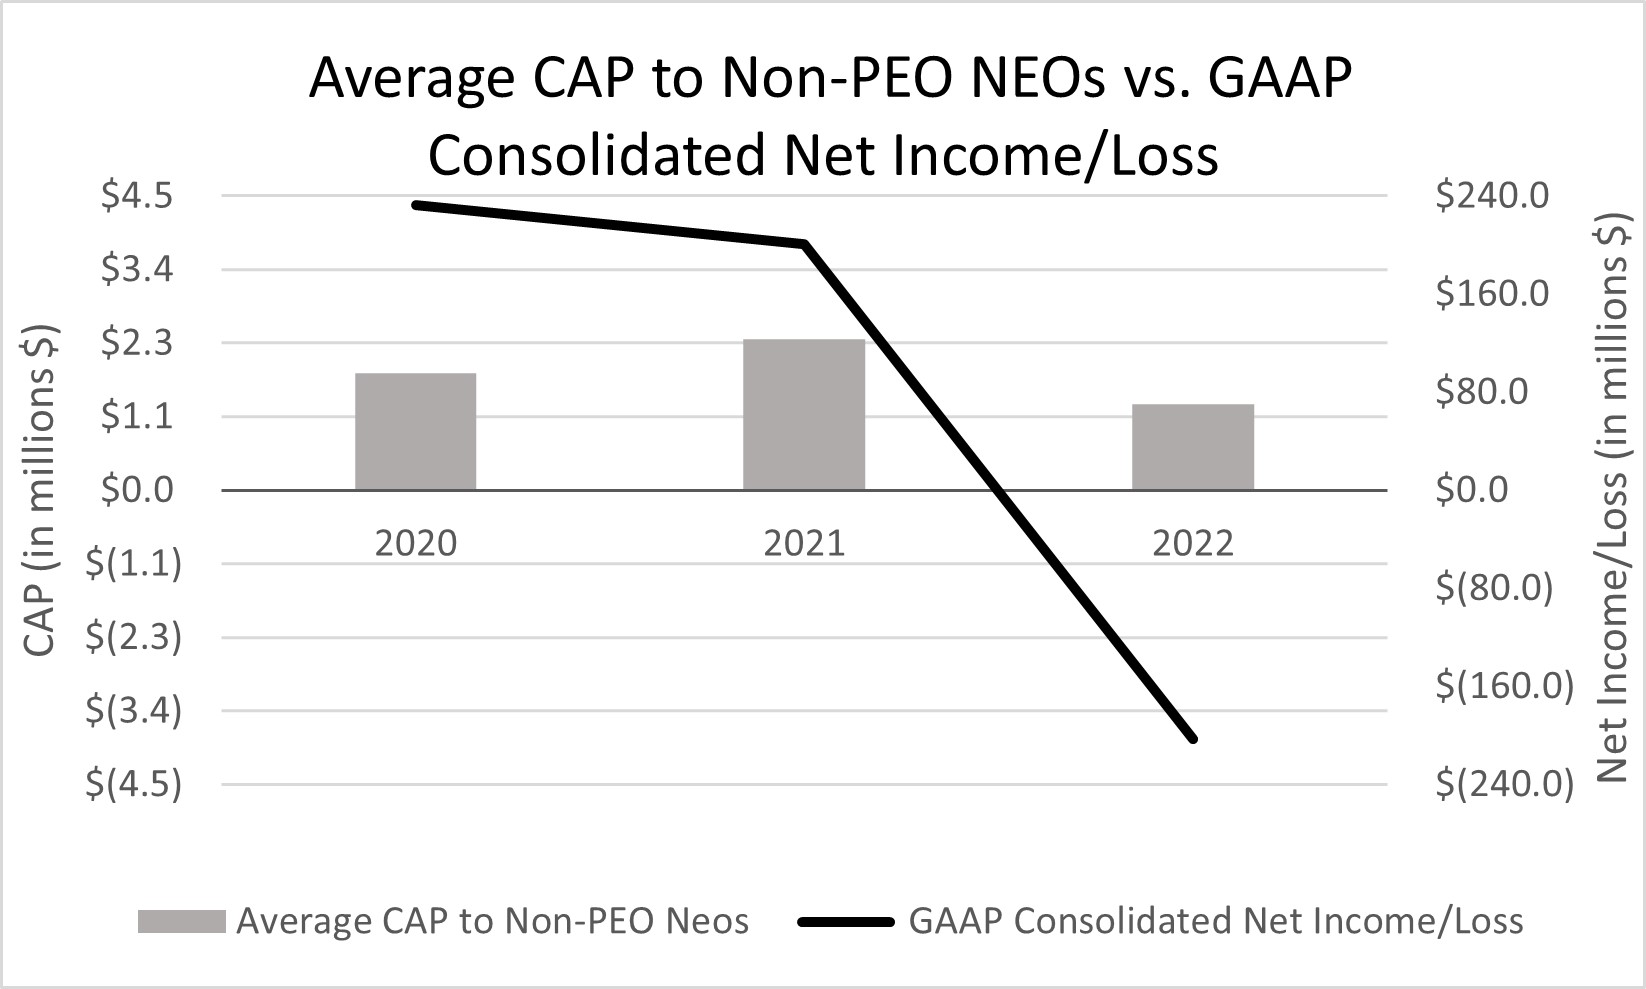
| Compensation Actually Paid vs. Net Income [Text Block] |
CAP Versus GAAP Consolidated Net Income/(Loss) As shown in the graphs below, CAP paid to the PEO and non-PEO NEOs does not move consistently with GAAP consolidated net income/loss. The Company does not use GAAP consolidated net income to determine compensation levels or incentive plan payouts, but instead uses adjusted net income (either for the Company on a consolidated basis for annual incentives, for the utility for both annual and long-term incentives, or earnings before tax and amortization for Centuri for annual incentives) as a significantly-weighted measure for annual and long-term incentive compensation payouts. For more information on the Company’s use of adjusted net income in its annual and long-term incentive programs, see “Executive Compensation - Compensation Discussion and Analysis - Details of Compensation Program” above.
|
|
|
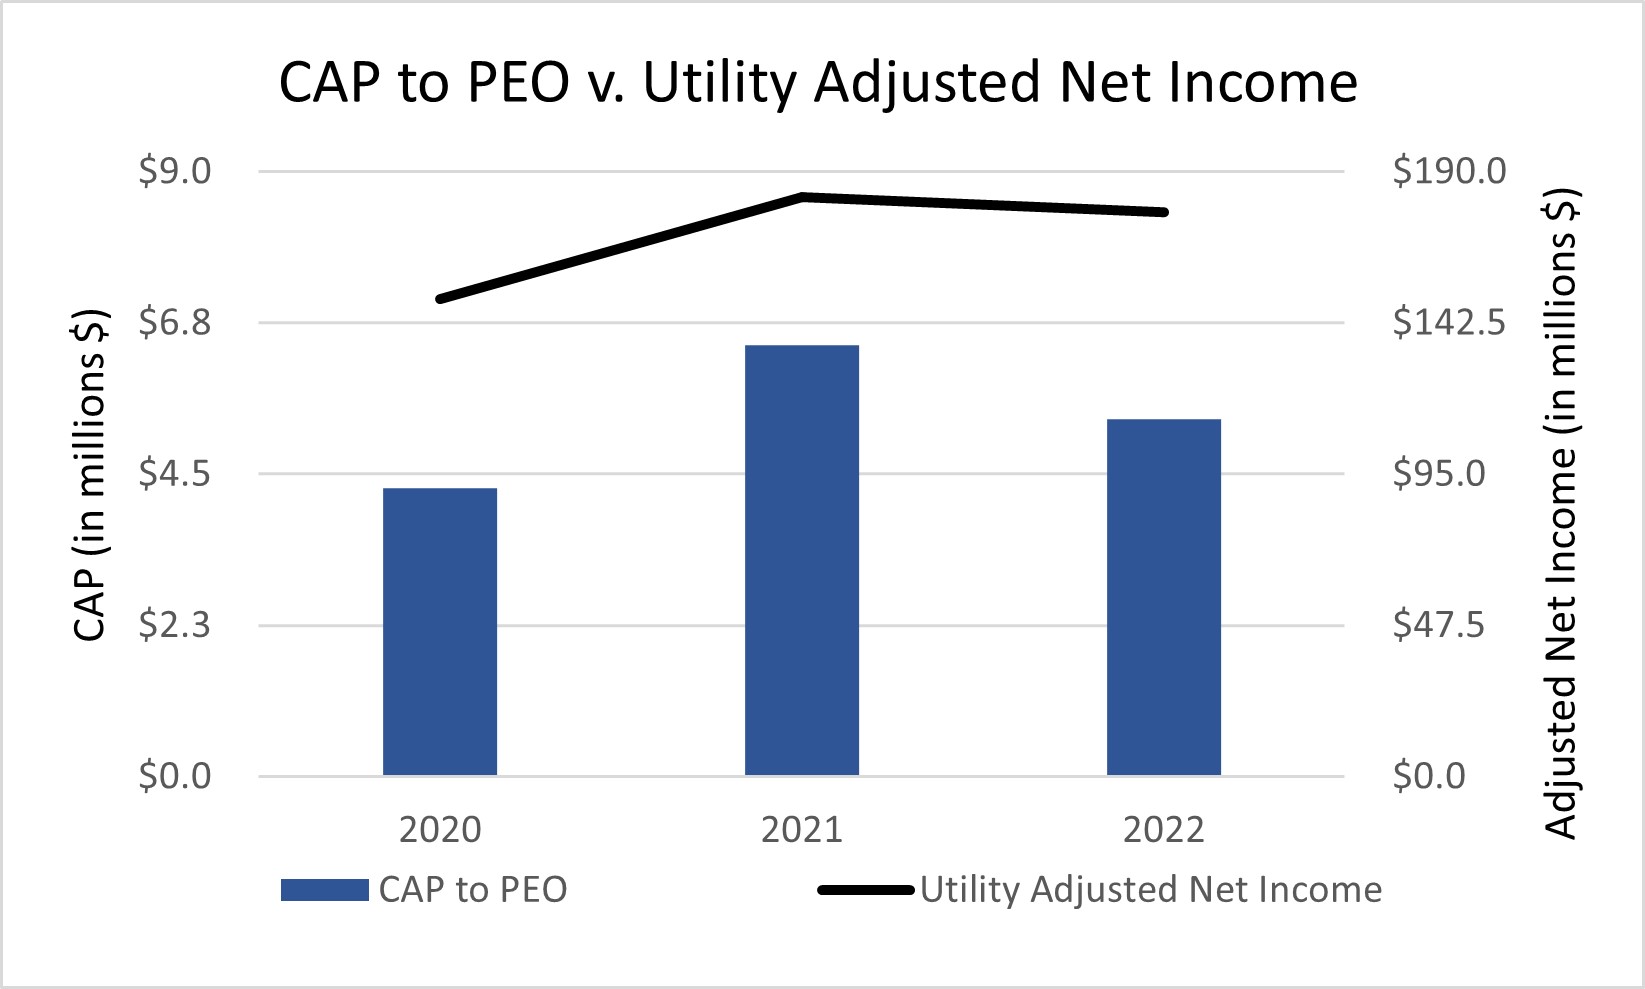
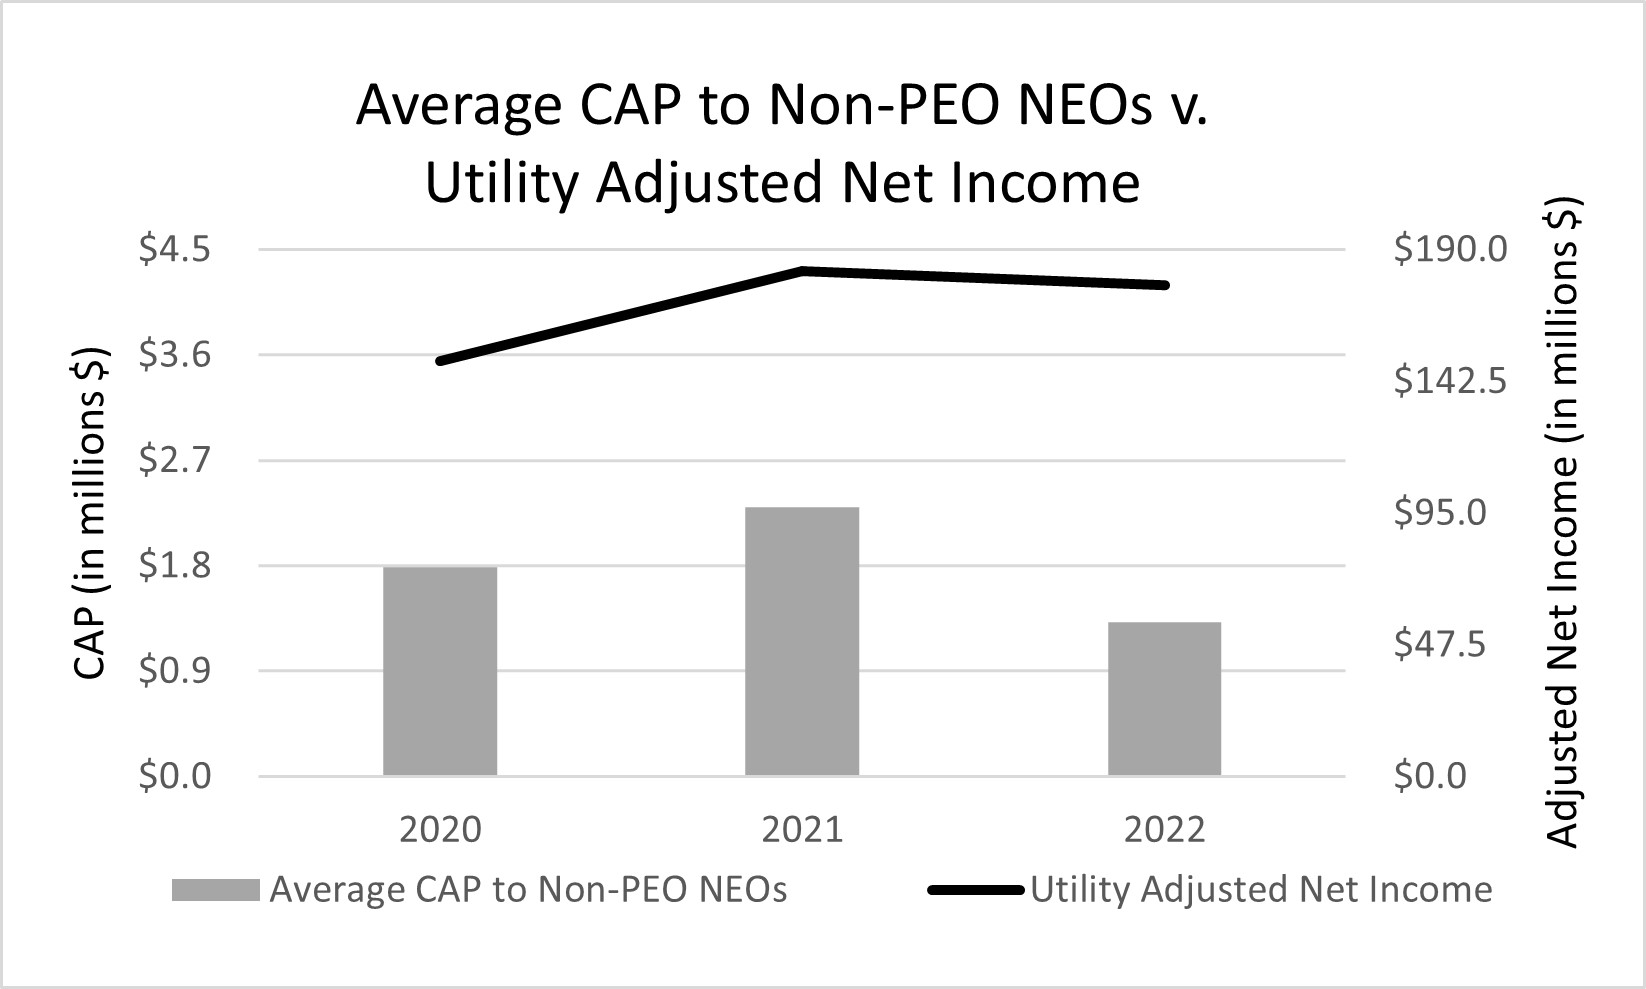
| Compensation Actually Paid vs. Company Selected Measure [Text Block] |
CAP Versus Utility Adjusted Net Income As shown on the graphs below, utility adjusted net income and CAP paid to the PEO and non-PEO NEOs move fairly consistently. Utility adjusted net income is the company-selected measure because it is the most important single-year financial performance measure used by the Company to link CAP to Company performance for 2022. It is most important because it is the single-year financial measure that is the most heavily weighted to determine annual incentive compensation payouts for each of the utility NEOs. Utility adjusted net income performance determines 40% of annual incentive compensation payouts for the utility officers. Utility adjusted net income is included as part of the Company’s consolidated adjusted net income measure in the annual incentive program for Company officers and is not used for Centuri officers. Using utility adjusted net income, rather than GAAP net income, is appropriate for the Company’s compensation program because the adjustments are used to help ensure comparability year over year and generally reflect items that are outside the control of management or are otherwise special, non-recurring items. For more information on the Company’s use of utility adjusted net income in the annual incentive program, and how this non-GAAP measure is calculated, see “Executive Compensation - Compensation Discussion and Analysis - Details of Compensation Program” above.
|
|
|
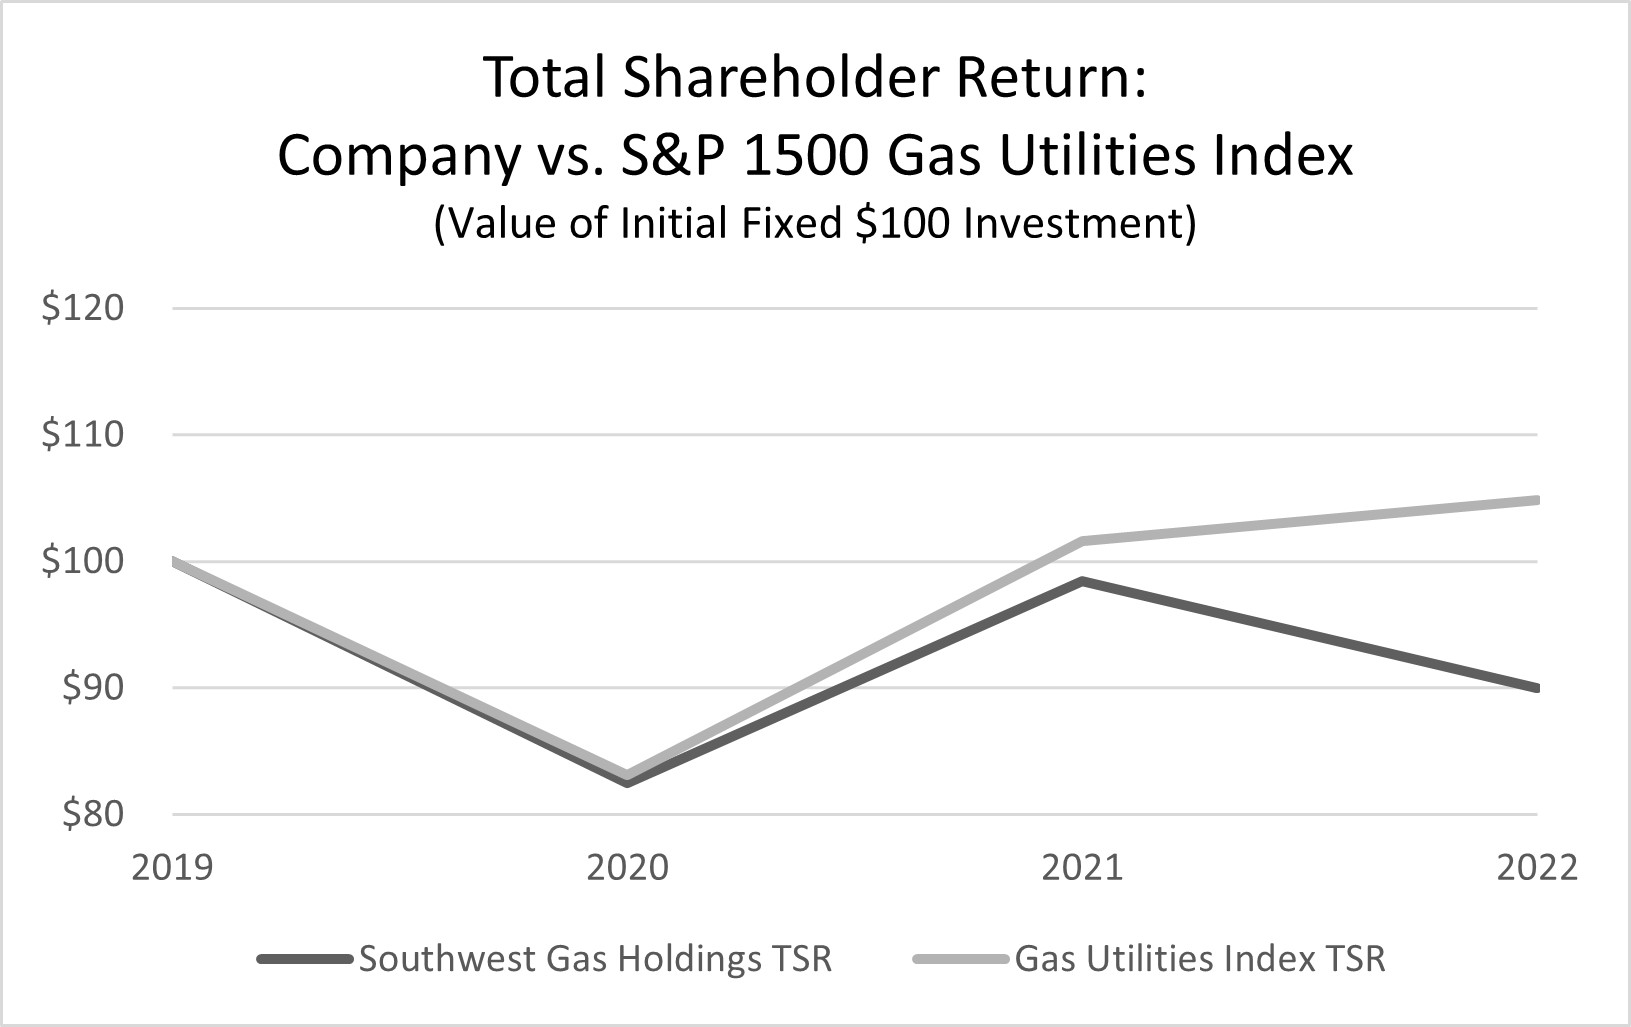
| Total Shareholder Return Vs Peer Group [Text Block] |
Company TSR Versus S&P 1500 Gas Utilities Index TSR As shown on the graph below, the Company’s TSR tracked consistently with the S&P 1500 Gas Utilities Index TSR in both positive and negative directions in 2020 and 2021, but varied in 2022.
|
|
|
| Tabular List [Table Text Block] |
| | | | | | | | | | | | | | | | Most Important Performance Measures | | Most Important Performance Measures | | Most Important Performance Measures | | Ms. Haller, Messrs. Hester, Stefani and Peterson | | Mr. Brown and Ms. Williams | | Mr. Daily | 3-year Adjusted EPS | | 3-year Average Utility ROE | | Centuri Enterprise Value | | 3-year Average Utility ROE | | Utility Adjusted Net Income | | Centuri Safety | | Consolidated Adjusted Net Income | | Utility Safety | | Centuri Earnings Before Tax and Amortization | | Utility Safety | | Utility Productivity | | | | Utility Productivity | | Utility Customer Satisfaction | | | | Utility Customer Satisfaction | | | | |
|
|
|
| Total Shareholder Return Amount |
$ 89.96
|
98.48
|
82.51
|
| Peer Group Total Shareholder Return Amount |
104.87
|
101.63
|
83.11
|
| Net Income (Loss) |
$ (203,290,000)
|
$ 200,779,000
|
$ 232,324,000
|
| Company Selected Measure Amount |
177,110,000
|
182,135,000
|
149,918,000
|
| Additional 402(v) Disclosure [Text Block] |
As required by Item 402(v)(2)(iv) and Item 201(e) of Regulation S-K, the Company’s cumulative TSR is calculated by dividing the sum of the cumulative amount of dividends for the measurement period (assuming dividend reinvestment) and the difference between the Company’s stock price at the end and the beginning of the measurement period by the Company’s stock price at the beginning of the measurement period. Net income/loss in this column is the Company’s GAAP consolidated net income/loss reflected in the Company’s audited financial statements for the applicable year.
|
|
|
| Measure [Axis]: 1 |
|
|
|
| Pay vs Performance Disclosure [Table] |
|
|
|
| Non-GAAP Measure Description [Text Block] |
The Company-Selected Measure is utility adjusted net income, which is a non-GAAP measure. For a description of the adjustments made to utility net income to arrive at utility adjusted net income, see “Executive Compensation - Compensation Discussion and Analysis - Details of Compensation Program” above.
|
|
|
| Haller [Member] |
|
|
|
| Pay vs Performance Disclosure [Table] |
|
|
|
| PEO Total Compensation Amount |
$ 4,355,798
|
$ 0
|
$ 0
|
| PEO Actually Paid Compensation Amount |
3,648,614
|
0
|
0
|
| Hester [Member] |
|
|
|
| Pay vs Performance Disclosure [Table] |
|
|
|
| PEO Total Compensation Amount |
6,129,727
|
5,674,579
|
6,511,777
|
| PEO Actually Paid Compensation Amount |
$ 1,664,481
|
6,424,725
|
4,293,622
|
| Haller, Messrs. Hester, Stefani and Peterson [Member] | Measure [Axis]: 2 |
|
|
|
| Pay vs Performance Disclosure [Table] |
|
|
|
| Measure Name |
3-year Adjusted EPS
|
|
|
| Haller, Messrs. Hester, Stefani and Peterson [Member] | Measure [Axis]: 3 |
|
|
|
| Pay vs Performance Disclosure [Table] |
|
|
|
| Measure Name |
3-year Average Utility ROE
|
|
|
| Haller, Messrs. Hester, Stefani and Peterson [Member] | Measure [Axis]: 4 |
|
|
|
| Pay vs Performance Disclosure [Table] |
|
|
|
| Measure Name |
Utility Safety
|
|
|
| Haller, Messrs. Hester, Stefani and Peterson [Member] | Measure [Axis]: 5 |
|
|
|
| Pay vs Performance Disclosure [Table] |
|
|
|
| Measure Name |
Utility Productivity
|
|
|
| Haller, Messrs. Hester, Stefani and Peterson [Member] | Measure [Axis]: 6 |
|
|
|
| Pay vs Performance Disclosure [Table] |
|
|
|
| Measure Name |
Utility Customer Satisfaction
|
|
|
| Haller, Messrs. Hester, Stefani and Peterson [Member] | Measure [Axis]: 7 |
|
|
|
| Pay vs Performance Disclosure [Table] |
|
|
|
| Measure Name |
Consolidated Adjusted Net Income
|
|
|
| Brown and Williams [Member] | Measure [Axis]: 1 |
|
|
|
| Pay vs Performance Disclosure [Table] |
|
|
|
| Measure Name |
Utility Adjusted Net Income
|
|
|
| Brown and Williams [Member] | Measure [Axis]: 3 |
|
|
|
| Pay vs Performance Disclosure [Table] |
|
|
|
| Measure Name |
3-year Average Utility ROE
|
|
|
| Brown and Williams [Member] | Measure [Axis]: 4 |
|
|
|
| Pay vs Performance Disclosure [Table] |
|
|
|
| Measure Name |
Utility Safety
|
|
|
| Brown and Williams [Member] | Measure [Axis]: 5 |
|
|
|
| Pay vs Performance Disclosure [Table] |
|
|
|
| Measure Name |
Utility Productivity
|
|
|
| Brown and Williams [Member] | Measure [Axis]: 6 |
|
|
|
| Pay vs Performance Disclosure [Table] |
|
|
|
| Measure Name |
Utility Customer Satisfaction
|
|
|
| Daily [Member] | Measure [Axis]: 8 |
|
|
|
| Pay vs Performance Disclosure [Table] |
|
|
|
| Measure Name |
Centuri Enterprise Value
|
|
|
| Daily [Member] | Measure [Axis]: 9 |
|
|
|
| Pay vs Performance Disclosure [Table] |
|
|
|
| Measure Name |
Centuri Safety
|
|
|
| Daily [Member] | Measure [Axis]: 10 |
|
|
|
| Pay vs Performance Disclosure [Table] |
|
|
|
| Measure Name |
Centuri Earnings Before Tax and Amortization
|
|
|
| PEO [Member] | Haller [Member] | Adjustment, Equity Awards Granted And Unvested During The Year [Member] |
|
|
|
| Pay vs Performance Disclosure [Table] |
|
|
|
| Adjustment to Compensation Amount |
$ 2,672,255
|
|
|
| PEO [Member] | Haller [Member] | Adjustment, Equity Awards Granted And Unvested In Prior Year [Member] |
|
|
|
| Pay vs Performance Disclosure [Table] |
|
|
|
| Adjustment to Compensation Amount |
(131,245)
|
|
|
| PEO [Member] | Haller [Member] | Adjustment, Equity Awards Granted And Vested In Prior Year [Member] |
|
|
|
| Pay vs Performance Disclosure [Table] |
|
|
|
| Adjustment to Compensation Amount |
(297,267)
|
|
|
| PEO [Member] | Haller [Member] | Adjustment, Exclusion Of Stock Awards [Member] |
|
|
|
| Pay vs Performance Disclosure [Table] |
|
|
|
| Adjustment to Compensation Amount |
(2,921,572)
|
|
|
| PEO [Member] | Haller [Member] | Adjustment, Exclusion Of Change In Pension Value [Member] |
|
|
|
| Pay vs Performance Disclosure [Table] |
|
|
|
| Adjustment to Compensation Amount |
(93,225)
|
|
|
| PEO [Member] | Haller [Member] | Adjustment, Inclusion Of Pension Service Cost [Member] |
|
|
|
| Pay vs Performance Disclosure [Table] |
|
|
|
| Adjustment to Compensation Amount |
63,870
|
|
|
| PEO [Member] | Hester [Member] | Adjustment, Equity Awards Granted And Unvested During The Year [Member] |
|
|
|
| Pay vs Performance Disclosure [Table] |
|
|
|
| Adjustment to Compensation Amount |
268,639
|
3,534,898
|
2,279,181
|
| PEO [Member] | Hester [Member] | Adjustment, Equity Awards Granted And Unvested In Prior Year [Member] |
|
|
|
| Pay vs Performance Disclosure [Table] |
|
|
|
| Adjustment to Compensation Amount |
(202,244)
|
459,881
|
(242,928)
|
| PEO [Member] | Hester [Member] | Adjustment, Equity Awards Granted And Vested In Prior Year [Member] |
|
|
|
| Pay vs Performance Disclosure [Table] |
|
|
|
| Adjustment to Compensation Amount |
(887,742)
|
58,423
|
(197,723)
|
| PEO [Member] | Hester [Member] | Adjustment, Exclusion Of Stock Awards [Member] |
|
|
|
| Pay vs Performance Disclosure [Table] |
|
|
|
| Adjustment to Compensation Amount |
(2,815,007)
|
(2,921,469)
|
(2,558,720)
|
| PEO [Member] | Hester [Member] | Adjustment, Exclusion Of Change In Pension Value [Member] |
|
|
|
| Pay vs Performance Disclosure [Table] |
|
|
|
| Adjustment to Compensation Amount |
0
|
(381,587)
|
(1,497,964)
|
| PEO [Member] | Hester [Member] | Adjustment, Equity Awards Granted And Vested During The Year [Member] |
|
|
|
| Pay vs Performance Disclosure [Table] |
|
|
|
| Adjustment to Compensation Amount |
784,294
|
0
|
0
|
| PEO [Member] | Hester [Member] | Adjustment, Equity Awards Forfeited During The Year [Member] |
|
|
|
| Pay vs Performance Disclosure [Table] |
|
|
|
| Adjustment to Compensation Amount |
(1,613,185)
|
0
|
0
|
| Non-PEO NEO [Member] | Adjustment, Equity Awards Granted And Unvested During The Year [Member] |
|
|
|
| Pay vs Performance Disclosure [Table] |
|
|
|
| Adjustment to Compensation Amount |
842,425
|
881,896
|
551,533
|
| Non-PEO NEO [Member] | Adjustment, Equity Awards Granted And Unvested In Prior Year [Member] |
|
|
|
| Pay vs Performance Disclosure [Table] |
|
|
|
| Adjustment to Compensation Amount |
(51,419)
|
109,394
|
(56,154)
|
| Non-PEO NEO [Member] | Adjustment, Equity Awards Granted And Vested In Prior Year [Member] |
|
|
|
| Pay vs Performance Disclosure [Table] |
|
|
|
| Adjustment to Compensation Amount |
(232,109)
|
29,838
|
(19,625)
|
| Non-PEO NEO [Member] | Adjustment, Exclusion Of Stock Awards [Member] |
|
|
|
| Pay vs Performance Disclosure [Table] |
|
|
|
| Adjustment to Compensation Amount |
(1,076,123)
|
(753,874)
|
(639,270)
|
| Non-PEO NEO [Member] | Adjustment, Exclusion Of Change In Pension Value [Member] |
|
|
|
| Pay vs Performance Disclosure [Table] |
|
|
|
| Adjustment to Compensation Amount |
0
|
(153,986)
|
(590,334)
|
| Non-PEO NEO [Member] | Adjustment, Inclusion Of Pension Service Cost [Member] |
|
|
|
| Pay vs Performance Disclosure [Table] |
|
|
|
| Adjustment to Compensation Amount |
52,913
|
50,673
|
44,429
|
| Non-PEO NEO [Member] | Adjustment, Equity Awards Forfeited During The Year [Member] |
|
|
|
| Pay vs Performance Disclosure [Table] |
|
|
|
| Adjustment to Compensation Amount |
$ (39,754)
|
$ 0
|
$ 0
|