Pay Versus Performance
The following table and graphs below summarize the relationship between executive compensation “actually paid” (referred to as “Compensation Actually Paid” or the “CAP Amounts”) to the Principal Executive Officer (“PEO”) and the Non-PEO Named Executive Officers (“Non-PEO NEOs”), and the financial performance of the Company over the time horizon set forth below in accordance with SEC rules. The Compensation Committee does not use the CAP Amounts as a basis for making compensation decisions. For a discussion of how our Compensation Committee seeks to align pay with performance when making compensation decisions, please review the Compensation Discussion and Analysis beginning on page 50 of this Proxy Statement.
The financial performance measures used are the Company’s TSR, the peer group TSR (as disclosed under Item 201(e) of Regulation S-K), and the Company’s Net Income, each of which are required financial performance measures under the SEC rules. The SEC rules also require an issuer to select its most important other financial performance measure that is used to link the CAP Amounts paid to these officers to the Company’s performance, which is Core Constant Currency EPS Growth, as reflected in the SEC-required table below.
| Summary Compensation | Compensation | Average
Summary Compensation Table | Average Compensation Actually Paid to | Value
of Initial Fixed $100 Investment Based On: | GAAP Net | Company Selected Measure: Core Constant | ||||||||||||||||||||||||||
| Year | Table
Total for PEO ($)(1) | Actually
Paid to PEO ($)(2) | Total
for Non-PEO NEOs ($)(1) | Non-PEO
NEOs ($)(2) | TSR ($) | Peer Group TSR ($)(3) | Income ($ Millions) | Currency
EPS Growth(4) | ||||||||||||||||||||||||
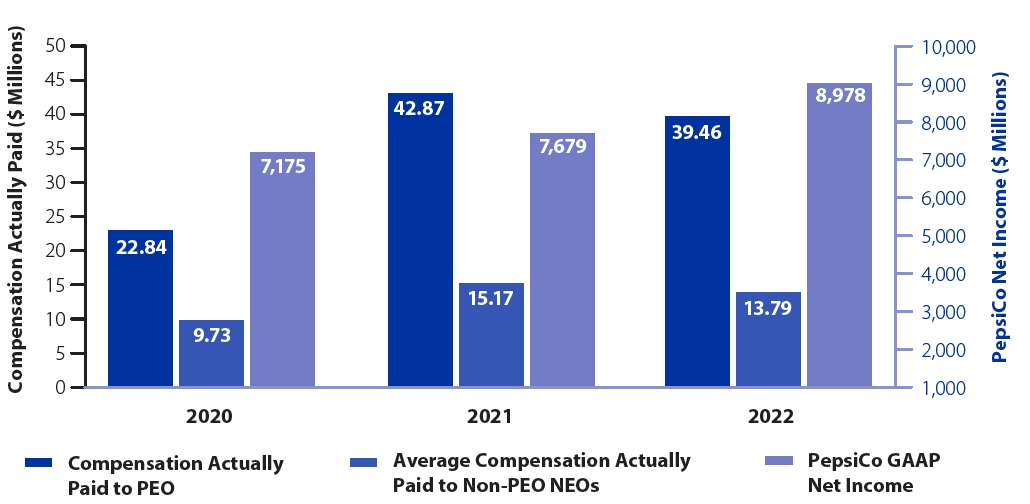
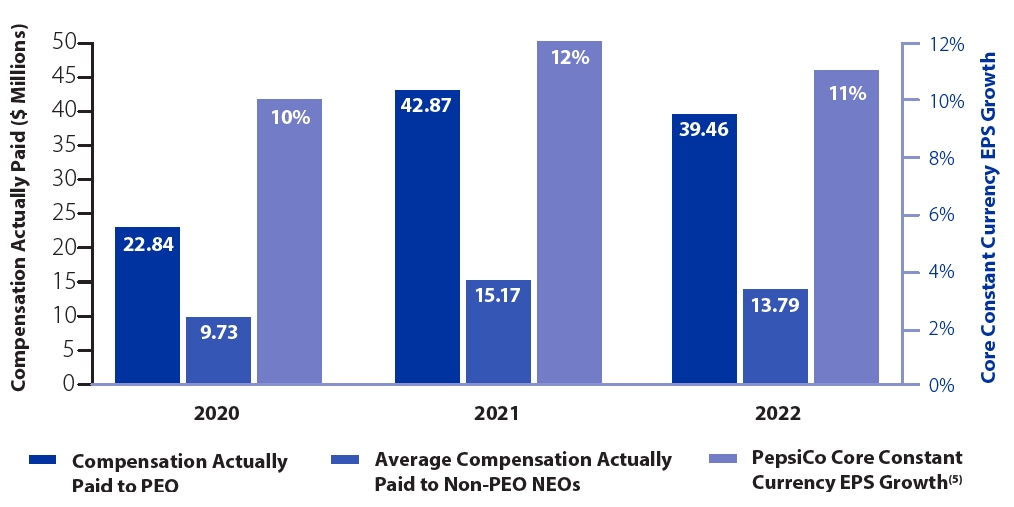
| 2022 | 28,388,228 | 39,459,410 | 9,410,089 | 13,789,185 | 143.76 | 132.87 | 8,978 | 11% | ||||||||||||||||||||||||
| 2021 | 25,506,607 | 42,875,825 | 9,096,366 | 15,171,885 | 134.65 | 122.05 | 7,679 | 12% | ||||||||||||||||||||||||
| 2020 | 21,486,982 | 22,842,981 | 8,459,321 | 9,727,328 | 111.71 | 106.77 | 7,175 | 10% | ||||||||||||||||||||||||
| (2) | The following table describes the adjustments, each of which is prescribed by the SEC rules, to calculate the CAP Amounts from the Summary Compensation Table (“SCT”) Amounts. The SCT Amounts and the CAP Amounts do not reflect the actual amount of compensation earned by or paid to our executives during the applicable years, but rather are amounts determined in accordance with Item 402 of Regulation S-K under the Exchange Act. Pursuant to the applicable rules, the amounts in the “Stock Awards” and “Change in Pension Value and Non-Qualified Deferred Compensation Earnings” columns from the Summary Compensation Table are subtracted from the SCT Amounts and the values reflected in the table below are added or subtracted as applicable: |
| 2022 | 2021 | 2020 | ||||||||||||||||||||||
| Adjustments ($) | PEO | Non-PEO NEOs* | PEO | Non-PEO NEOs* | PEO | Non-PEO NEOs* | ||||||||||||||||||
| SCT Amounts | 28,388,228 | 9,410,089 | 25,506,607 | 9,096,366 | 21,486,982 | 8,459,321 | ||||||||||||||||||
| Adjustments for defined benefit and actuarial pension plans | ||||||||||||||||||||||||
| Aggregate change in actuarial present value included in “Change in Pension Value and Non-Qualified Deferred Compensation Earnings” column in SCT | (4,251,779 | ) | (498,002 | ) | (4,415,239 | ) | (1,321,958 | ) | (4,344,395 | ) | (1,318,735 | ) | ||||||||||||
| Service cost for the covered fiscal year | 953,618 | 353,013 | 816,553 | 302,122 | 601,341 | 232,594 | ||||||||||||||||||
| Prior service cost for the covered fiscal year | — | — | — | — | (503,634 | ) | (236,572 | ) | ||||||||||||||||
| Adjustments for stock awards | ||||||||||||||||||||||||
| Aggregate value for stock awards included in “Stock Awards” column in SCT | (9,404,937 | ) | (2,838,034 | ) | (8,745,056 | ) | (2,640,028 | ) | (9,694,125 | ) | (3,302,381 | ) | ||||||||||||
| Fair value at year-end of awards granted during the covered fiscal year that were outstanding and unvested at the covered fiscal year-end | 17,480,226 | 5,274,833 | 19,652,478 | 5,932,848 | 10,639,410 | 4,147,254 | ||||||||||||||||||
| Year-over-year change in fair value at covered fiscal year- end of awards granted in any prior fiscal year that were outstanding and unvested at the covered fiscal year-end | 5,841,425 | 1,999,052 | 10,096,657 | 3,785,630 | 4,585,915 | 1,650,153 | ||||||||||||||||||
| Change as of the vesting date (from the end of the prior fiscal year) in fair value of awards granted in any prior fiscal year for which vesting conditions were satisfied during the covered fiscal year | (501,577 | ) | (120,539 | ) | (206,802 | ) | (193,826 | ) | (115,828 | ) | (101,856 | ) | ||||||||||||
| Dividends or other earnings paid on stock awards in the covered fiscal year prior to vesting if not otherwise included in the total compensation for the covered fiscal year | 954,206 | 208,773 | 170,627 | 210,731 | 187,315 | 197,550 | ||||||||||||||||||
| Compensation Actually Paid (as calculated) | 39,459,410 | 13,789,185 | 42,875,825 | 15,171,885 | 22,842,981 | 9,727,328 | ||||||||||||||||||
| * | Amounts presented are averages for the entire group of Non-PEO NEOs in each respective year. |
CAP VERSUS TSR AND PEER GROUP TSR
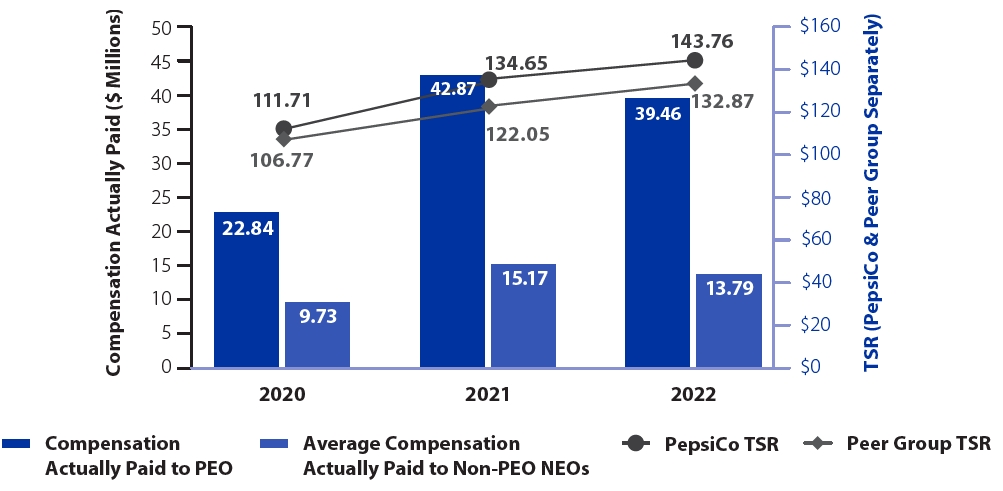
GROWTH(5) (2020 - 2022)
The following table lists the seven performance measures that, in our assessment, represent the most important performance measures we used to link compensation for our Named Executive Officers in 2022 to Company performance.
Most Important Performance Measures
| Core Constant Currency EPS Growth(5) | Organic Revenue Growth(5) |
| Core Constant Currency Net Income Growth(5)(6) | Relative Competitive Performance |
| Core Constant Currency Operating Profit Growth(5) | Relative Total Shareholder Return |
| Free Cash Flow Excluding Certain Items(5) |