Pay vs Performance Disclosure - USD ($)
Dec. 31, 2022
Dec. 31, 2021
Dec. 31, 2020
Pay versus
Performance
The table below shows the following information for the past three fiscal years: (i) total
compensation for our principal executive officer (PEO) and, on average, our other named executive officers (non-PEO NEOs) as disclosed in the Summary Compensation Table above; (ii) the “compensation actually paid” to our PEO and, on average, to
our non-PEO NEOs, calculated as required by SEC pay versus performance rules; (iii) our total shareholder return (TSR); (iv) the TSR of the peer group we use for purposes of Item 201(e) of Regulation S-K; (v) our net income; (vi) our revenue
and (vii) our adjusted income from operations (“AOI”), which is a non-GAAP measure. We selected revenue and AOI as the most important measures linking compensation actually paid to our NEOs for 2022 to Company performance – revenue because it
is a primary metric in our annual non-equity incentive compensation plan and several of the goals in our long-term incentive compensation plan target revenue growth in certain services or promote long-term revenue growth, and AOI because it was
the predominant metric used in our 2022 compensation plans, both as a qualifying metric and a performance metric for the 2022 PSU awards and as a performance metric for our 2022 annual non-equity incentive plan, as described in more detail in
the section titled “Compensation Discussion and Analysis.” See Exhibit 1 to this Proxy Statement for a reconciliation of AOI to the most directly comparable GAAP financial measure.
“Compensation actually paid” does not represent the value of cash and Company common shares
received by our NEOs during the year, but rather is an amount calculated in accordance with SEC rules and includes, among other things, year-over-year changes in the value of unvested equity-based awards. As a result of the calculation
methodology required by the SEC, the “compensation actually paid” amounts disclosed below differ from the compensation actually received by our NEOs.
Pay Versus Performance Table
| |
|
| |
|
| |
|
| |
|
| |
|
| |
Value of Initial Fixed
$100 Investment Based
On:
|
| |
|
| |
|
| |
|
| |||
| |
Year
|
| |
Summary
Compensation
Table Total for
PEO(1)
|
| |
Compensation
Actually Paid
to PEO(2)
|
| |
Average
Summary
Compensation
Table Total for
Non-PEO
NEOs(3)
|
| |
Average
Compensation
Actually Paid
to Non-PEO
NEOs(2)
|
| |
TSR(4)
|
| |
Peer Group
TSR(4)
|
| |
Net Income
(in $ '000)
|
| |
Revenue
(in $ '000)
|
| |
AOI
(in $ '000)
|
|
| |
2022
|
| |
4,166,783
|
| |
694,298
|
| |
2,976,115
|
| |
2,224,062
|
| |
113
|
| |
137
|
| |
353,404
|
| |
4,371,172
|
| |
718,219
|
|
| |
2021
|
| |
6,646,011
|
| |
27,436,323
|
| |
4,275,935
|
| |
8,907,805
|
| |
128
|
| |
208
|
| |
369,448
|
| |
4,022,211
|
| |
662,680
|
|
| |
2020
|
| |
5,294,702
|
| |
3,358,666
|
| |
2,535,069
|
| |
1,876,240
|
| |
99
|
| |
137
|
| |
308,276
|
| |
3,709,377
|
| |
588,808
|
|
|
(1)
|
Represents the total compensation of our PEO, N.V. Tyagarajan, as reported in the Summary Compensation Table for each year reported in the table.
|
|
(2)
|
SEC rules require certain adjustments be made to the Summary Compensation Table totals to determine “compensation actually paid” as
reported in the Pay versus Performance Table above. The following table details the applicable adjustments that were made to determine “compensation actually paid” to our PEO and, on average, our non-PEO NEOs for each year reported in
the table:
|
| |
|
| |
Executive(s)
|
| |
Summary
Compensation
Table Total
($)
|
| |
Subtract:
Reported
value of
equity
awards
granted
during the
year
($)
|
| |
Add: Year-end
fair value of
unvested equity
awards granted
during the
year ($)
|
| |
Add: Change in
fair value of
outstanding and
unvested
equity
awards granted in
prior years ($)
|
| |
Add: Change in
fair value of
equity
awards granted in
prior years that
vested during the
year
($)
|
| |
Compensation
actually paid ($)
|
|
| |
2022
|
| |
PEO
Non-PEO NEOs
|
| |
4,166,783
2,976,115
|
| |
2,252,530
1,812,167
|
| |
4,229,564
2,525,815
|
| |
(5,251,707)
(1,336,522)
|
| |
(197,812)
(129,179)
|
| |
694,298
2,224,062
|
|
| |
2021
|
| |
PEO
Non-PEO NEOs
|
| |
6,646,011
4,275,935
|
| |
4,080,420
2,979,374
|
| |
6,001,454
4,237,676
|
| |
13,782,911
3,332,710
|
| |
5,086,367
40,858
|
| |
27,436,323
8,907,805
|
|
| |
2020
|
| |
PEO
Non-PEO NEOs
|
| |
5,294,702
2,535,069
|
| |
3,366,017
1,386,350
|
| |
2,233,927
1,056,272
|
| |
(943,743)
(331,050)
|
| |
139,797
2,299
|
| |
3,358,666
1,876,240
|
|
|
(3)
|
Represents the average of the total compensation of each of our non-PEO NEOs as reported in the Summary Compensation Table for each
year indicated. The non-PEO NEOs included in this calculation for each reported year are as follows:
|
|
•
|
2022: Michael Weiner, Balkrishan Kalra, Darren Saumur and Kathryn Stein;
|
|
•
|
2021: Michael Weiner, Edward Fitzpatrick, Balkrishan Kalra, Darren Saumur and Kathryn Stein; and
|
|
•
|
2020: Edward Fitzpatrick, Balkrishan Kalra, Darren Saumur and Kathryn Stein.
|
|
(4)
|
TSR was determined assuming an initial fixed investment of $100 on December 31, 2019. The peer group TSR represents the TSR of the
peer group disclosed in our Annual Report on Form 10-K in accordance with Item 201(e) of Regulation S-K and consists of Accenture plc, Cognizant Technology Solutions Corp., ExlService Holdings, Inc., Infosys Technologies Limited, Wipro
Technologies Limited, and WNS (Holdings) Limited.
|
|
(2)
|
SEC rules require certain adjustments be made to the Summary Compensation Table totals to determine “compensation actually paid” as
reported in the Pay versus Performance Table above. The following table details the applicable adjustments that were made to determine “compensation actually paid” to our PEO and, on average, our non-PEO NEOs for each year reported in
the table:
|
| |
|
| |
Executive(s)
|
| |
Summary
Compensation
Table Total
($)
|
| |
Subtract:
Reported
value of
equity
awards
granted
during the
year
($)
|
| |
Add: Year-end
fair value of
unvested equity
awards granted
during the
year ($)
|
| |
Add: Change in
fair value of
outstanding and
unvested
equity
awards granted in
prior years ($)
|
| |
Add: Change in
fair value of
equity
awards granted in
prior years that
vested during the
year
($)
|
| |
Compensation
actually paid ($)
|
|
| |
2022
|
| |
PEO
Non-PEO NEOs
|
| |
4,166,783
2,976,115
|
| |
2,252,530
1,812,167
|
| |
4,229,564
2,525,815
|
| |
(5,251,707)
(1,336,522)
|
| |
(197,812)
(129,179)
|
| |
694,298
2,224,062
|
|
| |
2021
|
| |
PEO
Non-PEO NEOs
|
| |
6,646,011
4,275,935
|
| |
4,080,420
2,979,374
|
| |
6,001,454
4,237,676
|
| |
13,782,911
3,332,710
|
| |
5,086,367
40,858
|
| |
27,436,323
8,907,805
|
|
| |
2020
|
| |
PEO
Non-PEO NEOs
|
| |
5,294,702
2,535,069
|
| |
3,366,017
1,386,350
|
| |
2,233,927
1,056,272
|
| |
(943,743)
(331,050)
|
| |
139,797
2,299
|
| |
3,358,666
1,876,240
|
|
|
(2)
|
SEC rules require certain adjustments be made to the Summary Compensation Table totals to determine “compensation actually paid” as
reported in the Pay versus Performance Table above. The following table details the applicable adjustments that were made to determine “compensation actually paid” to our PEO and, on average, our non-PEO NEOs for each year reported in
the table:
|
| |
|
| |
Executive(s)
|
| |
Summary
Compensation
Table Total
($)
|
| |
Subtract:
Reported
value of
equity
awards
granted
during the
year
($)
|
| |
Add: Year-end
fair value of
unvested equity
awards granted
during the
year ($)
|
| |
Add: Change in
fair value of
outstanding and
unvested
equity
awards granted in
prior years ($)
|
| |
Add: Change in
fair value of
equity
awards granted in
prior years that
vested during the
year
($)
|
| |
Compensation
actually paid ($)
|
|
| |
2022
|
| |
PEO
Non-PEO NEOs
|
| |
4,166,783
2,976,115
|
| |
2,252,530
1,812,167
|
| |
4,229,564
2,525,815
|
| |
(5,251,707)
(1,336,522)
|
| |
(197,812)
(129,179)
|
| |
694,298
2,224,062
|
|
| |
2021
|
| |
PEO
Non-PEO NEOs
|
| |
6,646,011
4,275,935
|
| |
4,080,420
2,979,374
|
| |
6,001,454
4,237,676
|
| |
13,782,911
3,332,710
|
| |
5,086,367
40,858
|
| |
27,436,323
8,907,805
|
|
| |
2020
|
| |
PEO
Non-PEO NEOs
|
| |
5,294,702
2,535,069
|
| |
3,366,017
1,386,350
|
| |
2,233,927
1,056,272
|
| |
(943,743)
(331,050)
|
| |
139,797
2,299
|
| |
3,358,666
1,876,240
|
|
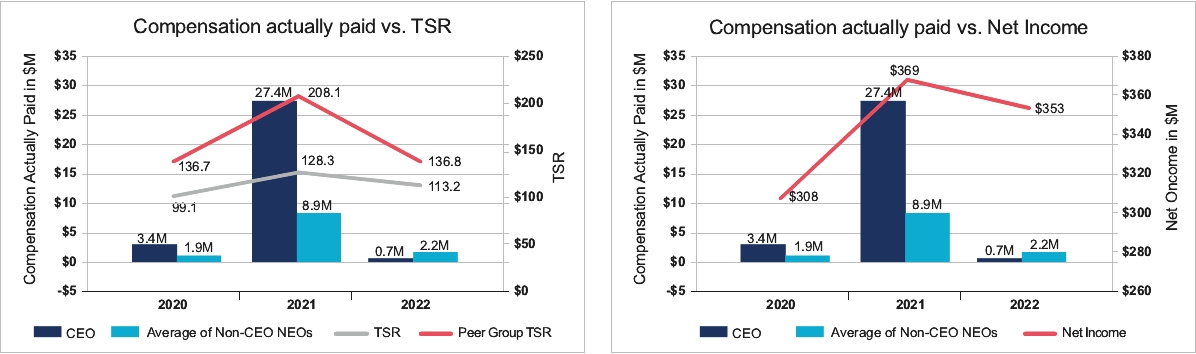
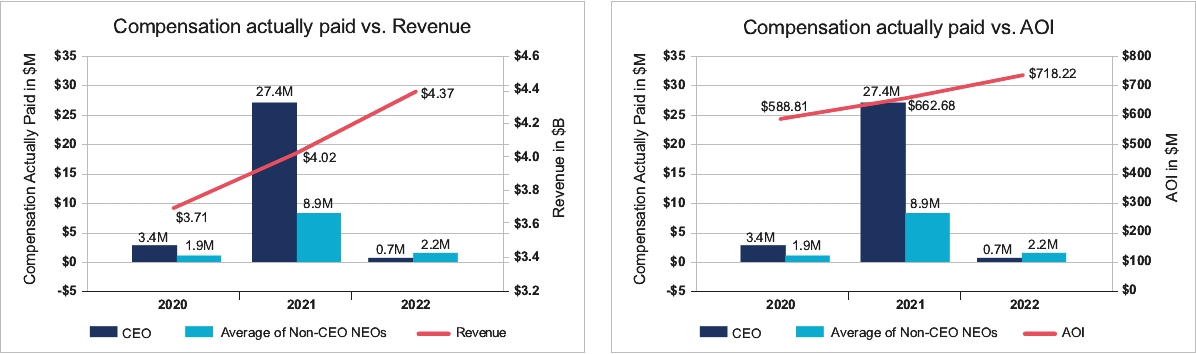
Relationship Between Compensation Actually
Paid to our NEOs and Company Performance
The following graphs further illustrate the relationship between the pay and performance
figures that are included in the Pay versus Performance Table above by comparing how our TSR (and the TSR of our peer group), net income, AOI and revenue, respectively, compare to the compensation actually paid to our NEOs for the years shown.
As noted above, the amounts of “compensation actually paid” as used in this section and in the following graphs were calculated in accordance with SEC rules and do not represent the compensation actually received by our NEOs during the
applicable years.
Most Important Measures Linking Compensation
Actually Paid During 2022 to Company Performance
Listed below in no particular order are the most important measures we used to link
compensation actually paid to our NEOs for 2022 to Company performance. For further information regarding these performance measures and their function in our executive compensation program, please see the section in this Proxy Statement titled
“Compensation Discussion and Analysis.”
| |
2022 Most Important Measures (Unranked)
|
| |||
| |
• AOI($)
|
| |
• Transformation services bookings
|
|
| |
• AOI margin
|
| |
• Renewal bookings
|
|
| |
• Net bookings
|
| |
• Revenue
|
|
| |
• Employee engagement score
|
| |
|
|
Relationship Between Compensation Actually
Paid to our NEOs and Company Performance
The following graphs further illustrate the relationship between the pay and performance
figures that are included in the Pay versus Performance Table above by comparing how our TSR (and the TSR of our peer group), net income, AOI and revenue, respectively, compare to the compensation actually paid to our NEOs for the years shown.
As noted above, the amounts of “compensation actually paid” as used in this section and in the following graphs were calculated in accordance with SEC rules and do not represent the compensation actually received by our NEOs during the
applicable years.