Pay vs Performance Disclosure - USD ($)
Dec. 31, 2022
Dec. 31, 2021
Dec. 31, 2020
P
AY
VERSUS
PERFORMANCE
Year |
Summary Compensation Table Total for PEO (1) |
Compensation Actually Paid to PEO (2) |
Average Summary Compensation Table Total for Non-PEO Named Executive Officers (3) |
Average Compensation Actually Paid to Non-PEO Named Executive Officers (4) |
Value of Initial Fixed $100 Investment Based On: |
Net Income (7) ( in millions ) |
||||||||||||||||||||||
Total Shareholder Return (5) |
Peer Group Total Shareholder Return (6) |
|||||||||||||||||||||||||||
2022 |
$ | 8,031,975 | $ | 8,031,975 | $ | 6,460,948 | $ | 5,982,322 | $ | 144 | $ | 98 | $ | 1,098 | ||||||||||||||
2021 |
5,629,478 | 5,686,151 | 2,868,125 | 2,901,866 | 157 | 124 | 547 | |||||||||||||||||||||
2020 |
4,436,450 | 3,938,276 | 2,397,694 | 2,119,384 | 109 | 90 | 492 | |||||||||||||||||||||
(1) |
For each year, reflects the total compensation amount reported for our Chief Executive Officer (our “PEO”), Frank B. Holding, Jr., in the “Total” column of our Summary Compensation Table that appears under the heading “E XECUTIVE COMPENSATION .” |
(2) |
For each year, reflects the amount of “Compensation Actually Paid” to our Chief Executive Officer, Frank B. Holding, Jr., as computed in accordance with Item 402(v) of Regulation S-K. |
Year |
Reported Summary Compensation Table Total for PEO |
Reported Change in Actuarial Present Value of Pension Benefits (a) |
Pension Benefit Adjustments (b) |
Compensation Actually Paid to PEO |
||||||||||||
2022 |
$ | 8,031,975 | $ | -0- |
$ | -0- |
$ | 8,031,975 | ||||||||
2021 |
5,629,478 | (60,063 | ) | 116,736 | 5,686,151 | |||||||||||
2020 |
4,436,450 | (581,100 | ) | 82,926 | 3,938,276 | |||||||||||
(a) |
Reflects subtraction of the aggregate change in the actuarial present value of Mr. Holding’s accumulated benefits under all defined benefit and actuarial pension plans as reported for him in the “Change in Pension Value and Nonqualified Deferred Compensation Earnings” column of the Summary Compensation Table for each year. |
(b) |
Reflects addition of annual “service cost,” which is the actuarially determined present value of Mr. Holding’s benefit under all defined benefit and actuarial pension plans attributable to services he rendered during each year. There are no adjustments related to service costs for prior years resulting from amendments to defined benefit or actuarial plans. |
XECUTIVE
COMPENSATION
.”
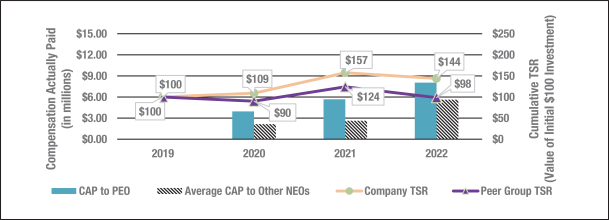
“Peer Group Total Shareholder Return” (“Peer Group TSR”) represents the cumulative total stockholder return during each measurement period for the KBW Nasdaq Bank Total Return Index, which is an industry index composed of the largest banking companies, including all regional and money center banks. Each amount assumes that $100 was invested on December 31, 2019, and dividends were reinvested for additional shares.
For each year, reflects the amount of “Compensation Actually Paid” to our Chief Executive Officer, Frank B. Holding, Jr., as computed in accordance with Item 402(v) of Regulation
S-K.
Year |
Reported Summary Compensation Table Total for PEO |
Reported Change in Actuarial Present Value of Pension Benefits (a) |
Pension Benefit Adjustments (b) |
Compensation Actually Paid to PEO |
||||||||||||
2022 |
$ | 8,031,975 | $ | -0- |
$ | -0- |
$ | 8,031,975 | ||||||||
2021 |
5,629,478 | (60,063 | ) | 116,736 | 5,686,151 | |||||||||||
2020 |
4,436,450 | (581,100 | ) | 82,926 | 3,938,276 | |||||||||||
(a) |
Reflects subtraction of the aggregate change in the actuarial present value of Mr. Holding’s accumulated benefits under all defined benefit and actuarial pension plans as reported for him in the “Change in Pension Value and Nonqualified Deferred Compensation Earnings” column of the Summary Compensation Table for each year. |
(b) |
Reflects addition of annual “service cost,” which is the actuarially determined present value of Mr. Holding’s benefit under all defined benefit and actuarial pension plans attributable to services he rendered during each year. There are no adjustments related to service costs for prior years resulting from amendments to defined benefit or actuarial plans. |
For each year, reflects the average of the amounts of “Compensation Actually Paid” to the other NEOs as a group (excluding Mr. Holding), as computed in accordance with Item 402(v) of Regulation
S-K.
In accordance with the requirements of Item 402(v), the following adjustments were made to average total compensation of the other NEOs as a group for each year to determine the “Compensation Actually Paid.”
Year |
Average Reported Summary Compensation Table Total for Non-PEO NEOs |
Average Reported Value of Equity Awards (a) |
Average Equity Award Adjustments (b) |
Average Reported Change in Actuarial Present Value of Pension Benefits (c) |
Average Pension Benefit Adjustments (d) |
Average Compensation Actually Paid to Non-PEO NEOs |
||||||||||||||||||
2022 |
$ | 6,460,948 | $ (659,436 | ) | $ | 148,923 | $ | -0- |
$ | 31,887 | $ | 5,982,322 | ||||||||||||
2021 |
2,868,125 | -0- |
-0- |
( 21,516 | ) | 55,257 | 2,901,866 | |||||||||||||||||
2020 |
2,397,694 | -0- |
-0- |
(323,938 | ) | 45,628 | 2,119,384 | |||||||||||||||||
(a) |
For 2022, reflects subtraction of the average for our NEOs as a group (excluding Mr. Holding) of the fair value, computed in accordance with FASB ASC Topic 718, of equity awards granted during that year. The RSUs deemed to have been granted to Mrs. Alemany during 2022 upon conversion of an equity award previously granted to her by CIT, as described above under the Grants of Plan-Based Awards table, is the only equity award that is deemed to have been granted to any of our NEOs during 2022, 2021 or 2020. |
(b) |
Reflects the addition of a net average amount of equity award adjustments for 2022, which was the only year in which equity awards were outstanding. The amounts added or subtracted in calculating the total average equity award adjustments for 2022 are listed in the following table. As described in footnotes to the table, Mrs. Alemany is the only NEO who held any equity awards during any year shown in the table. Amounts listed are averages for our four NEOs as a group, excluding Mr. Holding, based on equity awards held only by Mrs. Alemany. |
The
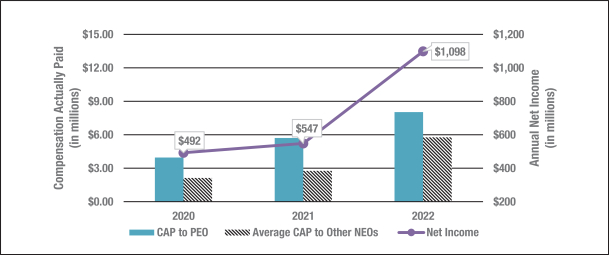
following graph compares, for
each of 2022, 2021 and 2020, the “Compensation Actually Paid” to our Chief Executive Officer, and the average “Compensation Actually Paid” to our other NEOs for each of those years to our net income as reported in our audited financial statements for each year. We do not use net income alone as a performance measure in the overall executive compensation program. However, net income is a substantial component of annual increases in tangible book value and, accordingly, it is a factor in our TBV+D Growth Rate. As illustrated by the following table, the amount of “Compensation Actually Paid” to Mr. Holding and the average amount of “Compensation Actually Paid” to our other NEOs as a group (excluding Mr. Holding) for each year are generally aligned with our net income over the three years presented in the table.C
OMPENSATION
ACTUALLY
PAID
(CAP) VS
. NET
INCOME
The
following graph compares, for each of 2022, 2021 and 2020, the “Compensation Actually Paid” to our Chief Executive Officer and the average “Compensation Actually Paid” to our other NEOs for each of those years to the Company TSR and Peer Group TSR over those years. As illustrated by the graph, the amount of “Compensation Actually Paid” to Mr. Holding and the average amount of “Compensation Actually Paid” to our other NEOs
as a group (excluding Mr. Holding) for each year are generally aligned with our Company TSR over the three years presented in the table, and our Company TSR compares favorably to the Peer Group TSR over that period. However, both our Company TSR and the Peer Group TSR for 2022 were negatively affected by the general market decline in stock prices during 2022. C
OMPENSATION
ACTUALLY
PAID
(CAP) VS
. COMPANY
TSR AND
PEER
GROUP
TSR