| Pay Versus | ||||||||||||||||||
| Performance | Value
of Initial Fixed $100 Investment Based on: |
|||||||||||||||||
| Year | Summary Compensation Table Total ($) |
Compensation Actually Paid to CEO ($) |
Average Summary Compensation Table Total for Non-CEO NEOs ($) |
Average Compensation Actually Paid to Non-CEO NEOs ($) |
KMB TSR ($) |
S&P
500 Consumer Staples Index TSR ($) |
Net Income ($ Millions) |
Annual Organic Sales Growth % | ||||||||||
| (a) | (b) | (c) | (d) | (e) | (f) | (g) | (h) | (i) | ||||||||||
| 2022 | 14,555,561 | 23,441,071 | 5,504,660 | 7,301,881 | 108.96 | 130.57 | 1,934 | 7.2% | ||||||||||
| 2021 | 12,009,162 | 3,318,480 | 4,589,273 | 2,631,289 | 110.71 | 131.38 | 1,814 | (1.0)% | ||||||||||
| 2020 | 13,465,320 | 21,472,501 | 5,323,497 | 7,005,404 | 100.95 | 110.75 | 2,352 | 5.8% | ||||||||||
2020: Maria Henry, Russell Torres, Kimberly Underhill, Sandi Karrmann, Achal Agarwal
2021: Maria Henry, Russell Torres, Kimberly Underhill, Jeffrey Melucci, Gonzalo Uribe
2022: Maria Henry, Russell Torres, Jeffrey Melucci, Zack Hicks, Nelson Urdaneta
| Year | 2020 | 2021 | 2022 | ||||
| CEO | M. Hsu | M. Hsu | M. Hsu | ||||
| SCT Total Compensation ($) | 13,465,320 | 12,009,162 | 14,555,561 | ||||
| Less: Stock and Option Award Values Reported in SCT for the Covered Year ($) | (8,295,595) | (8,718,459) | (10,642,721) | ||||
| Plus: Fair Value for Stock and Option Awards Granted in the Covered Year ($) | 11,826,913 | 8,382,943 | 14,718,722 | ||||
| Change in Fair Value of Outstanding Unvested Stock and Option Awards from Prior Years ($) | 4,214,127 | (8,419,164) | 3,903,231 | ||||
| Change in Fair Value of Stock and Option Awards from Prior Years that Vested in the Covered Year ($) | 261,736 | 63,998 | 906,277 | ||||
| Less: Fair Value of Stock and Option Awards Forfeited during the Covered Year ($) | |||||||
| Less: Aggregate Change in Actuarial Present Value of Accumulated Benefit Under Pension Plans ($) | |||||||
| Plus: Aggregate Service Cost and Prior Service Cost for Pension Plans ($) | |||||||
| Compensation Actually Paid ($) | 21,472,501 | 3,318,480 | 23,441,071 |
|
Equity Valuations: Stock option grant date fair values are calculated based on the Black-Scholes option pricing model as of date of grant. Adjustments have been made using stock option fair values as of each measurement date using the stock price as of the measurement date and updated assumptions (i.e., term, volatility, dividend yield, risk free rates) as of the measurement date. Performance-based restricted share unit grant date fair values are calculated using the stock price as of date of grant assuming target performance. Adjustments have been made using the stock price and performance accrual modifier as of year end and as of the date of vest. Time-vested restricted share unit grant date fair values are calculated using the stock price as of date of grant. Adjustments have been made using the stock price as of year end and as of each date of vest. Column (d). The following non-CEO named executive officers are included in the average figures shown: 2020: Maria Henry, Russell Torres, Kimberly Underhill, Sandi Karrmann, Achal Agarwal 2021: Maria Henry, Russell Torres, Kimberly Underhill, Jeffrey Melucci, Gonzalo Uribe 2022: Maria Henry, Russell Torres, Jeffrey Melucci, Zack Hicks, Nelson Urdaneta Column (e). Average “compensation actually paid” for our non-CEO NEOs in each of 2022, 2021 and 2020 reflects the respective amounts set forth in column (d) of the table above, adjusted as set forth in the table below, as determined in accordance with SEC rules. For awards with dividend rights, these amounts are paid in company shares once the underlying award vests, and are incorporated as applicable in the table below. The dollar amounts reflected in column (d) of the table above do not reflect the actual amount of compensation earned by or paid to our non-CEO NEOs during the applicable year. For information regarding the decisions made by our Management Development and Compensation Committee in regards to the non-CEO NEOs’ compensation for each fiscal year, please see the Compensation Discussion and Analysis sections of the proxy statements reporting pay for the fiscal years covered in the table above. |
| Year | 2020 Average |
2021 Average |
2022 Average | ||||
| Non-CEO NEOs | See Column (d) note | See Column (d) note | See Column (d) note | ||||
| SCT Total Compensation ($) | 5,323,497 | 4,589,273 | 5,504,660 | ||||
| Less: Stock and Option Award Values Reported in SCT for the Covered Year ($) | (3,158,001) | (2,620,119) | (3,907,465) | ||||
| Plus: Fair Value for Stock and Option Awards Granted in the Covered Year ($) | 3,930,637 | 2,449,067 | 4,993,684 | ||||
| Change in Fair Value of Outstanding Unvested Stock and Option Awards from Prior Years ($) | 867,189 | (1,945,987) | 581,290 | ||||
| Change in Fair Value of Stock and Option Awards from Prior Years that Vested in the Covered Year ($) | 68,546 | 159,055 | 129,711 | ||||
| Less: Fair Value of Stock and Option Awards Forfeited during the Covered Year ($) | |||||||
| Less: Aggregate Change in Actuarial Present Value of Accumulated Benefit Under Pension Plans ($) | (26,465) | ||||||
| Plus: Aggregate Service Cost and Prior Service Cost for Pension Plans ($) | |||||||
| Compensation Actually Paid ($) | 7,005,404 | 2,631,289 | 7,301,881 |
|
Equity Valuations: Stock option grant date fair values are calculated based on the Black-Scholes option pricing model as of date of grant. Adjustments have been made using stock option fair values as of each measurement date using the stock price as of the measurement date and updated assumptions (i.e., term, volatility, dividend yield, risk free rates) as of the measurement date. Performance-based restricted share unit grant date fair values are calculated using the stock price as of date of grant assuming target performance. Adjustments have been made using the stock price and performance accrual modifier as of year end and as of the date of vest. Time-based restricted share unit grant date fair values are calculated using the stock price as of date of grant. Adjustments have been made using the stock price as of year end and as of each date of vest. The aggregate change in actuarial present value of accumulated benefit under pension plans reflects the amount reported for the applicable year in the Summary Compensation Table. Column (f). For the relevant fiscal year, represents the cumulative total shareholder return (TSR) of Kimberly-Clark for the measurement periods ending on December 31 of each of 2022, 2021 and 2020, respectively. Column (g). For the relevant fiscal year, represents the cumulative TSR of the S&P 500 Consumer Staples Index ("Peer Group TSR") for the measurement periods ending on December 31 of each of 2022, 2021 and 2020, respectively. Column (h). Reflects “Net Income” in the company’s Consolidated Income Statements included in the Company’s Annual Reports on Form 10-K for each of the years ended December 31, 2022, 2021 and 2020. Column (i). Company-selected Measure is annual organic sales growth which is described below. |
|
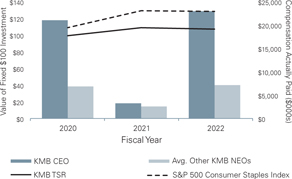
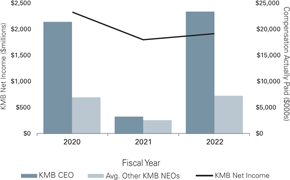
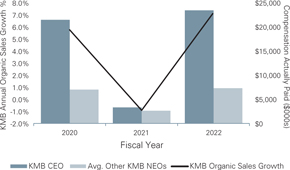
Relationship between Pay and Performance. Below are graphs showing the relationship of “compensation actually paid” to our Chief Executive Officer and other named executive officers in 2020, 2021 and 2022 to (1) TSR of both Kimberly-Clark and the S&P 500 Consumer Staples Index, (2) Kimberly-Clark’s net income and (3) Kimberly-Clark’s organic sales growth. “Compensation actually paid” (“CAP”), as required under SEC rules, reflects adjusted values to unvested and vested equity awards during the years shown in the table based on year-end stock prices, various accounting valuation assumptions, and projected performance modifiers but does not reflect actual amounts paid out for those awards. CAP generally fluctuates due to stock price achievement and varying levels of projected and actual achievement of performance goals (as reflected in the significant decrease to 2021 CAP). For a discussion of how our Management Development and Compensation Committee assessed Kimberly-Clark’s performance and our named executive officers’ pay each year, see “Compensation Discussion and Analysis” in this proxy statement and in the proxy statements for 2020 and 2021. | |
|
|
Compensation Actually Paid vs. KMB Net Income
| ||
|
Compensation Actually Paid vs. KMB Annual Organic
|
| Listed below are the financial and non-financial performance measures which in our assessment represent the most important financial performance measures we use to link compensation actually paid to our named executive officers, for 2022, to company performance. |
Equity Valuations: Stock option grant date fair values are calculated based on the Black-Scholes option pricing model as of date of grant. Adjustments have been made using stock option fair values as of each measurement date using the stock price as of the measurement date and updated assumptions (i.e., term, volatility, dividend yield, risk free rates) as of the measurement date. Performance-based restricted share unit grant date fair values are calculated using the stock price as of date of grant assuming target performance. Adjustments have been made using the stock price and performance accrual modifier as of year end and as of the date of vest. Time-based restricted share unit grant date fair values are calculated using the stock price as of date of grant. Adjustments have been made using the stock price as of year end and as of each date of vest. The aggregate change in actuarial present value of accumulated benefit under pension plans reflects the amount reported for the applicable year in the Summary Compensation Table.
Sales Growth %
| Measure | Nature | Explanation | |||
| Organic sales growth | Financial measure | Sales growth generated from within the company and excluding the impact of currency changes, business exits and acquisition/divestiture activity. | |||
| Modified free cash flow | Financial measure | A non-GAAP financial measure that consists of diluted net income per share that is then adjusted to eliminate the effect of items or events that the Committee determines in its discretion should be excluded for compensation purposes. | |||
| Net sales | Financial measure | Net sales for 2022. | |||
| Adjusted EPS | Financial measure | A non-GAAP financial measure that consists of diluted net income per share that is then adjusted to eliminate the effect of items or events that the Committee determines in its discretion should be excluded for compensation purposes. | |||
| Brand equity and market performance | Non-financial measure | Increasing market share in select markets. | |||
| Inclusion, equity and diversity | Non-financial measure | Making progress on goals for women in senior roles globally and ethnic minorities in senior roles in the United States. |