Exhibit 99.1

Report to Shareholders for the First Quarter, www.cibc.com February 24, 2023 |
Report of the President and Chief Executive Officer
Overview of results
CIBC today announced its financial results for the first quarter ended January 31, 2023.
First quarter highlights
Q1/23 |
Q1/22 |
Q4/22 |
YoY Variance |
QoQ Variance |
||||||||||||||||||||||||||
Revenue |
$5,927 million | $5,498 million | $5,388 million | +8% | +10% | |||||||||||||||||||||||||
Reported Net Income |
$432 million | $1,869 million | $1,185 million | -77% | -64% | |||||||||||||||||||||||||
Adjusted Net Income (1) |
$1,841 million | $1,894 million | $1,308 million | -3% | +41% | |||||||||||||||||||||||||
Adjusted pre-provision, pre-tax earnings (1) |
$2,660 million | $2,508 million | $2,072 million | +6% | +28% | |||||||||||||||||||||||||
Reported Diluted Earnings Per Share (EPS) (2) |
$0.39 | $2.01 | $1.26 | -81% | -69% | |||||||||||||||||||||||||
Adjusted Diluted EPS (1)(2) |
$1.94 | $2.04 | $1.39 | -5% | +40% | |||||||||||||||||||||||||
Reported Return on Common Shareholders’ Equity (ROE) (3) |
3.1% | 17.4% | 10.1% | |||||||||||||||||||||||||||
Adjusted ROE (1) |
15.5% | 17.6% | 11.2% | |||||||||||||||||||||||||||
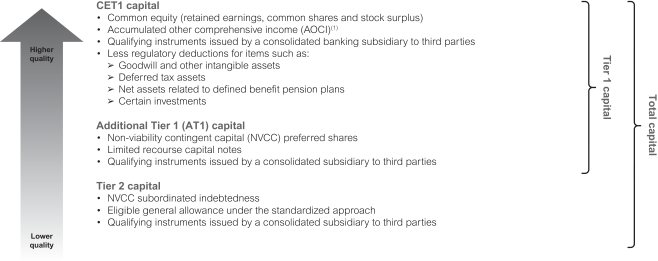
Common Equity Tier 1 (CET1) Ratio (4) |
11.6% | 12.2% | 11.7% |
Results for the first quarter of 2023 were affected by the following items of note aggregating to a negative impact of $1.55 per share:
| • | $1,169 million ($844 million after-tax) increase in legal provisions (Corporate and Other); |
| • | $545 million income tax charge related to the 2022 Canadian Federal budget (5) (Corporate and Other); and |
| • | $26 million ($20 million after-tax) amortization of acquisition-related intangible assets. |
Our CET1 ratio
(4)
was 11.6% at January 31, 2023, compared with 11.7% at the end of the prior quarter. CIBC’s leverage ratio(4)
and liquidity coverage ratio(4)
at January 31, 2023 were 4.3% and 134%, respectively. In the first quarter, we delivered solid financial results as we continued to make steady progress in executing our client-focused strategy. In an economic environment that remains fluid, our team is focused on living our purpose as we help make our clients’ ambitions real. We have clear momentum in attracting and deepening client relationships, a resilient capital position, and strong risk management and credit quality, and we’ll draw on these strengths throughout fiscal 2023 to create further value for our stakeholders.
Core business performance
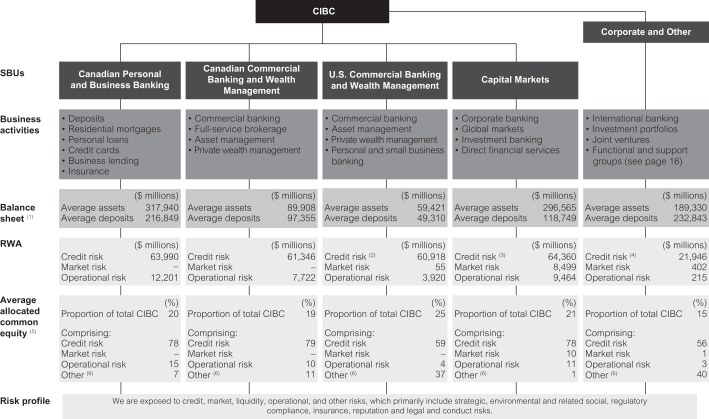
Canadian Personal and Business Banking
reported net income of $589 million for the first quarter, down $98 million or 14% from the first quarter a year ago, primarily due to higher non-interest expenses and a higher provision for credit losses, partially offset by higher revenue. Adjusted
pre-provision,
pre-tax
earnings(1)
were $977 million, down $67 million from the first quarter a year ago, as higher revenues were more than offset by higher expenses. Higher revenues were driven by volume growth, partially offset by lower fee and commission income, and lower net product spreads. Expenses were higher due to spending on strategic initiatives, including the Canadian Costco credit card portfolio, and employee-related compensation. Canadian Commercial Banking and Wealth Management
reported net income of $469 million for the first quarter, up $7 million or 2% from the first quarter a year ago, primarily due to higher revenue and lower non-interest expenses, partially offset by a higher provision for credit losses in the current quarter. Adjusted
pre-provision,
pre-tax
earnings(1)
were $686 million, up $62 million from the first quarter a year ago, primarily due to higher net interest income from higher deposit spreads that benefitted from the impact of higher interest rates, and volume growth in commercial banking. Lower expenses were primarily driven by lower performance-based compensation, partially offset by higher spending on strategic initiatives. | (1) | This measure is a non-GAAP measure. For additional information, see the “Non-GAAP measures” section, which section is incorporated by reference herein, including the quantitative reconciliations therein of reported GAAP measures to: adjusted net income on pages 8 to 10; and adjusted pre-provision, pre-tax earnings on page 10. |
| (2) | CIBC completed a two-for-one |
| (3) | For additional information on the composition, see the “Glossary” section. |
| (4) | Our capital ratios are calculated pursuant to the Office of the Superintendent of Financial Institution’s (OSFI’s) Capital Adequacy Requirements (CAR) Guideline and the leverage ratio is calculated pursuant to OSFI’s Leverage Requirements Guideline, all of which are based on the Basel Committee on Banking Supervision (BCBS) standards. For additional information, see the “Capital management” and “Liquidity risk” sections. |
| (5) | The income tax charge is comprised of $510 million for the present value of the estimated amount of the Canada Recovery Dividend (CRD) tax of $555 million, and a charge of $35 million related to the fiscal 2022 impact of the 1.5% increase in the tax rate applied to taxable income of certain bank and insurance entities in excess of $100 million for periods after April 2022. The discount of $45 million on the CRD tax will accrete over the remaining four-year payment period. |