| | | | | |
Q4 2022 Supplemental Financial Report | |

Table of Contents
This Supplemental Financial Report contains "forward-looking statements" within the meaning of Section 27A of the Securities Act of 1933, as amended, and Section 21E of the Securities Exchange Act of 1934, as amended. These statements include, among other things, information concerning lease expirations, debt maturities, potential investments, development and redevelopment activity, projected construction costs, dispositions and other forward-looking financial data. In some instances, forward-looking statements can be identified by the use of forward-looking terminology such as “expect,” “future,” “will,” “would,” “pursue,” or “project” and variations of such words and similar expressions that do not relate to historical matters. Forward-looking statements are based on Kilroy Realty Corporation’s current expectations, beliefs and assumptions, and are not guarantees of future performance. Forward-looking statements are inherently subject to uncertainties, risks, changes in circumstances, trends and factors that are difficult to predict, many of which are outside of Kilroy Realty Corporation’s control. Accordingly, actual performance, results and events may vary materially from those indicated or implied in the forward-looking statements, and you should not rely on the forward-looking statements as predictions of future performance, results or events. Numerous factors could cause actual future performance, results and events to differ materially from those indicated in the forward-looking statements, including, among others: global market and general economic conditions, including periods of heightened inflation, and their effect on our liquidity and financial conditions and those of our tenants; adverse economic or real estate conditions generally, and specifically, in the States of California, Texas and Washington; risks associated with our investment in real estate assets, which are illiquid, and with trends in the real estate industry; defaults on or non-renewal of leases by tenants; any significant downturn in tenants’ businesses; our ability to re-lease property at or above current market rates; costs to comply with government regulations, including environmental remediation; the availability of cash for distribution and debt service and exposure to risk of default under debt obligations; increases in interest rates and our ability to manage interest rate exposure; the availability of financing on attractive terms or at all, which may adversely impact our future interest expense and our ability to pursue development, redevelopment and acquisition opportunities and refinance existing debt; a decline in real estate asset valuations, which may limit our ability to dispose of assets at attractive prices or obtain or maintain debt financing, and which may result in write-offs or impairment charges; significant competition, which may decrease the occupancy and rental rates of properties; potential losses that may not be covered by insurance; the ability to successfully complete acquisitions and dispositions on announced terms; the ability to successfully operate acquired, developed and redeveloped properties; the ability to successfully complete development and redevelopment projects on schedule and within budgeted amounts; delays or refusals in obtaining all necessary zoning, land use and other required entitlements, governmental permits and authorizations for our development and redevelopment properties; increases in anticipated capital expenditures, tenant improvement and/or leasing costs; defaults on leases for land on which some of our properties are located; adverse changes to, or enactment or implementations of, tax laws or other applicable laws, regulations or legislation, as well as business and consumer reactions to such changes; risks associated with joint venture investments, including our lack of sole decision-making authority, our reliance on co-venturers' financial condition and disputes between us and our co-venturers; environmental uncertainties and risks related to natural disasters; our ability to maintain our status as a REIT; and uncertainties regarding the impact of the COVID-19 pandemic, and restrictions intended to prevent its spread, on our business and the economy generally. These factors are not exhaustive and additional factors could adversely affect our business and financial performance. For a discussion of additional factors that could materially adversely affect Kilroy Realty Corporation’s business and financial performance, see the factors included under the caption “Risk Factors” in Kilroy Realty Corporation’s quarterly report on Form 10-Q for the period ended September 30, 2022 and in its annual report on Form 10-K for the year ended December 31, 2021, and its other filings with the Securities and Exchange Commission. All forward-looking statements are based on currently available information and speak only as of the dates on which they are made. Kilroy Realty Corporation assumes no obligation to update any forward-looking statement made in this Supplemental Financial Report that becomes untrue because of subsequent events, new information or otherwise, except to the extent we are required to do so in connection with our ongoing requirements under federal securities laws.
Pictured on cover page, in order of appearance: Indeed Tower, Austin, TX | Santa Fe Summit, San Diego, CA | 201 Third, San Francisco, CA
01
Corporate Data and Financial Highlights
–Company Background
–Executive Summary
–Financial Highlights
–Market Capitalization and Common Stock Data
–Net Income Available to Common Stockholders / FFO Guidance and Outlook
–Consolidated Balance Sheets
–Consolidated Statements of Operations
–Funds From Operations and Funds Available for Distribution
–Net Operating Income
| | | | | |
Q4 2022 Supplemental Financial Report | |
Company Background
Kilroy Realty Corporation (NYSE: KRC), a publicly traded real estate investment trust and member of the S&P MidCap 400 Index, is a leading U.S. landlord and developer, with operations in San Diego, Greater Los Angeles, the San Francisco Bay Area, Greater Seattle and Austin, Texas. The Company has over seven decades of experience developing, acquiring and managing office, life science and mixed-use real estate assets. At December 31, 2022, the Company’s stabilized portfolio totaled approximately 16.2 million square feet of primarily office and life science space that was 91.6% occupied and 92.9% leased. The Company also has 1,001 residential units in the Los Angeles and San Diego regions, which had an average occupancy of 93.3% for the quarter ended December 31, 2022.
| | | | | | | | | | | | | | | | | | | | |
| Board of Directors | | Executive and Senior Management Team | | Investor Relations |
| John Kilroy | Chairman | | John Kilroy | Chief Executive Officer | | 12200 W. Olympic Blvd., Suite 200
Los Angeles, CA 90064
(310) 481-8400
Web: www.kilroyrealty.com
E-mail: investorrelations@kilroyrealty.com |
| Edward F. Brennan, PhD | Lead Independent | | Tyler H. Rose | President (departing March 1, 2023) | |
| Jolie Hunt | | | Justin W. Smart | President, Development and Construction (incoming President, March 1, 2023) | |
| Scott S. Ingraham | | | | |
| Louisa G. Ritter | | | Robert Paratte | Executive VP, Chief Leasing Officer and Senior Advisor to the Chairman | |
| Gary R. Stevenson | | | | | Bill Hutcheson |
| Peter B. Stoneberg | | | Heidi R. Roth | Executive VP, Chief Administrative Officer | | Senior VP, Investor Relations & Capital Markets |
| | | John Osmond | Executive VP, Head of Asset Management | | |
| | | Eliott Trencher | Executive VP, Chief Investment Officer,
Interim Chief Financial Officer | | |
| | | Merryl Werber | Senior VP, Chief Accounting Officer and Controller | | |
| | | | | | | | | | | | | | |
| Equity Research Coverage |
| | | | |
| BofA Securities | | | Jefferies LLC | |
| Camille Bonnel | (416) 369-2140 | | Peter Abramowitz | (212) 336-7241 |
| BMO Capital Markets Corp. | | | J.P. Morgan | |
| John P. Kim | (212) 885-4115 | | Anthony Paolone | (212) 622-6682 |
| BTIG | | | Mizuho Securities USA LLC | |
| Thomas Catherwood | (212) 738-6140 | | Vikram Malhotra | (212) 282-3827 |
| Citigroup Investment Research | | | RBC Capital Markets | |
| Michael Griffin | (212) 816-5871 | | Mike Carroll | (440) 715-2649 |
| Credit Suisse | | | Robert W. Baird & Co. | |
| Tayo Okusanya | (212) 325-1402 | | David B. Rodgers | (216) 737-7341 |
| Deutsche Bank Securities, Inc. | | | Scotiabank | |
| Derek Johnston | (210) 250-5683 | | Nicholas Yulico | (212) 225-6904 |
| Evercore ISI | | | Wells Fargo | |
| Steve Sakwa | (212) 446-9462 | | Blaine Heck | (443) 263-6529 |
| Goldman Sachs & Co. LLC | | | Wolfe Research | |
| Caitlin Burrows | (212) 902-4736 | | Andrew Rosivach | (646) 582-9250 |
| Green Street Advisors | | | | |
| Dylan Burzinski | (949) 640-8780 | | | |
Kilroy Realty Corporation is followed by the analysts listed above. Please note that any opinions, estimates or forecasts regarding Kilroy Realty Corporation’s performance made by these analysts are theirs alone and do not represent opinions, forecasts or predictions of Kilroy Realty Corporation or its management. Kilroy Realty Corporation does not by its reference above or distribution imply its endorsement of or concurrence with such information, conclusions or recommendations.
| | | | | |
Q4 2022 Supplemental Financial Report | |
Executive Summary
| | | | | | | | |
| | |
| Quarterly Financial Highlights | | Quarterly Operating Highlights |
| | |
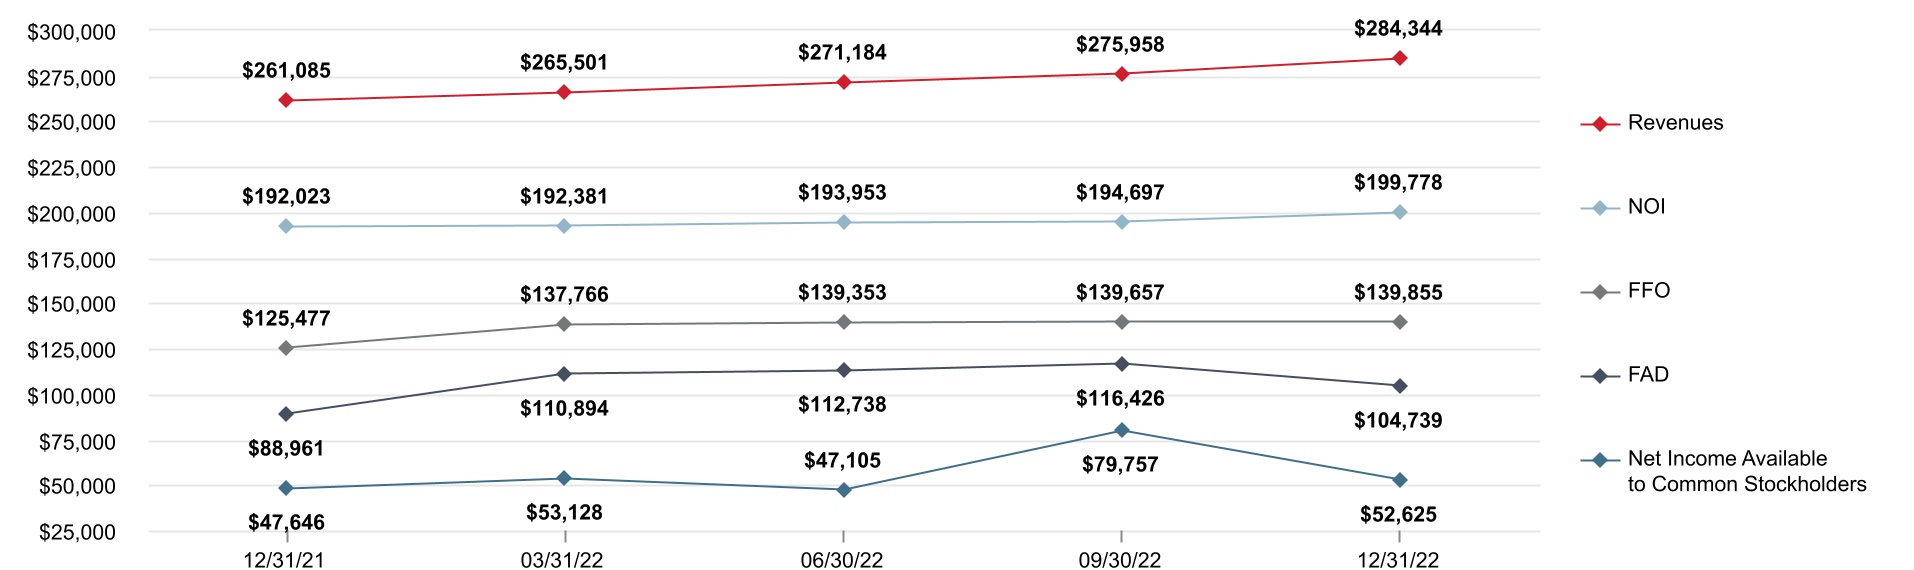
• Revenues grew approximately 8.9% to $284.3 million compared to the prior year | | • Stabilized portfolio was 91.6% occupied and 92.9% leased at quarter-end |
| | |
• Net income available to common stockholders per diluted share of $0.45, an | | • Approximately 716,000 square feet of leases commenced in the stabilized and |
| increase of approximately 12.5% compared to the prior year | | development portfolios |
| | |
• FFO per diluted share of $1.17, an increase of approximately 11.4% compared to | | • Approximately 328,000 square feet of leases executed, including approximately |
| the prior year | | 102,000 square feet in the development portfolio |
| | |
• Same Store NOI and Same Store Cash NOI decreased 2.1% and 0.7%, | | ◦GAAP rents increased approximately 31.1% from prior levels |
| respectively, compared to the prior year | | |
| | ◦Cash rents increased approximately 12.3% from prior levels |
◦Prior year Same Store NOI and Same Store Cash NOI includes $4.6 million | | |
| and $6.4 million of non-recurring items, respectively | | |
| | | |
| | |
| | |
| | |
| | |
| | |
| | |
| | |
| Capital Markets Highlights | | Strategic Highlights |
| | |
| • As of the date of this report, approximately $1.7 billion of total liquidity comprised | | • Commenced GAAP revenue recognition on the entirety of the approximately |
| of approximately $290.0 million of cash and cash equivalents, $300.0 million | | 308,000 square foot space leased by Indeed, Inc. at our Indeed Tower |
| available under the new unsecured term loan facility and full availability under the | | development project in Austin |
| $1.1 billion unsecured revolving credit facility | | |
| | • Commenced construction on the life science redevelopment of 4400 Bohannon |
• As previously disclosed in October, the Company entered into a term loan | | Drive, an approximately 48,000 square foot operating property in the San Francisco |
| agreement that provides for a $400.0 million unsecured delayed draw term loan | | Bay Area's Menlo Park submarket |
| facility with an additional $100.0 million accordion feature | | |
| | |
◦In January, the Company amended the term loan agreement to exercise | | |
the accordion feature for borrowings of up to $500.0 million, under which | | |
$200.0 million has been drawn | | |
| | |
| | |
| | |
| | |
| | |
| | |
| | |
| | |
| | |
| | |
| | |
________________________
Note: Definitions for commonly used terms in this Supplemental Financial Report are on pages 38-39 “Definitions Included in Supplemental.”
| | | | | |
Q4 2022 Supplemental Financial Report | |
Financial Highlights
(unaudited, $ in thousands, except per share amounts)
| | | | | | | | | | | | | | | | | | | | | | | | | | | | | | | | | | | |
| | Three Months Ended | |
| | 12/31/2021 (1) | | 3/31/2022 | | 6/30/2022 | | 9/30/2022 (1) | | 12/31/2022 | |
| | | | | | | | | | | |
| INCOME ITEMS: | | | | | | | | | | |
| Capitalized Interest and Debt Costs | $ | 21,773 | | | $ | 19,098 | | | $ | 19,491 | | | $ | 19,677 | | | $ | 19,216 | | |
| Cash Lease Termination Fees (2) | $ | 2,139 | | | $ | 637 | | | $ | 374 | | | $ | 165 | | | $ | 503 | | |
| | | | | | | | | | | |
| | | | | | | | | | | |
| | | | | | | | | | | |
| Net Income Available to Common Stockholders per common share – diluted (3) | $ | 0.40 | | | $ | 0.45 | | | $ | 0.40 | | | $ | 0.68 | | | $ | 0.45 | | |
| Funds From Operations per common share – diluted (4) | $ | 1.05 | | | $ | 1.16 | | | $ | 1.17 | | | $ | 1.17 | | | $ | 1.17 | | |
| EBITDA, as adjusted (5) | $ | 168,110 | | | $ | 168,668 | | | $ | 170,511 | | | $ | 170,453 | | | $ | 174,421 | | |
| RATIOS: | | | | | | | | | | |
| Net Operating Income Margins | 73.5 | % | | 72.5 | % | | 71.5 | % | | 70.6 | % | | 70.3 | % | |
| Fixed Charge Coverage Ratio - Net Income | 1.4x | | 1.6x | | 1.4x | | 2.3x | | 1.5x | |
| Fixed Charge Coverage Ratio - EBITDA | 4.4x | | 4.5x | | 4.6x | | 4.5x | | 4.4x | |
| Net Income Payout Ratio | 110.9 | % | | 103.2 | % | | 113.7 | % | | 73.5 | % | | 107.2 | % | |
| FFO Payout Ratio | 48.7 | % | | 44.5 | % | | 44.0 | % | | 45.6 | % | | 45.6 | % | |
| FAD Payout Ratio | 68.7 | % | | 55.3 | % | | 54.4 | % | | 54.7 | % | | 60.9 | % | |
|
______________________________________________________
Note: Definitions for commonly used terms in this Supplemental Financial Report are on pages 38-39 “Definitions Included in Supplemental.”
(1)Net Income Available to Common Stockholders also includes $17.3 million and $5.3 million of gains on sale of depreciable operating properties for the three months ended September 30, 2022 and December 31, 2021, respectively.
(2)Represents cash receipts of lease termination fees in the period they are received, which may not correspond to the timing of GAAP revenue recognition of the lease termination fee over the remaining term of the lease.
(3)Reported amounts are attributable to common stockholders, common unitholders and restricted stock unitholders.
(4)Please refer to page 8 for reconciliations of GAAP Net Income Available to Common Stockholders to Funds From Operations available to common stockholders and unitholders and Funds Available for Distribution to common stockholders and unitholders and page 9 for a reconciliation of GAAP Net Cash Provided by Operating Activities to Funds Available for Distribution to common stockholders and unitholders.
(5)Please refer to pages 40-41 for reconciliations of GAAP Net Income Available to Common Stockholders to Net Operating Income and EBITDA, as adjusted. The Company’s calculation of EBITDA, as adjusted, is the same as EBITDAre, as defined by Nareit, as the Company does not have any unconsolidated joint ventures.
| | | | | |
Q4 2022 Supplemental Financial Report | |
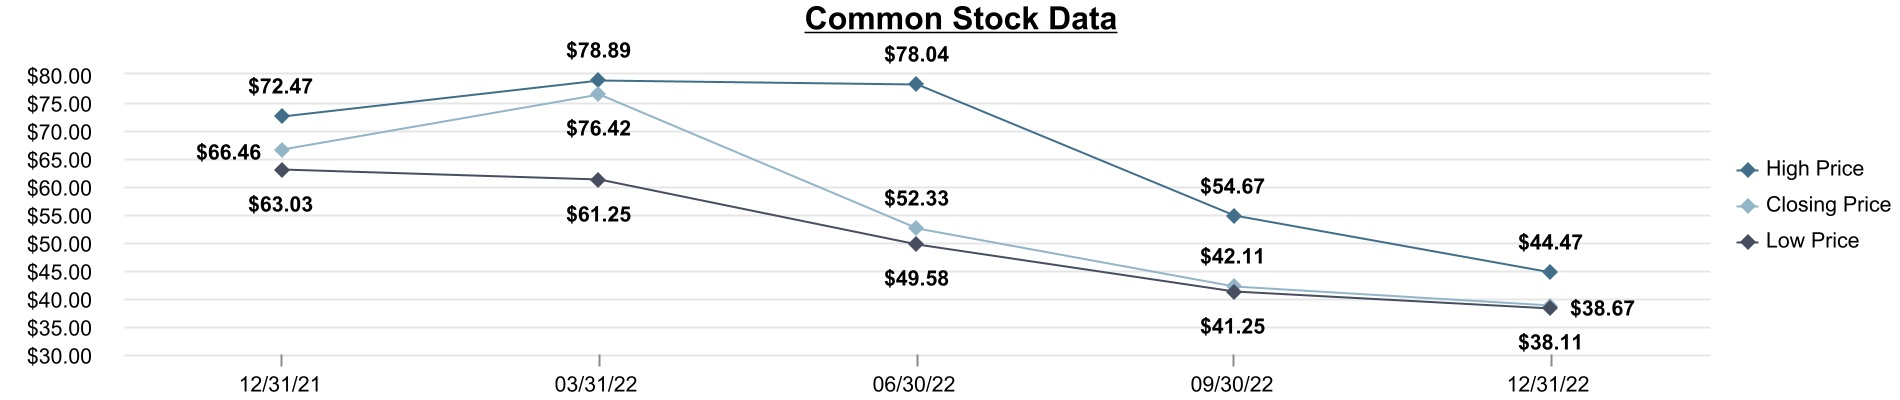
Market Capitalization and Common Stock Data
(unaudited, $ and shares/units in thousands, except per share amounts)
Market Capitalization (1)
| | | | | | | | | | | | | | | | | | | | | | | | | | | | | | | | | | | | | | |
Dividends per common share (2) | $ | 0.52 | | | $ | 0.52 | | | $ | 0.52 | | | $ | 0.54 | | | | $ | 0.54 | | | |
Closing common shares (3) | 116,464 | | 116,716 | | 116,871 | | 116,877 | | | 116,878 | | |
Closing common partnership units (3) | 1,151 | | 1,151 | | 1,151 | | 1,151 | | | 1,151 | | |
| 117,615 | | 117,867 | | 118,022 | | 118,028 | | | 118,029 | | |
| | | | | | | | | | | | |
| | | | | | | | | | | | |
| | | | | | | | | | | | |
| | | | | | | | | | | | |
| | | | | | | | | | | | |
| | | | | | | | | | | | |
| | | | | | | | | | | | |
| | | | | | | | | | | | |
| | | | | | | | | | | | |
| | | | | | | | | | | | |
______________________________________________________
(1)Please refer to page 31 for additional information regarding our capital structure.
(2)Reported amounts are attributable to common stockholders, common unitholders and restricted stock unitholders.
(3)As of the end of the period.
| | | | | |
Q4 2022 Supplemental Financial Report | |
Net Income Available to Common Stockholders / FFO Guidance and Outlook
(unaudited, $ and shares/units in thousands, except per share amounts)
The Company is providing a guidance range of Nareit-defined FFO per diluted share for its fiscal year 2023 of $4.40 to $4.60 per share with a midpoint of $4.50 per share.
| | | | | | | | | | | | | | | | | | | | |
| | | Full Year 2023 Range | |
| | | Low End | | High End | |
| Net income available to common stockholders per share - diluted | | $ | 1.85 | | | $ | 2.03 | | |
| | | | | | |
| Weighted average common shares outstanding - diluted (1) | | 117,500 | | | 117,500 | | |
| | | | | | |
| Net income available to common stockholders | | $ | 217,000 | | | $ | 239,000 | | |
| Adjustments: | | | | | |
| Net income attributable to noncontrolling common units of the Operating Partnership | | 2,600 | | | 3,100 | | |
| Net income attributable to noncontrolling interests in consolidated property partnerships | | 24,000 | | | 26,000 | | |
| Depreciation and amortization of real estate assets | | 316,000 | | | 316,000 | | |
| Gains on sales of depreciable real estate | | — | | | — | | |
| Funds From Operations attributable to noncontrolling interests in consolidated property partnerships | | (35,000) | | | (36,000) | | |
| Funds From Operations (2) | | $ | 524,600 | | | $ | 548,100 | | |
| | | | | | |
| Weighted average common shares and units outstanding - diluted (3) | | 119,100 | | | 119,100 | | |
| | | | | | |
| FFO per common share/unit - diluted (3) | | $ | 4.40 | | | $ | 4.60 | | |
| | | | | | |
| | | | | | | | | | | | | | | | | | | | |
| | | | | | |
| Key Assumptions | | 2022 Actuals | | 2023 Assumptions | |
| Same Store Cash NOI growth (2) | | 7.0% | | 0.0% to 2.0% | |
| Average occupancy | | 91.2% | | 86.5% to 88.0% | |
| Total development spending | | $345 million | | $450 million to $550 million | |
| Dispositions | | $48 million | | $0 to $200 million | |
| | | | | | |
________________________
(1)Calculated based on estimated weighted average shares outstanding including non-participating share-based awards.
(2)See pages 35-36 for Management Statements on Funds From Operations and Same Store Cash Net Operating Income.
(3)Calculated based on weighted average shares outstanding including participating and non-participating share-based awards, dilutive impact of contingently issuable shares, and assuming the exchange of all common limited partnership units outstanding. Reported amounts are attributable to common stockholders, common unitholders and restricted stock unitholders.
The Company’s guidance estimates for the full year 2023, and the reconciliation of net income available to common stockholders per share - diluted and FFO per share and unit - diluted included within this report, reflect management’s views on current and future market conditions, including assumptions with respect to rental rates, occupancy levels, and the earnings impact of the events referenced in this report. Although these guidance estimates reflect the impact on the Company’s operating results of an assumed range of future disposition activity, these guidance estimates do not include any estimates of possible future gains or losses from possible future dispositions because the magnitude of gains or losses on sales of depreciable operating properties, if any, will depend on the sales price and depreciated cost basis of the disposed assets at the time of disposition, information that is not known at the time the Company provides guidance, and the timing of any gain recognition will depend on the closing of the dispositions, information that is also not known at the time the Company provides guidance and may occur after the relevant guidance period. We caution you not to place undue reliance on our assumed range of future disposition activity because any potential future disposition transactions will ultimately depend on the market conditions and other factors, including but not limited to the Company’s capital needs, the particular assets being sold and the Company’s ability to defer some or all of the taxable gain on the sales. These guidance estimates also do not include the impact on operating results from potential future acquisitions, possible capital markets activity, possible future impairment charges or any events outside of the Company’s control. There can be no assurance that the Company’s actual results will not differ materially from these estimates.
| | | | | |
Q4 2022 Supplemental Financial Report | |
Consolidated Balance Sheets
(unaudited, $ in thousands)
| | | | | | | | | | | | | | | | | | | | | | | | | | | | | | | | | | | |
| | 12/31/2022 | | 9/30/2022 | | 6/30/2022 | | 3/31/2022 | | 12/31/2021 | |
| | | | | | | | | | | |
| ASSETS: | | | | | | | | | | |
| Land and improvements | $ | 1,738,242 | | | $ | 1,743,194 | | | $ | 1,713,152 | | | $ | 1,715,192 | | | $ | 1,731,982 | | |
| Buildings and improvements | 8,302,081 | | | 7,693,247 | | | 7,530,547 | | | 7,509,311 | | | 7,543,585 | | |
| Undeveloped land and construction in progress | 1,691,860 | | | 2,183,071 | | | 2,272,508 | | | 2,158,279 | | | 2,017,126 | | |
| Total real estate assets held for investment | 11,732,183 | | | 11,619,512 | | | 11,516,207 | | | 11,382,782 | | | 11,292,693 | | |
| Accumulated depreciation and amortization | (2,218,710) | | | (2,150,060) | | | (2,104,990) | | | (2,034,193) | | | (2,003,656) | | |
| Total real estate assets held for investment, net | 9,513,473 | | | 9,469,452 | | | 9,411,217 | | | 9,348,589 | | | 9,289,037 | | |
| | | | | | | | | | | |
| Cash and cash equivalents | 347,379 | | | 249,981 | | | 210,044 | | | 331,685 | | | 414,077 | | |
| Restricted cash | — | | | 13,009 | | | 13,008 | | | 13,007 | | | 13,006 | | |
| Marketable securities | 23,547 | | | 22,390 | | | 22,988 | | | 25,829 | | | 27,475 | | |
| Current receivables, net | 20,583 | | | 15,885 | | | 13,268 | | | 12,107 | | | 14,386 | | |
| Deferred rent receivables, net | 452,200 | | | 442,987 | | | 435,549 | | | 420,895 | | | 405,665 | | |
| Deferred leasing costs and acquisition-related intangible assets, net | 250,846 | | | 214,484 | | | 217,026 | | | 228,426 | | | 234,458 | | |
| Right of use ground lease assets | 126,530 | | | 126,708 | | | 126,587 | | | 126,946 | | | 127,302 | | |
| Prepaid expenses and other assets, net | 62,429 | | | 65,096 | | | 65,554 | | | 57,338 | | | 57,991 | | |
| TOTAL ASSETS | $ | 10,796,987 | | | $ | 10,619,992 | | | $ | 10,515,241 | | | $ | 10,564,822 | | | $ | 10,583,397 | | |
| | | | | | | | | | | |
| LIABILITIES AND EQUITY: | | | | | | | | | | |
| Liabilities: | | | | | | | | | | |
| Secured debt, net | $ | 242,938 | | | $ | 244,316 | | | $ | 245,680 | | | $ | 247,030 | | | $ | 248,367 | | |
| Unsecured debt, net | 4,020,058 | | | 3,823,532 | | | 3,822,482 | | | 3,821,433 | | | 3,820,383 | | |
| | | | | | | | | | | |
| Accounts payable, accrued expenses and other liabilities | 392,360 | | | 424,087 | | | 357,253 | | | 391,920 | | | 391,264 | | |
| Ground lease liabilities | 124,994 | | | 125,065 | | | 125,277 | | | 125,414 | | | 125,550 | | |
| Accrued dividends and distributions | 64,285 | | | 64,271 | | | 61,880 | | | 61,951 | | | 61,850 | | |
| Deferred revenue and acquisition-related intangible liabilities, net | 195,959 | | | 176,105 | | | 176,845 | | | 171,121 | | | 171,151 | | |
| Rents received in advance and tenant security deposits | 81,432 | | | 82,839 | | | 73,273 | | | 80,192 | | | 74,962 | | |
| | | | | | | | | | | |
| Total liabilities | 5,122,026 | | | 4,940,215 | | | 4,862,690 | | | 4,899,061 | | | 4,893,527 | | |
| Equity: | | | | | | | | | | |
| Stockholders’ Equity | | | | | | | | | | |
| Common stock | 1,169 | | | 1,169 | | | 1,169 | | | 1,167 | | | 1,165 | | |
| Additional paid-in capital | 5,170,760 | | | 5,162,088 | | | 5,151,705 | | | 5,149,968 | | | 5,155,232 | | |
| Retained earnings | 265,118 | | | 276,138 | | | 260,020 | | | 274,193 | | | 283,663 | | |
| Total stockholders’ equity | 5,437,047 | | | 5,439,395 | | | 5,412,894 | | | 5,425,328 | | | 5,440,060 | | |
| Noncontrolling Interests | | | | | | | | | | |
| Common units of the Operating Partnership | 53,524 | | | 53,475 | | | 53,289 | | | 53,472 | | | 53,746 | | |
| Noncontrolling interests in consolidated property partnerships | 184,390 | | | 186,907 | | | 186,368 | | | 186,961 | | | 196,064 | | |
| Total noncontrolling interests | 237,914 | | | 240,382 | | | 239,657 | | | 240,433 | | | 249,810 | | |
| Total equity | 5,674,961 | | | 5,679,777 | | | 5,652,551 | | | 5,665,761 | | | 5,689,870 | | |
| TOTAL LIABILITIES AND EQUITY | $ | 10,796,987 | | | $ | 10,619,992 | | | $ | 10,515,241 | | | $ | 10,564,822 | | | $ | 10,583,397 | | |
| | | | | | | | | | | |
| | | | | |
Q4 2022 Supplemental Financial Report | |
Consolidated Statements of Operations
(unaudited, $ and shares in thousands, except per share amounts)
| | | | | | | | | | | | | | | | | | | | | | | | | | | | | | | | |
| | | Three Months Ended December 31, | | Year Ended December 31, | |
| | | 2022 | | 2021 | | 2022 | | 2021 | |
| REVENUES | | | | | | | | | |
| Rental income | | $ | 281,688 | | | $ | 259,145 | | | $ | 1,086,018 | | | $ | 948,994 | | |
| Other property income | | 2,656 | | | 1,940 | | | 10,969 | | | 6,046 | | |
| Total revenues | | 284,344 | | | 261,085 | | | 1,096,987 | | | 955,040 | | |
| EXPENSES | | | | | | | | | |
| Property expenses | | 55,323 | | | 45,519 | | | 202,744 | | | 165,702 | | |
| Real estate taxes | | 27,151 | | | 21,681 | | | 105,869 | | | 93,209 | | |
| | | | | | | | | | |
| Ground leases | | 2,092 | | | 1,862 | | | 7,565 | | | 7,421 | | |
| General and administrative expenses | | 25,217 | | | 23,267 | | | 93,642 | | | 92,749 | | |
| | | | | | | | | | |
| Leasing costs | | 1,404 | | | 876 | | | 4,879 | | | 3,249 | | |
| Depreciation and amortization | | 91,396 | | | 87,309 | | | 357,611 | | | 310,043 | | |
| Total expenses | | 202,583 | | | 180,514 | | | 772,310 | | | 672,373 | | |
| OTHER INCOME (EXPENSES) | | | | | | | | | |
| Interest and other income, net | | 1,264 | | | 230 | | | 1,765 | | | 3,916 | | |
| Interest expense | | (23,550) | | | (18,726) | | | (84,278) | | | (78,555) | | |
| Gains on sales of depreciable operating properties | | — | | | 5,297 | | | 17,329 | | | 463,128 | | |
| Loss on early extinguishment of debt | | — | | | (12,246) | | | — | | | (12,246) | | |
| | | | | | | | | | |
| | | | | | | | | | |
| Total other (expenses) income | | (22,286) | | | (25,445) | | | (65,184) | | | 376,243 | | |
| NET INCOME | | 59,475 | | | 55,126 | | | 259,493 | | | 658,910 | | |
| Net income attributable to noncontrolling common units of the Operating Partnership | | (588) | | | (463) | | | (2,283) | | | (6,163) | | |
| Net income attributable to noncontrolling interests in consolidated property partnerships | | (6,262) | | | (7,017) | | | (24,595) | | | (24,603) | | |
| Total income attributable to noncontrolling interests | | (6,850) | | | (7,480) | | | (26,878) | | | (30,766) | | |
| | | | | | | | | | |
| | | | | | | | | | |
| | | | | | | | | | |
| | | | | | | | | | |
| NET INCOME AVAILABLE TO COMMON STOCKHOLDERS | | $ | 52,625 | | | $ | 47,646 | | | $ | 232,615 | | | $ | 628,144 | | |
| Weighted average common shares outstanding – basic | | 116,878 | | | 116,462 | | | 116,807 | | | 116,429 | | |
| Weighted average common shares outstanding – diluted | | 117,389 | | | 117,110 | | | 117,220 | | | 116,949 | | |
| NET INCOME AVAILABLE TO COMMON STOCKHOLDERS PER SHARE | | | | | | | | | |
| Net income available to common stockholders per share – basic | | $ | 0.45 | | | $ | 0.41 | | | $ | 1.98 | | | $ | 5.38 | | |
| Net income available to common stockholders per share – diluted | | $ | 0.45 | | | $ | 0.40 | | | $ | 1.97 | | | $ | 5.36 | | |
| | | | | | | | | | |
| | | | | |
Q4 2022 Supplemental Financial Report | |
Funds From Operations and Funds Available for Distribution
(unaudited, $ in thousands, except per share amounts)
| | | | | | | | | | | | | | | | | | | | | | | | | | | | | | | | |
| | | Three Months Ended December 31, | | Year Ended December 31, | |
| | | 2022 | | 2021 | | 2022 | | 2021 | |
| | | | | | | | | | |
| FUNDS FROM OPERATIONS: (1) | | | | | | | | | |
| Net income available to common stockholders | | $ | 52,625 | | | $ | 47,646 | | | $ | 232,615 | | | $ | 628,144 | | |
| Adjustments: | | | | | | | | | |
| Net income attributable to noncontrolling common units of the Operating Partnership | | 588 | | | 463 | | | 2,283 | | | 6,163 | | |
| Net income attributable to noncontrolling interests in consolidated property partnerships | | 6,262 | | | 7,017 | | | 24,595 | | | 24,603 | | |
| Depreciation and amortization of real estate assets | | 89,536 | | | 85,628 | | | 350,665 | | | 303,799 | | |
| Gains on sales of depreciable real estate | | — | | | (5,297) | | | (17,329) | | | (463,128) | | |
| Funds From Operations attributable to noncontrolling interests in consolidated property partnerships | | (9,156) | | | (9,980) | | | (36,198) | | | (37,267) | | |
| Funds From Operations (1)(2) | | $ | 139,855 | | | $ | 125,477 | | | $ | 556,631 | | | $ | 462,314 | | |
| Weighted average common shares/units outstanding – basic (3) | | 118,568 | | | 118,365 | | | 118,586 | | | 118,349 | | |
| Weighted average common shares/units outstanding – diluted (4) | | 119,079 | | | 119,012 | | | 118,999 | | | 118,868 | | |
| FFO per common share/unit – basic (1) | | $ | 1.18 | | | $ | 1.06 | | | $ | 4.69 | | | $ | 3.91 | | |
| FFO per common share/unit – diluted (1) | | $ | 1.17 | | | $ | 1.05 | | | $ | 4.68 | | | $ | 3.89 | | |
| | | | | | | | | | |
| FUNDS AVAILABLE FOR DISTRIBUTION: (1) | | | | | | | | | |
| Funds From Operations (1)(2) | | $ | 139,855 | | | $ | 125,477 | | | $ | 556,631 | | | $ | 462,314 | | |
| Adjustments: | | | | | | | | | |
| Recurring tenant improvements, leasing commissions and capital expenditures | | (28,480) | | | (26,490) | | | (81,328) | | | (89,987) | | |
| Amortization of deferred revenue related to tenant-funded tenant improvements (2)(5) | | (5,100) | | | (3,540) | | | (19,321) | | | (16,539) | | |
| Net effect of straight-line rents | | (9,214) | | | (15,099) | | | (47,936) | | | (55,820) | | |
| Amortization of net below market rents (6) | | (2,305) | | | (3,200) | | | (10,476) | | | (6,904) | | |
| Amortization of deferred financing costs and net debt discount/premium | | 1,215 | | | 930 | | | 3,657 | | | 3,162 | | |
| Non-cash executive compensation expense (7) | | 6,712 | | | 7,693 | | | 28,347 | | | 35,315 | | |
| | | | | | | | | | |
| Lease related adjustments, leasing costs and other (8) | | 833 | | | 1,431 | | | 9,536 | | | 20,228 | | |
| Adjustments attributable to noncontrolling interests in consolidated property partnerships | | 1,223 | | | 1,759 | | | 5,687 | | | 5,440 | | |
| Funds Available for Distribution (1) | | $ | 104,739 | | | $ | 88,961 | | | $ | 444,797 | | | $ | 357,209 | | |
| | | | | | | | | | |
________________________
(1)See page 36 for Management Statements on Funds From Operations and Funds Available for Distribution. Reported per common share/unit amounts are attributable to common stockholders, common unitholders and restricted stock unitholders.
(2)FFO available to common stockholders and unitholders includes amortization of deferred revenue related to tenant-funded tenant improvements of $5.1 million and $3.5 million for the three months ended December 31, 2022 and 2021, respectively, and $19.3 million and $16.5 million for the year ended December 31, 2022 and 2021, respectively. These amounts are adjusted out of FFO in our calculation of FAD.
(3)Calculated based on weighted average shares outstanding including participating share-based awards and assuming the exchange of all common limited partnership units outstanding.
(4)Calculated based on weighted average shares outstanding including participating and non-participating share-based awards, dilutive impact of stock options and contingently issuable shares, and assuming the exchange of all common limited partnership units outstanding.
(5)Represents revenue recognized during the period as a result of the amortization of deferred revenue recorded for tenant-funded tenant improvements.
(6)Represents the non-cash adjustment related to the acquisition of buildings with above and/or below market rents.
(7)Includes non-cash amortization of share-based compensation and accrued potential future executive retirement benefits.
(8)Includes other cash and non-cash adjustments attributable to lease-related matters including GAAP revenue recognition timing differences, leasing costs and other.
| | | | | |
Q4 2022 Supplemental Financial Report | |
Reconciliation of GAAP Net Cash Provided by Operating Activities to Funds Available for Distribution
(unaudited, $ in thousands)
| | | | | | | | | | | | | | | | | | | | | | | | | | | | | | | | |
| | | Three Months Ended December 31, | | Year Ended December 31, | |
| | | 2022 | | 2021 | | 2022 | | 2021 | |
| GAAP Net Cash Provided by Operating Activities | | $ | 108,005 | | | $ | 108,843 | | | $ | 592,235 | | | $ | 516,403 | | |
| Adjustments: | | | | | | | | | |
| Recurring tenant improvements, leasing commissions and capital expenditures | | (28,480) | | | (26,490) | | | (81,328) | | | (89,987) | | |
| Loss on early extinguishment of debt | | — | | | (11,915) | | | — | | | (11,915) | | |
| | | | | | | | | | |
| | | | | | | | | | |
| Depreciation of non-real estate furniture, fixtures and equipment | | (1,860) | | | (1,681) | | | (6,946) | | | (6,244) | | |
| | | | | | | | | | |
| Net changes in operating assets and liabilities (1) | | 36,343 | | | 34,493 | | | (12,634) | | | (1,975) | | |
| Noncontrolling interests in consolidated property partnerships’ share of FFO and FAD | | (7,933) | | | (8,221) | | | (30,511) | | | (31,827) | | |
| Cash adjustments related to investing and financing activities | | (1,336) | | | (6,068) | | | (16,019) | | | (17,246) | | |
| Funds Available for Distribution (2) | | $ | 104,739 | | | $ | 88,961 | | | $ | 444,797 | | | $ | 357,209 | | |
| | | | | | | | | | |
_______________________
(1)Primarily includes changes in the following assets and liabilities: marketable securities; current receivables; prepaid expenses and other assets; accounts payable, accrued expenses and other liabilities; and rents received in advance and tenant security deposits.
(2)Please refer to page 36 for a Management Statement on Funds Available for Distribution.
| | | | | |
Q4 2022 Supplemental Financial Report | |
Net Operating Income (1)
(unaudited, $ in thousands)
| | | | | | | | | | | | | | | | | | | | | | | | | | | | | | | | | | | | | | | | | | | | |
| | | | | | | | | | | | | | |
| | | Three Months Ended December 31, | | Year Ended December 31, | |
| | | 2022 | | 2021 | | % Change | | 2022 | | 2021 | | % Change | |
| Operating Revenues: | | | | | | | | | | | | | |
| Rental income (2) | | $ | 237,884 | | | $ | 224,991 | | | 5.7 | % | | $ | 923,780 | | | $ | 825,813 | | | 11.9 | % | |
| Tenant reimbursements (2) | | 43,804 | | | 34,154 | | | 28.3 | % | | 162,238 | | | 123,181 | | | 31.7 | % | |
| Other property income | | 2,656 | | | 1,940 | | | 36.9 | % | | 10,969 | | | 6,046 | | | 81.4 | % | |
| Total operating revenues | | 284,344 | | | 261,085 | | | 8.9 | % | | 1,096,987 | | | 955,040 | | | 14.9 | % | |
| Operating Expenses: | | | | | | | | | | | | | |
| Property expenses | | 55,323 | | | 45,519 | | | 21.5 | % | | 202,744 | | | 165,702 | | | 22.4 | % | |
| Real estate taxes | | 27,151 | | | 21,681 | | | 25.2 | % | | 105,869 | | | 93,209 | | | 13.6 | % | |
| | | | | | | | | | | | | | |
| Ground leases | | 2,092 | | | 1,862 | | | 12.4 | % | | 7,565 | | | 7,421 | | | 1.9 | % | |
| Total operating expenses | | 84,566 | | | 69,062 | | | 22.4 | % | | 316,178 | | | 266,332 | | | 18.7 | % | |
| Net Operating Income | | $ | 199,778 | | | $ | 192,023 | | | 4.0 | % | | $ | 780,809 | | | $ | 688,708 | | | 13.4 | % | |
| | | | | | | | | | | | | | |
| | | | | | | | | | | | | | |
| | | | | | | | | | | | | | |
________________________
(1)Please refer to page 34 for Management Statements on Net Operating Income and page 40 for a reconciliation of GAAP Net Income Available to Common Stockholders to Net Operating Income.
(2)Revenue from tenant reimbursements is included in rental income on our consolidated statements of operations.
02
Portfolio Data
–Same Store Analysis
–Stabilized Portfolio Occupancy Overview by Region
–Information on Leases Commenced
–Information on Leases Executed
–Stabilized Portfolio Capital Expenditures
–Stabilized Portfolio Lease Expirations
–Top Fifteen Tenants
–2022 Operating Property Dispositions
–Consolidated Ventures (Noncontrolling Property Partnerships)
| | | | | |
Q4 2022 Supplemental Financial Report | |
Same Store Analysis (1)
(unaudited, $ in thousands)
| | | | | | | | | | | | | | | | | | | | | | | | | | | | | | | | | | | | | | | | | | | | |
| | | | | | | | | | | | | | |
| | | Three Months Ended December 31, | | Year Ended December 31, | |
| | | 2022 | | 2021 | | % Change | | 2022 | | 2021 | | % Change | |
| | | | | | | | | | | | | | |
| Total Same Store Portfolio | |
| Office Portfolio | | | | | | | | | | | | | |
| Number of properties | | 109 | | | 109 | | | | | 109 | | | 109 | | | | |
| Square Feet | | 13,556,582 | | | 13,556,582 | | | | | 13,556,582 | | | 13,556,582 | | | | |
| Percent of Stabilized Portfolio | | 83.7 | % | | 87.7 | % | | | | 83.7 | % | | 87.7 | % | | | |
| Average Occupancy | | 91.2 | % | | 91.5 | % | | | | 91.0 | % | | 91.9 | % | | | |
| | | | | | | | | | | | | | |
| Operating Revenues: | | | | | | | | | | | | | |
| Rental income (3) | | $ | 189,095 | | | $ | 187,286 | | | 1.0 | % | | $ | 747,621 | | | $ | 727,239 | | | 2.8 | % | |
| Tenant reimbursements (3) | | 33,568 | | | 31,402 | | | 6.9 | % | | 130,304 | | | 112,365 | | | 16.0 | % | |
| Other property income | | 2,321 | | | 1,819 | | | 27.6 | % | | 9,110 | | | 5,754 | | | 58.3 | % | |
| Total operating revenues | | 224,984 | | | 220,507 | | | 2.0 | % | | 887,035 | | | 845,358 | | | 4.9 | % | |
| Operating Expenses: | | | | | | | | | | | | | |
| Property expenses | | 44,968 | | | 39,534 | | | 13.7 | % | | 169,887 | | | 148,789 | | | 14.2 | % | |
| Real estate taxes | | 20,677 | | | 18,339 | | | 12.7 | % | | 84,223 | | | 81,897 | | | 2.8 | % | |
| Ground leases | | 1,897 | | | 1,831 | | | 3.6 | % | | 7,162 | | | 7,390 | | | (3.1) | % | |
| Total operating expenses | | 67,542 | | | 59,704 | | | 13.1 | % | | 261,272 | | | 238,076 | | | 9.7 | % | |
| Net Operating Income (2)(4) | | $ | 157,442 | | | $ | 160,803 | | | (2.1) | % | | $ | 625,763 | | | $ | 607,282 | | | 3.0 | % | |
| | | | | | | | | | | | | | |
| | | | | | | | | | | | | | |
| Same Store Analysis (Cash Basis) |
| | | | | | | | | | | | | | |
| | | Three Months Ended December 31, | | Year Ended December 31, | |
| | | 2022 | | 2021 | | % Change | | 2022 | | 2021 | | % Change | |
| Total operating revenues | | $ | 219,425 | | | $ | 212,660 | | | 3.2 | % | | $ | 860,446 | | | $ | 798,259 | | | 7.8 | % | |
| Total operating expenses | | 67,445 | | | 59,599 | | | 13.2 | % | | 260,863 | | | 237,687 | | | 9.8 | % | |
| Cash Net Operating Income (2)(4) | | $ | 151,980 | | | $ | 153,061 | | | (0.7) | % | | $ | 599,583 | | | $ | 560,572 | | | 7.0 | % | |
| | | | | | | | | | | | | | |
________________________
(1)Same Store is defined as all properties owned and included in our stabilized portfolio as of January 1, 2021 and still owned and included in the stabilized portfolio as of December 31, 2022. Same Store includes 100% of consolidated property partnerships as well as the residential tower at Columbia Square and the residential units at our One Paseo mixed-use project.
(2)Please refer to page 40 for a reconciliation of GAAP Net Income Available to Common Stockholders to Same Store Net Operating Income and Same Store Cash Net Operating Income. Adjustments to GAAP operating revenues include the net effect of straight-line rents, amortization of deferred revenue related to tenant-funded tenant improvements, amortization of above and below market lease intangibles and revenue reversals (recoveries) related to tenant creditworthiness.
(3)Revenue from tenant reimbursements is included in rental income on our consolidated statements of operations.
(4)For the three months ended December 31, 2021, Same Store Net Operating Income and Same Store Cash Net Operating Income include $4.6 million and $6.4 million of non-recurring items, respectively.
| | | | | |
Q4 2022 Supplemental Financial Report | |
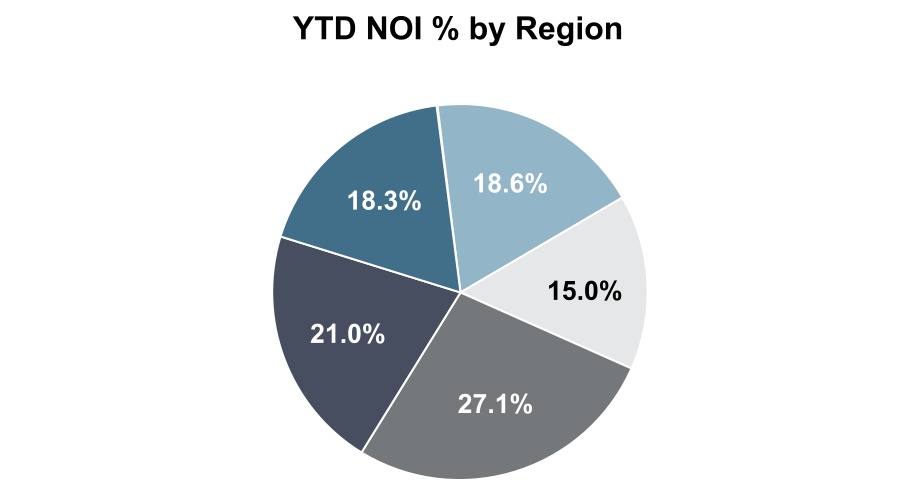
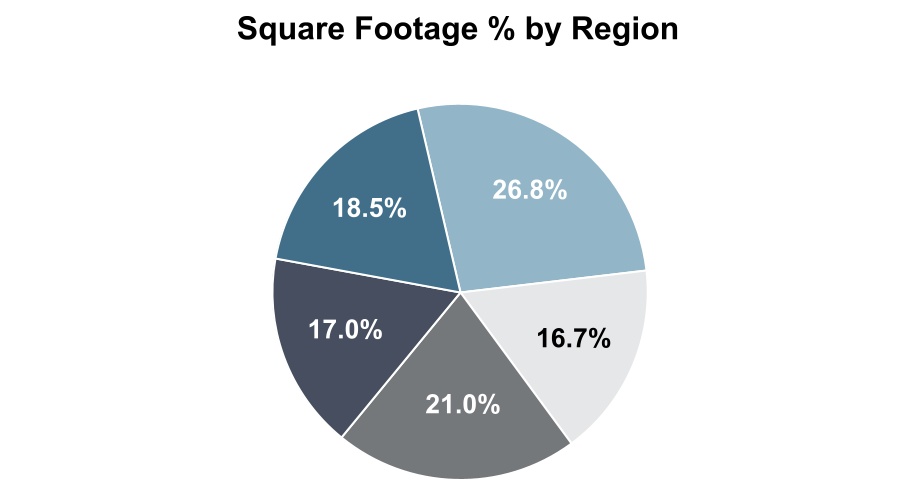
Stabilized Portfolio Occupancy Overview by Region
| | | | | | | | | | | | | | | | | | | | | | | | | | | | | | | | | | | | | | | | | | | | | | | | | | |
| | | | | Portfolio Breakdown | | | | Occupied at | | Leased at | |
| STABILIZED OFFICE PORTFOLIO (1) | | Buildings | | YTD NOI % | | SF % | | Total SF | | 12/31/2022 | | 9/30/2022 | | 12/31/2022 | |
| | | | | | | | | | | | | | | | |
| Greater Los Angeles | | | | | | | | | | | | | | | |
| Culver City | | 19 | | 1.0 | % | | 1.0 | % | | 154,165 | | | 78.8 | % | | 76.3 | % | | 78.8 | % | |
| El Segundo | | 5 | | 3.7 | % | | 6.8 | % | | 1,103,595 | | | 91.2 | % | | 91.7 | % | | 91.2 | % | |
| Hollywood | | 10 | | 7.3 | % | | 7.4 | % | | 1,200,419 | | | 90.0 | % | | 89.8 | % | | 90.2 | % | |
| Long Beach | | 7 | | 1.8 | % | | 5.9 | % | | 957,706 | | | 75.3 | % | | 76.0 | % | | 86.2 | % | |
| West Hollywood | | 4 | | 0.9 | % | | 1.2 | % | | 189,459 | | | 80.0 | % | | 75.9 | % | | 84.1 | % | |
| West Los Angeles | | 8 | | 3.9 | % | | 4.5 | % | | 726,975 | | | 83.8 | % | | 79.7 | % | | 83.8 | % | |
| Total Greater Los Angeles | | 53 | | 18.6 | % | | 26.8 | % | | 4,332,319 | | | 85.2 | % | | 84.5 | % | | 87.8 | % | |
| San Diego County | | | | | | | | | | | | | | | |
| Del Mar | | 17 | | 12.8 | % | | 11.1 | % | | 1,791,487 | | | 98.7 | % | | 98.8 | % | | 99.4 | % | |
| I-15 Corridor | | 3 | | 0.8 | % | | 2.7 | % | | 433,851 | | | 68.2 | % | | 67.3 | % | | 69.6 | % | |
| Little Italy / Point Loma | | 2 | | 0.3 | % | | 1.9 | % | | 312,138 | | | 32.3 | % | | 34.4 | % | | 42.2 | % | |
| University Towne Center | | 1 | | 1.1 | % | | 1.0 | % | | 160,444 | | | 100.0 | % | | 100.0 | % | | 100.0 | % | |
| Total San Diego County | | 23 | | 15.0 | % | | 16.7 | % | | 2,697,920 | | | 86.2 | % | | 86.3 | % | | 88.0 | % | |
| San Francisco Bay Area | | | | | | | | | | | | | | | |
| Menlo Park | | 6 | | 2.0 | % | | 2.0 | % | | 330,212 | | | 84.5 | % | | 76.4 | % | | 91.4 | % | |
| Mountain View | | 3 | | 2.5 | % | | 2.8 | % | | 457,066 | | | 100.0 | % | | 87.2 | % | | 100.0 | % | |
| Palo Alto | | 2 | | 1.2 | % | | 1.0 | % | | 165,574 | | | 100.0 | % | | 100.0 | % | | 100.0 | % | |
| Redwood City | | 2 | | 3.0 | % | | 2.1 | % | | 347,269 | | | 100.0 | % | | 100.0 | % | | 100.0 | % | |
| San Francisco | | 10 | | 27.1 | % | | 21.0 | % | | 3,394,039 | | | 93.3 | % | | 93.0 | % | | 93.9 | % | |
| South San Francisco | | 6 | | 8.3 | % | | 5.0 | % | | 806,109 | | | 100.0 | % | | 100.0 | % | | 100.0 | % | |
| Sunnyvale | | 4 | | 4.0 | % | | 4.1 | % | | 663,460 | | | 100.0 | % | | 100.0 | % | | 100.0 | % | |
| Total San Francisco Bay Area | | 33 | | 48.1 | % | | 38.0 | % | | 6,163,729 | | | 95.5 | % | | 93.8 | % | | 96.2 | % | |
| Greater Seattle | | | | | | | | | | | | | | | |
| Bellevue | | 2 | | 5.5 | % | | 5.7 | % | | 919,295 | | | 99.3 | % | | 99.3 | % | | 99.3 | % | |
| Lake Union / Denny Regrade | | 8 | | 12.8 | % | | 12.8 | % | | 2,080,883 | | | 97.1 | % | | 97.1 | % | | 97.1 | % | |
| Total Greater Seattle | | 10 | | 18.3 | % | | 18.5 | % | | 3,000,178 | | | 97.7 | % | | 97.7 | % | | 97.7 | % | |
| TOTAL STABILIZED OFFICE PORTFOLIO | | 119 | | 100.0 | % | | 100.0 | % | | 16,194,146 | | | 91.6 | % | | 90.8 | % | | 92.9 | % | |
| | | | | | | | | | | | | | | | |
| | | | | | | | |
| Average Office Occupancy |
| Quarter-to-Date | | Year-to-Date |
| 90.9% | | 91.2% |
________________________
(1)Includes stabilized retail space, which contributed approximately 2.8% of YTD NOI.
| | | | | |
Q4 2022 Supplemental Financial Report | |
Stabilized Portfolio Occupancy Overview by Region, continued
| | | | | | | | | | | | | | | | | | | | | | | | | | | | | | | | |
| | | Submarket | | Square Feet | | Occupied | | Leased | |
| | | | | | | | | | |
| Greater Los Angeles, California | | | | | | | | | |
| 3101-3243 La Cienega Boulevard | | Culver City | | 154,165 | | | 78.8 | % | | 78.8 | % | |
| 2240 E. Imperial Highway | | El Segundo | | 122,870 | | | 100.0 | % | | 100.0 | % | |
| 2250 E. Imperial Highway | | El Segundo | | 298,728 | | | 96.9 | % | | 96.9 | % | |
| 2260 E. Imperial Highway | | El Segundo | | 298,728 | | | 100.0 | % | | 100.0 | % | |
| 909 N. Pacific Coast Highway | | El Segundo | | 244,880 | | | 81.3 | % | | 81.3 | % | |
| 999 N. Pacific Coast Highway | | El Segundo | | 138,389 | | | 69.3 | % | | 69.3 | % | |
| 1350 Ivar Avenue | | Hollywood | | 16,448 | | | 100.0 | % | | 100.0 | % | |
| 1355 Vine Street | | Hollywood | | 183,129 | | | 100.0 | % | | 100.0 | % | |
| 1375 Vine Street | | Hollywood | | 159,236 | | | 100.0 | % | | 100.0 | % | |
| 1395 Vine Street | | Hollywood | | 2,575 | | | 100.0 | % | | 100.0 | % | |
| 1500 N. El Centro Avenue (1) | | Hollywood | | 113,447 | | | 28.8 | % | | 28.8 | % | |
| 1525 N. Gower Street | | Hollywood | | 9,610 | | | 100.0 | % | | 100.0 | % | |
| 1575 N. Gower Street | | Hollywood | | 264,430 | | | 100.0 | % | | 100.0 | % | |
| 6115 W. Sunset Boulevard | | Hollywood | | 26,238 | | | 100.0 | % | | 100.0 | % | |
| 6121 W. Sunset Boulevard | | Hollywood | | 93,418 | | | 100.0 | % | | 100.0 | % | |
| 6255 W. Sunset Boulevard | | Hollywood | | 331,888 | | | 88.3 | % | | 88.9 | % | |
| 3750 Kilroy Airport Way | | Long Beach | | 10,718 | | | 100.0 | % | | 100.0 | % | |
| 3760 Kilroy Airport Way | | Long Beach | | 166,761 | | | 96.4 | % | | 100.0 | % | |
| 3780 Kilroy Airport Way | | Long Beach | | 221,452 | | | 79.3 | % | | 86.4 | % | |
| 3800 Kilroy Airport Way | | Long Beach | | 192,476 | | | 87.7 | % | | 87.7 | % | |
| 3840 Kilroy Airport Way | | Long Beach | | 138,441 | | | 0.0 | % | | 51.8 | % | |
| 3880 Kilroy Airport Way | | Long Beach | | 96,923 | | | 100.0 | % | | 100.0 | % | |
| 3900 Kilroy Airport Way | | Long Beach | | 130,935 | | | 82.8 | % | | 91.2 | % | |
| 8560 W. Sunset Boulevard | | West Hollywood | | 76,558 | | | 59.0 | % | | 69.2 | % | |
| 8570 W. Sunset Boulevard | | West Hollywood | | 49,276 | | | 95.6 | % | | 95.6 | % | |
| 8580 W. Sunset Boulevard | | West Hollywood | | 6,875 | | | 59.0 | % | | 59.0 | % | |
| 8590 W. Sunset Boulevard | | West Hollywood | | 56,750 | | | 97.4 | % | | 97.4 | % | |
| 12100 W. Olympic Boulevard | | West Los Angeles | | 155,679 | | | 100.0 | % | | 100.0 | % | |
| 12200 W. Olympic Boulevard | | West Los Angeles | | 154,544 | | | 90.3 | % | | 90.3 | % | |
| 12233 W. Olympic Boulevard | | West Los Angeles | | 156,746 | | | 71.5 | % | | 71.5 | % | |
| 12312 W. Olympic Boulevard | | West Los Angeles | | 76,644 | | | 100.0 | % | | 100.0 | % | |
| 2100/2110 Colorado Avenue | | West Los Angeles | | 104,853 | | | 55.4 | % | | 55.4 | % | |
| 501 Santa Monica Boulevard | | West Los Angeles | | 78,509 | | | 85.3 | % | | 85.3 | % | |
| Total Greater Los Angeles | | | | 4,332,319 | | | 85.2 | % | | 87.8 | % | |
| | | | | | | | | | |
________________________
(1)This property is part of a complex of properties and is analyzed at the complex level.
| | | | | |
Q4 2022 Supplemental Financial Report | |
Stabilized Portfolio Occupancy Overview by Region, continued
| | | | | | | | | | | | | | | | | | | | | | | | | | | | | | | | |
| | | Submarket | | Square Feet | | Occupied | | Leased | |
| | | | | | | | | | |
| San Diego County, California | | | | | | | | | |
| 12225 El Camino Real | | Del Mar | | 58,401 | | | 100.0 | % | | 100.0 | % | |
| 12235 El Camino Real | | Del Mar | | 53,751 | | | 100.0 | % | | 100.0 | % | |
| 12340 El Camino Real | | Del Mar | | 109,307 | | | 100.0 | % | | 100.0 | % | |
| 12390 El Camino Real | | Del Mar | | 73,238 | | | 100.0 | % | | 100.0 | % | |
| 12770 El Camino Real | | Del Mar | | 75,035 | | | 100.0 | % | | 100.0 | % | |
| 12780 El Camino Real | | Del Mar | | 140,591 | | | 100.0 | % | | 100.0 | % | |
| 12790 El Camino Real | | Del Mar | | 87,944 | | | 100.0 | % | | 100.0 | % | |
| 12830 El Camino Real | | Del Mar | | 196,444 | | | 100.0 | % | | 100.0 | % | |
| 12860 El Camino Real | | Del Mar | | 92,042 | | | 100.0 | % | | 100.0 | % | |
| 12348 High Bluff Drive | | Del Mar | | 39,193 | | | 100.0 | % | | 100.0 | % | |
| 12400 High Bluff Drive | | Del Mar | | 216,518 | | | 100.0 | % | | 100.0 | % | |
| 3579 Valley Centre Drive | | Del Mar | | 54,960 | | | 100.0 | % | | 100.0 | % | |
| 3611 Valley Centre Drive | | Del Mar | | 132,425 | | | 96.4 | % | | 96.4 | % | |
| 3661 Valley Centre Drive | | Del Mar | | 131,662 | | | 100.0 | % | | 100.0 | % | |
| 3721 Valley Centre Drive | | Del Mar | | 115,193 | | | 100.0 | % | | 100.0 | % | |
| 3811 Valley Centre Drive | | Del Mar | | 118,912 | | | 100.0 | % | | 100.0 | % | |
| 3745 Paseo Place | | Del Mar | | 95,871 | | | 80.5 | % | | 93.8 | % | |
| 13480 Evening Creek Drive North (1) | | I-15 Corridor | | 143,401 | | | 6.4 | % | | 10.5 | % | |
| 13500 Evening Creek Drive North | | I-15 Corridor | | 143,749 | | | 100.0 | % | | 100.0 | % | |
| 13520 Evening Creek Drive North | | I-15 Corridor | | 146,701 | | | 97.5 | % | | 97.5 | % | |
| 2100 Kettner Boulevard | | Little Italy | | 204,682 | | | 0.0 | % | | 15.1 | % | |
| 2305 Historic Decatur Road | | Point Loma | | 107,456 | | | 93.9 | % | | 93.9 | % | |
| 9455 Towne Centre Drive | | University Towne Center | | 160,444 | | | 100.0 | % | | 100.0 | % | |
| Total San Diego County | | | | 2,697,920 | | | 86.2 | % | | 88.0 | % | |
| | | | | | | | | | |
________________________
(1)This property is part of a complex of properties and is analyzed at the complex level.
| | | | | |
Q4 2022 Supplemental Financial Report | |
Stabilized Portfolio Occupancy Overview by Region, continued
| | | | | | | | | | | | | | | | | | | | | | | | | | | | | | | | |
| | | Submarket | | Square Feet | | Occupied | | Leased | |
| | | | | | | | | | |
| San Francisco Bay Area, California | | | | | | | | | |
| 4100 Bohannon Drive | | Menlo Park | | 47,379 | | | 100.0 | % | | 100.0 | % | |
| 4200 Bohannon Drive | | Menlo Park | | 45,451 | | | 65.8 | % | | 65.8 | % | |
| 4300 Bohannon Drive | | Menlo Park | | 63,079 | | | 48.7 | % | | 85.3 | % | |
| | | | | | | | | | |
| 4500 Bohannon Drive | | Menlo Park | | 63,078 | | | 100.0 | % | | 100.0 | % | |
| 4600 Bohannon Drive | | Menlo Park | | 48,147 | | | 93.0 | % | | 93.0 | % | |
| 4700 Bohannon Drive | | Menlo Park | | 63,078 | | | 100.0 | % | | 100.0 | % | |
| 1290-1300 Terra Bella Avenue | | Mountain View | | 114,175 | | | 100.0 | % | | 100.0 | % | |
| 680 E. Middlefield Road | | Mountain View | | 171,676 | | | 100.0 | % | | 100.0 | % | |
| 690 E. Middlefield Road | | Mountain View | | 171,215 | | | 100.0 | % | | 100.0 | % | |
| 1701 Page Mill Road | | Palo Alto | | 128,688 | | | 100.0 | % | | 100.0 | % | |
| 3150 Porter Drive | | Palo Alto | | 36,886 | | | 100.0 | % | | 100.0 | % | |
| 900 Jefferson Avenue | | Redwood City | | 228,505 | | | 100.0 | % | | 100.0 | % | |
| 900 Middlefield Road | | Redwood City | | 118,764 | | | 100.0 | % | | 100.0 | % | |
| 100 Hooper Street | | San Francisco | | 417,914 | | | 100.0 | % | | 100.0 | % | |
| 100 First Street | | San Francisco | | 480,457 | | | 94.6 | % | | 98.7 | % | |
| 303 Second Street | | San Francisco | | 784,658 | | | 84.9 | % | | 84.9 | % | |
| 201 Third Street | | San Francisco | | 346,538 | | | 77.3 | % | | 77.3 | % | |
| 360 Third Street | | San Francisco | | 429,796 | | | 99.6 | % | | 99.6 | % | |
| 250 Brannan Street | | San Francisco | | 100,850 | | | 100.0 | % | | 100.0 | % | |
| 301 Brannan Street | | San Francisco | | 82,834 | | | 100.0 | % | | 100.0 | % | |
| 333 Brannan Street | | San Francisco | | 185,602 | | | 100.0 | % | | 100.0 | % | |
| 345 Brannan Street | | San Francisco | | 110,050 | | | 99.7 | % | | 99.7 | % | |
| 350 Mission Street | | San Francisco | | 455,340 | | | 99.7 | % | | 99.7 | % | |
| 345 Oyster Point Boulevard | | South San Francisco | | 40,410 | | | 100.0 | % | | 100.0 | % | |
| 347 Oyster Point Boulevard | | South San Francisco | | 39,780 | | | 100.0 | % | | 100.0 | % | |
| 349 Oyster Point Boulevard | | South San Francisco | | 65,340 | | | 100.0 | % | | 100.0 | % | |
| 350 Oyster Point Boulevard | | South San Francisco | | 234,892 | | | 100.0 | % | | 100.0 | % | |
| 352 Oyster Point Boulevard | | South San Francisco | | 232,215 | | | 100.0 | % | | 100.0 | % | |
| 354 Oyster Point Boulevard | | South San Francisco | | 193,472 | | | 100.0 | % | | 100.0 | % | |
| 505 Mathilda Avenue | | Sunnyvale | | 212,322 | | | 100.0 | % | | 100.0 | % | |
| 555 Mathilda Avenue | | Sunnyvale | | 212,322 | | | 100.0 | % | | 100.0 | % | |
| 599 Mathilda Avenue | | Sunnyvale | | 76,031 | | | 100.0 | % | | 100.0 | % | |
| 605 Mathilda Avenue | | Sunnyvale | | 162,785 | | | 100.0 | % | | 100.0 | % | |
| Total San Francisco Bay Area | | | | 6,163,729 | | | 95.5 | % | | 96.2 | % | |
| | | | | | | | | | |
| | | | | |
Q4 2022 Supplemental Financial Report | |
Stabilized Portfolio Occupancy Overview by Region, continued
| | | | | | | | | | | | | | | | | | | | | | | | | | | | | | | | |
| | | Submarket | | Square Feet | | Occupied | | Leased | |
| | | | | | | | | | |
| Greater Seattle, Washington | | | | | | | | | |
| 601 108th Avenue NE | | Bellevue | | 490,738 | | | 99.8 | % | | 99.8 | % | |
| 10900 NE 4th Street | | Bellevue | | 428,557 | | | 98.8 | % | | 98.8 | % | |
| 2001 West 8th Avenue | | Denny Regrade | | 539,226 | | | 90.0 | % | | 90.0 | % | |
| 333 Dexter Avenue North | | Lake Union | | 618,766 | | | 100.0 | % | | 100.0 | % | |
| 701 N. 34th Street | | Lake Union | | 141,860 | | | 100.0 | % | | 100.0 | % | |
| 801 N. 34th Street | | Lake Union | | 173,615 | | | 100.0 | % | | 100.0 | % | |
| 837 N. 34th Street | | Lake Union | | 112,487 | | | 100.0 | % | | 100.0 | % | |
| 320 Westlake Avenue North | | Lake Union | | 184,644 | | | 96.1 | % | | 96.1 | % | |
| 321 Terry Avenue North | | Lake Union | | 135,755 | | | 100.0 | % | | 100.0 | % | |
| 401 Terry Avenue North | | Lake Union | | 174,530 | | | 100.0 | % | | 100.0 | % | |
| Total Greater Seattle | | | | 3,000,178 | | | 97.7 | % | | 97.7 | % | |
| | | | | | | | | | |
| TOTAL STABILIZED OFFICE PORTFOLIO | | | | 16,194,146 | | | 91.6 | % | | 92.9 | % | |
| | | | | | | | | | |
| | | | | | | | | | | | | | | | | | | | | | | | | | | | | | | | | | |
| | | | | | | | | Average Residential Occupancy | |
| RESIDENTIAL PROPERTIES | | | | Submarket | | Total No. of Units | | Quarter-to-Date | | Year-to-Date | |
| | | | | | | | | | | | |
| Greater Los Angeles | | | | | | | | | | | |
| 1550 N. El Centro Avenue | | | | Hollywood | | 200 | | 92.3% | | 93.5% | |
| 6390 De Longpre Avenue | | | | Hollywood | | 193 | | 90.2% | | 88.2% | |
| San Diego County | | | | | | | | | | | |
| 3200 Paseo Village Way | | | | Del Mar | | 608 | | 94.7% | | 95.2% | |
| TOTAL RESIDENTIAL PROPERTIES | | | | | | 1,001 | | 93.3% | | 93.5% | |
| | | | | | | | | | | | |
| | | | | |
Q4 2022 Supplemental Financial Report | |
Information on Leases Commenced (1)
| | | | | | | | | | | | | | | | | | | | | | | | | | | | | | | | | | | | | | | | | | | | | | | | | | | | | | | | | | | | | | | | | |
| Quarter to Date | # of Leases (2) | | Square Feet (2) | | Weighted
Average Lease
Term (Mo.) | | TI/LC Per Sq.Ft. (3) | | TI/LC Per Sq.Ft. /Year (3) | | Changes in
GAAP Rents | | Changes in
Cash Rents | |
| | New | | Renewal | | New | | Renewal | | Total | | | | | | |
| 2nd Generation (4) | 10 | | | 8 | | | 275,770 | | | 84,470 | | | 360,240 | | | 78 | | | $ | 78.38 | | | $ | 12.06 | | | 41.2 | % | | 18.6 | % | |
| | | | | | | | | | | | | | | | | | | | | |
| Development Leasing (5) | 2 | | | — | | | 355,645 | | | — | | | 355,645 | | | 158 | | | $ | 131.25 | | | $ | 9.97 | | | | | | |
| TOTAL: | 12 | | | 8 | | | 631,415 | | | 84,470 | | | 715,885 | | | | | | | | | | | | |
| | | | | | | | | | | | | | | | | | | | | |
| | | | | | | | | | | | | | | | | | | | | | | | | | | | | | | | | | | | | | | | | | | | | | | | | | | | | | | | | | | | | | | | | |
| Year to Date | # of Leases (2) | | Square Feet (2) | | Weighted
Average Lease
Term (Mo.) | | TI/LC Per Sq.Ft. (3) | | TI/LC Per Sq.Ft. /Year (3) | | Changes in
GAAP Rents | | Changes in
Cash Rents | |
| | New | | Renewal | | New | | Renewal | | Total | | | | | | |
| 2nd Generation (4) | 46 | | | 31 | | | 580,943 | | | 290,138 | | | 871,081 | | | 75 | | | $ | 60.18 | | | $ | 9.63 | | | 31.3 | % | | 12.4 | % | |
| | | | | | | | | | | | | | | | | | | | | |
| Development Leasing (5) | 10 | | | 1 | | | 932,439 | | | 945 | | | 933,384 | | | 146 | | | $ | 133.26 | | | $ | 10.95 | | | | | | |
| TOTAL: | 56 | | | 32 | | | 1,513,382 | | | 291,083 | | | 1,804,465 | | | | | | | | | | | | |
| | | | | | | | | | | | | | | | | | | | | |
________________________
(1)Includes 100% of consolidated property partnerships.
(2)Represents leasing activity for leases that commenced at properties in the stabilized and development and redevelopment portfolios during the period, net of month-to-month leases.
(3)Includes tenant improvement costs and third-party leasing commissions. Amounts exclude tenant-funded tenant improvements and indirect leasing costs.
(4)Includes leases for which re-leasing timing was impacted by the COVID-19 pandemic.
(5)Represents leases commenced on new construction added to the stabilized portfolio and leasing activity for leases signed in our development and redevelopment portfolios.
| | | | | |
Q4 2022 Supplemental Financial Report | |
Information on Leases Executed (1)
| | | | | | | | | | | | | | | | | | | | | | | | | | | | | | | | | | | | | | | | | | | | | | | | | | | | | | | | | | | | | | | | | | | | | | | |
| Quarter to Date (2) | # of Leases (3) | | Square Feet (3) | | Weighted
Average Lease
Term (Mo.) | | TI/LC Per Sq.Ft. (4) | | TI/LC Per Sq.Ft. /Year (4) | | Changes in
GAAP Rents | | Changes in
Cash Rents | | Retention
Rates | |
| | New | | Renewal | | New | | Renewal | | Total | | | | | | | |
| 2nd Generation (5) | 14 | | | 8 | | | 141,666 | | | 84,470 | | | 226,136 | | | 75 | | | $ | 40.52 | | | $ | 6.48 | | | 31.1 | % | | 12.3 | % | | 32.0 | % | |
| Development Leasing (6) | 4 | | | — | | | 102,198 | | | — | | | 102,198 | | | 157 | | | $ | 168.40 | | | $ | 12.87 | | | | | | | | |
| TOTAL: | 18 | | | 8 | | | 243,864 | | | 84,470 | | | 328,334 | | | | | | | | | | | | | | |
| | | | | | | | | | | | | | | | | | | | | | | |
| | | | | | | | | | | | | | | | | | | | | | | | | | | | | | | | | | | | | | | | | | | | | | | | | | | | | | | | | | | | | | | | | | | | | | | |
| Year to Date (7) | # of Leases (3) | | Square Feet (3) | | Weighted
Average Lease
Term (Mo.) | | TI/LC Per Sq.Ft. (4) | | TI/LC Per Sq.Ft. /Year (4) | | Changes in
GAAP Rents | | Changes in
Cash Rents | | Retention
Rates | |
| | New | | Renewal | | New | | Renewal | | Total | | | | | | | |
| 2nd Generation (5) | 46 | | | 31 | | | 468,900 | | | 290,138 | | | 759,038 | | | 84 | | | $ | 66.79 | | | $ | 9.54 | | | 29.8 | % | | 11.0 | % | | 30.7 | % | |
| Development Leasing (6) | 8 | | | 1 | | | 133,273 | | | 945 | | | 134,218 | | | 147 | | | $ | 161.31 | | | $ | 13.17 | | | | | | | | |
| TOTAL: | 54 | | | 32 | | | 602,173 | | | 291,083 | | | 893,256 | | | | | | | | | | | | | | |
| | | | | | | | | | | | | | | | | | | | | | | |
________________________
(1)Includes 100% of consolidated property partnerships.
(2)During the three months ended December 31, 2022, 13 new leases totaling 203,811 square feet were signed but not commenced as of December 31, 2022.
(3)Represents leasing activity for leases signed at properties in the stabilized and development and redevelopment portfolios during the period, net of month-to-month leases.
(4)Includes tenant improvement costs and third-party leasing commissions. Amounts exclude tenant-funded tenant improvements and indirect leasing costs.
(5)Includes leases for which re-leasing timing was impacted by the COVID-19 pandemic.
(6)Represents leasing on new construction added to the stabilized portfolio and leasing activity for leases signed in our development and redevelopment portfolios.
(7)During the year ended December 31, 2022, 24 new leases totaling 327,133 square feet were signed but not commenced as of December 31, 2022.
| | | | | |
Q4 2022 Supplemental Financial Report | |
Stabilized Portfolio Capital Expenditures
($ in thousands)
| | | | | | | | | | | | | | | | | | | | | | | | | | | | | | | | | | | |
| | Total 2022 | | Q4 2022 | | Q3 2022 | | Q2 2022 | | Q1 2022 | |
| | | | | | | | | | | |
| 1st Generation (Nonrecurring) Capital Expenditures: (1) | | | | | | | | | | |
| Capital Improvements | $ | 3,371 | | | $ | (868) | | | $ | 271 | | | $ | 1,855 | | | $ | 2,113 | | |
| Tenant Improvements & Leasing Commissions (2) | 1,236 | | | (284) | | | — | | | 596 | | | 924 | | |
| | | | | | | | | | | |
| Total | $ | 4,607 | | | $ | (1,152) | | | $ | 271 | | | $ | 2,451 | | | $ | 3,037 | | |
| | | | | | | | | | | |
| | | | | | | | | | | |
| | Total 2022 | | Q4 2022 | | Q3 2022 | | Q2 2022 | | Q1 2022 | |
| | | | | | | | | | | |
| 2nd Generation (Recurring) Capital Expenditures: (1) | | | | | | | | | | |
| Capital Improvements | $ | 34,886 | | | $ | 10,803 | | | $ | 10,093 | | | $ | 9,045 | | | $ | 4,945 | | |
| Tenant Improvements & Leasing Commissions (2) | 46,442 | | | 17,677 | | | 10,577 | | | 9,848 | | | 8,340 | | |
| | | | | | | | | | | |
| Total | $ | 81,328 | | | $ | 28,480 | | | $ | 20,670 | | | $ | 18,893 | | | $ | 13,285 | | |
| | | | | | | | | | | |
________________________
(1)Includes 100% of capital expenditures of consolidated property partnerships.
(2)Includes tenant improvement costs and third-party leasing commissions. Amounts exclude tenant-funded tenant improvements.
| | | | | |
Q4 2022 Supplemental Financial Report | |
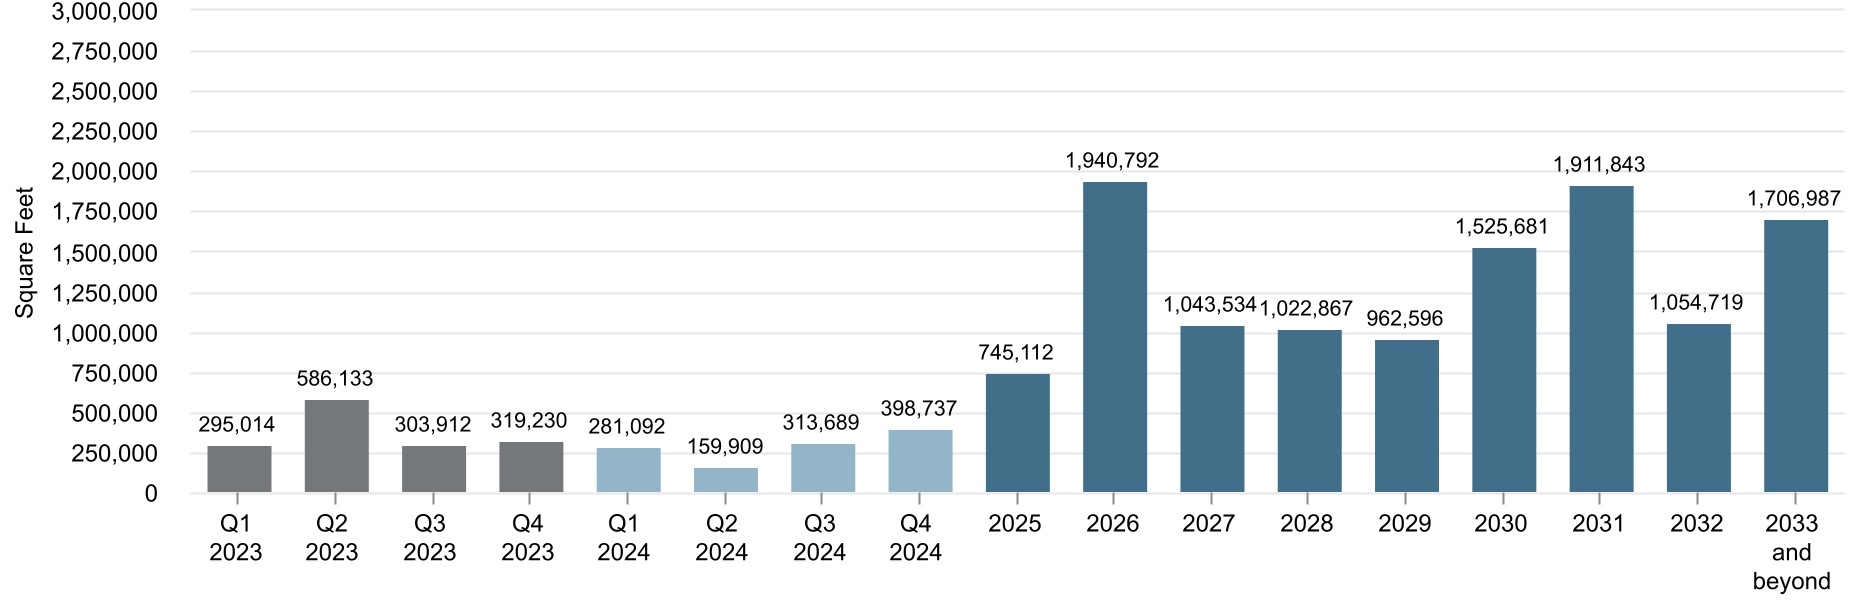
Stabilized Portfolio Lease Expiration Summary (1)
($ in thousands, except for annualized rent per sq. ft.)
| | | | | | | | | | | | | | | | | | | | | | | | | | | | | | | | | | | | | | | | | | | | | | | | | | | | | |
| # of Expiring Leases | 13 | | 13 | 16 | 21 | 27 | 16 | 17 | 16 | 64 | 54 | 62 | 36 | 22 | 37 | 31 | 14 | 13 |
| % of Total Leased Sq. Ft. | 2.0 | % | 4.0 | % | 2.1 | % | 2.2 | % | 1.9 | % | 1.1 | % | 2.2 | % | 2.7 | % | 5.1 | % | 13.3 | % | 7.2 | % | 7.0 | % | 6.6 | % | 10.5 | % | 13.1 | % | 7.2 | % | 11.8 | % |
| Annualized Base Rent | $10,946 | $30,133 | $13,597 | $17,691 | $13,438 | $6,590 | $11,749 | $23,196 | $37,168 | $90,757 | $41,487 | $64,904 | $53,105 | $91,127 | $129,488 | $71,555 | $112,765 |
% of Total Annualized Base Rent (2) | 1.3 | % | 3.7 | % | 1.7 | % | 2.1 | % | 1.7 | % | 0.8 | % | 1.4 | % | 2.8 | % | 4.5 | % | 11.1 | % | 5.1 | % | 7.9 | % | 6.5 | % | 11.1 | % | 15.8 | % | 8.7 | % | 13.8 | % |
| Annualized Rent per Sq. Ft. | $37.10 | $51.41 | $44.74 | $55.42 | $47.81 | $41.21 | $37.45 | $58.17 | $49.88 | $46.76 | $39.76 | $63.45 | $55.17 | $59.73 | $67.73 | $67.84 | $66.06 |
________________________
(1)For leases that have been renewed early with existing tenants, the expiration date and annualized base rent information presented takes into consideration the renewed lease terms. Excludes leases not commenced as of December 31, 2022, space leased under month-to-month leases, storage leases, vacant space and future lease renewal options not executed as of December 31, 2022.
(2)Includes 100% of annualized base rent of consolidated property partnerships.
| | | | | |
Q4 2022 Supplemental Financial Report | |
Stabilized Portfolio Lease Expiration Schedule by Region
($ in thousands, except for annualized rent per sq. ft.)
| | | | | | | | | | | | | | | | | | | | | | | | | | | | | | | | | | | | | | | | | | | | | | | | | | |
| Year | | Region | | # of
Expiring Leases | | Total
Square Feet | | % of Total
Leased Sq. Ft. | | Annualized Base Rent (1) | | % of Total
Annualized
Base Rent | | Annualized Rent
per Sq. Ft. | |
| | | | | | | | | | | | | | | | |
| 2023 | | Greater Los Angeles | | 39 | | | 538,031 | | | 3.7 | % | | $ | 24,907 | | | 3.0 | % | | $ | 46.29 | | |
| | San Diego | | 9 | | | 174,914 | | | 1.2 | % | | 7,670 | | | 0.9 | % | | 43.85 | | |
| | San Francisco Bay Area | | 10 | | | 326,443 | | | 2.2 | % | | 19,907 | | | 2.4 | % | | 60.98 | | |
| | Greater Seattle | | 5 | | | 464,901 | | | 3.2 | % | | 19,883 | | | 2.5 | % | | 42.77 | | |
| | Total | | 63 | | | 1,504,289 | | | 10.3 | % | | $ | 72,367 | | | 8.8 | % | | $ | 48.11 | | |
| | | | | | | | | | | | | | | | |
| 2024 | | Greater Los Angeles | | 44 | | | 561,449 | | | 3.9 | % | | $ | 24,629 | | | 3.0 | % | | $ | 43.87 | | |
| | San Diego | | 9 | | | 57,303 | | | 0.3 | % | | 3,199 | | | 0.4 | % | | 55.83 | | |
| | San Francisco Bay Area | | 12 | | | 288,538 | | | 2.0 | % | | 18,663 | | | 2.3 | % | | 64.68 | | |
| | Greater Seattle | | 11 | | | 246,137 | | | 1.7 | % | | 8,482 | | | 1.0 | % | | 34.46 | | |
| | Total | | 76 | | | 1,153,427 | | | 7.9 | % | | $ | 54,973 | | | 6.7 | % | | $ | 47.66 | | |
| | | | | | | | | | | | | | | | |
| 2025 | | Greater Los Angeles | | 25 | | | 192,464 | | | 1.3 | % | | $ | 8,467 | | | 1.0 | % | | $ | 43.99 | | |
| | San Diego | | 19 | | | 225,535 | | | 1.5 | % | | 10,766 | | | 1.3 | % | | 47.74 | | |
| | San Francisco Bay Area | | 10 | | | 186,282 | | | 1.3 | % | | 12,383 | | | 1.5 | % | | 66.47 | | |
| | Greater Seattle | | 10 | | | 140,831 | | | 1.0 | % | | 5,552 | | | 0.7 | % | | 39.42 | | |
| | Total | | 64 | | | 745,112 | | | 5.1 | % | | $ | 37,168 | | | 4.5 | % | | $ | 49.88 | | |
| | | | | | | | | | | | | | | | |
| 2026 | | Greater Los Angeles | | 16 | | | 380,356 | | | 2.6 | % | | $ | 14,617 | | | 1.8 | % | | $ | 38.43 | | |
| | San Diego | | 12 | | | 224,861 | | | 1.5 | % | | 10,547 | | | 1.3 | % | | 46.90 | | |
| | San Francisco Bay Area | | 15 | | | 940,216 | | | 6.5 | % | | 49,396 | | | 6.0 | % | | 52.54 | | |
| | Greater Seattle | | 11 | | | 395,359 | | | 2.7 | % | | 16,197 | | | 2.0 | % | | 40.97 | | |
| | Total | | 54 | | | 1,940,792 | | | 13.3 | % | | $ | 90,757 | | | 11.1 | % | | $ | 46.76 | | |
| | | | | | | | | | | | | | | | |
| 2027 | | Greater Los Angeles | | 33 | | | 712,945 | | | 5.0 | % | | $ | 26,033 | | | 3.2 | % | | $ | 36.51 | | |
| | San Diego | | 16 | | | 239,005 | | | 1.6 | % | | 11,926 | | | 1.5 | % | | 49.90 | | |
| | San Francisco Bay Area | | 3 | | | 5,041 | | | — | % | | 263 | | | — | % | | 52.17 | | |
| | Greater Seattle | | 10 | | | 86,543 | | | 0.6 | % | | 3,265 | | | 0.4 | % | | 37.73 | | |
| | Total | | 62 | | | 1,043,534 | | | 7.2 | % | | $ | 41,487 | | | 5.1 | % | | $ | 39.76 | | |
| | | | | | | | | | | | | | | | |
| 2028
and
Beyond | | Greater Los Angeles | | 38 | | | 1,140,285 | | | 7.8 | % | | $ | 67,225 | | | 8.2 | % | | $ | 58.95 | | |
| | San Diego | | 47 | | | 1,383,878 | | | 9.6 | % | | 86,113 | | | 10.5 | % | | 62.23 | | |
| | San Francisco Bay Area | | 44 | | | 4,085,604 | | | 28.0 | % | | 296,817 | | | 36.2 | % | | 72.65 | | |
| | Greater Seattle | | 24 | | | 1,574,926 | | | 10.8 | % | | 72,789 | | | 8.9 | % | | 46.22 | | |
| | Total | | 153 | | | 8,184,693 | | | 56.2 | % | | $ | 522,944 | | | 63.8 | % | | $ | 63.89 | | |
| | | | | | | | | | | | | | | | |
________________________(1)Includes 100% of annualized base rent of consolidated property partnerships.
| | | | | |
Q4 2022 Supplemental Financial Report | |
Top Fifteen Tenants (1)
($ in thousands)
| | | | | | | | | | | | | | | | | | | | | | | | | | | | | | | | | | | | | | | | | | | | |
| Tenant Name | | Region | | Annualized Base Rental Revenue (2) | | Rentable
Square Feet | | Percentage of
Total Annualized Base Rental Revenue | | Percentage of
Total Rentable
Square Feet | | Year(s) of Lease Expiration | |
| Global technology company | | Greater Seattle /
San Diego County | | $ | 39,631 | | | 779,210 | | | 4.8 | % | | 4.8 | % | | 2032 / 2033 | |
| Cruise LLC | | San Francisco Bay Area | | 35,449 | | | 374,618 | | | 4.3 | % | | 2.3 | % | | 2031 | |
| Stripe, Inc. | | San Francisco Bay Area | | 33,110 | | | 425,687 | | | 4.0 | % | | 2.6 | % | | 2034 | |
| Amazon.com (3) | | Greater Seattle | | 31,437 | | | 709,276 | | | 3.8 | % | | 4.4 | % | | 2023 / 2029 / 2030 | |
| LinkedIn Corporation / Microsoft Corporation | | San Francisco Bay Area | | 29,752 | | | 663,460 | | | 3.6 | % | | 4.1 | % | | 2024 / 2026 | |
| Adobe Systems, Inc. | | San Francisco Bay Area /
Greater Seattle | | 27,897 | | | 523,416 | | | 3.4 | % | | 3.2 | % | | 2027 / 2031 | |
| Salesforce, Inc. | | San Francisco Bay Area | | 24,076 | | | 451,763 | | | 2.9 | % | | 2.8 | % | | 2031 / 2032 | |
| DoorDash, Inc. | | San Francisco Bay Area | | 23,842 | | | 236,759 | | | 2.9 | % | | 1.5 | % | | 2032 | |
| Riot Games, Inc. (4) | | Greater Los Angeles | | 22,855 | | | 340,584 | | | 2.8 | % | | 2.1 | % | | 2023 / 2024 / 2031 | |
| Okta, Inc. | | San Francisco Bay Area | | 22,387 | | | 273,371 | | | 2.7 | % | | 1.7 | % | | 2028 | |
| Netflix, Inc. | | Greater Los Angeles | | 21,854 | | | 361,388 | | | 2.7 | % | | 2.2 | % | | 2032 | |
| Box, Inc. | | San Francisco Bay Area | | 20,390 | | | 341,441 | | | 2.5 | % | | 2.1 | % | | 2028 | |
| Cytokinetics, Inc. | | San Francisco Bay Area | | 18,167 | | | 234,892 | | | 2.2 | % | | 1.5 | % | | 2033 | |
| DIRECTV, LLC (5) | | Greater Los Angeles | | 16,085 | | | 532,956 | | | 2.0 | % | | 3.3 | % | | 2023 / 2026 / 2027 | |
| Synopsys, Inc. | | San Francisco Bay Area | | 15,492 | | | 342,891 | | | 1.9 | % | | 2.1 | % | | 2030 | |
| Total Top Fifteen Tenants | | | | $ | 382,424 | | | 6,591,712 | | | 46.5 | % | | 40.7 | % | | | |
| | | | | | | | | | | | | | |
________________________
(1)The information presented is as of the date of the report.
(2)Includes 100% of annualized base rental revenues of consolidated property partnerships.
(3)The 2023 lease expiration represents 71,481 rentable square feet that expired on January 30, 2023, which is excluded from the table above, and 375,479 rentable square feet expiring on April 30, 2023.
(4)The 2023 lease expiration represents 128,416 rentable square feet expiring on November 30, 2023.
(5)The 2023 lease expiration represents 151,455 rentable square feet that expired on January 1, 2023, which is excluded from the table above.
| | | | | |
Q4 2022 Supplemental Financial Report | |
2022 Operating Property Dispositions
($ in millions)
| | | | | | | | | | | | | | | | | | | | | | | | | | | | | | | | | | | | | | |
| | |
| COMPLETED OPERATING PROPERTY DISPOSITIONS | | Submarket | | Month of
Disposition | | No. of Buildings | | Rentable
Square Feet | | Sales
Price (1) | |
| 1st Quarter | | | | | | | | | | | |
| None | | | | | | | | | | | |
| | | | | | | | | | | | |
| 2nd Quarter | | | | | | | | | | | |
| None | | | | | | | | | | | |
| | | | | | | | | | | | |
| 3rd Quarter | | | | | | | | | | | |
| 3130 Wilshire Boulevard, Santa Monica, CA | | West Los Angeles | | August | | 1 | | 96,085 | | | $ | 48.0 | | |
| | | | | | | | | | | | |
| 4th Quarter | | | | | | | | | | | |
| None | | | | | | | | | | | |
| | | | | | | | | | | | |
| TOTAL DISPOSITIONS | | | | | | 1 | | 96,085 | | | $ | 48.0 | | |
| | | | | | | | | | | | |
____________________
(1)Represents gross sales price before the impact of commissions, closing costs and purchase price credits.
| | | | | |
Q4 2022 Supplemental Financial Report | |
Consolidated Ventures (Noncontrolling Property Partnerships)
| | | | | | | | | | | | | | | | | | | | | | | | | | | | | | | | |
| | | | | | | | | | |
| Property (1) | | Venture Partner | | Submarket | | Rentable Square Feet | | KRC Ownership % | |
| 100 First Street, San Francisco, CA | | Norges Bank Real Estate Management | | San Francisco | | 480,457 | | 56% | |
| 303 Second Street, San Francisco, CA | | Norges Bank Real Estate Management | | San Francisco | | 784,658 | | 56% | |
| 900 Jefferson Avenue and 900 Middlefield Road, Redwood City, CA (2) | | Local developer | | Redwood City | | 347,269 | | 93% | |
| | | | | | | | | | |
____________________
(1)For breakout of Net Operating Income by partnership, refer to page 40, Reconciliation of Net Income Available to Common Stockholders to Same Store Net Operating Income.
(2)Reflects the KRC ownership percentage at time of agreement. Actual percentage may vary depending on cash flows or promote structure.
03
Development
–Stabilized Office & Life Science Development & Redevelopment Projects
–In-Process Development & Redevelopment
–Future Development Pipeline
| | | | | |
Q4 2022 Supplemental Financial Report | |
Stabilized Office & Life Science Development & Redevelopment Projects
($ in millions)
| | | | | | | | | | | | | | | | | | | | | | | | | | | | | | | | | | | | | | | | | | | | | | | | | | |
| | | | | | | | | | | | | | | | |
| STABILIZED OFFICE & LIFE SCIENCE DEVELOPMENT & REDEVELOPMENT PROJECTS | | Location | | Construction Start Date | | Stabilization Date (1) | | Total Estimated Investment (2) | | Rentable
Square Feet | | % Leased | | Total Project % Occupied | |
| | | | | | | | | | | | | | | | |
| 1st Quarter | | | | | | | | | | | | | | | |
| None | | | | | | | | | | | | | | | |
| | | | | | | | | | | | | | | | |
| 2nd Quarter | | | | | | | | | | | | | | | |
| 333 Dexter Avenue North | | Lake Union | | 2Q 2017 | | 2Q 2022 | | $ | 385.0 | | | 618,766 | | | 100% | | 100% | |
| | | | | | | | | | | | | | | | |
| 3rd Quarter | | | | | | | | | | | | | | | |
| 2100 Kettner | | Little Italy | | 3Q 2019 | | 3Q 2022 | | 140.0 | | | 204,682 | | | 15% | | —% | |
| 12340 El Camino Real (3) | | Del Mar | | 4Q 2021 | | 3Q 2022 | | 40.0 | | | 109,307 | | | 100% | | 100% | |
| 12400 High Bluff Drive (4) | | Del Mar | | 1Q 2022 | | 3Q 2022 | | 50.0 | | | 181,949 | | | 100% | | 100% | |
| | | | | | | | | | | | | | | | |
| 4th Quarter | | | | | | | | | | | | | | | |
| None | | | | | | | | | | | | | | | |
| | | | | | | | | | | | | | | | |
| TOTAL: | | | | | | | | $ | 615.0 | | | 1,114,704 | | | 84% | | 82% | |
| | | | | | | | | | | | | | | | |
| | | | | | | | | | | | | | | | |
| | | | | | | | | | | | | | | | |
| | | | | | | | | | | | | | | | |
| | | | | | | | | | | | | | | | |
| | | | | | | | | | | | | | | | |
| | | | | | | | | | | | | | | | |
| | | | | | | | | | | | | | | | |
| | | | | | | | | | | | | | | | |
| | | | | | | | | | | | | | | | |
| | | | | | | | | | | | | | | | |
| | | | | | | | | | | | | | | | |
| | | | | | | | | | | | | | | | |
| | | | | | | | | | | | | | | | |
| | | | | | | | | | | | | | | | |
| | | | | | | | | | | | | | | | |
| | | | | | | | | | | | | | | | |
| | | | | | | | | | | | | | | | |
| | | | | | | | | | | | | | | | |
____________________
(1)Represents the earlier of 95% occupancy date or one year from substantial completion of base building components.
(2)For redevelopment projects, includes the existing depreciated basis for the buildings to be redeveloped, except for 12400 High Bluff Drive, which includes 66% of the depreciated basis, representing the 66% of the building that was subject to redevelopment.
(3)Redevelopment project.
(4)Completed 144,000 rentable square feet that was in the scope of redevelopment.
| | | | | |
Q4 2022 Supplemental Financial Report | |
In-Process Development & Redevelopment
($ in millions)
| | | | | | | | | | | | | | | | | | | | | | | | | | | | | | | | | | | | | | | | | | | | | | | | | | | | | | | | |
| | | | | | | | | | | | | | | | | | |
| | | Location | | Construction Start Date | | Estimated Stabilization Date (2) | | Estimated Rentable Square Feet (3) | | Total Estimated Investment | | Total Cash Costs Incurred as of 12/31/2022 (4) | | % Leased | | Total Project % Occupied | |
| TENANT IMPROVEMENT (1) | | | | | | | | | |
| | | | | | | | | | | | | | | | | | |
| Office | | | | | | | | | | | | | | | | | |
| Austin | | | | | | | | | | | | | | | | | |
| Indeed Tower | | Austin CBD | | 2Q 2021 | | 4Q 2023 | | 734,000 | | | $ | 690.0 | | | $ | 606.9 | | | 71% | | 58% | |
| | | | | | | | | | | | | | | | | | |
| TOTAL: | | | | | | | | 734,000 | | | $ | 690.0 | | | $ | 606.9 | | | 71% | | 58% | |
| | | | | | | | | | | | | | | | | | |
| | | | | | | | | | | | | | | | | | | | | | | | | | | | | | | | | | | | | | | | | | | | | | | | | | |
| | | | | | | | | | | | | | | | |
| UNDER CONSTRUCTION | | Location | | Construction Start Date | | Estimated Stabilization Date (2) | | Estimated Rentable Square Feet (3) | | Total Estimated Investment | | Total Cash Costs Incurred as of 12/31/2022 (4)(5) | | % Leased | |
| | | | | | | | | | | | | | | | |
| Office / Life Science | | | | | | | | | | | | | | | |
| San Francisco Bay Area | | | | | | | | | | | | | | | |
| Kilroy Oyster Point - Phase 2 | | South San Francisco | | 2Q 2021 | | 2Q 2025 | | 875,000 | | | $ | 940.0 | | | $ | 358.2 | | | —% | |
| 4400 Bohannon Drive (6) | | Menlo Park | | 4Q 2022 | | 3Q 2025 | | 48,000 | | | 55.0 | | | 16.7 | | | —% | |
| San Diego County | | | | | | | | | | | | | | | |
| 9514 Towne Centre Drive | | University Towne Center | | 3Q 2021 | | 4Q 2023 | | 71,000 | | | 60.0 | | | 33.1 | | | 100% | |
| | | | | | | | | | | | | | | | |
| 4690 Executive Drive (6) | | University Towne Center | | 1Q 2022 | | 3Q 2023 | | 52,000 | | | 25.0 | | | 15.6 | | | 100% | |
| | | | | | | | | | | | | | | | |
| TOTAL: | | | | | | | | 1,046,000 | | | $ | 1,080.0 | | | $ | 423.6 | | | 12% | |
| | | | | | | | | | | | | | | | |
________________________
(1)Represents projects that have reached cold shell condition and are ready for tenant improvements, which may require additional major base building construction before being placed in service.
(2)For office and retail, represents the earlier of anticipated 95% occupancy date or one year from substantial completion of base building components. For multi-phase projects, interest and carry cost capitalization may cease and recommence driven by various factors, including tenant improvement construction and other tenant related timing or project scope. For projects being redeveloped, redevelopment will occur in phases based on existing lease expiration dates and timing of the tenant improvement build-out.
(3)For projects being redeveloped, represents the total square footage leased.
(4)Represents costs incurred as of December 31, 2022, excluding GAAP accrued liabilities and leasing overhead.
(5)For redevelopment projects, includes the existing depreciated basis for the buildings to be redeveloped.
(6)Redevelopment project.
| | | | | |
Q4 2022 Supplemental Financial Report | |
Future Development Pipeline
($ in millions)
| | | | | | | | | | | | | | | | | | | | | | | | | | | | | | | | |
| FUTURE DEVELOPMENT PIPELINE | | Location | | Approx. Developable Square Feet (1) | | Total Cash Costs Incurred as of 12/31/2022 (2) | |
| | | | | | | | | | |
| Greater Los Angeles | | | | | | | | | |
| 1633 26th Street | | West Los Angeles | | 190,000 | | $ | 14.6 | | |
| San Diego County | | | | | | | | | |
| Santa Fe Summit South / North | | 56 Corridor | | 600,000 - 650,000 | | 106.8 | | |
| 2045 Pacific Highway | | Little Italy | | 275,000 | | 51.9 | | |
| Kilroy East Village | | East Village | | TBD | | 66.1 | | |
| San Francisco Bay Area | | | | | | | | | |
| Kilroy Oyster Point - Phases 3 and 4 | | South San Francisco | | 875,000 - 1,000,000 | | 203.5 | | |
| Flower Mart | | SOMA | | 2,300,000 | | 472.2 | | |
| Greater Seattle | | | | | | | | | |
| SIX0 - Office & Residential | | Denny Regrade | | 925,000 | | 173.3 | | |
| Austin | | | | | | | | | |
| Stadium Tower | | Stadium District / Domain | | 493,000 | | 59.0 | | |
| | | | | | | | | | |
| TOTAL: | | | | | | | | $ | 1,147.4 | | |
| | | | | | | | | | |
________________________
(1)The developable square feet and scope of projects could change materially from estimated data provided due to one or more of the following: any significant changes in the economy, market conditions, our markets, tenant requirements and demands, construction costs, new supply, regulatory and entitlement processes or project design.
(2)Represents costs incurred as of December 31, 2022, excluding accrued liabilities recorded in accordance with GAAP.
04
Debt and
Capitalization Data
–Capital Structure
–Debt Analysis
| | | | | |
Q4 2022 Supplemental Financial Report | |
Capital Structure
As of December 31, 2022 ($ in thousands)
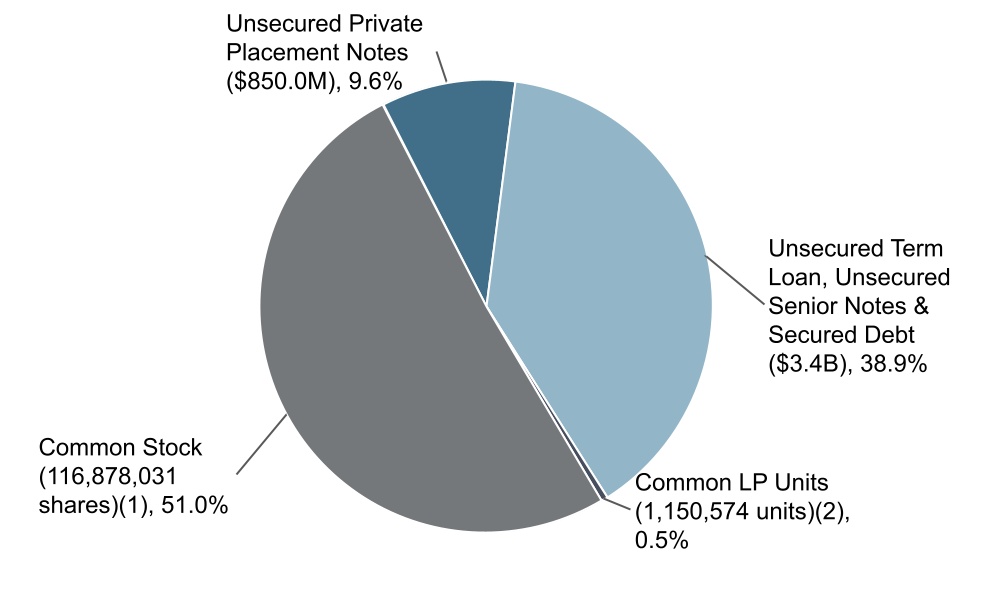
| | | | | | | | | | | | | | |
Debt Balance (3) | | Stated Rate | | Maturity Date |
| | | | |
Unsecured Debt (4) |
| $ | 425,000 | | | 3.45 | % | | 12/15/2024 |
| $ | 400,000 | | | 4.38 | % | | 10/1/2025 |
| $ | 50,000 | | | 4.30 | % | | 7/18/2026 |
| $ | 200,000 | | | 5.23 | % | | 10/3/2026 (5) |
| $ | 200,000 | | | 4.35 | % | | 10/18/2026 |
| $ | 175,000 | | | 3.35 | % | | 2/17/2027 |
| $ | 400,000 | | | 4.75 | % | | 12/15/2028 |
| $ | 75,000 | | | 3.45 | % | | 2/17/2029 |
| $ | 400,000 | | | 4.25 | % | | 8/15/2029 |
| $ | 500,000 | | | 3.05 | % | | 2/15/2030 |
| $ | 350,000 | | | 4.27 | % | | 1/31/2031 |
| $ | 425,000 | | | 2.50 | % | | 11/15/2032 |
| $ | 450,000 | | | 2.65 | % | | 11/15/2033 |
| $ | 4,050,000 | | | 3.72 | % | | |
| | | | |
| Secured Debt |
| $ | 159,973 | | | 3.57 | % | | 12/1/2026 |
| $ | 83,496 | | | 4.48 | % | | 7/1/2027 |
| $ | 243,469 | | | 3.88 | % | | |
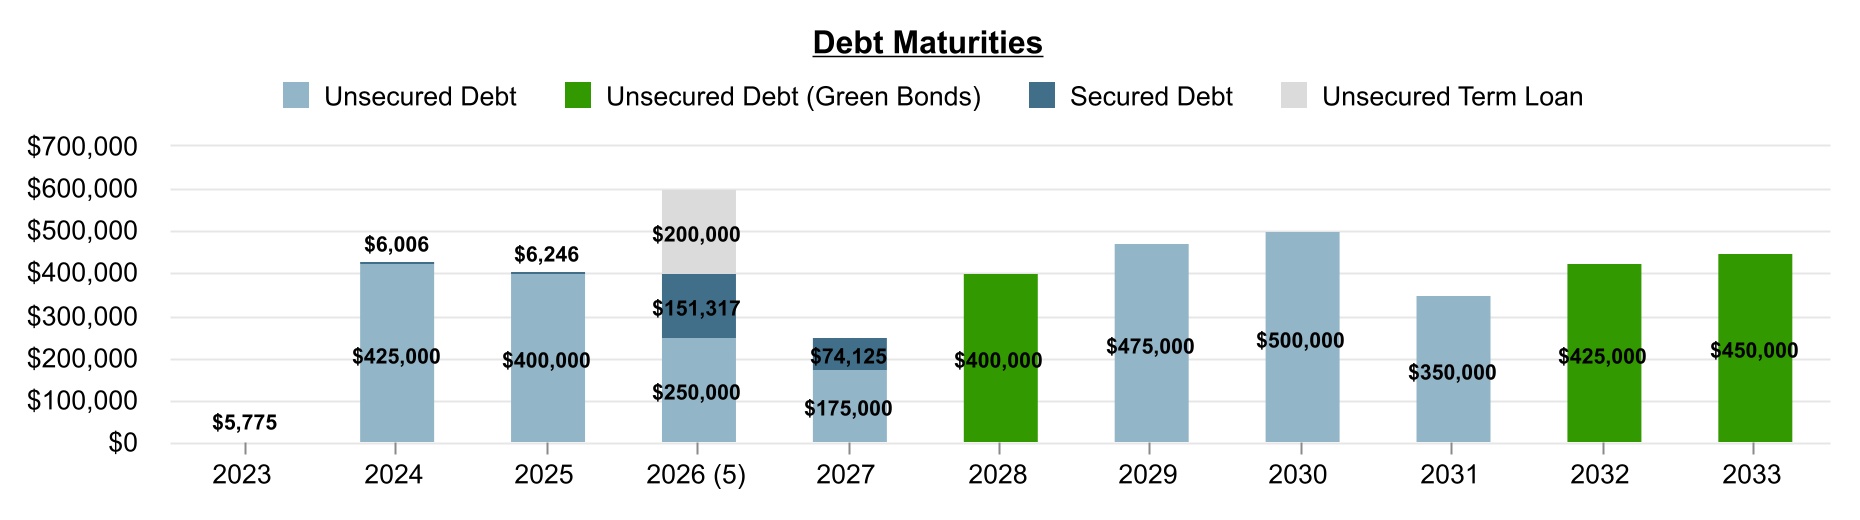
________________________
(1)Value based on closing share price of $38.67 as of December 31, 2022.
(2)Includes common units of the Operating Partnership not owned by the Company; does not include noncontrolling interests in consolidated property partnerships.
(3)Represents the gross aggregate principal amount due at maturity before the effect of unamortized deferred financing costs and premiums and discounts.
(4)As of December 31, 2022, there was no outstanding balance on the unsecured revolving credit facility.
(5)The maturity date of the unsecured term loan assumes the exercise of the two twelve-month extensions at the Company’s option.
| | | | | |
Q4 2022 Supplemental Financial Report | |
Debt Analysis
As of December 31, 2022
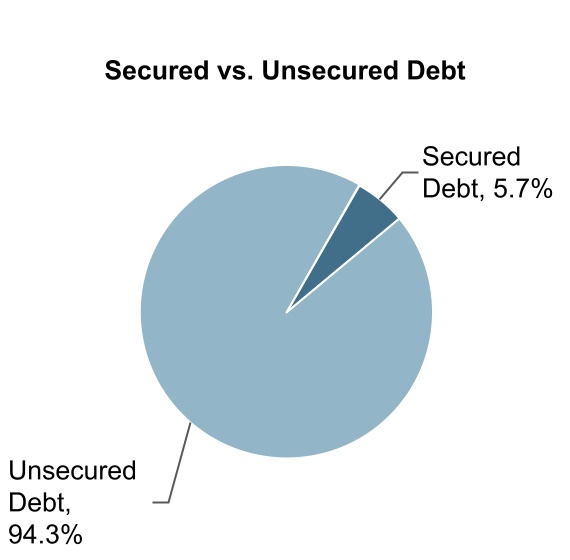
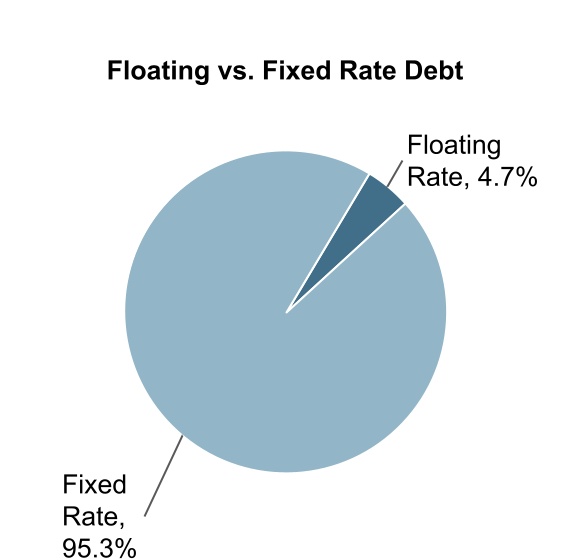
| | | | | | | | | | | | | | | | | | | | |
| | | | | | |
| TOTAL DEBT COMPOSITION (1) | |
| | | Weighted Average | |
| | Interest Rate | | Years to Maturity (2) | |
| Secured vs. Unsecured Debt | | | | | |
| Unsecured Debt | | 3.7% | | 6.3 | |
| Secured Debt | | 3.9% | | 4.1 | |
| Floating vs. Fixed-Rate Debt | | | |
| Floating-Rate Debt | | 5.2% | | 3.8 | |
| Fixed-Rate Debt | | 3.7% | | 6.2 | |
| | | | | | |
| Stated Interest Rate | | 3.7% | | 6.1 | |
| | | | | | |
| GAAP Effective Rate | | 3.8% | | | |
| | | | | | |
| GAAP Effective Rate Including Debt Issuance Costs | | 4.0% | | | |
| | | | | | |
| | | | | | | | | | | | | | | | | | | | |
| | | | | | |
| KEY DEBT COVENANTS (3) |
| | | Covenant | | Actual Performance
as of December 31, 2022 | |
| | | | | | |
| Unsecured Credit and Term Loan Facility and Private Placement Notes: | | | | | |
| Total debt to total asset value | | less than 60% | | 29% | |
| Fixed charge coverage ratio | | greater than 1.5x | | 3.8x | |
| Unsecured debt ratio | | greater than 1.67x | | 3.38x | |
| Unencumbered asset pool debt service coverage | | greater than 1.75x | | 4.53x | |
| | | | | | |
| Unsecured Senior Notes due 2024, 2025, 2028, 2029, 2030, 2032 and 2033: | | | | | |
| Total debt to total asset value | | less than 60% | | 37% | |
| Interest coverage | | greater than 1.5x | | 8.4x | |
| Secured debt to total asset value | | less than 40% | | 2% | |
| Unencumbered asset pool value to unsecured debt | | greater than 150% | | 294% | |
| | | | | | |
________________________
(1)As of December 31, 2022, there was no outstanding balance on the unsecured revolving credit facility.
(2)The maturity date of the unsecured term loan assumes the exercise of the two twelve-month extensions at the Company’s option.
(3)All covenant ratio titles utilize terms and are calculated as defined in the respective debt and credit agreements.
05
Non-GAAP Supplemental
Measures
| | | | | |
Q4 2022 Supplemental Financial Report | |
Management Statements on Non-GAAP Supplemental Measures
Included in this section are management’s statements regarding certain non-GAAP financial measures provided in this supplemental financial report and, with respect to Funds From Operations available to common stockholders and common unitholders (“FFO”), in the Company’s earnings release on February 1, 2023 and the reasons why management believes that these measures provide useful information to investors about the Company’s financial condition and results of operations.
Net Operating Income:
Management believes that Net Operating Income (“NOI”) is a useful supplemental measure of the Company’s operating performance. The Company defines NOI as follows: consolidated operating revenues (rental income and other property income) less consolidated property and related expenses (property expenses, real estate taxes and ground leases). Other real estate investment trusts (“REITs”) may use different methodologies for calculating NOI, and accordingly, the Company’s NOI may not be comparable to other REITs.
Because NOI excludes leasing costs, general and administrative expenses, interest expense, depreciation and amortization, other nonproperty income and losses, and gains and losses from property dispositions, it provides a performance measure that, when compared year over year, reflects the consolidated revenues and expenses directly associated with owning and operating commercial real estate and the impact to operations from trends in occupancy rates, rental rates, and operating costs, providing a perspective on operations not immediately apparent from net income. The Company uses NOI to evaluate its operating performance on a portfolio basis since NOI allows the Company to evaluate the impact that factors such as occupancy levels, lease structure, rental rates, and tenant base have on the Company’s results, margins and returns. In addition, management believes that NOI provides useful information to the investment community about the Company’s financial and operating performance when compared to other REITs since NOI is generally recognized as a standard measure of performance in the real estate industry.
However, NOI should not be viewed as an alternative measure of the Company’s financial performance since it does not reflect general and administrative expenses, leasing costs, interest expense, depreciation and amortization costs, other nonproperty income and losses and the level of capital expenditures necessary to maintain the operating performance of the Company’s properties, or trends in development and construction activities which are significant economic costs and activities that could materially impact the Company’s results from operations.
Same Store Net Operating Income:
Management believes that Same Store NOI is a useful supplemental measure of the Company’s operating performance. Same Store NOI represents the consolidated NOI for all of the properties that were owned and included in the Company's stabilized portfolio for two comparable reporting periods. Because Same Store NOI excludes the change in NOI from developed, redeveloped, acquired and disposed of and held for sale properties, it highlights operating trends such as occupancy levels, rental rates and operating costs on properties. Other REITs may use different methodologies for calculating Same Store NOI, and accordingly, the Company’s Same Store NOI may not be comparable to other REITs.
However, Same Store NOI should not be viewed as an alternative measure of the Company’s financial performance since it does not reflect the operations of the Company’s entire portfolio, nor does it reflect the impact of general and administrative expenses, leasing costs, interest expense, depreciation and amortization costs, other nonproperty income and losses and the level of capital expenditures necessary to maintain the operating performance of the Company’s properties, or trends in development and construction activities which are significant economic costs and activities that could materially impact the Company’s results from operations.
| | | | | |
Q4 2022 Supplemental Financial Report | |
Management Statements on Non-GAAP Supplemental Measures, continued
Same Store Cash Net Operating Income:
Management believes that Same Store Cash NOI is a useful supplemental measure of the Company’s operating performance. Same Store Cash NOI represents the consolidated NOI for all of the properties that were owned and included in the Company’s stabilized portfolio for two comparable reporting periods, adjusted for the net effect of straight-line rents, amortization of deferred revenue related to tenant-funded tenant improvements, amortization of above and below market lease intangibles, and the provision for bad debts. Because Same Store Cash NOI excludes the change in NOI from developed, redeveloped, acquired and disposed of and held for sale properties, it highlights operating trends on a cash basis such as occupancy levels, rental rates and operating costs on properties. Other REITs may use different methodologies for calculating Same Store Cash NOI, and accordingly, our Same Store Cash NOI may not be comparable to other REITs.
However, Same Store Cash NOI should not be viewed as an alternative measure of the Company’s financial performance since it does not reflect the operations of the Company's entire portfolio, nor does it reflect the impact of general and administrative expenses, acquisition-related expenses, interest expense, depreciation and amortization costs, other nonproperty income and losses, the level of capital expenditures and leasing costs necessary to maintain the operating performance of the Company's properties, or trends in development and construction activities which are significant economic costs and activities that could materially impact the Company's results from operations.
EBITDA, as adjusted:
Management believes that consolidated earnings before interest expense, depreciation and amortization, gain/loss on early extinguishment of debt, gains and losses on depreciable real estate, net income attributable to noncontrolling interests, preferred dividends and distributions, original issuance costs of redeemed preferred stock and preferred units, and impairment losses (“EBITDA, as adjusted”) is a useful supplemental measure of the Company’s operating performance. When considered with other GAAP measures and FFO, management believes EBITDA, as adjusted, gives the investment community a more complete understanding of the Company’s consolidated operating results, including the impact of general and administrative expenses and acquisition-related expenses, before the impact of investing and financing transactions and facilitates comparisons with competitors. Management also believes it is appropriate to present EBITDA, as adjusted, as it is used in several of the Company’s financial covenants for both its secured and unsecured debt. However, EBITDA, as adjusted, should not be viewed as an alternative measure of the Company’s operating performance since it excludes financing costs as well as depreciation and amortization costs which are significant economic costs that could materially impact the Company’s results of operations and liquidity. Other REITs may use different methodologies for calculating EBITDA, as adjusted, and, accordingly, the Company’s EBITDA, as adjusted, may not be comparable to other REITs. The Company’s calculation of EBITDA, as adjusted, is the same as EBITDAre, as defined by Nareit, as the Company does not have any unconsolidated joint ventures.
| | | | | |
Q4 2022 Supplemental Financial Report | |
Management Statements on Non-GAAP Supplemental Measures, continued
Funds From Operations:
The Company calculates Funds From Operations available to common stockholders and common unitholders (“FFO”) in accordance with the 2018 Restated White Paper on FFO approved by the Board of Governors of Nareit. The White Paper defines FFO as net income or loss calculated in accordance with GAAP, excluding extraordinary items, as defined by GAAP, gains and losses from sales of depreciable real estate and impairment write-downs associated with depreciable real estate, plus real estate-related depreciation and amortization (excluding amortization of deferred financing costs and depreciation of non-real estate assets) and after adjustment for unconsolidated partnerships and joint ventures. Our calculation of FFO includes the amortization of deferred revenue related to tenant-funded tenant improvements and excludes the depreciation of the related tenant improvement assets. We also add back net income attributable to noncontrolling common units of the Operating Partnership because we report FFO attributable to common stockholders and common unitholders.
Management believes that FFO is a useful supplemental measure of the Company’s operating performance. The exclusion from FFO of gains and losses from the sale of operating real estate assets allows investors and analysts to readily identify the operating results of the assets that form the core of the Company’s activity and assists in comparing those operating results between periods. Also, because FFO is generally recognized as the industry standard for reporting the operations of REITs, it facilitates comparisons of operating performance to other REITs. However, other REITs may use different methodologies to calculate FFO, and accordingly, the Company’s FFO may not be comparable to all other REITs.
Implicit in historical cost accounting for real estate assets in accordance with GAAP is the assumption that the value of real estate assets diminishes predictably over time. Since real estate values have historically risen or fallen with market conditions, many industry investors and analysts have considered presentations of operating results for real estate companies using historical cost accounting alone to be insufficient. Because FFO excludes depreciation and amortization of real estate assets, management believes that FFO along with the required GAAP presentations provides a more complete measurement of the Company’s performance relative to its competitors and a more appropriate basis on which to make decisions involving operating, financing and investing activities than the required GAAP presentations alone would provide.
However, FFO should not be viewed as an alternative measure of the Company’s operating performance since it does not reflect either depreciation and amortization costs or the level of capital expenditures and leasing costs necessary to maintain the operating performance of the Company’s properties, which are significant economic costs and could materially impact the Company’s results from operations.
Funds Available for Distribution:
Management believes that Funds Available for Distribution available to common stockholders and common unitholders (“FAD”) is a useful supplemental measure of the Company’s liquidity. The Company computes FAD by adding to FFO the non-cash amortization of deferred financing costs, debt discounts and premiums and share-based compensation awards, amortization of above (below) market rents for acquisition properties and non-cash executive compensation expense then subtracting recurring tenant improvements, leasing commissions and capital expenditures and eliminating the net effect of straight-line rents, amortization of deferred revenue related to tenant improvements, adjusting for other lease related items and amounts of gain or loss on marketable securities related to the Company’s executive deferred compensation plan that are capitalized as development costs, and after adjustment for amounts attributable to noncontrolling interests in consolidated property partnerships. FAD provides an additional perspective on the Company’s ability to fund cash needs and make distributions to stockholders by adjusting FFO for the impact of certain cash and non-cash items, as well as adjusting FFO for recurring capital expenditures and leasing costs. Management also believes that FAD provides useful information to the investment community about the Company’s financial position as compared to other REITs since FAD is a liquidity measure used by other REITs. However, other REITs may use different methodologies for calculating FAD and, accordingly, the Company’s FAD may not be comparable to other REITs.
06
Definitions and Reconciliations
| | | | | |
Q4 2022 Supplemental Financial Report | |
Definitions Included in Supplemental
Annualized Base Rent:
Includes the impact of straight-lining rent escalations and the amortization of free rent periods and excludes the impact of the following: amortization of deferred revenue related to tenant-funded tenant improvements, amortization of above/below market rents, amortization for lease incentives due under existing leases, and expense reimbursement revenue. Additionally, the underlying leases contain various expense structures including full service gross, modified gross and triple net. Amounts represent percentage of total portfolio annualized contractual base rental revenue.
Change in GAAP / Cash Rents (Leases Commenced):
Calculated as the change between GAAP / cash rents for new/renewed leases and the expiring GAAP / cash rents for the same space. Includes leases for which re-leasing timing was impacted by the COVID-19 pandemic and restrictions intended to prevent its spread. Excludes leases for which the space was vacant when the property was acquired by the Company.
Change in GAAP / Cash Rents (Leases Executed):
Calculated as the change between GAAP / cash rents for signed leases and the expiring GAAP / cash rents for the same space. Includes leases for which re-leasing timing was impacted by the COVID-19 pandemic and restrictions intended to prevent its spread. Excludes leases for which the space was vacant when the property was acquired by the Company.
Estimated Stabilization Date (Development):
Management’s estimation of the earlier of stabilized occupancy (95%) or one year from the date of the cessation of major base building construction activities for office and retail properties and upon substantial completion for residential properties.
FAD Payout Ratio:
Calculated as current-quarter dividends accrued to common stockholders and common unitholders (excluding dividend equivalents accrued to restricted stock unitholders) divided by FAD.
First Generation Capital Expenditures:
Capital expenditures for newly acquired space, newly developed, and redeveloped space, or a significant change in use or repositioning of space that result in additional revenue generated when the space is re-leased. These costs are not subtracted in our calculation of FAD.
Fixed Charge Coverage Ratio - EBITDA:
Calculated as EBITDA, as adjusted, divided by gross interest expense (excluding amortization of deferred debt costs and debt discounts/premiums) and current year accrued preferred dividends.
Fixed Charge Coverage Ratio - Net Income:
Calculated as net income, divided by gross interest expense (excluding amortization of deferred debt costs and debt discounts/premiums) and current year accrued preferred dividends.
FFO Payout Ratio:
Calculated as current-quarter dividends accrued to common stockholders and common unitholders (excluding dividend equivalents accrued to restricted stock unitholders) divided by FFO attributable to common stockholders and unitholders.
| | | | | |
Q4 2022 Supplemental Financial Report | |
Definitions Included in Supplemental, continued
GAAP Effective Rate:
The rate at which interest expense is recorded for financial reporting purposes, which reflects the amortization of any discounts/premiums, excluding debt issuance costs.
Interest Coverage Ratio:
Calculated as EBITDA, as adjusted, divided by gross interest expense (excluding amortization of deferred debt costs and debt discounts/premiums).
Net Effect of Straight-Line Rents:
Represents the straight-line rent income recognized during the period offset by cash received during the period that was applied to deferred rents receivable balances for terminated leases and the provision for bad debts recorded for deferred rent receivable balances.
Net Income Payout Ratio:
Calculated as current-quarter dividends accrued to common stockholders and common unitholders (excluding dividend equivalents accrued to restricted stock unitholders) divided by net income.
Net Operating Income Margins:
Calculated as net operating income divided by total revenues.
Retention Rates (Leases Commenced):
Calculated as the percentage of space either renewed or expanded into by existing tenants or subtenants at lease expiration.
Same Store Portfolio:
Our Same Store Portfolio includes all of our properties owned and included in our stabilized portfolio for two comparable reporting periods, i.e., owned and included in our stabilized portfolio as of January 1, 2021 and still owned and included in the stabilized portfolio as of December 31, 2022. It does not include undeveloped land, development and redevelopment properties currently committed for construction, under construction, or in the tenant improvement phase, completed residential developments not yet stabilized and properties held-for-sale. We define redevelopment properties as those projects for which we expect to spend significant development and construction costs on existing or acquired buildings pursuant to a formal plan, the intended result of which is a higher economic return on the property.
Second Generation Capital Expenditures:
Second generation leasing includes space in the stabilized portfolio where we have made capital expenditures to maintain the current market revenue stream; generally recurring in nature or related to space previously occupied.
Stated Interest Rate:
The rate at which interest expense is recorded per the respective loan documents, excluding the impact of the amortization of any debt discounts/premiums.
Tenant Improvement Phase:
Represents projects that have reached cold shell condition and are ready for tenant improvements, which may require additional major base building construction before being placed in service.
| | | | | |
Q4 2022 Supplemental Financial Report | |
Reconciliation of Net Income Available to Common Stockholders to Same Store Net Operating Income
(unaudited, $ in thousands)
| | | | | | | | | | | | | | | | | | | | | | | | | | | | | | | | |
| | | Three Months Ended December 31, | | Year Ended December 31, | |
| | | 2022 | | 2021 | | 2022 | | 2021 | |
| Net Income Available to Common Stockholders | | $ | 52,625 | | | $ | 47,646 | | | $ | 232,615 | | | $ | 628,144 | | |
| Net income attributable to noncontrolling common units of the Operating Partnership | | 588 | | | 463 | | | 2,283 | | | 6,163 | | |
| Net income attributable to noncontrolling interests in consolidated property partnerships | | 6,262 | | | 7,017 | | | 24,595 | | | 24,603 | | |
| | | | | | | | | | |
| Net Income | | 59,475 | | | 55,126 | | | 259,493 | | | 658,910 | | |
| Adjustments: | | | | | | | | | |
| General and administrative expenses | | 25,217 | | | 23,267 | | | 93,642 | | | 92,749 | | |
| | | | | | | | | | |
| Leasing costs | | 1,404 | | | 876 | | | 4,879 | | | 3,249 | | |
| Depreciation and amortization | | 91,396 | | | 87,309 | | | 357,611 | | | 310,043 | | |
| Interest income and other income, net | | (1,264) | | | (230) | | | (1,765) | | | (3,916) | | |
| Interest expense | | 23,550 | | | 18,726 | | | 84,278 | | | 78,555 | | |
| Loss on early extinguishment of debt | | — | | | 12,246 | | | — | | | 12,246 | | |
| | | | | | | | | | |
| Gain on sale of depreciable operating property | | — | | | (5,297) | | | (17,329) | | | (463,128) | | |
| Net Operating Income, as defined (1) | | 199,778 | | | 192,023 | | | 780,809 | | | 688,708 | | |
| Wholly-Owned Properties | | 174,983 | | | 165,304 | | | 682,260 | | | 587,143 | | |
| Consolidated property partnerships: (2) | | | | | | | | | |
| 100 First Street (3) | | 6,116 | | | 5,861 | | | 23,593 | | | 24,560 | | |
| 303 Second Street (3) | | 12,702 | | | 14,846 | | | 50,998 | | | 53,080 | | |
| Crossing/900 (4) | | 5,977 | | | 6,012 | | | 23,958 | | | 23,925 | | |
| Net Operating Income, as defined (1) | | 199,778 | | | 192,023 | | | 780,809 | | | 688,708 | | |
| Non-Same Store Net Operating Income (5) | | (42,336) | | | (31,220) | | | (155,046) | | | (81,426) | | |
| Same Store Net Operating Income | | 157,442 | | | 160,803 | | | 625,763 | | | 607,282 | | |
| GAAP to Cash Adjustments: | | | | | | | | | |
| GAAP Operating Revenues Adjustments, net (6) | | (5,559) | | | (7,847) | | | (26,589) | | | (47,099) | | |
| GAAP Operating Expenses Adjustments, net | | 97 | | | 105 | | | 409 | | | 389 | | |
| Same Store Cash Net Operating Income | | $ | 151,980 | | | $ | 153,061 | | | $ | 599,583 | | | $ | 560,572 | | |
| | | | | | | | | | |
________________________
(1)Please refer to pages 34-35 for Management Statements on Net Operating Income, Same Store Net Operating Income and Same Store Cash Net Operating Income.
(2)Reflects Net Operating Income for all periods presented.
(3)For all periods presented, an unrelated third party entity owned approximately 44% common equity interests in two properties located at 100 First Street and 303 Second Street in San Francisco, CA.
(4)For all periods presented, an unrelated third party entity owned an approximate 7% common equity interest in two properties located at 900 Jefferson Avenue and 900 Middlefield Road in Redwood City, CA.
(5)Includes the results of one office property disposed of during the first quarter 2021, two office operating properties disposed of during the fourth quarter 2021, one office operating property disposed of in the third quarter of 2022, our 193-unit residential project added to the stabilized portfolio in the second quarter of 2021, one office development building added to the stabilized portfolio in the second quarter of 2021, two office development buildings added to the stabilized portfolio in the third quarter of 2021, two office development buildings added to the stabilized portfolio in the fourth quarter of 2021, one office development building added to the stabilized portfolio during the second quarter of 2022, one office development building and two life science redevelopment buildings added to the stabilized portfolio during the third quarter of 2022, one operating property acquired during the third quarter of 2021, and our in-process and future development projects.
(6)Includes the net effect of straight-line rents, amortization of deferred revenue related to tenant-funded tenant improvements, amortization of above and below market lease intangibles and revenue reversals (recoveries) related to tenant creditworthiness.
| | | | | |
Q4 2022 Supplemental Financial Report | |
Reconciliation of Net Income Available to Common Stockholders to EBITDA, as Adjusted
(unaudited, $ in thousands)
| | | | | | | | | | | | | | | | | | | | |
| | | Three Months Ended December 31, | |
| | | 2022 | | 2021 | |
| Net Income Available to Common Stockholders | | $ | 52,625 | | | $ | 47,646 | | |
| Interest expense | | 23,550 | | | 18,726 | | |
| Depreciation and amortization | | 91,396 | | | 87,309 | | |
| Loss on early extinguishment of debt | | — | | | 12,246 | | |
| Net income attributable to noncontrolling common units of the Operating Partnership | | 588 | | | 463 | | |
| Net income attributable to noncontrolling interests in consolidated property partnerships | | 6,262 | | | 7,017 | | |
| Gain on sale of depreciable operating property | | — | | | (5,297) | | |
| | | | | | |
| | | | | | |
| | | | | | |
| EBITDA, as adjusted (1) | | $ | 174,421 | | | $ | 168,110 | | |
| | | | | | |
________________________
(1)Please refer to page 35 for a Management Statement on EBITDA, as adjusted. The Company’s calculation of EBITDA, as adjusted, is the same as EBITDAre, as defined by Nareit, as the Company does not have any unconsolidated joint ventures.