
January 2023 NASDAQ: FBMS
2 Safe Harbor & Forward Looking Statements FORWARD LOOKING STATEMENTS This communication
contains “forward-looking statements” as defined in the Private Securities Litigation Reform Act of 1995. In general, forward-looking statements usually use words such as “may,” “believe,” “expect,” “anticipate,” “intend,” “will,” “should,”
“plan,” “estimate,” “predict,” “continue” and “potential” or the negative of these terms or other comparable terminology. Forward-looking statements represent management’s beliefs, based upon information available at the time the statements
are made, with regard to the matters addressed. Such forward-looking statements are not guarantees of future performance. Actual results may differ materially from those contemplated by such forward-looking statements. Factors that might
cause such differences include, but are not limited to: (1) competitive pressures among financial institutions increasing significantly; (2) prevailing, or changes in economic or political conditions, either nationally or locally,
particularly in areas in which the Company conducts operations, including the effects of declines in the real estate market, high unemployment rates, inflationary pressure, elevated interest rates and slowdowns in economic growth, as well as
the financial stress on borrowers as a result of the foregoing; (3) interest rate risk, including the effects of rising interest rates; (4) developments in our mortgage banking business, including loan modifications, general demand, and the
effects of judicial or regulatory requirements or guidance; (5) changes in applicable laws, rules, or regulations; (6) risks related to the Company’s recently completed and pending acquisitions, including that the anticipated benefits from
the recently completed acquisitions are not realized in the time frame anticipated or at all as a result of changes in general economic and market conditions or other unexpected factors or events; (7) changes in management’s plans for the
future; (8) credit risk associated with our lending activities; (9) changes in loan demand, real estate values, or competition; (10) changes in accounting principles, policies, or guidelines; (11) adverse results from current or future
litigation, regulatory examinations or other legal and/or regulatory actions, including as a result of the Company’s participation in and execution of government programs related to the COVID-19 pandemic and related variants; (12) higher
inflation and its impacts; (13) significant turbulence or disruption in the capital or financial markets and the effect of a fall in stock market prices on our investment securities; (14) the effects of war or other conflicts including the
impacts relating to or resulting from Russia’s military action in Ukraine; (15) a deterioration of the credit rating for U.S. long-term sovereign debt, actions that the U.S. government may take to avoid exceeding the debt ceiling, or
uncertainties surrounding the debt ceiling and the federal budget; and (16) other general competitive, economic, political, and market factors, including those affecting our business, operations, pricing, products, or services. The Company
does not undertake any obligation to update or revise any forward-looking statements, whether as a result of new information, future events or otherwise. For any forward-looking statements made in this communication, any exhibits hereto or
any related documents, the Company claims protection of the safe harbor for forward-looking statements contained in the Private Securities Litigation Reform Act of 1995. ABOUT THE FIRST BANCSHARES, INC. The First Bancshares, Inc. (“FBMS” or
the “Company”), headquartered in Hattiesburg, Mississippi, is the parent company of The First Bank. Founded in 1996, The First has operations in Mississippi, Louisiana, Alabama, Florida and Georgia. The Company’s stock is traded on NASDAQ
Global Market under the symbol FBMS. Contact: Chandra Kidd, Corporate Secretary. NON-GAAP FINANCIAL MEASURES FBMS reports its results in accordance with United States generally accepted accounting principles (“GAAP”). However, management
believes that certain non-GAAP performance measures used in managing the business may provide meaningful information about underlying trends in its business. Non-GAAP financial measures should be viewed in addition to, and not as an
alternative for, FBMS’s reported results prepared in accordance with GAAP.
3 The First Bancshares: Building Shareholder Value
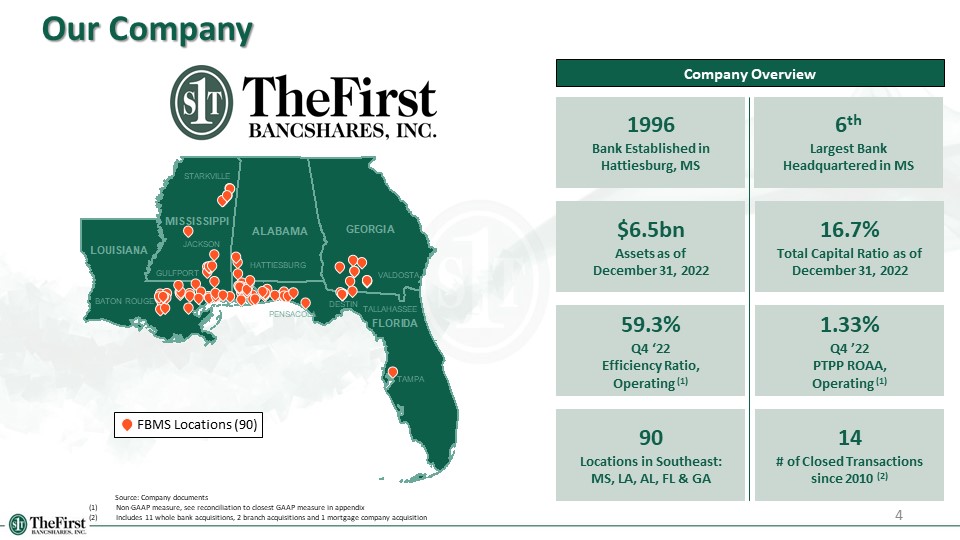
59.3% Q4 ‘22 Efficiency Ratio, Operating (1) 16.7% Total Capital Ratio as of December 31,
2022 6th Largest Bank Headquartered in MS $6.5bn Assets as of December 31, 2022 14 # of Closed Transactions since 2010 (2) 4 Our Company Company Overview 90 Locations in Southeast: MS, LA, AL, FL & GA 1996 Bank
Established in Hattiesburg, MS Source: Company documents Non-GAAP measure, see reconciliation to closest GAAP measure in appendix Includes 11 whole bank acquisitions, 2 branch acquisitions and 1 mortgage company acquisition 1.33% Q4
’22 PTPP ROAA, Operating (1) FBMS Locations (90) STARKVILLE BATON ROUGE JACKSON TAMPA GULFPORT HATTIESBURG VALDOSTA TALLAHASSEE DESTIN PENSACOLA
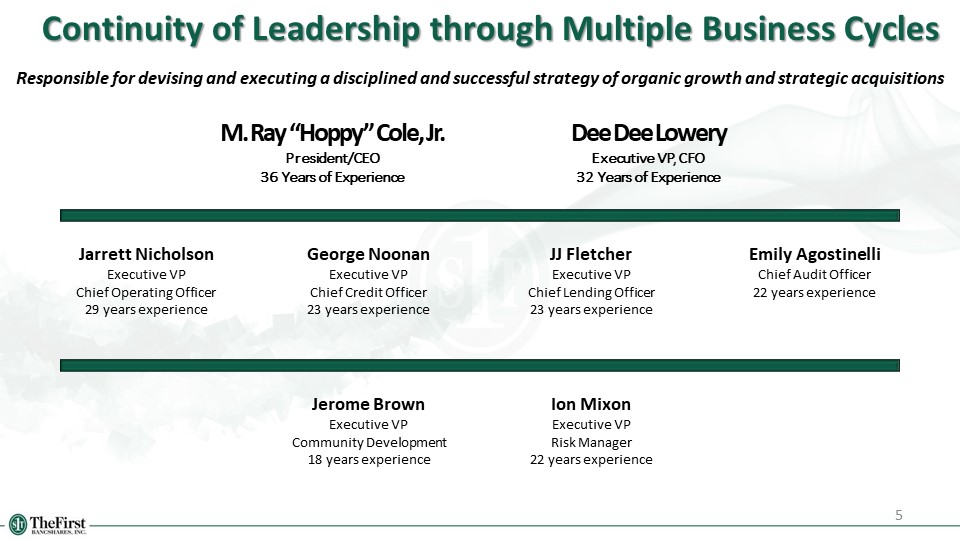
Continuity of Leadership through Multiple Business Cycles 5 Responsible for devising and executing a
disciplined and successful strategy of organic growth and strategic acquisitions Jarrett Nicholson Executive VP Chief Operating Officer 29 years experience M. Ray “Hoppy” Cole, Jr. President/CEO 36 Years of Experience Dee Dee
Lowery Executive VP, CFO 32 Years of Experience George Noonan Executive VP Chief Credit Officer 23 years experience Jerome Brown Executive VP Community Development 18 years experience Ion Mixon Executive VP Risk Manager 22 years
experience JJ Fletcher Executive VP Chief Lending Officer 23 years experience Emily Agostinelli Chief Audit Officer 22 years experience
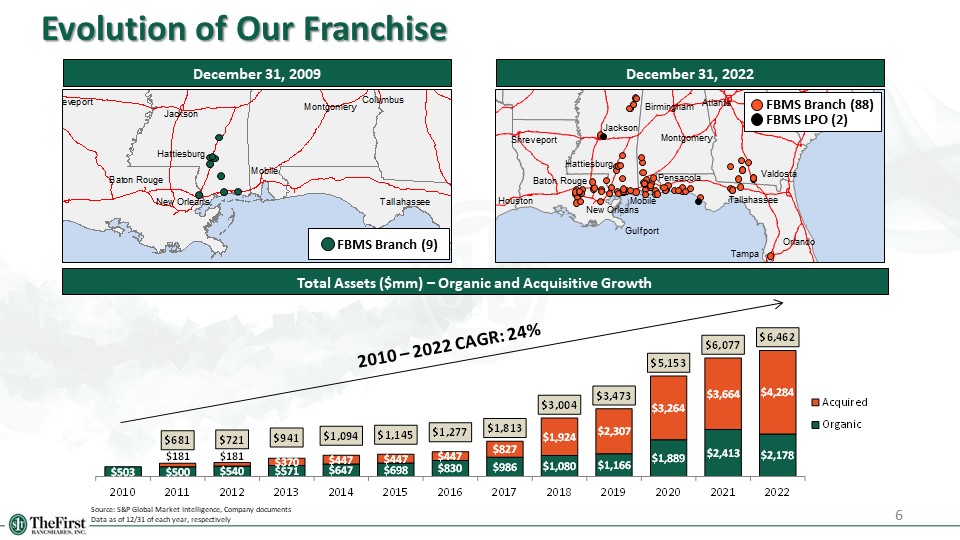
Evolution of Our Franchise December 31, 2009 Total Assets ($mm) – Organic and Acquisitive Growth
FBMS Branch (9) Hattiesburg Source: S&P Global Market Intelligence, Company documents Data as of 12/31 of each year, respectively 6 December 31, 2022 2010 – 2022 CAGR:
24% Valdosta Tallahassee Atlanta Mobile Jackson Montgomery Baton Rouge New Orleans Shreveport Houston Tampa Birmingham Orlando Hattiesburg Gulfport Pensacola FBMS Branch (88) FBMS LPO (2)
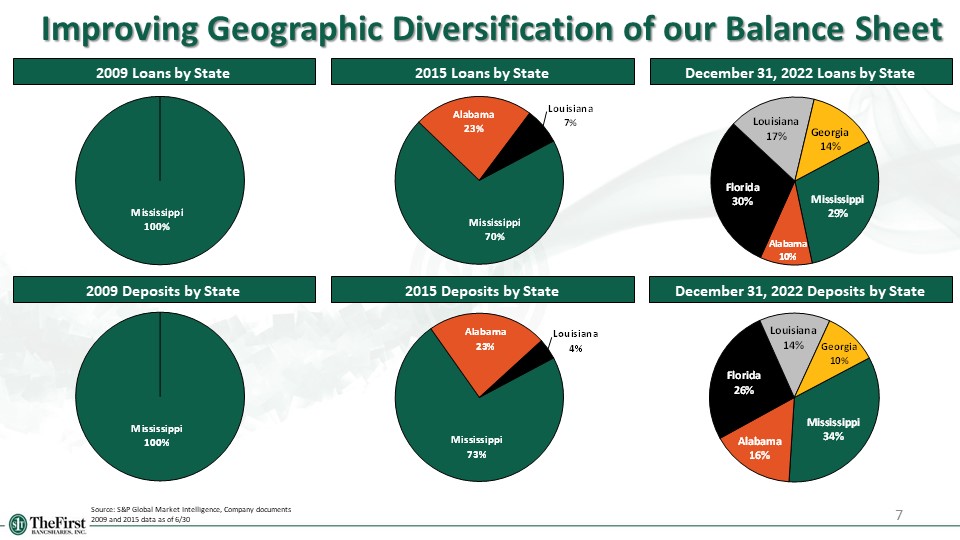
Improving Geographic Diversification of our Balance Sheet 7 2015 Deposits by State December 31, 2022
Deposits by State Source: S&P Global Market Intelligence, Company documents 2009 and 2015 data as of 6/30 2015 Loans by State December 31, 2022 Loans by State 2009 Loans by State 2009 Deposits by State
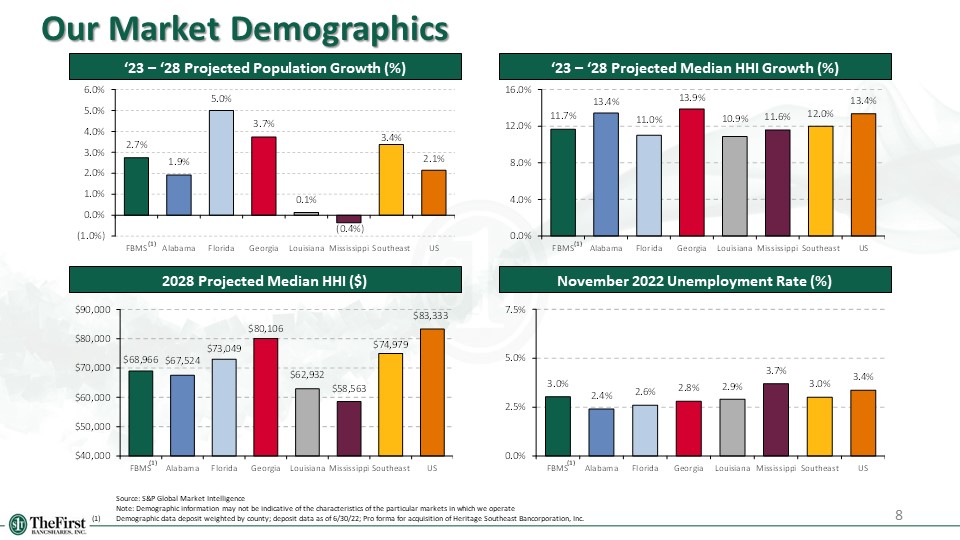
Our Market Demographics 8 Source: S&P Global Market Intelligence Note: Demographic
information may not be indicative of the characteristics of the particular markets in which we operate (1) Demographic data deposit weighted by county; deposit data as of 6/30/22; Pro forma for acquisition of Heritage Southeast
Bancorporation, Inc. ‘23 – ‘28 Projected Population Growth (%) ‘23 – ‘28 Projected Median HHI Growth (%) 2028 Projected Median HHI ($) November 2022 Unemployment Rate (%) (1) (1) (1) (1)
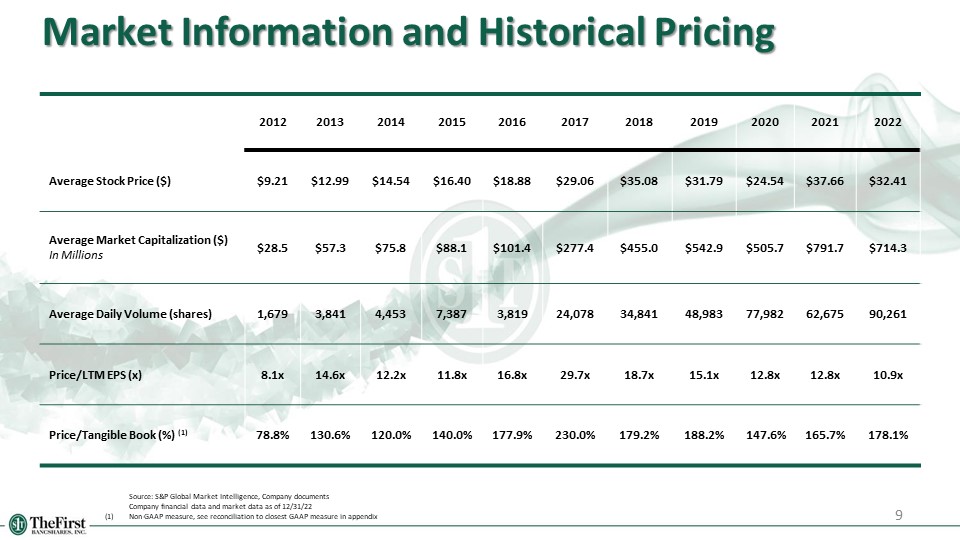
9 2012 2013 2014 2015 2016 2017 2018 2019 2020 2021 2022 Average Stock Price
($) $9.21 $12.99 $14.54 $16.40 $18.88 $29.06 $35.08 $31.79 $24.54 $37.66 $32.41 Average Market Capitalization ($) In Millions $28.5 $57.3 $75.8 $88.1 $101.4 $277.4 $455.0 $542.9 $505.7 $791.7 $714.3 Average Daily
Volume (shares) 1,679 3,841 4,453 7,387 3,819 24,078 34,841 48,983 77,982 62,675 90,261 Price/LTM EPS (x) 8.1x 14.6x 12.2x 11.8x 16.8x 29.7x 18.7x 15.1x 12.8x 12.8x 10.9x Price/Tangible Book (%)
(1) 78.8% 130.6% 120.0% 140.0% 177.9% 230.0% 179.2% 188.2% 147.6% 165.7% 178.1% Market Information and Historical Pricing Source: S&P Global Market Intelligence, Company documents Company financial data and market data as
of 12/31/22 (1) Non-GAAP measure, see reconciliation to closest GAAP measure in appendix
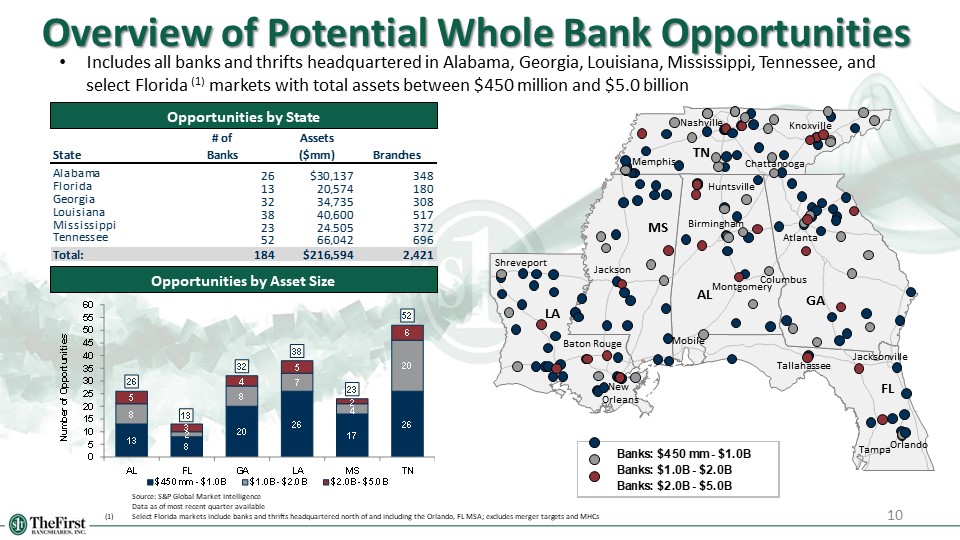
10 Overview of Potential Whole Bank Opportunities Source: S&P Global Market Intelligence Data
as of most recent quarter available (1) Select Florida markets include banks and thrifts headquartered north of and including the Orlando, FL MSA; excludes merger targets and MHCs Opportunities by State Opportunities by Asset
Size Includes all banks and thrifts headquartered in Alabama, Georgia, Louisiana, Mississippi, Tennessee, and select Florida (1) markets with total assets between $450 million and $5.0
billion Knoxville Nashville Atlanta Orlando Tallahassee New Orleans Baton Rouge Shreveport Jackson Memphis Jacksonville Tampa Birmingham Mobile Columbus Huntsville Chattanooga FL GA AL MS LA TN Montgomery
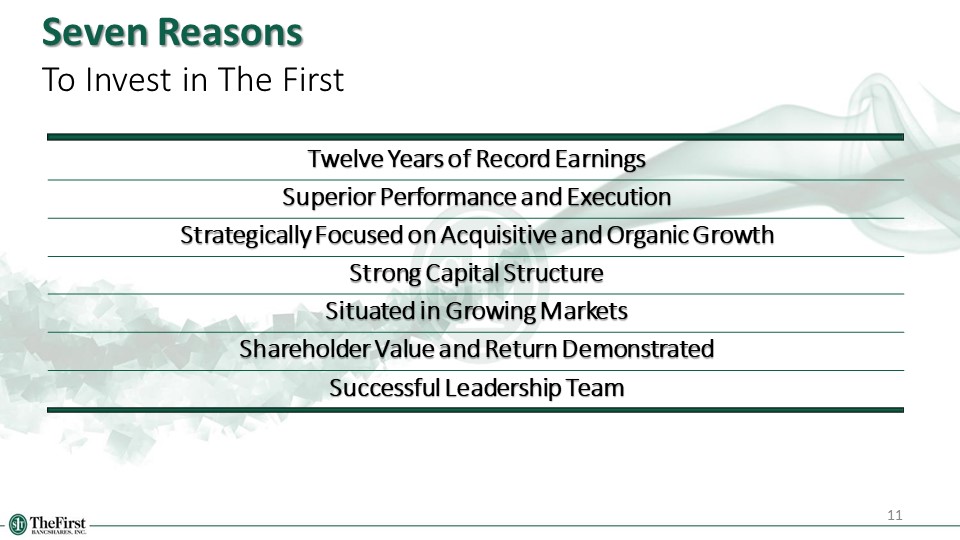
Twelve Years of Record Earnings Superior Performance and Execution Strategically Focused on
Acquisitive and Organic Growth Strong Capital Structure Situated in Growing Markets Shareholder Value and Return Demonstrated Successful Leadership Team 11 Seven Reasons To Invest in The First
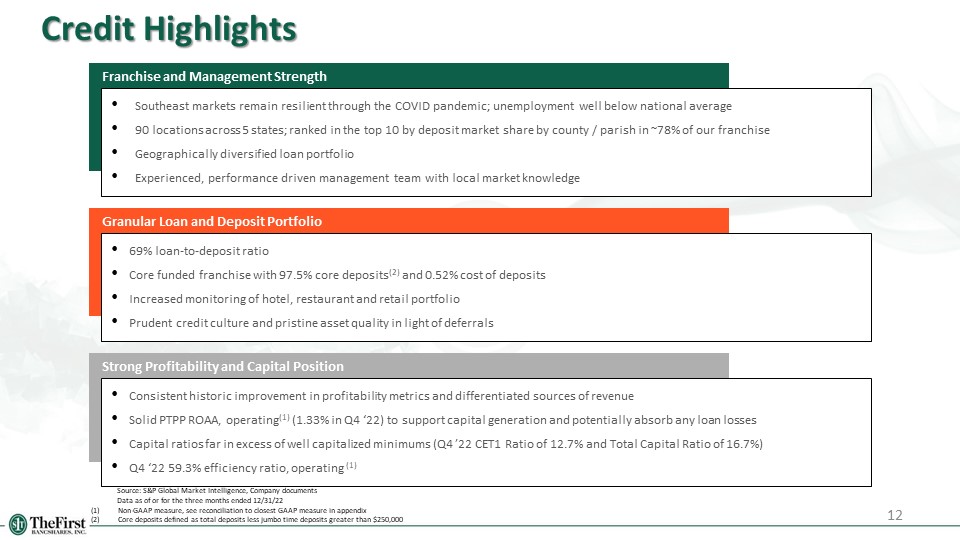
12 Credit Highlights Franchise and Management Strength Southeast markets remain resilient through
the COVID pandemic; unemployment well below national average 90 locations across 5 states; ranked in the top 10 by deposit market share by county / parish in ~78% of our franchise Geographically diversified loan portfolio Experienced,
performance driven management team with local market knowledge Granular Loan and Deposit Portfolio 69% loan-to-deposit ratio Core funded franchise with 97.5% core deposits(2) and 0.52% cost of deposits Increased monitoring of hotel,
restaurant and retail portfolio Prudent credit culture and pristine asset quality in light of deferrals Strong Profitability and Capital Position Consistent historic improvement in profitability metrics and differentiated sources of
revenue Solid PTPP ROAA, operating(1) (1.33% in Q4 ‘22) to support capital generation and potentially absorb any loan losses Capital ratios far in excess of well capitalized minimums (Q4 ’22 CET1 Ratio of 12.7% and Total Capital Ratio of
16.7%) Q4 ‘22 59.3% efficiency ratio, operating (1) Source: S&P Global Market Intelligence, Company documents Data as of or for the three months ended 12/31/22 Non-GAAP measure, see reconciliation to closest GAAP measure in
appendix Core deposits defined as total deposits less jumbo time deposits greater than $250,000
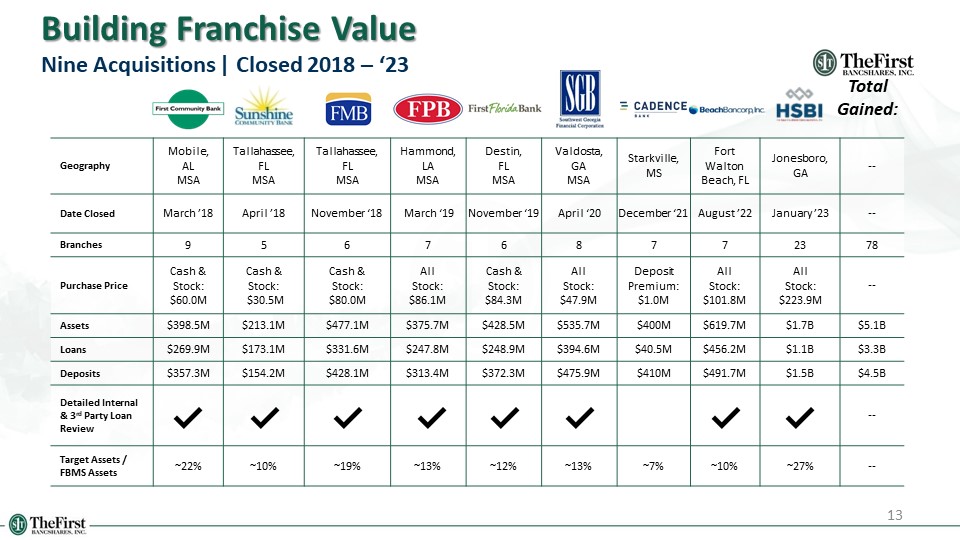
Building Franchise Value Nine Acquisitions | Closed 2018 – ‘23 Geography Mobile, AL
MSA Tallahassee, FL MSA Tallahassee, FL MSA Hammond, LA MSA Destin, FL MSA Valdosta, GA MSA Starkville, MS Fort Walton Beach, FL Jonesboro, GA -- Date Closed March ’18 April ’18 November ‘18 March ‘19 November
‘19 April ‘20 December ‘21 August ’22 January ’23 -- Branches 9 5 6 7 6 8 7 7 23 78 Purchase Price Cash & Stock: $60.0M Cash & Stock: $30.5M Cash & Stock: $80.0M All Stock: $86.1M Cash &
Stock: $84.3M All Stock: $47.9M Deposit Premium: $1.0M All Stock: $101.8M All Stock:
$223.9M -- Assets $398.5M $213.1M $477.1M $375.7M $428.5M $535.7M $400M $619.7M $1.7B $5.1B Loans $269.9M $173.1M $331.6M $247.8M $248.9M $394.6M $40.5M $456.2M $1.1B $3.3B Deposits $357.3M $154.2M $428.1M $313.4M $372.3M $475.9M $410M $491.7M $1.5B $4.5B Detailed
Internal & 3rd Party Loan Review -- Target Assets / FBMS Assets ~22% ~10% ~19% ~13% ~12% ~13% ~7% ~10% ~27% -- Total Gained: 13

14 Financial results
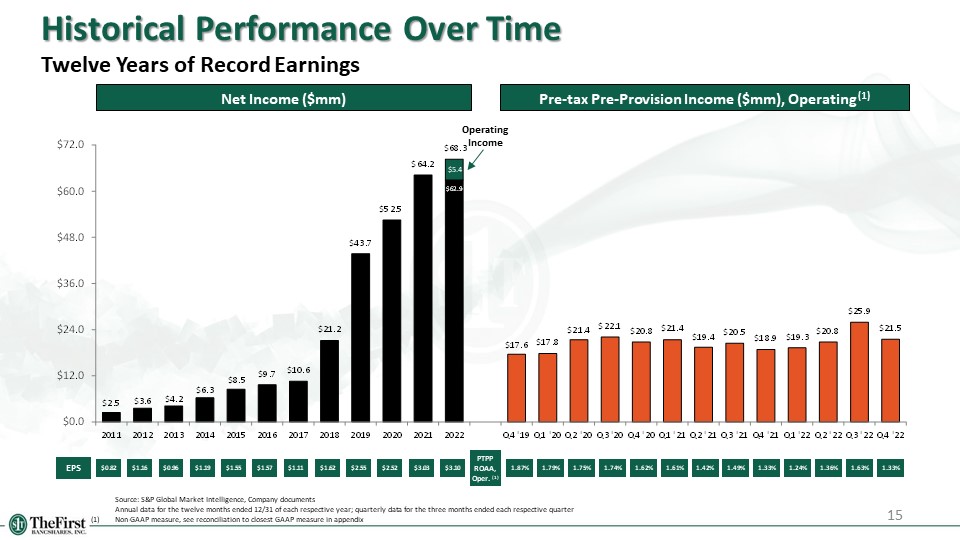
EPS Net Income ($mm) 15 Pre-tax Pre-Provision Income ($mm), Operating (1) PTPP ROAA, Oper. (1)
Source: S&P Global Market Intelligence, Company documents Annual data for the twelve months ended 12/31 of each respective year; quarterly data for the three months ended each respective quarter (1) Non-GAAP measure, see
reconciliation to closest GAAP measure in appendix Historical Performance Over Time Twelve Years of Record
Earnings $0.82 $1.16 $0.96 $1.19 $1.55 $1.57 $1.11 $1.62 $2.55 $2.52 1.62% 1.74% 1.75% 1.79% 1.87% 1.61% 1.42% 1.49% $3.03 1.33% 1.24% 1.36% 1.63% $3.10 1.33% Operating Income $5.4
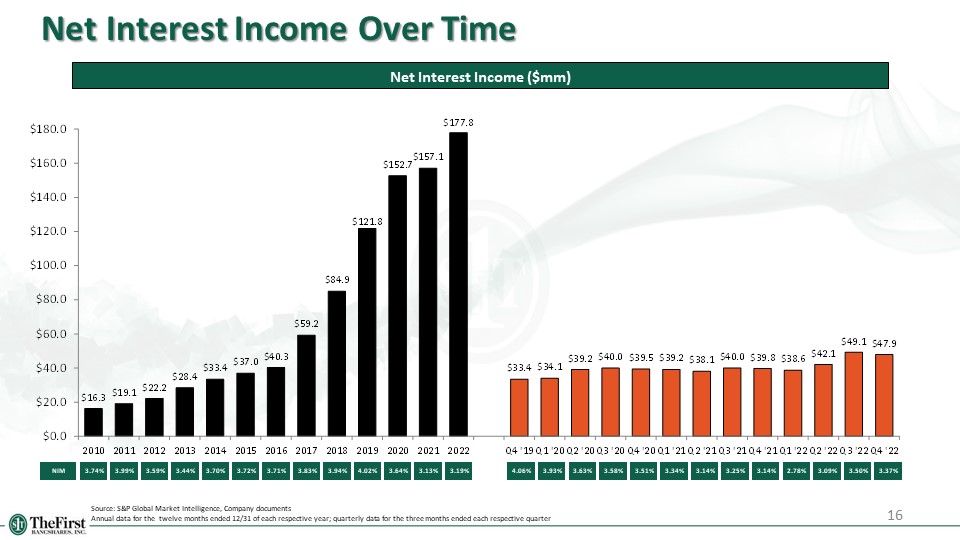
Net Interest Income Over Time 3.74% 3.99% 3.59% 3.44% 3.70% 3.72% 3.71% Net Interest Income
($mm) NIM 3.34% 3.83% 3.94% 4.06% 3.93% 3.63% 3.58% 3.51% 4.02% Source: S&P Global Market Intelligence, Company documents Annual data for the twelve months ended 12/31 of each respective year; quarterly data for the three
months ended each respective quarter 3.13% 3.14% 3.25% 16 3.64% 3.14% 2.78% 3.09% 3.50% 3.19% 3.37%
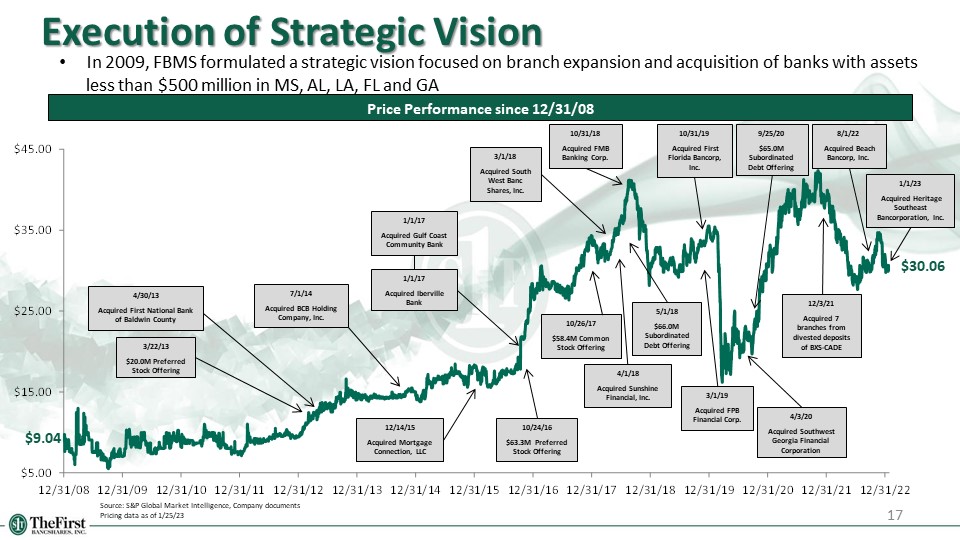
Execution of Strategic Vision 17 Source: S&P Global Market Intelligence, Company
documents Pricing data as of 1/25/23 Price Performance since 12/31/08 In 2009, FBMS formulated a strategic vision focused on branch expansion and acquisition of banks with assets less than $500 million in MS, AL, LA, FL and
GA $9.04 $30.06 3/22/13 $20.0M Preferred Stock Offering 4/30/13 Acquired First National Bank of Baldwin County 12/14/15 Acquired Mortgage Connection, LLC 10/24/16 $63.3M Preferred Stock Offering 1/1/17 Acquired Gulf Coast
Community Bank 1/1/17 Acquired Iberville Bank 10/26/17 $58.4M Common Stock Offering 3/1/18 Acquired South West Banc Shares, Inc. 4/1/18 Acquired Sunshine Financial, Inc. 5/1/18 $66.0M Subordinated Debt Offering 10/31/18 Acquired
FMB Banking Corp. 3/1/19 Acquired FPB Financial Corp. 10/31/19 Acquired First Florida Bancorp, Inc. 7/1/14 Acquired BCB Holding Company, Inc. 4/3/20 Acquired Southwest Georgia Financial Corporation 9/25/20 $65.0M Subordinated Debt
Offering 12/3/21 Acquired 7 branches from divested deposits of BXS-CADE 8/1/22 Acquired Beach Bancorp, Inc. 1/1/23 Acquired Heritage Southeast Bancorporation, Inc.
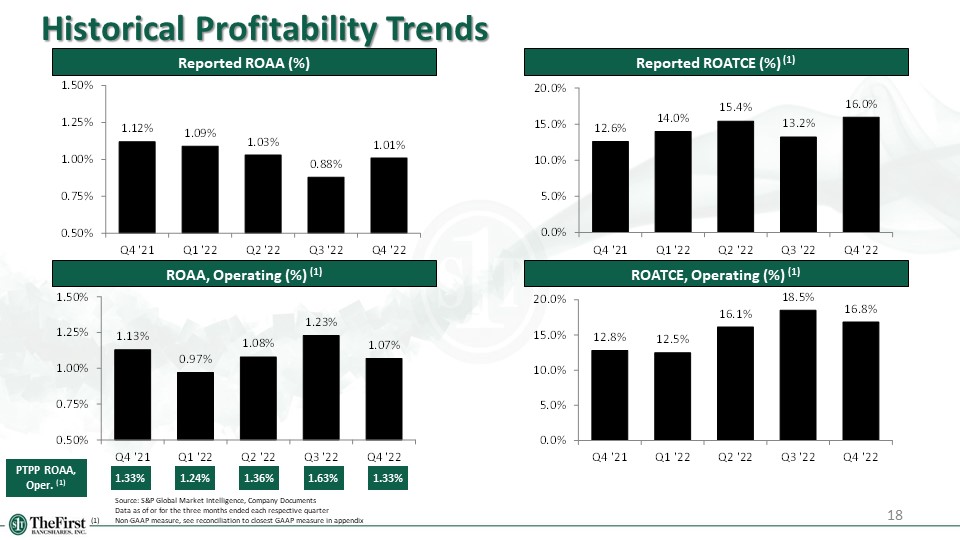
Historical Profitability Trends 18 Source: S&P Global Market Intelligence, Company Documents
Data as of or for the three months ended each respective quarter (1) Non-GAAP measure, see reconciliation to closest GAAP measure in appendix Reported ROAA (%) ROAA, Operating (%) (1) Reported ROATCE (%) (1) ROATCE, Operating (%)
(1) PTPP ROAA, Oper. (1) 1.33% 1.24% 1.36% 1.63% 1.33%
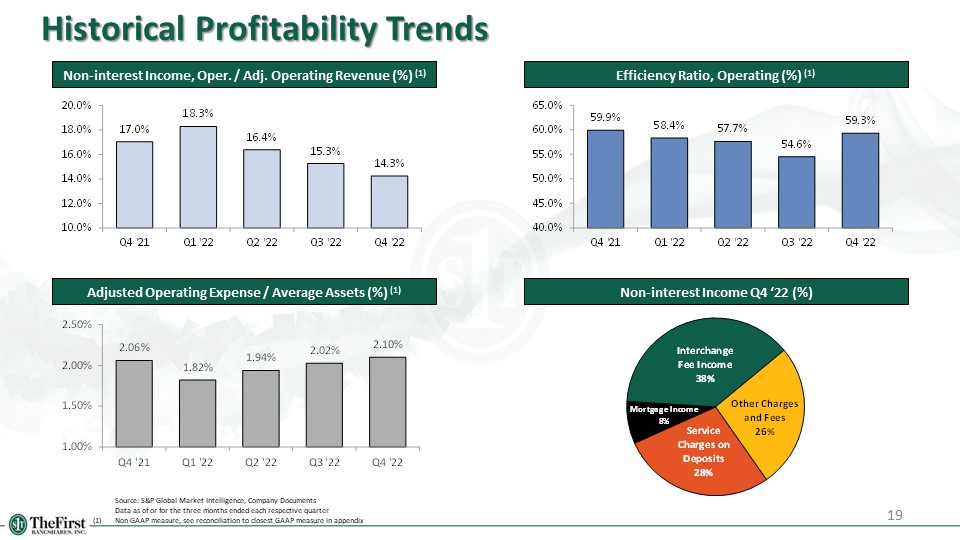
19 Historical Profitability Trends Non-interest Income, Oper. / Adj. Operating Revenue (%)
(1) Non-interest Income Q4 ‘22 (%) Efficiency Ratio, Operating (%) (1) Adjusted Operating Expense / Average Assets (%) (1) Source: S&P Global Market Intelligence, Company Documents Data as of or for the three months ended each
respective quarter (1) Non-GAAP measure, see reconciliation to closest GAAP measure in appendix
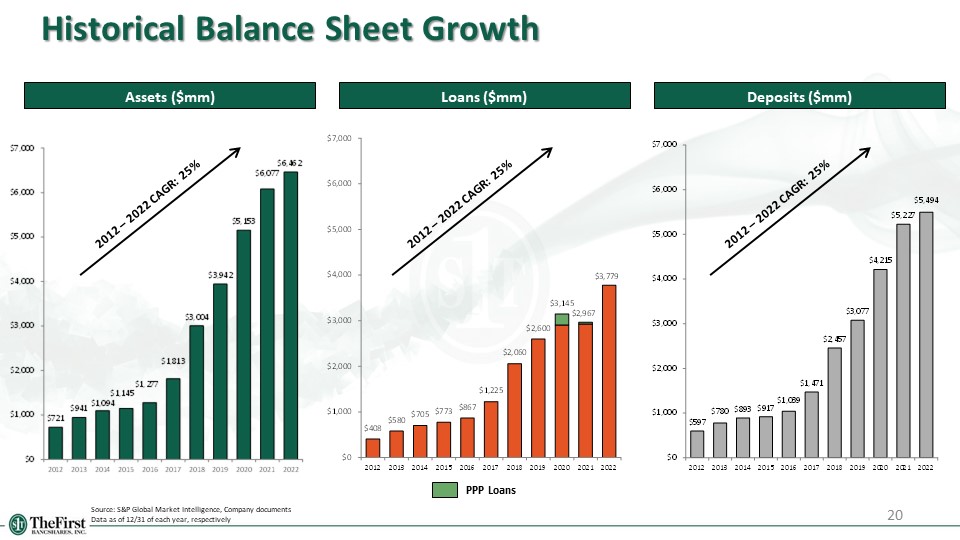
Historical Balance Sheet Growth 20 Assets ($mm) Source: S&P Global Market Intelligence, Company
documents Data as of 12/31 of each year, respectively Loans ($mm) Deposits ($mm) PPP Loans 2012 – 2022 CAGR: 25% 2012 – 2022 CAGR: 25% 2012 – 2022 CAGR: 25%
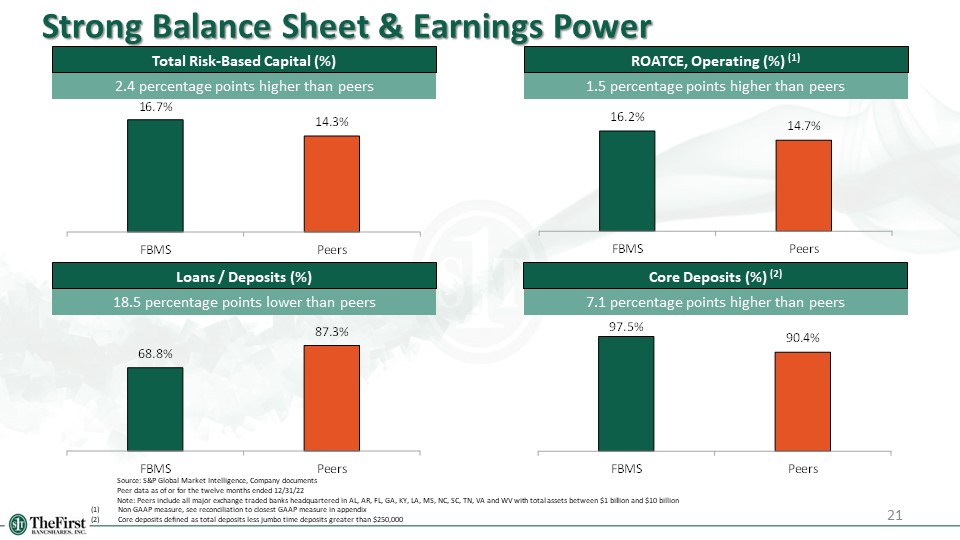
21 Strong Balance Sheet & Earnings Power Total Risk-Based Capital (%) Core Deposits (%)
(2) ROATCE, Operating (%) (1) Loans / Deposits (%) 2.4 percentage points higher than peers 1.5 percentage points higher than peers 18.5 percentage points lower than peers 7.1 percentage points higher than peers Source: S&P Global
Market Intelligence, Company documents Peer data as of or for the twelve months ended 12/31/22 Note: Peers include all major exchange traded banks headquartered in AL, AR, FL, GA, KY, LA, MS, NC, SC, TN, VA and WV with total assets
between $1 billion and $10 billion Non-GAAP measure, see reconciliation to closest GAAP measure in appendix Core deposits defined as total deposits less jumbo time deposits greater than $250,000

22 Loan & deposit information
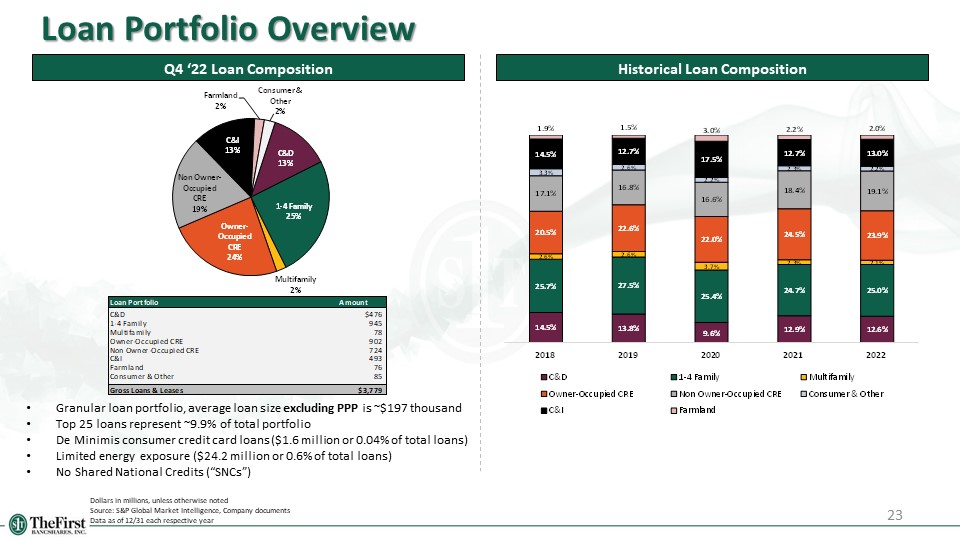
23 Loan Portfolio Overview Q4 ‘22 Loan Composition Historical Loan Composition Dollars in millions,
unless otherwise noted Source: S&P Global Market Intelligence, Company documents Data as of 12/31 each respective year Granular loan portfolio, average loan size excluding PPP is ~$197 thousand Top 25 loans represent ~9.9% of total
portfolio De Minimis consumer credit card loans ($1.6 million or 0.04% of total loans) Limited energy exposure ($24.2 million or 0.6% of total loans) No Shared National Credits (“SNCs”)
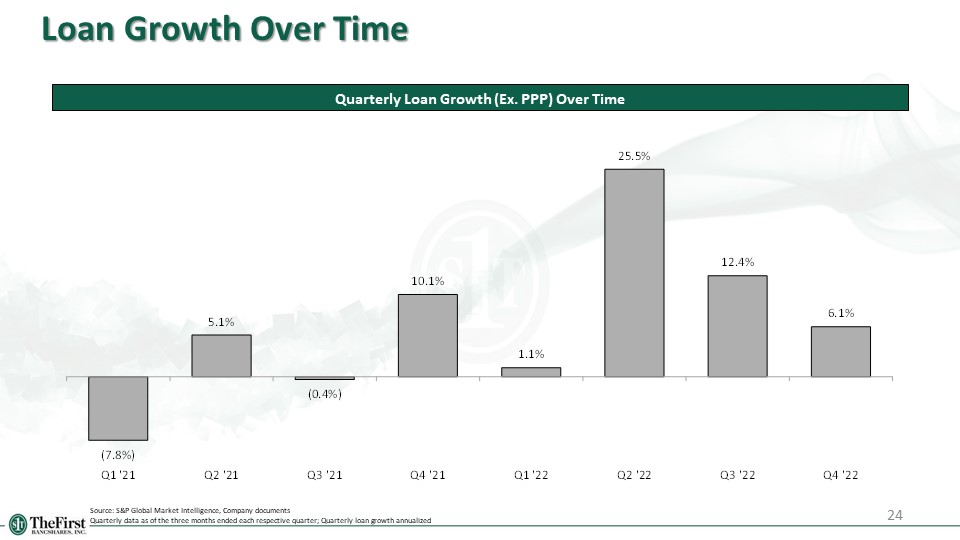
24 Loan Growth Over Time Quarterly Loan Growth (Ex. PPP) Over Time Source: S&P Global Market
Intelligence, Company documents Quarterly data as of the three months ended each respective quarter; Quarterly loan growth annualized
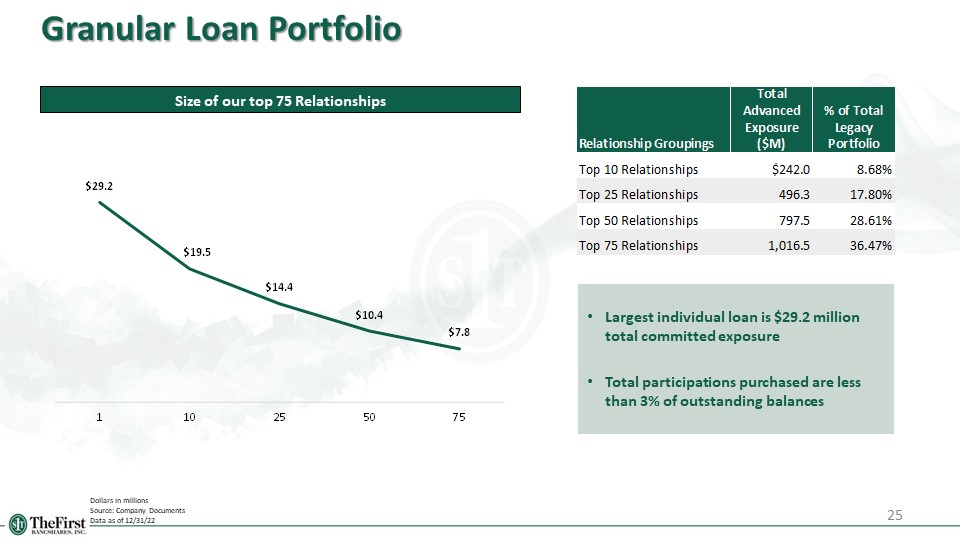
25 Granular Loan Portfolio Dollars in millions Source: Company Documents Data as of 12/31/22 Size
of our top 75 Relationships Largest individual loan is $29.2 million total committed exposure Total participations purchased are less than 3% of outstanding balances
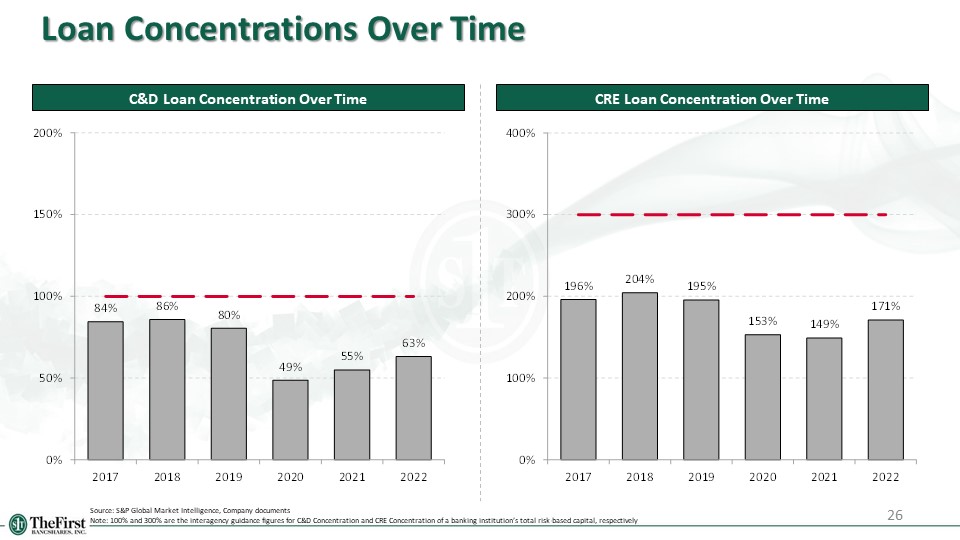
26 Loan Concentrations Over Time C&D Loan Concentration Over Time CRE Loan Concentration Over
Time Source: S&P Global Market Intelligence, Company documents Note: 100% and 300% are the interagency guidance figures for C&D Concentration and CRE Concentration of a banking institution’s total risk-based capital, respectively
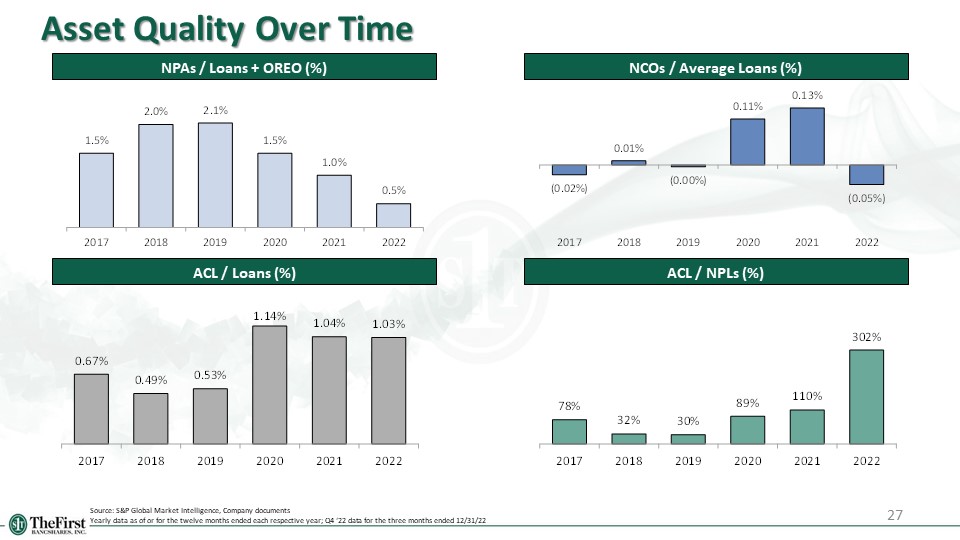
27 Asset Quality Over Time NPAs / Loans + OREO (%) NCOs / Average Loans (%) ACL / NPLs (%) ACL /
Loans (%) Source: S&P Global Market Intelligence, Company documents Yearly data as of or for the twelve months ended each respective year; Q4 ‘22 data for the three months ended 12/31/22
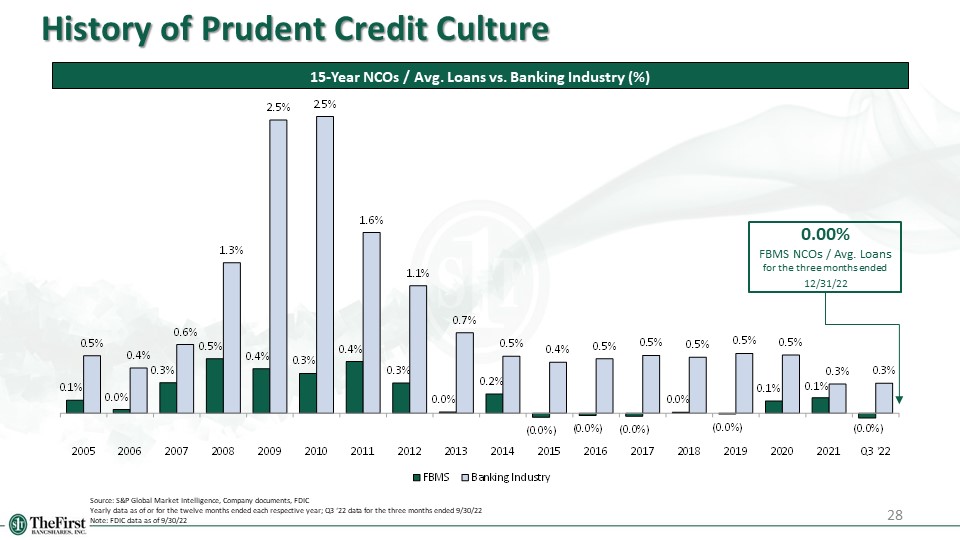
28 History of Prudent Credit Culture 15-Year NCOs / Avg. Loans vs. Banking Industry (%) Source:
S&P Global Market Intelligence, Company documents, FDIC Yearly data as of or for the twelve months ended each respective year; Q3 ‘22 data for the three months ended 9/30/22 Note: FDIC data as of 9/30/22 0.00% FBMS NCOs / Avg. Loans
for the three months ended 12/31/22
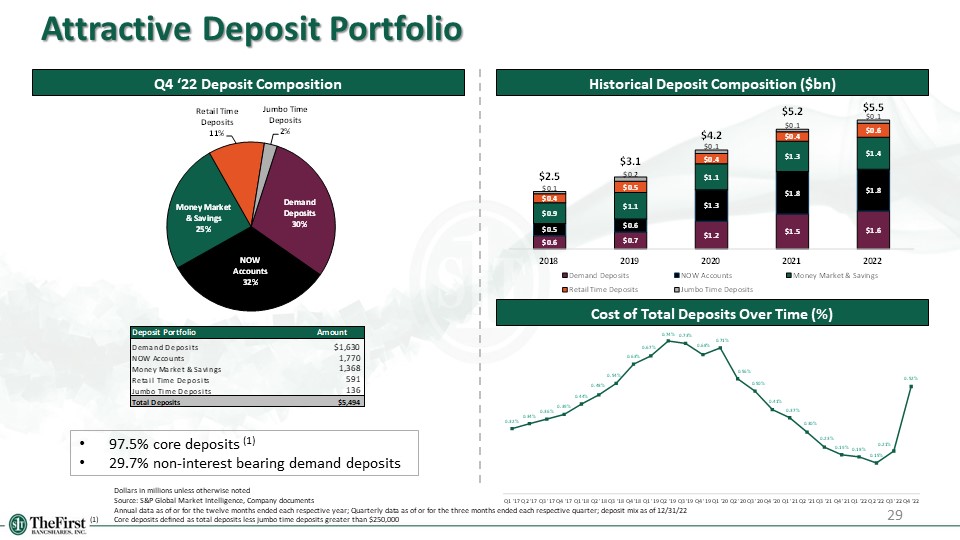
29 Attractive Deposit Portfolio Historical Deposit Composition ($bn) Cost of Total Deposits Over
Time (%) Dollars in millions unless otherwise noted Source: S&P Global Market Intelligence, Company documents Annual data as of or for the twelve months ended each respective year; Quarterly data as of or for the three months ended
each respective quarter; deposit mix as of 12/31/22 (1) Core deposits defined as total deposits less jumbo time deposits greater than $250,000 97.5% core deposits (1) 29.7% non-interest bearing demand deposits Q4 ‘22 Deposit Composition

30 Capital & Liquidity

31 Capital Position TCE / TA (%) (1) Leverage Ratio (%) Total Risk Based Capital Ratio (%) CET1
Ratio (%) Source: S&P Global Market Intelligence, Company documents Data as of 12/31 of each year, respectively (1) Non-GAAP measure, see reconciliation to closest GAAP measure in appendix
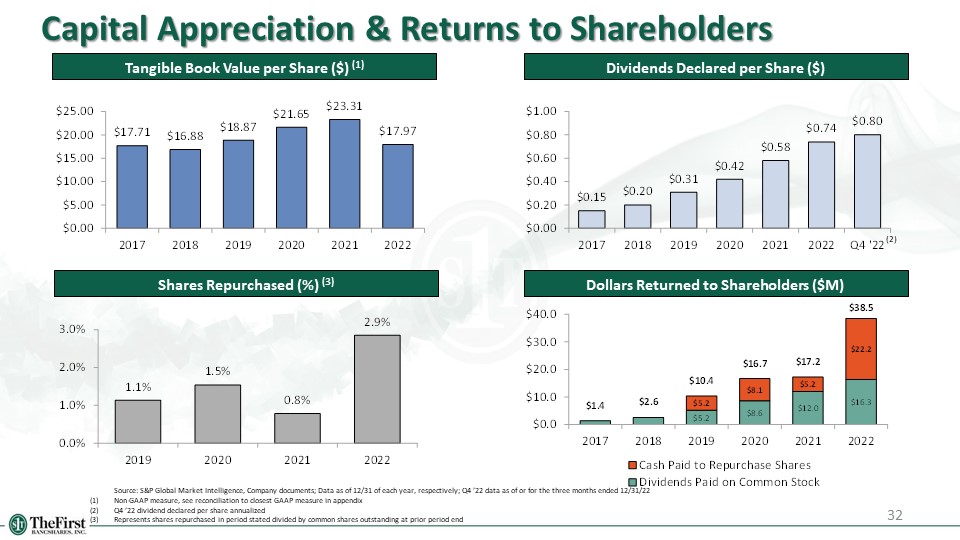
32 Capital Appreciation & Returns to Shareholders Tangible Book Value per Share ($)
(1) Dividends Declared per Share ($) Shares Repurchased (%) (3) Source: S&P Global Market Intelligence, Company documents; Data as of 12/31 of each year, respectively; Q4 ’22 data as of or for the three months ended 12/31/22 (1)
Non-GAAP measure, see reconciliation to closest GAAP measure in appendix (2) Q4 ’22 dividend declared per share annualized (3) Represents shares repurchased in period stated divided by common shares outstanding at prior period
end (2) Dollars Returned to Shareholders ($M)
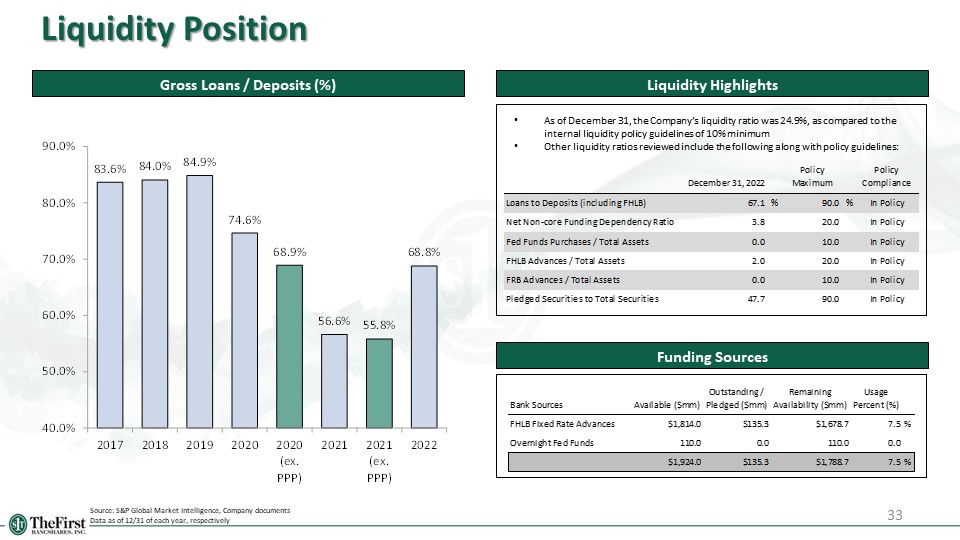
33 Liquidity Position Source: S&P Global Market Intelligence, Company documents Data as of
12/31 of each year, respectively Gross Loans / Deposits (%) Funding Sources Liquidity Highlights As of December 31, the Company’s liquidity ratio was 24.9%, as compared to the internal liquidity policy guidelines of 10% minimum Other
liquidity ratios reviewed include the following along with policy guidelines:

34 Appendix
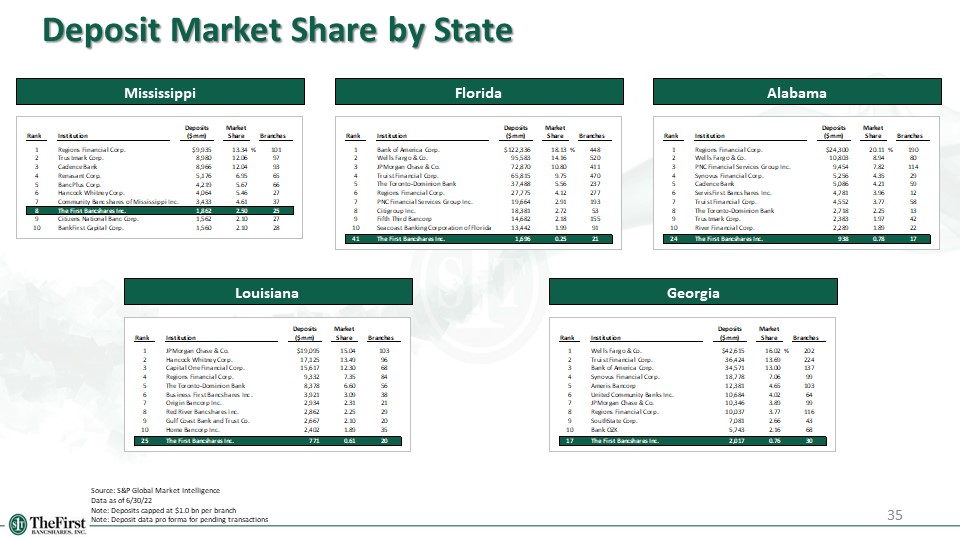
35 Deposit Market Share by State Mississippi Florida Alabama Louisiana Georgia Source: S&P
Global Market Intelligence Data as of 6/30/22 Note: Deposits capped at $1.0 bn per branch Note: Deposit data pro forma for pending transactions

36 Deposit Market Share by Select MSAs Tallahassee, FL MSA Gulfport-Biloxi, MS MSA Fort Walton
Beach-Destin, FL MSA Mobile, AL MSA Baton Rouge, LA MSA Hattiesburg, MS MSA Source: S&P Global Market Intelligence Data as of 6/30/22 Note: Deposits capped at $1.0 bn per branch Note: Deposit data pro forma for pending
transactions
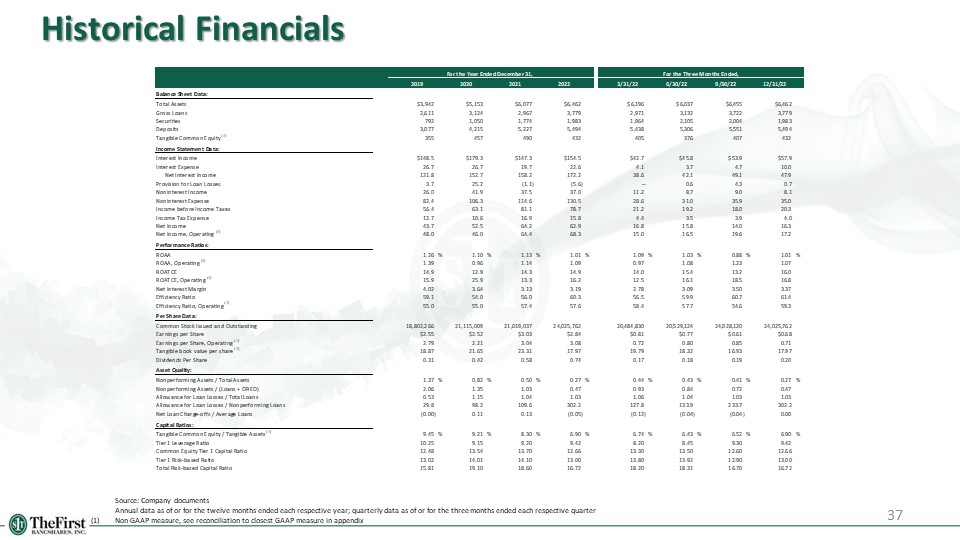
Historical Financials 37 Source: Company documents Annual data as of or for the twelve months
ended each respective year; quarterly data as of or for the three months ended each respective quarter (1) Non-GAAP measure, see reconciliation to closest GAAP measure in appendix
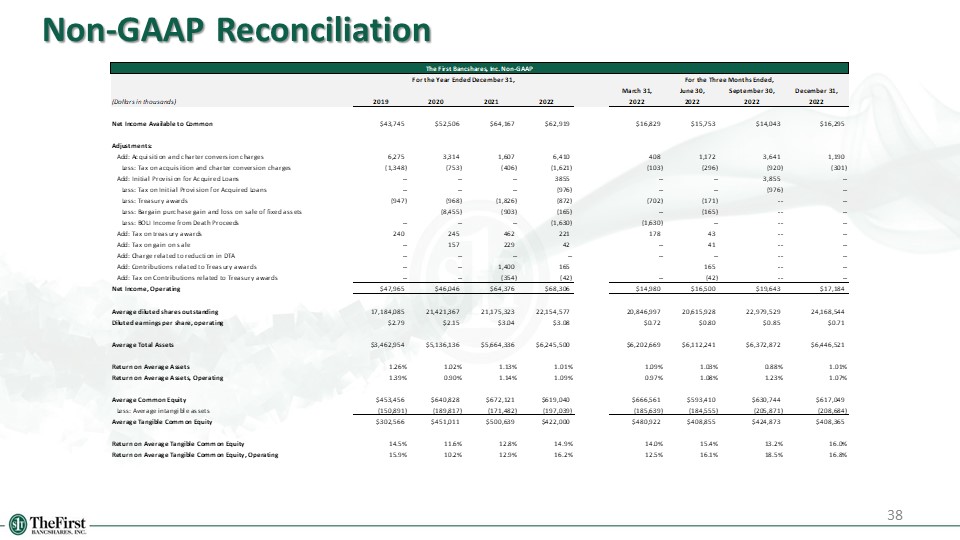
38 Non-GAAP Reconciliation
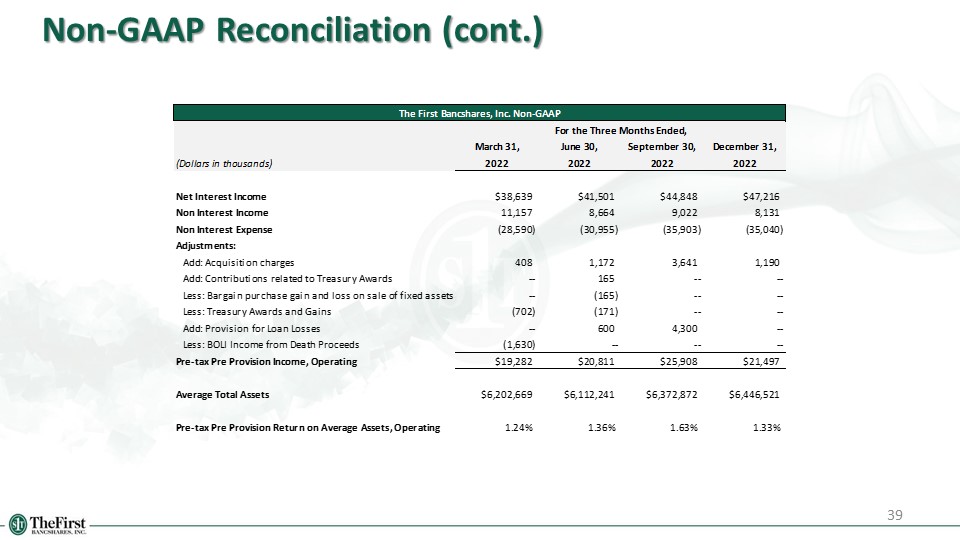
39 Non-GAAP Reconciliation (cont.)
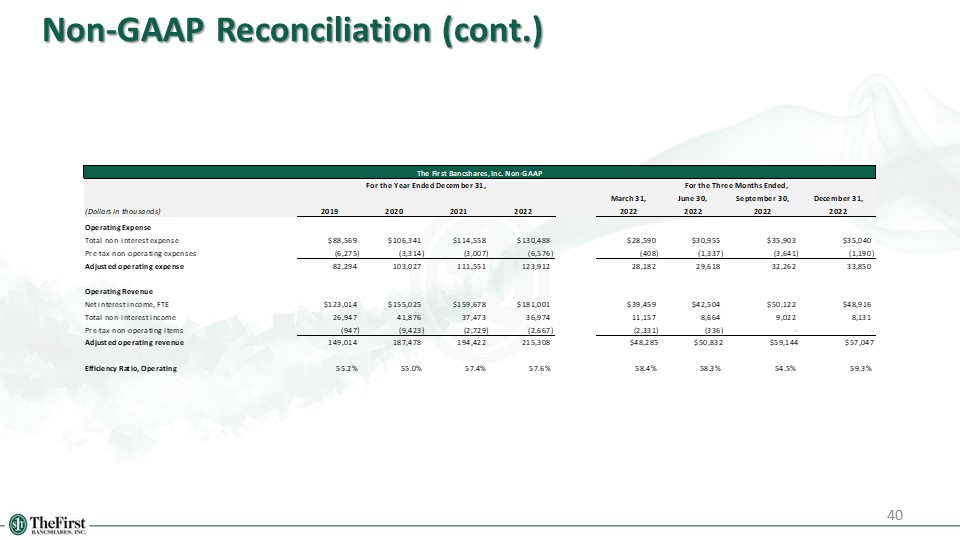
40 Non-GAAP Reconciliation (cont.)
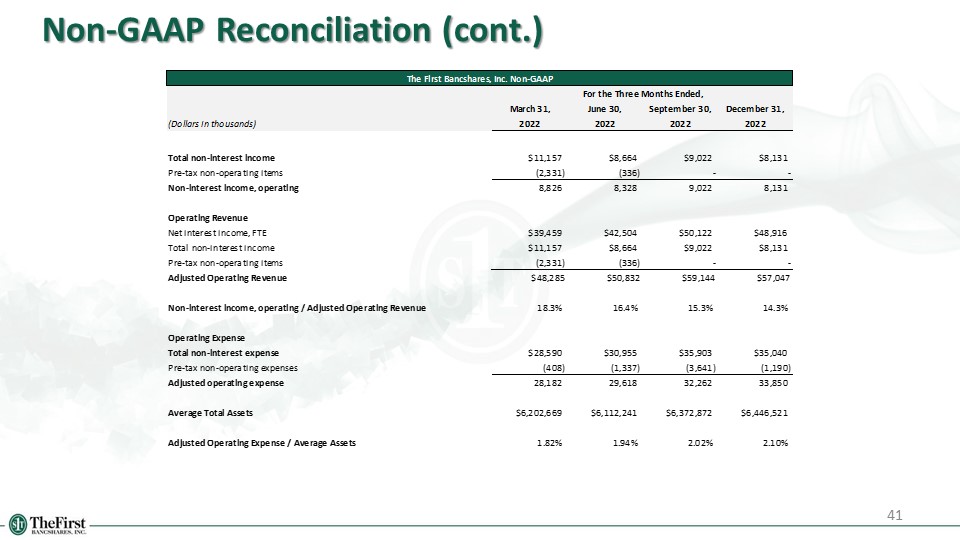
41 Non-GAAP Reconciliation (cont.)
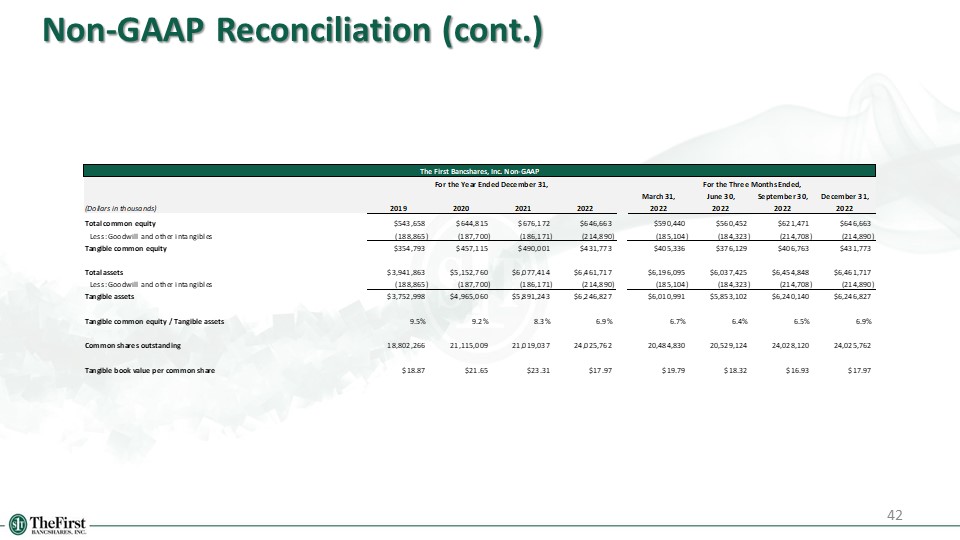
42 Non-GAAP Reconciliation (cont.)