

 | |||||
| Table of Contents | |||||
December 31, 2022 | |||||
| EARNINGS PRESS RELEASE | Page | Page | ||||||||||||
Fourth Quarter and Year Ended December 31, 2022 Financial and Operating Results | ||||||||||||||
| SUPPLEMENTAL INFORMATION | Page | Page | ||||||||||||
| External Growth / Investments in Real Estate | ||||||||||||||
New Class A Development and Redevelopment Properties: | ||||||||||||||
| Internal Growth | ||||||||||||||
| Balance Sheet Management | ||||||||||||||
| Definitions and Reconciliations | ||||||||||||||
Alexandria Real Estate Equities, Inc. All Rights Reserved. © 2023 | xxi | |||||||

| Key highlights | |||||||||||||||||||||||
| Operating results | 4Q22 | 4Q21 | 2022 | 2021 | |||||||||||||||||||
| Total revenues: | |||||||||||||||||||||||
| In millions | $ | 670.3 | $ | 576.9 | $ | 2,589.0 | $ | 2,114.2 | |||||||||||||||
| Growth | 16.2 | % | 22.5 | % | |||||||||||||||||||
| Net income attributable to Alexandria’s common stockholders – diluted | |||||||||||||||||||||||
| In millions | $ | 51.8 | $ | 72.8 | $ | 513.3 | $ | 563.4 | |||||||||||||||
| Per share | $ | 0.31 | $ | 0.47 | $ | 3.18 | $ | 3.82 | |||||||||||||||
Funds from operations attributable to Alexandria’s common stockholders – diluted, as adjusted | |||||||||||||||||||||||
| In millions | $ | 353.6 | $ | 303.6 | $ | 1,361.7 | $ | 1,144.9 | |||||||||||||||
| Per share | $ | 2.14 | $ | 1.97 | $ | 8.42 | $ | 7.76 | |||||||||||||||
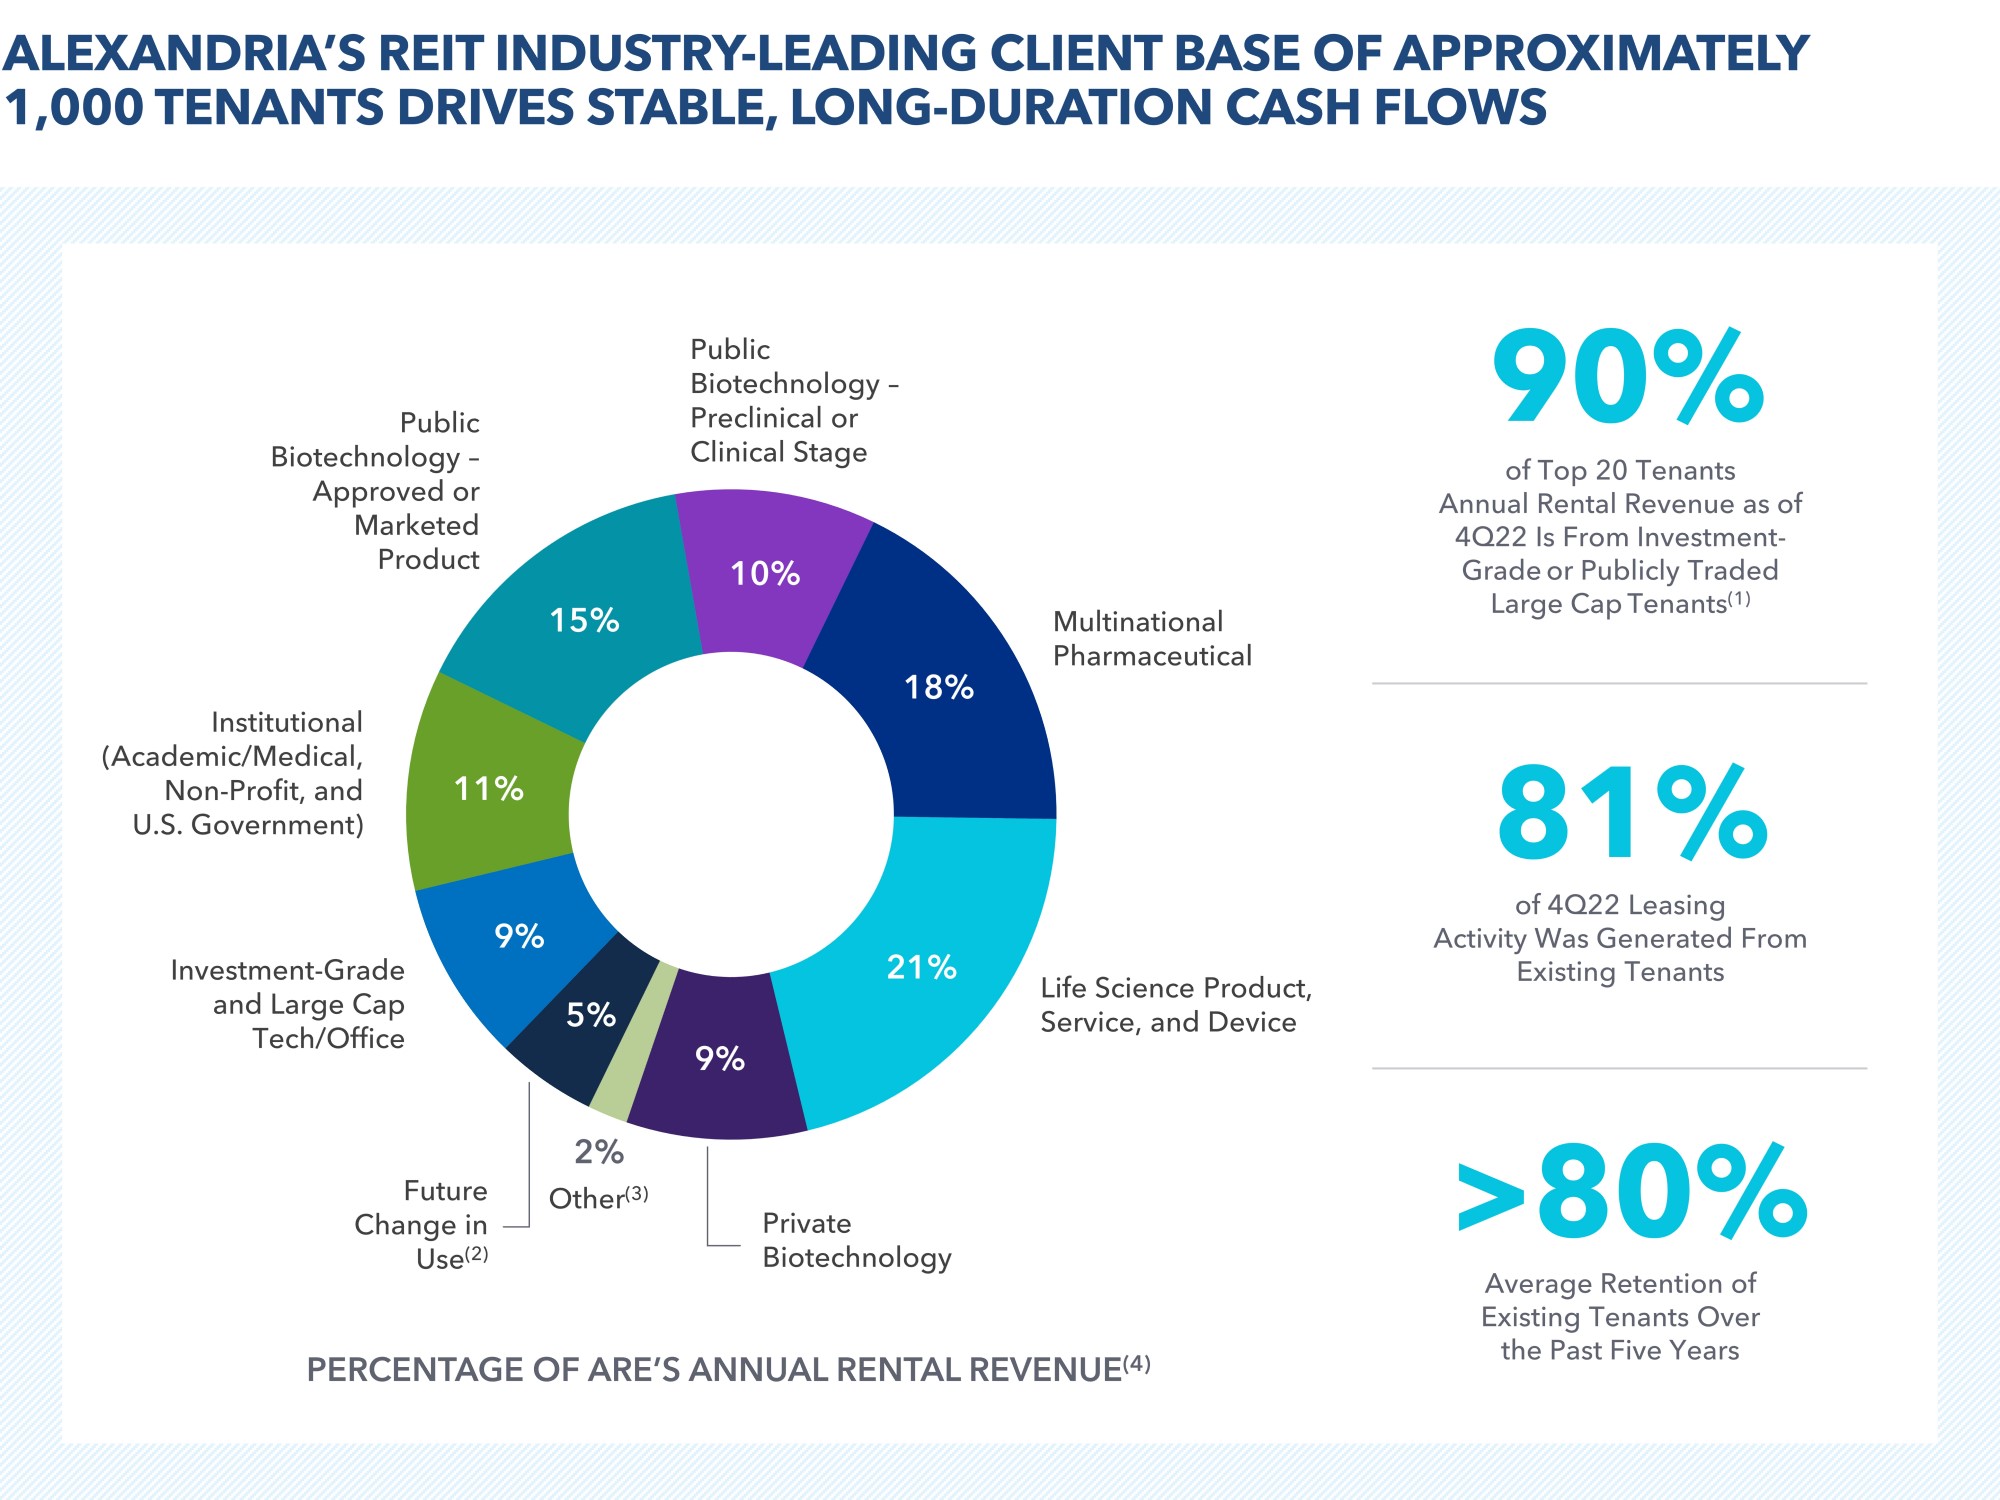
| Percentage of total annual rental revenue in effect from investment-grade or publicly traded large cap tenants | 48 | % | ||||||||||||
| Sustained strength in tenant collections: | ||||||||||||||
Tenant receivables as of December 31, 2022 | $ | 7.6 | million | |||||||||||
January 2023 tenant rent and receivables collected as of January 30, 2023 | 99.4 | % | ||||||||||||
| Occupancy of operating properties in North America | 94.8 | % | ||||||||||||
| Operating margin | 70 | % | ||||||||||||
| Adjusted EBITDA margin | 69 | % | ||||||||||||
| Weighted-average remaining lease term: | ||||||||||||||
| All tenants | 7.1 | years | ||||||||||||
| Top 20 tenants | 9.4 | years | ||||||||||||
| 4Q22 | 2022 | ||||||||||||||||
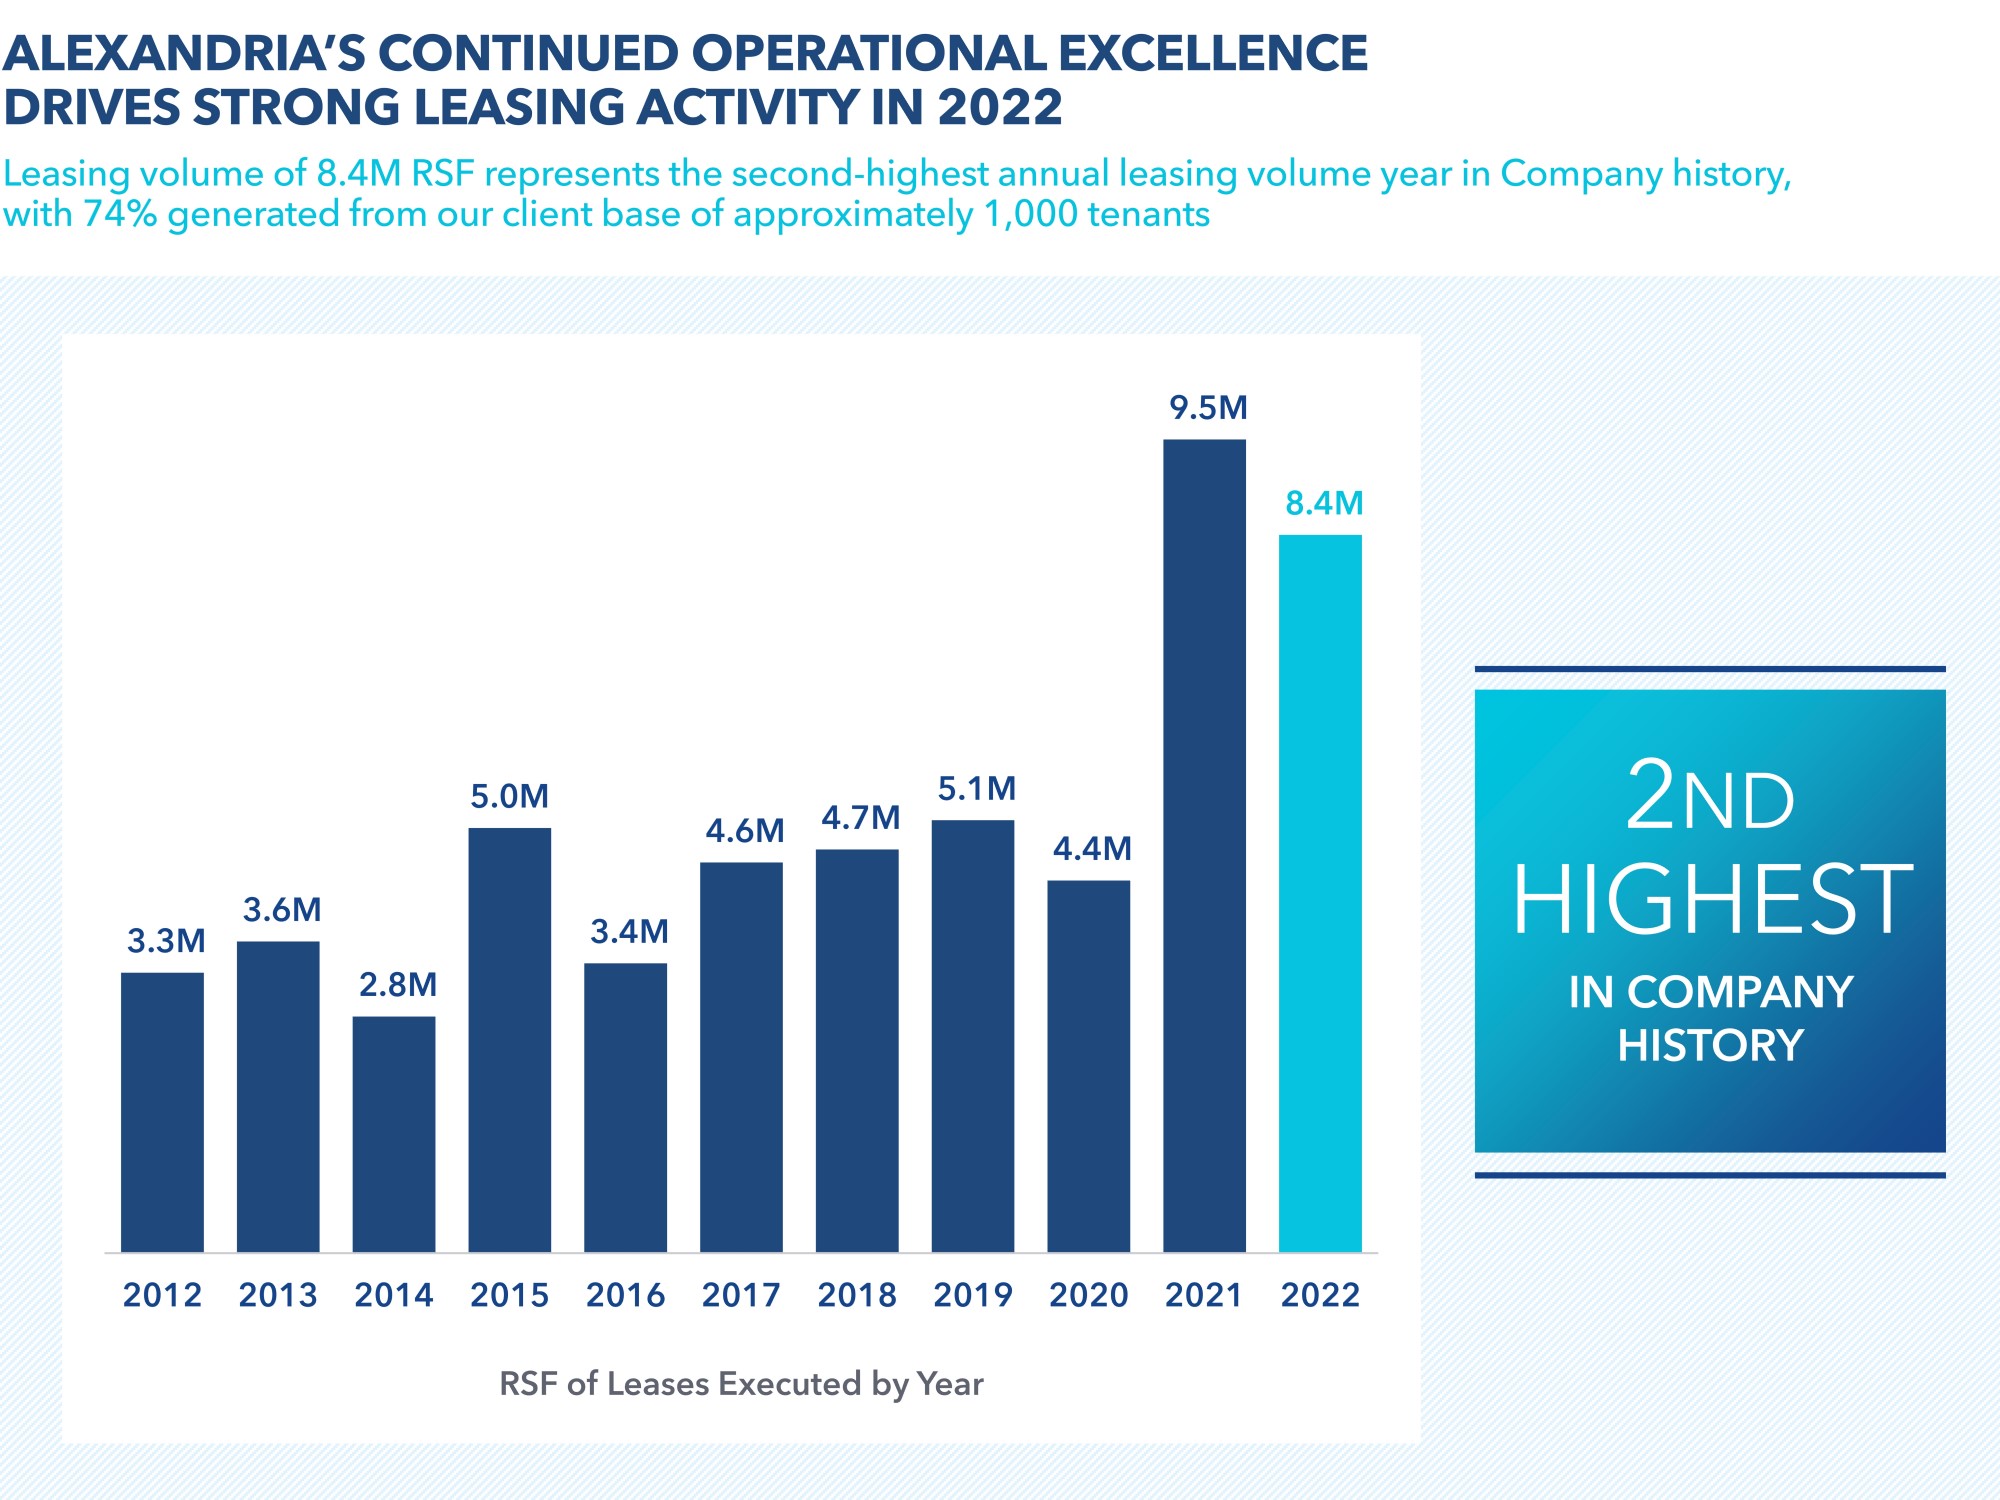
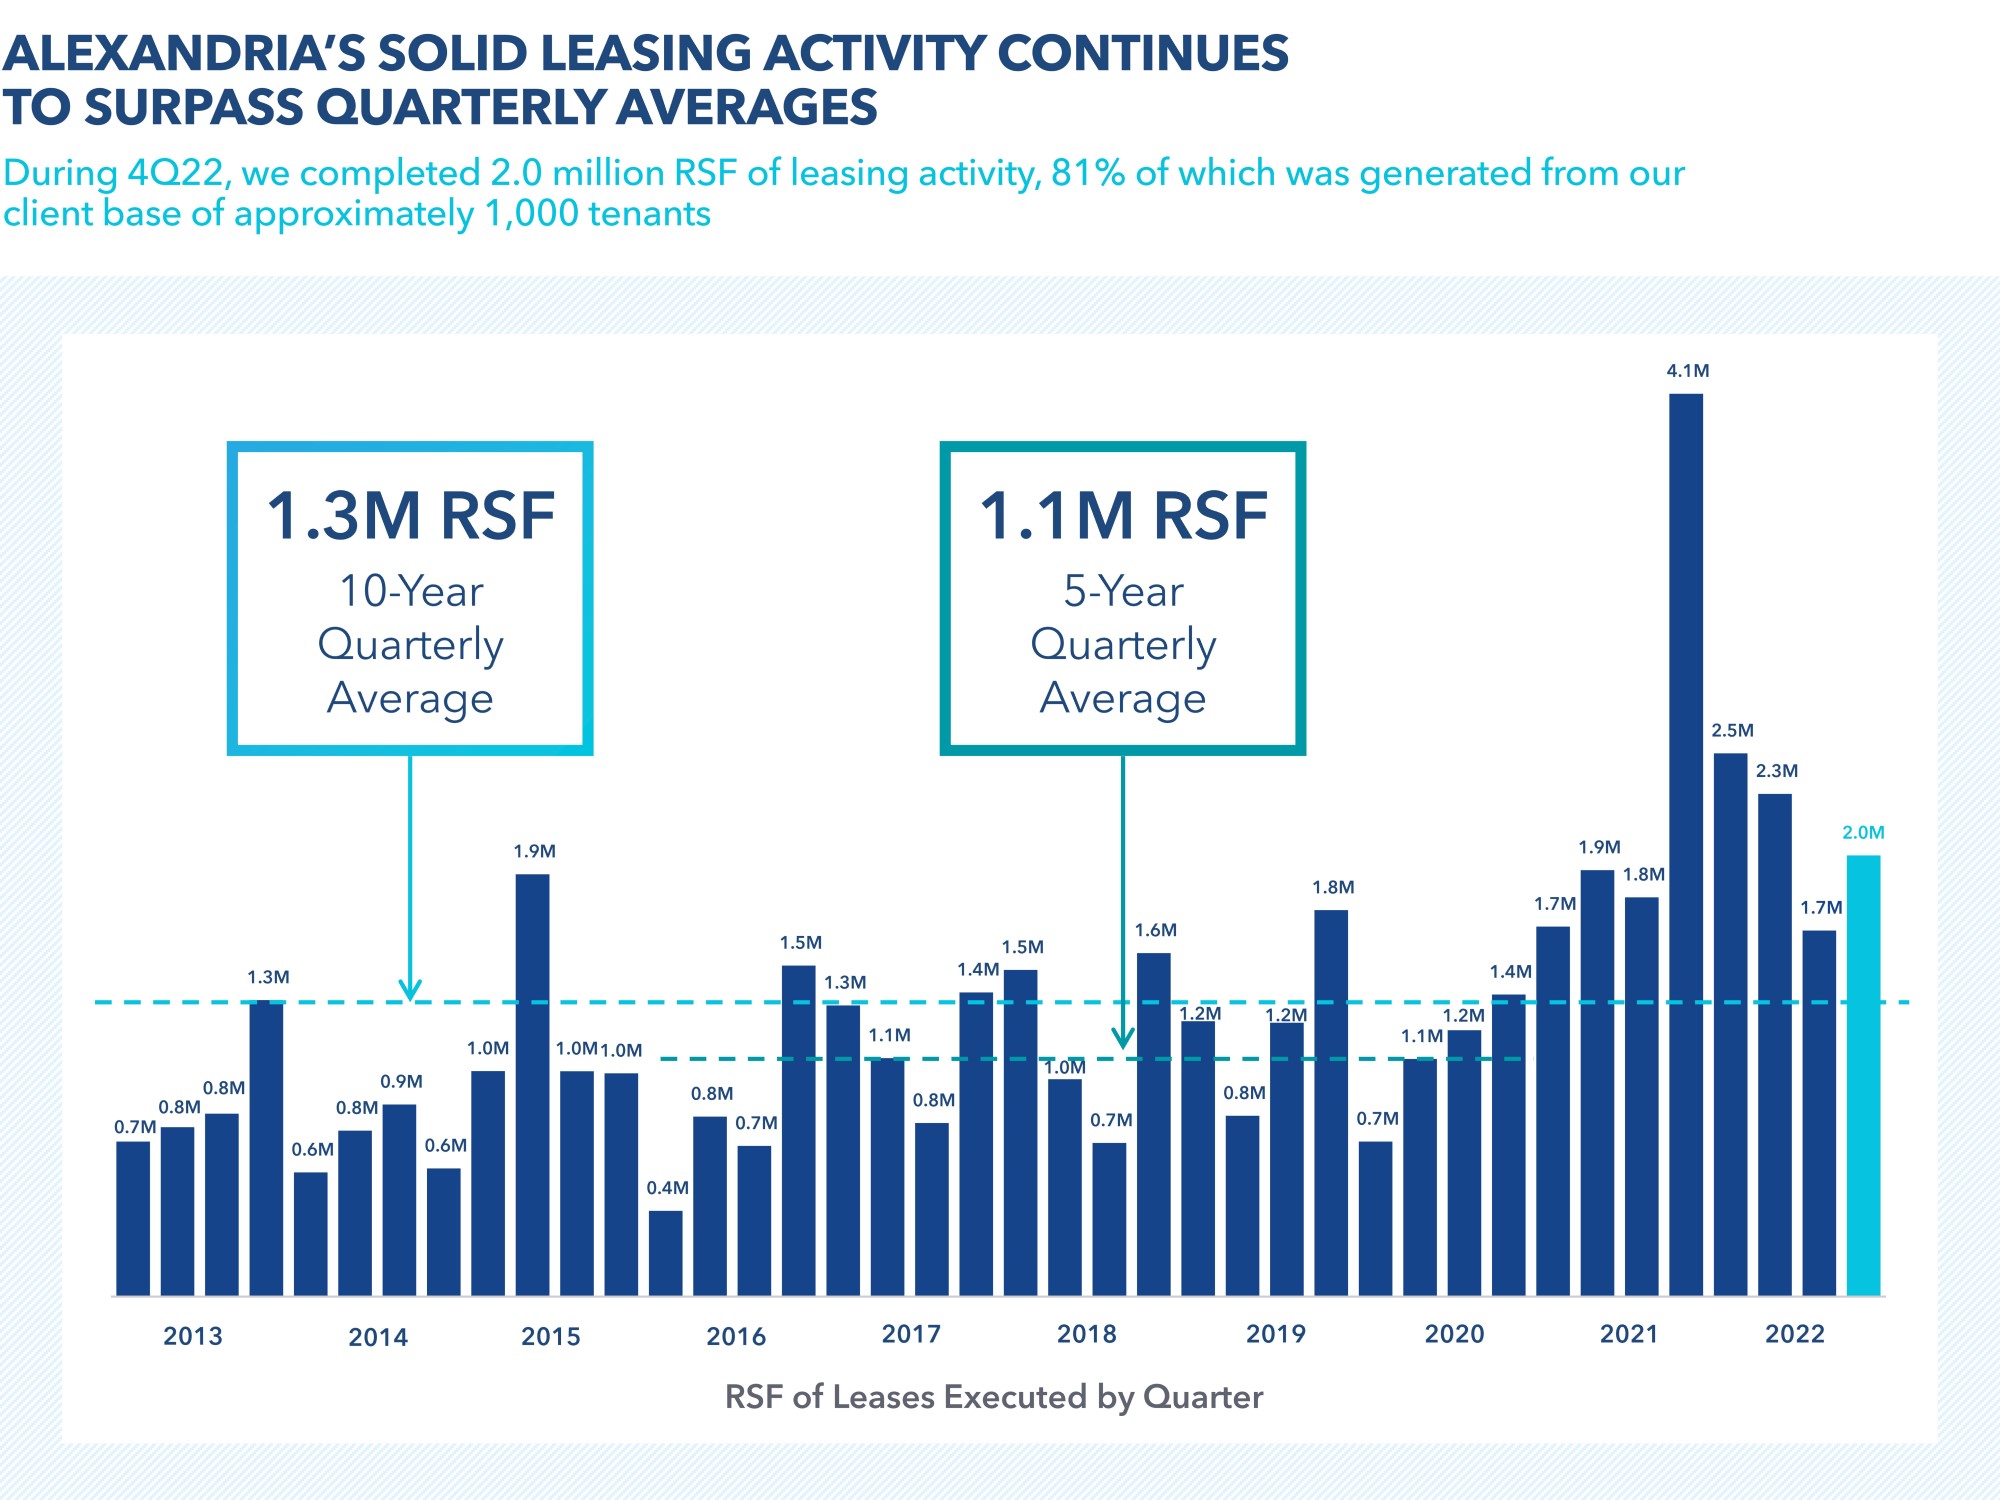
| Total leasing activity – RSF | 2,000,322 | 8,405,587 | |||||||||||||||
| Lease renewals and re-leasing of space: | |||||||||||||||||
| RSF (included in total leasing activity above) | 1,494,345 | 4,540,325 | |||||||||||||||
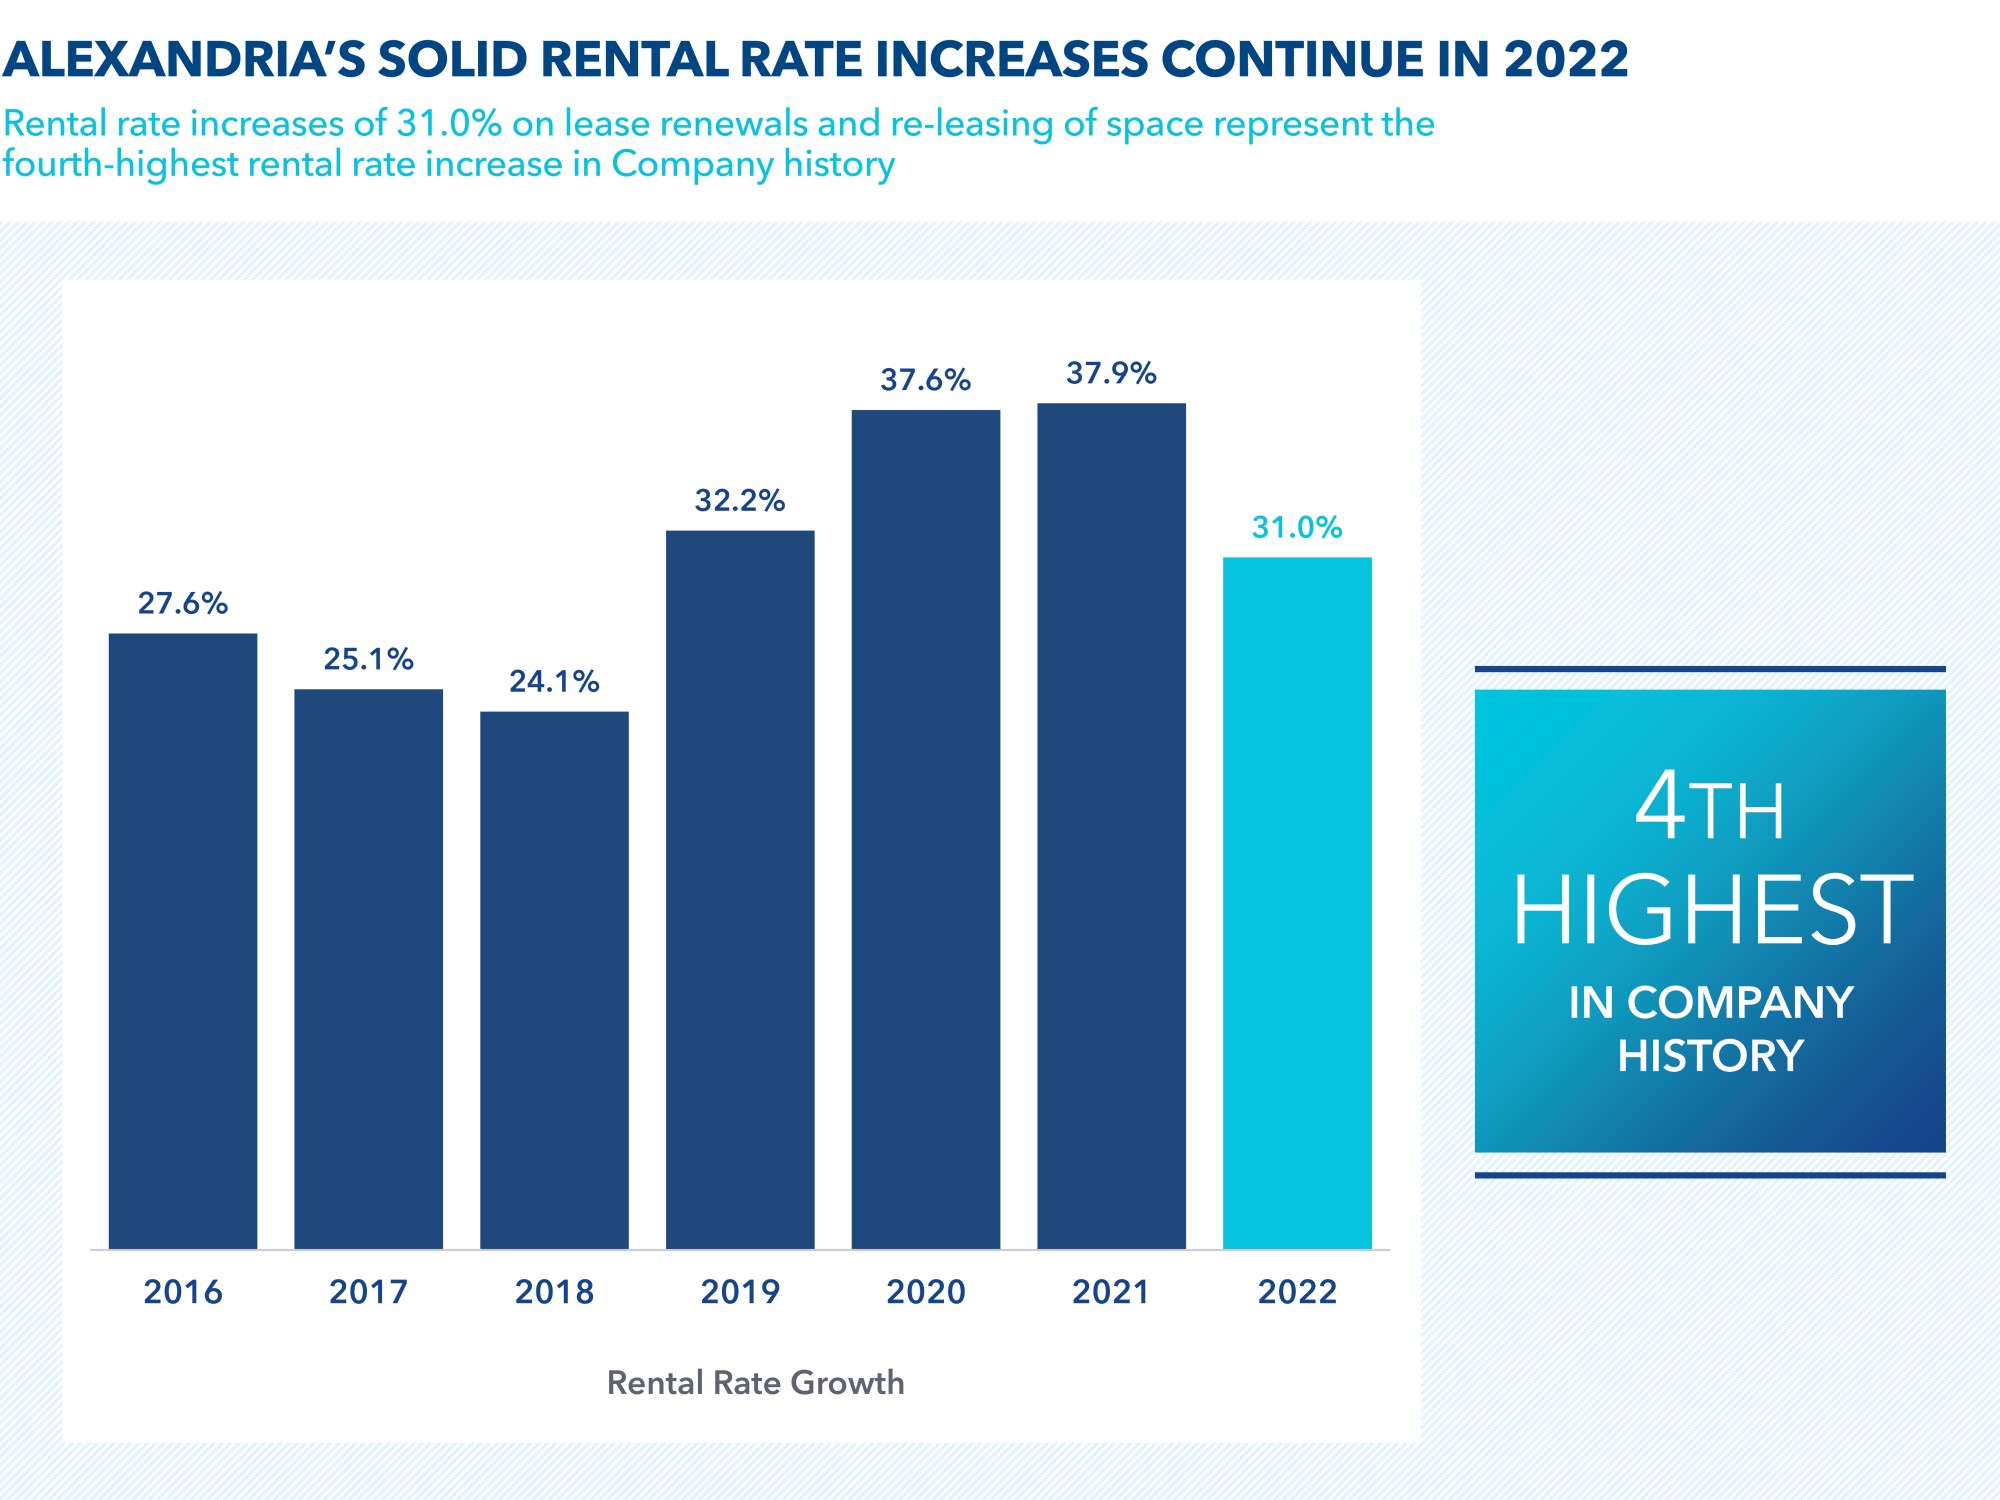
| Rental rate increases | 26.0% | (1) | 31.0% | ||||||||||||||
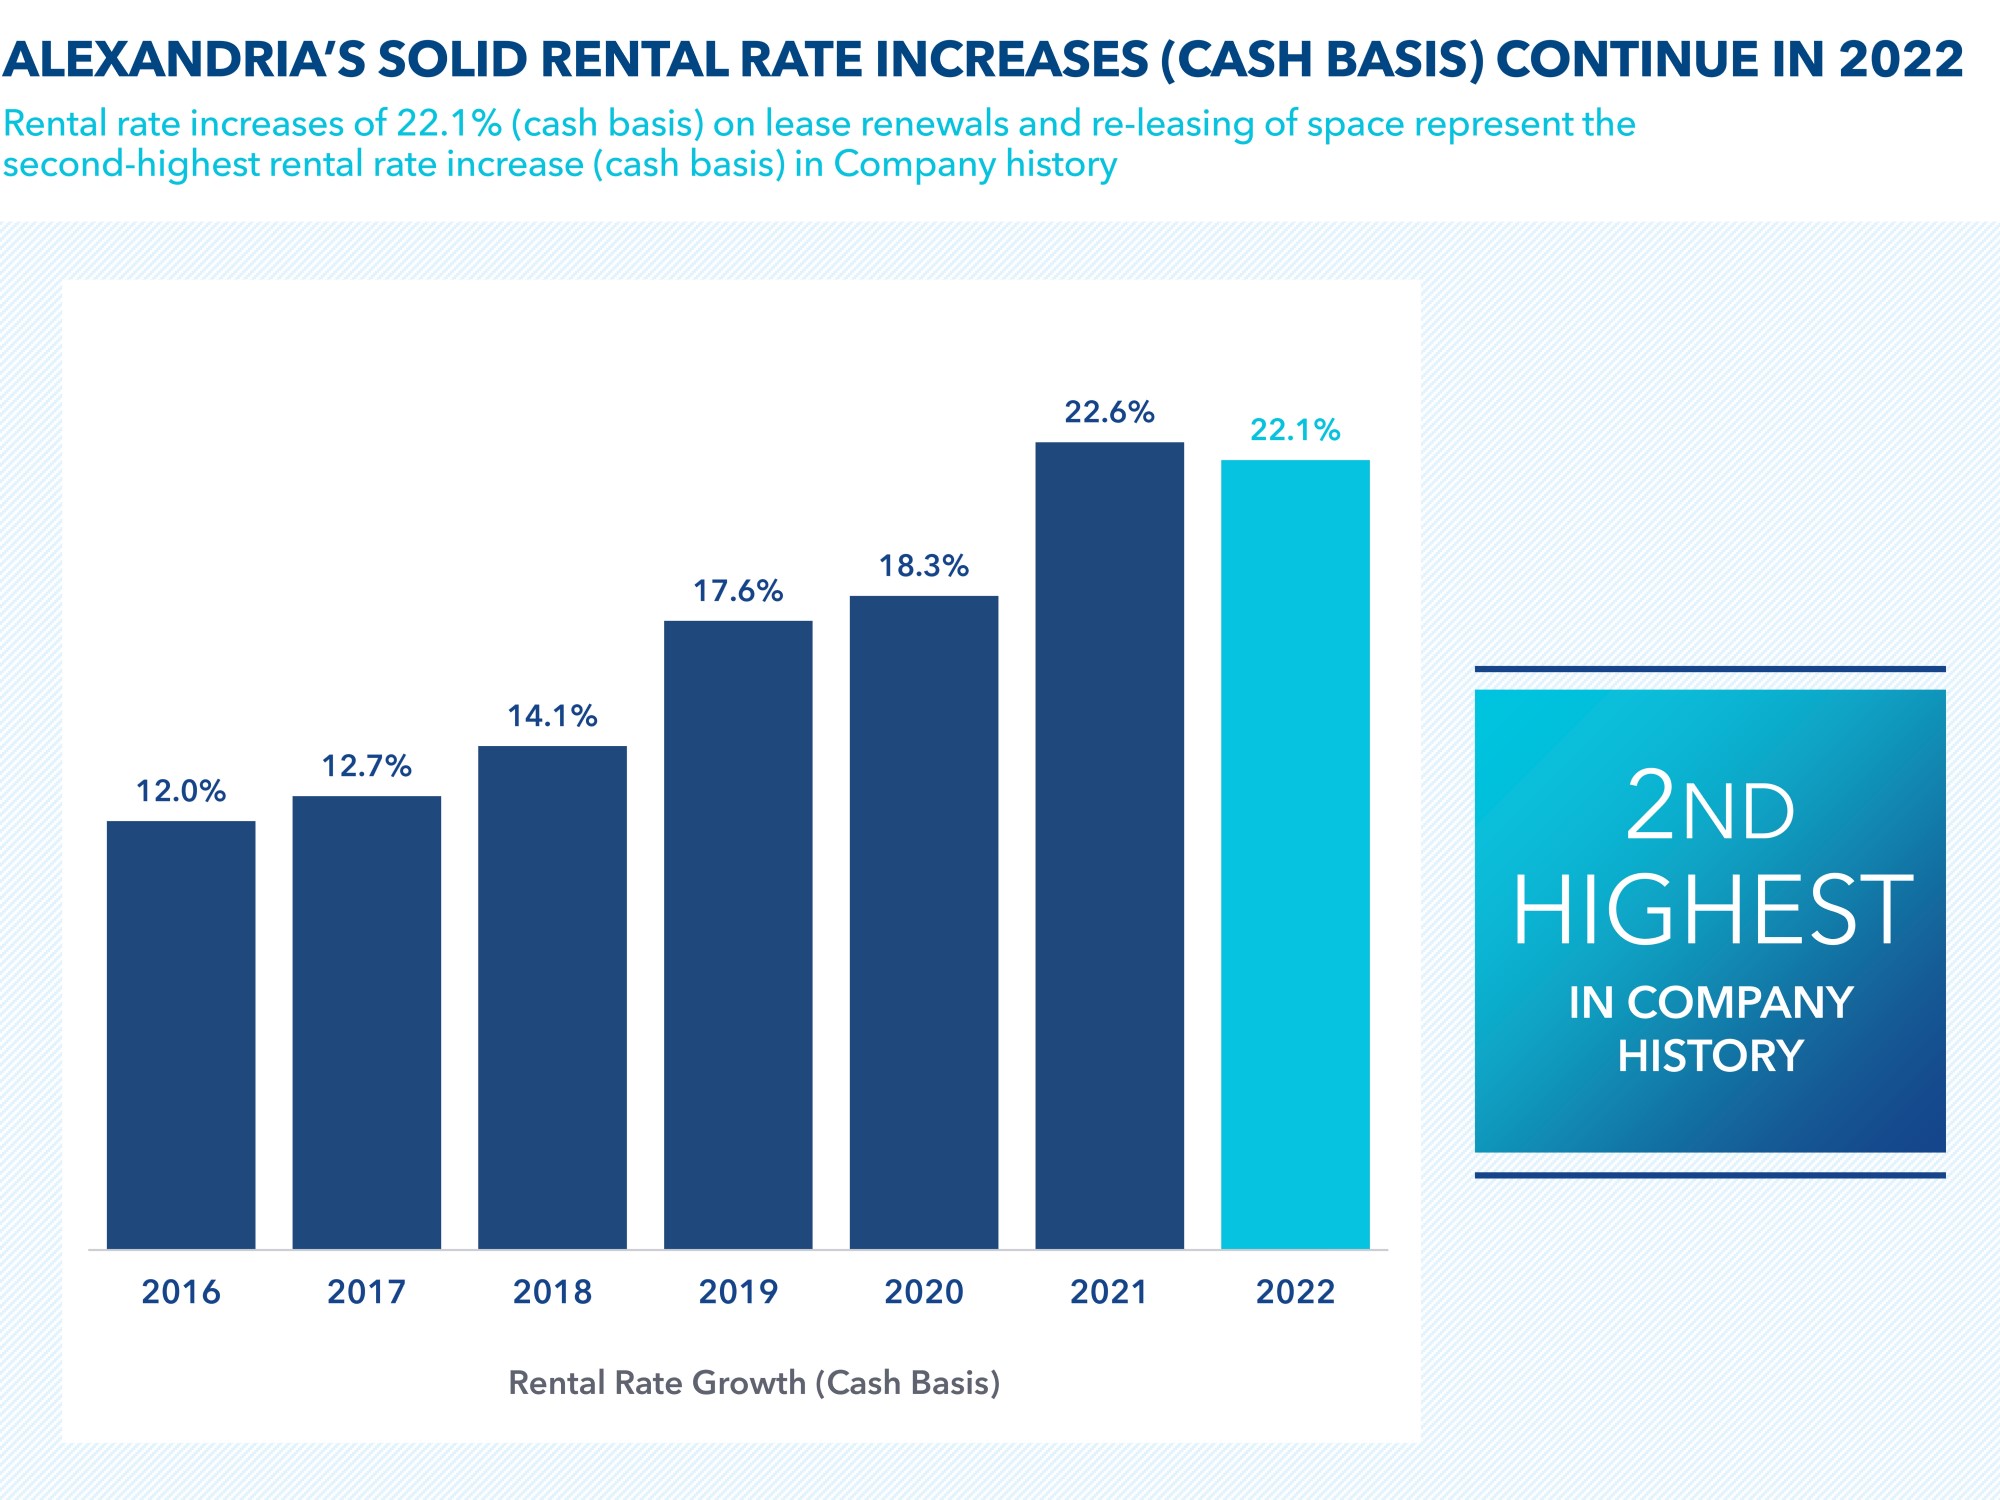
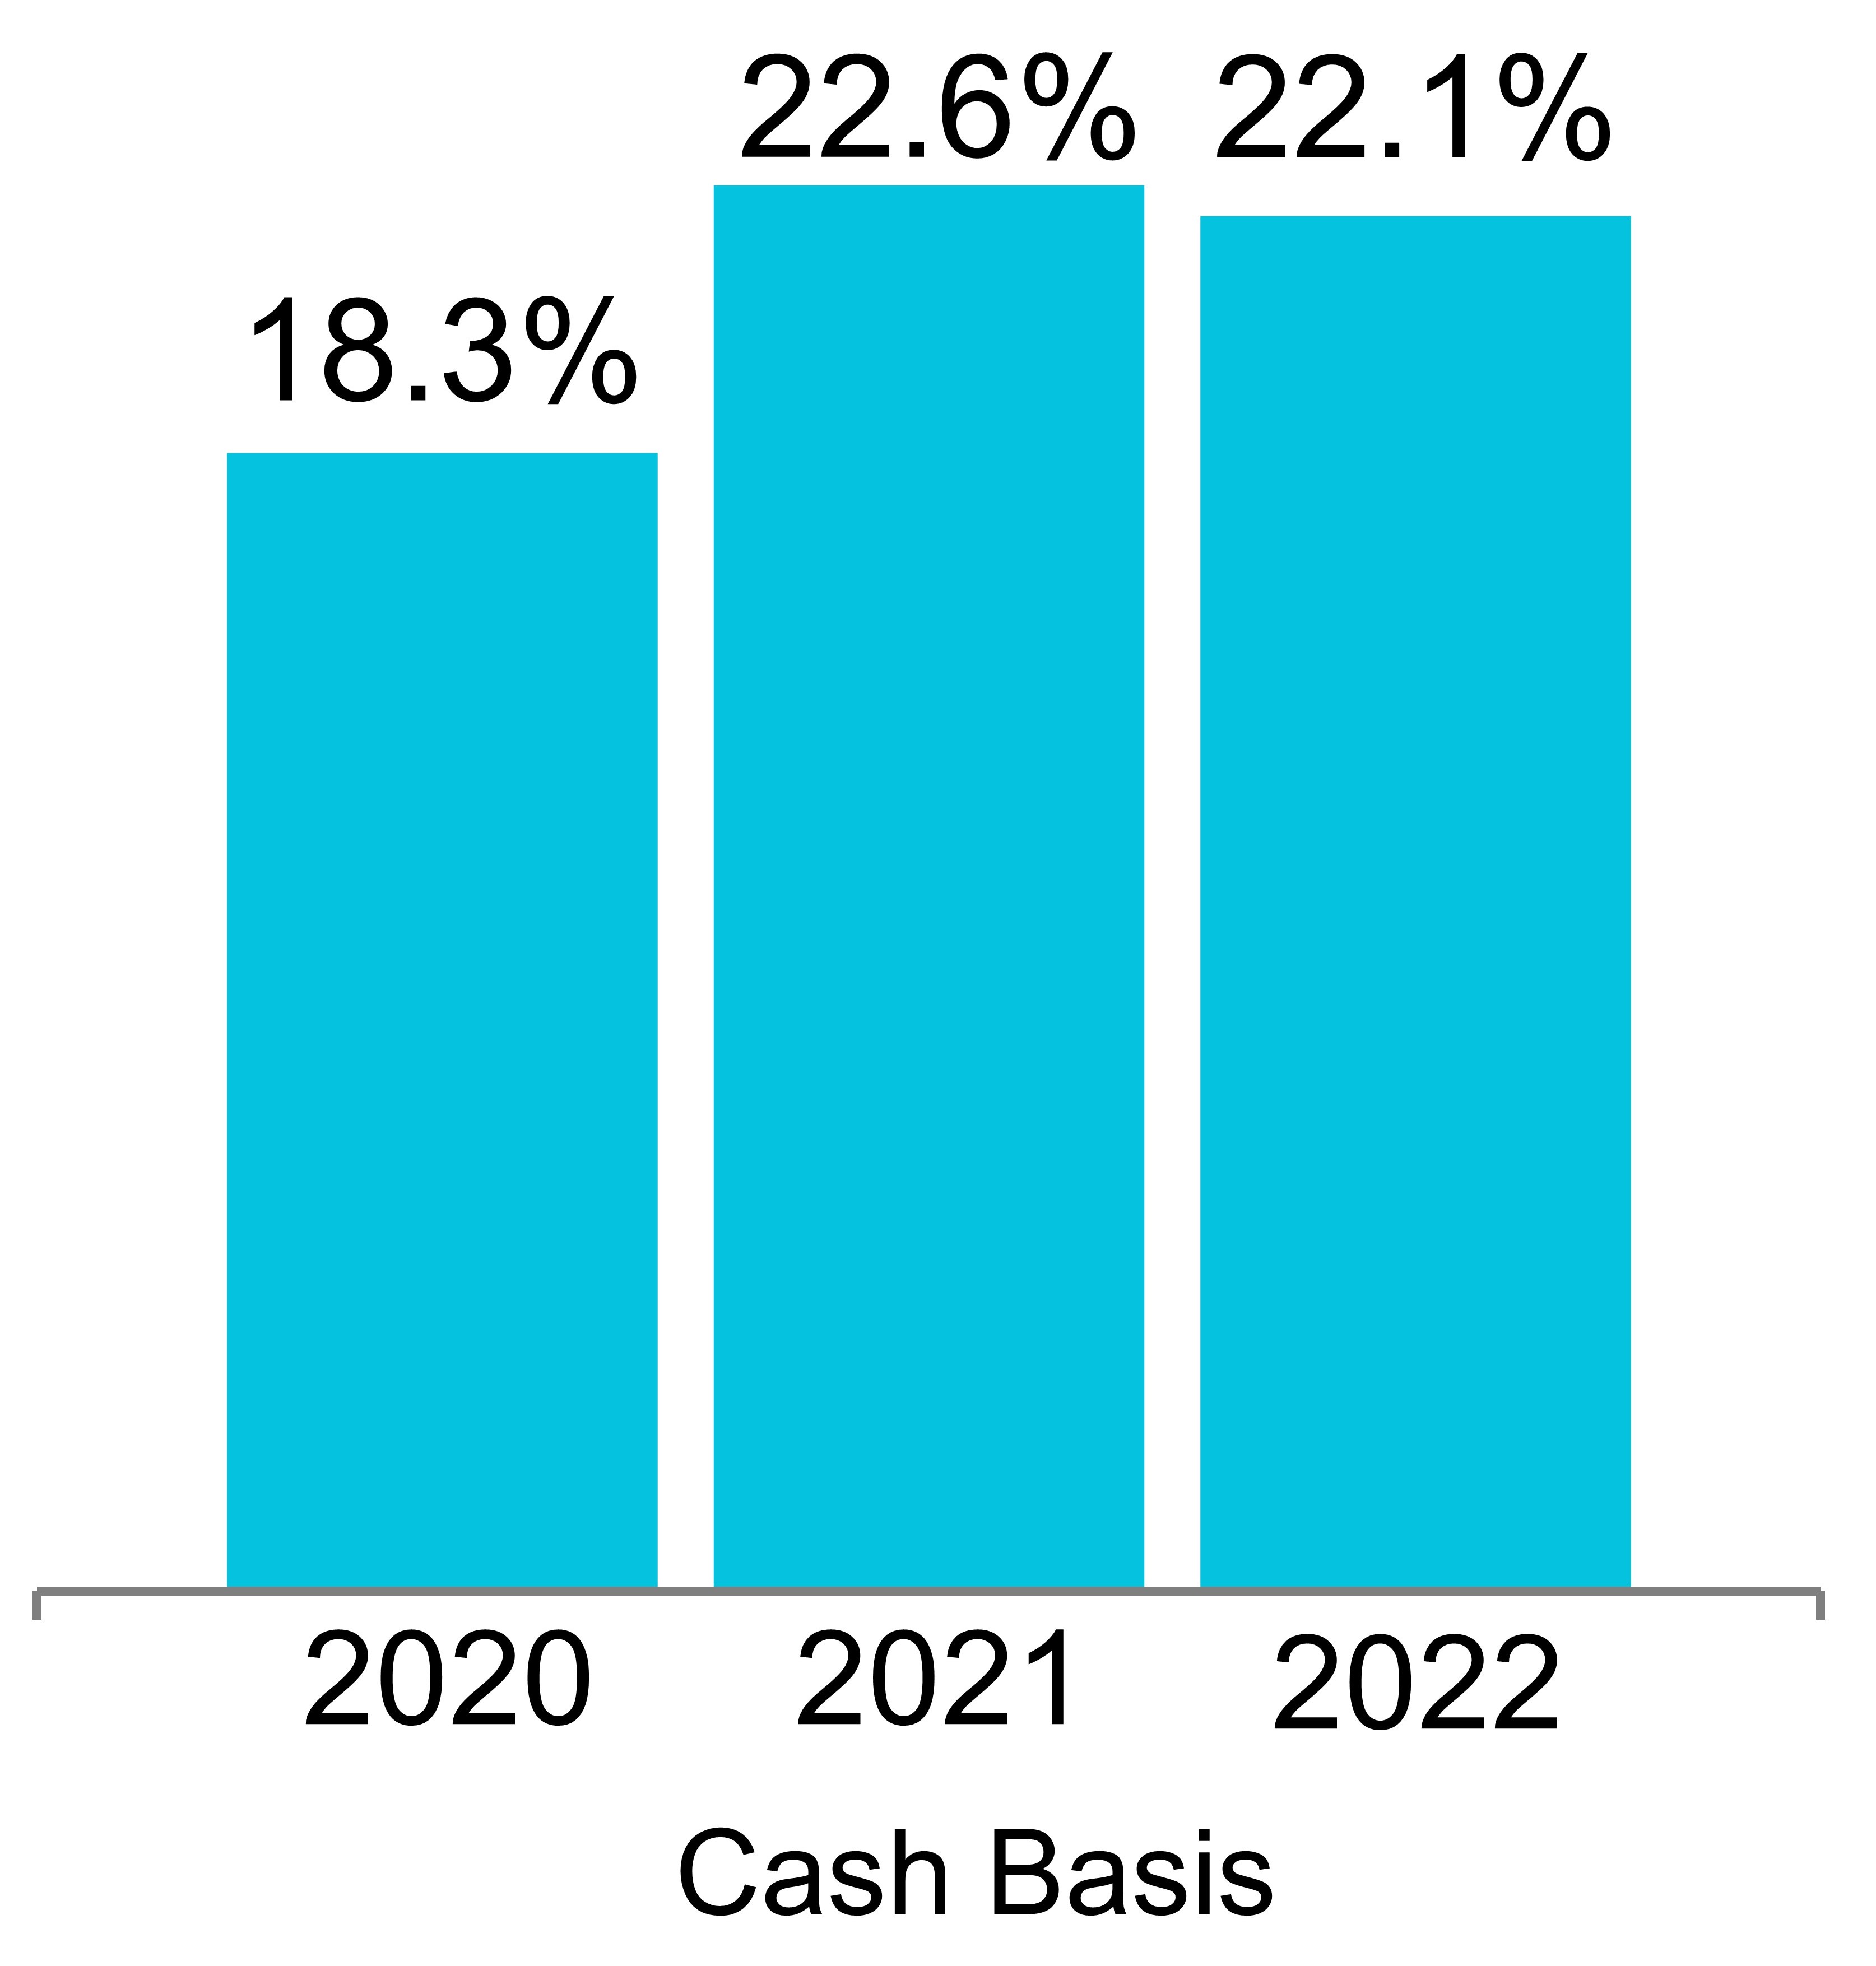
| Rental rate increases (cash basis) | 19.6% | (1) | 22.1% | ||||||||||||||
| |||||
Fourth Quarter and Year Ended December 31, 2022 Financial and Operating Results (continued) | |||||
December 31, 2022 | |||||
| Key items included in net income attributable to Alexandria’s common stockholders: | |||||||||||||||||||||||||||||||||||||||||||||||
| 4Q22 | 4Q21 | 4Q22 | 4Q21 | 2022 | 2021 | 2022 | 2021 | ||||||||||||||||||||||||||||||||||||||||
(In millions, except per share amounts) | Amount | Per Share – Diluted | Amount | Per Share – Diluted | |||||||||||||||||||||||||||||||||||||||||||
| Impairment of real estate | $ | (26.2) | $ | — | $ | (0.16) | $ | — | $ | (65.0) | $ | (52.7) | $ | (0.40) | $ | (0.35) | |||||||||||||||||||||||||||||||
| Loss on early extinguishment of debt | — | — | — | — | (3.3) | (67.3) | (0.02) | (0.46) | |||||||||||||||||||||||||||||||||||||||
| Gain on sales of real estate | — | 124.2 | — | 0.80 | 537.9 | 126.6 | 3.33 | 0.86 | |||||||||||||||||||||||||||||||||||||||
| Acceleration of stock compensation expense due to executive officer resignation | — | — | — | — | (7.2) | — | (0.04) | — | |||||||||||||||||||||||||||||||||||||||
| Unrealized (losses) gains on non-real estate investments | (24.1) | (139.7) | (0.15) | (0.91) | (412.2) | 43.6 | (2.55) | 0.30 | |||||||||||||||||||||||||||||||||||||||
| Impairment of non-real estate investments | (20.5) | — | (0.12) | — | (20.5) | — | (0.13) | — | |||||||||||||||||||||||||||||||||||||||
| Significant realized gains on non-real estate investments | — | — | — | — | — | 110.1 | — | 0.75 | |||||||||||||||||||||||||||||||||||||||
Total | $ | (70.8) | $ | (15.5) | $ | (0.43) | $ | (0.11) | $ | 29.7 | $ | 160.3 | $ | 0.19 | $ | 1.10 | |||||||||||||||||||||||||||||||
Refer to “Funds from operations and funds from operations per share” of this Earnings Press Release for additional details. | |||||||||||||||||||||||||||||||||||||||||||||||
| 4Q22 | Goal | |||||||||||||||||||||||||
| Quarter | Trailing | 4Q23 | ||||||||||||||||||||||||
| Annualized | 12 Months | Annualized | ||||||||||||||||||||||||
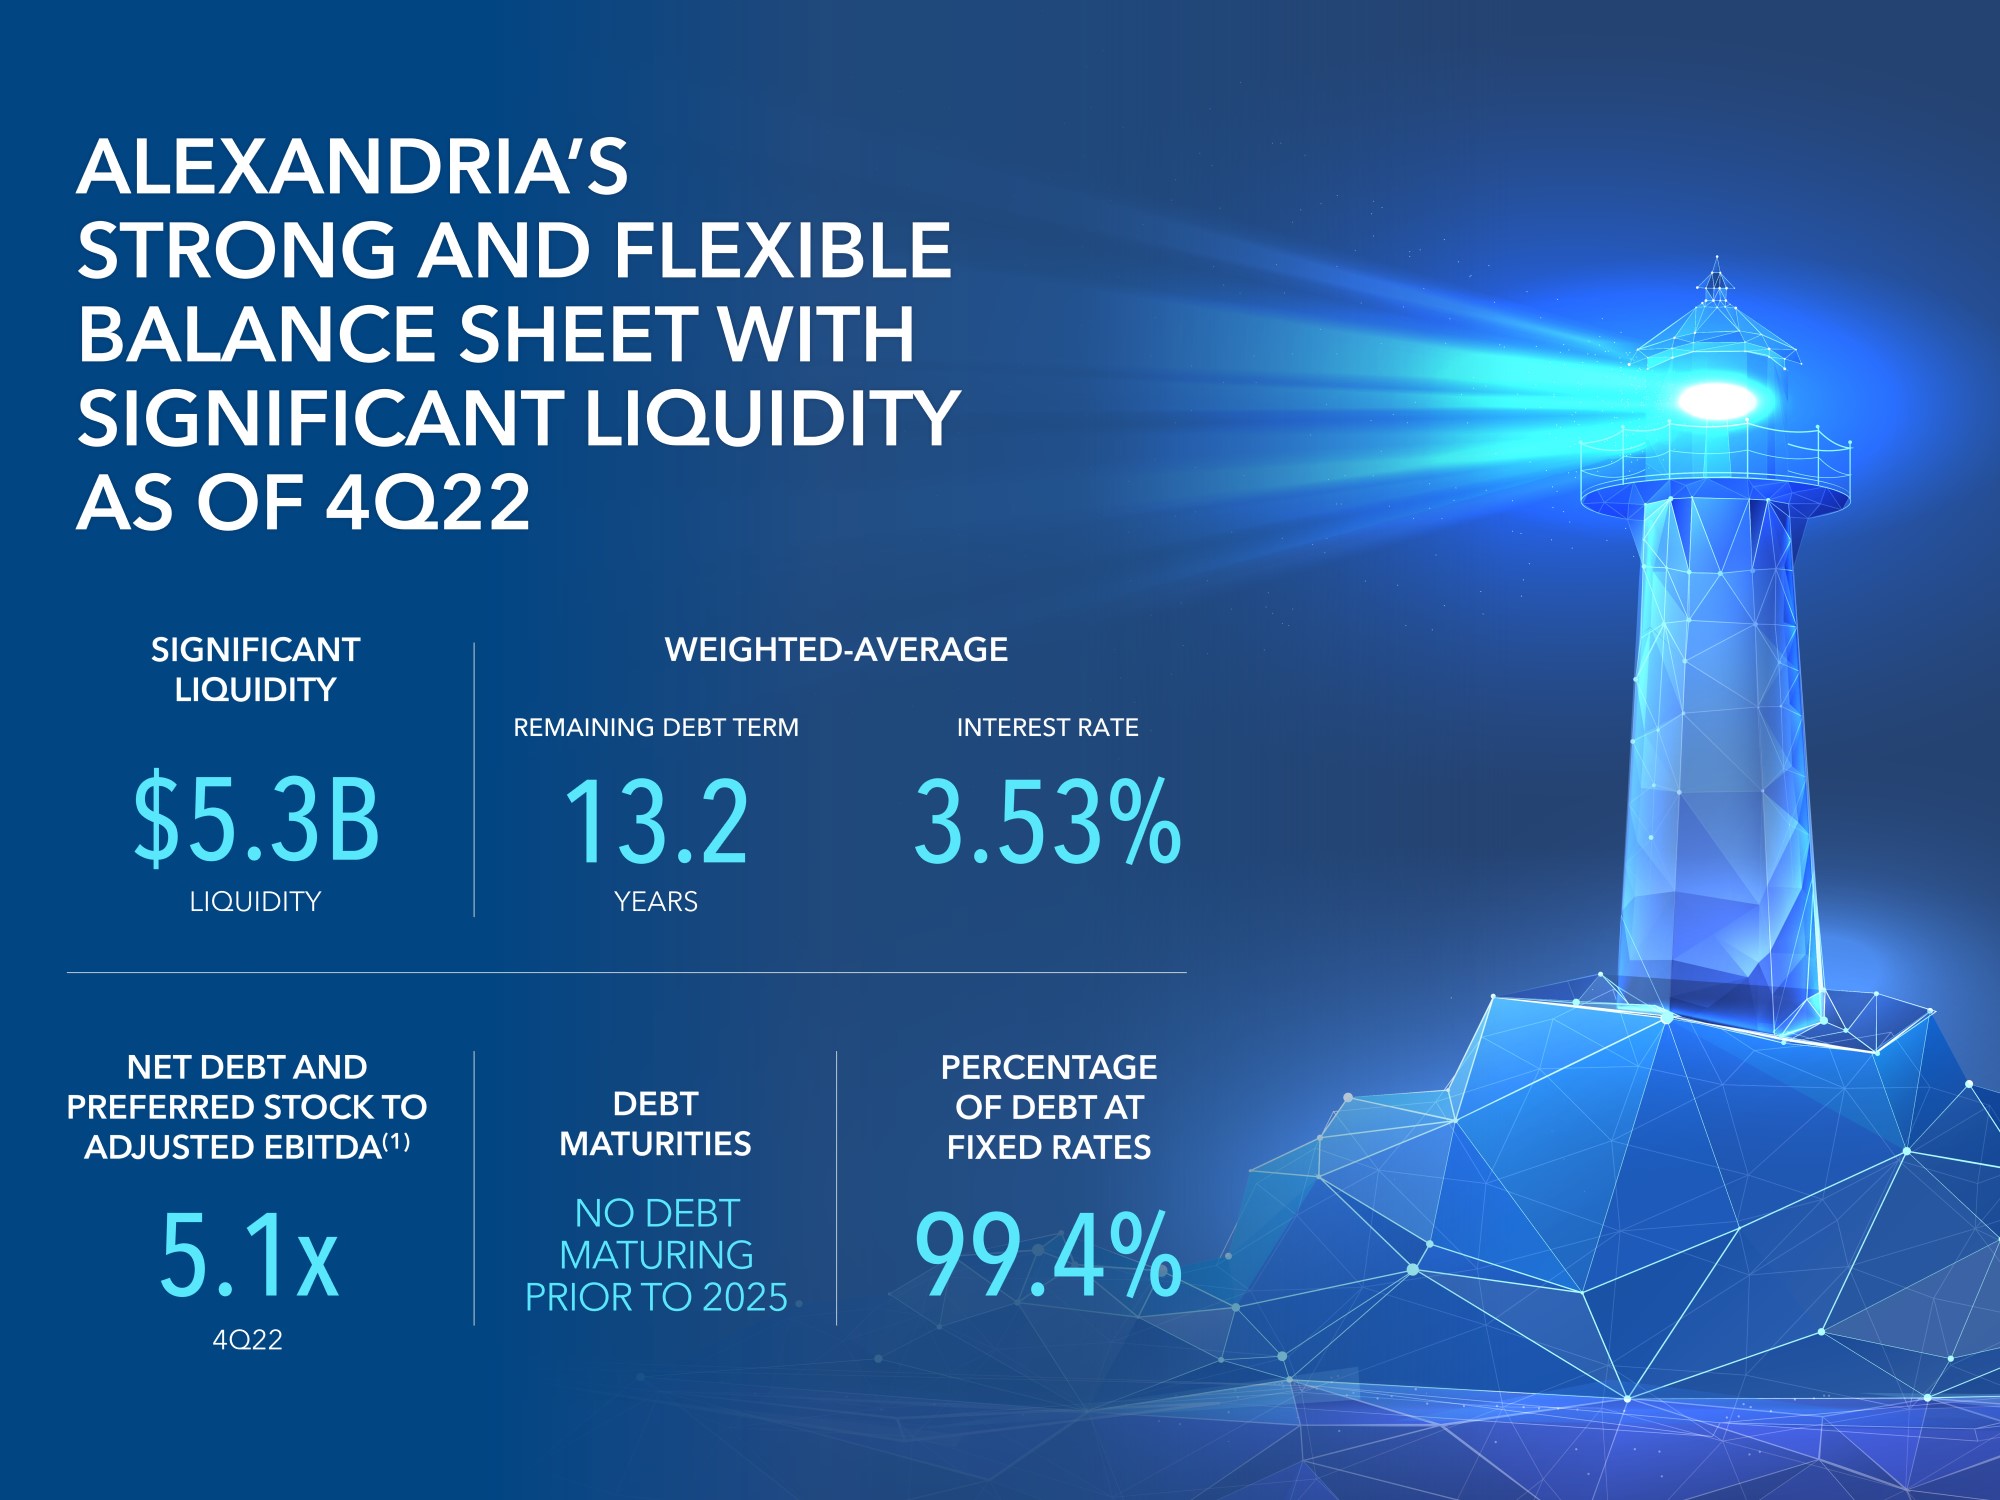
| Net debt and preferred stock to Adjusted EBITDA | 5.1x | 5.2x | Less than or equal to 5.1x | |||||||||||||||||||||||
| Fixed-charge coverage ratio | 5.0x | 5.0x | 4.5x to 5.0x | |||||||||||||||||||||||
| Value-creation pipeline of new Class A development and redevelopment projects as a percentage of gross assets | 4Q22 | |||||||
Under construction projects 68% leased/negotiating | 10% | |||||||
Near-term projects expected to commence construction in the next four quarters 88% leased | 2% | |||||||
Income-producing/potential cash flows/covered land play(1) | 7% | |||||||
| Land | 3% | |||||||
| |||||
Fourth Quarter and Year Ended December 31, 2022 Financial and Operating Results (continued) | |||||
December 31, 2022 | |||||
| Acquisitions | | ||||
December 31, 2022 | |||||
| (Dollars in thousands) | |||||
| Property | Submarket/Market | Date of Purchase | Number of Properties | Operating Occupancy | Square Footage | Purchase Price | |||||||||||||||||||||||||||||||||||||||||||||||||||||||||||
Acquisitions With Development/Redevelopment Opportunities(1) | |||||||||||||||||||||||||||||||||||||||||||||||||||||||||||||||||
| Future Development | Operating With Future Development/ Redevelopment | Operating(2) | Total(3) | ||||||||||||||||||||||||||||||||||||||||||||||||||||||||||||||
| Completed in YTD 3Q22 | 39 | 92 | % | 6,538,991 | 3,305,764 | 451,760 | 9,600,231 | $ | 2,437,592 | ||||||||||||||||||||||||||||||||||||||||||||||||||||||||
| Completed in 4Q22: | |||||||||||||||||||||||||||||||||||||||||||||||||||||||||||||||||
35 Gatehouse Drive(4) | Route 128/Greater Boston | 12/29/22 | 1 | 100 | 75,000 | 31,611 | 265,965 | 372,576 | 272,500 | ||||||||||||||||||||||||||||||||||||||||||||||||||||||||
| 1001 Trinity Street and 1020 Red River Street | Austin/Texas | 10/4/22 | 2 | 100 | 51,038 | 198,972 | — | 250,010 | 108,000 | ||||||||||||||||||||||||||||||||||||||||||||||||||||||||
| Other | 360 | ||||||||||||||||||||||||||||||||||||||||||||||||||||||||||||||||
| 3 | 100 | 126,038 | 230,583 | (5) | 265,965 | (5) | 622,586 | 380,860 | |||||||||||||||||||||||||||||||||||||||||||||||||||||||||
| Total 2022 acquisitions | 42 | 93 | % | 6,665,029 | 3,536,347 | 717,725 | 10,222,817 | $ | 2,818,452 | ||||||||||||||||||||||||||||||||||||||||||||||||||||||||
| Dispositions and Sales of Partial Interests | | ||||
December 31, 2022 | |||||
| (Dollars in thousands, except per RSF amounts) | |||||
| Capitalization Rate (Cash Basis) | Sales Price per RSF | Gain or Consideration in Excess of Book Value | ||||||||||||||||||||||||||||||||||||||||||||||||||||||||||||||||||||||||||||||
| Property | Submarket/Market | Date of Sale | Interest Sold | RSF | Capitalization Rate | Sales Price | ||||||||||||||||||||||||||||||||||||||||||||||||||||||||||||||||||||||||||
| 100 Binney Street | Cambridge/Inner Suburbs/ Greater Boston | 3/30/22 | 70 | % | 432,931 | 3.6 | % | 3.5 | % | $ | 713,228 | (1) | $ | 2,353 | $ | 413,615 | (2) | |||||||||||||||||||||||||||||||||||||||||||||||||||||||||||||||
| 300 Third Street | Cambridge/Inner Suburbs/ Greater Boston | 6/27/22 | 70 | % | 131,963 | 4.6 | % | 4.3 | % | 166,485 | (1) | $ | 1,802 | 113,020 | (2) | |||||||||||||||||||||||||||||||||||||||||||||||||||||||||||||||||
| Alexandria Park at 128, 285 Bear Hill Road, 111 and 130 Forbes Boulevard, and 20 Walkup Drive | Route 128 and Route 495/ Greater Boston | 6/8/22 | 100 | % | 617,043 | 5.1 | % | 5.1 | % | 334,397 | $ | 542 | 202,325 | |||||||||||||||||||||||||||||||||||||||||||||||||||||||||||||||||||
| 1450 Owens Street | Mission Bay/San Francisco Bay Area | 7/1/22 | 20 | % | (3) | 191,000 | N/A | N/A | 25,039 | (1) | N/A | 10,083 | (2) | |||||||||||||||||||||||||||||||||||||||||||||||||||||||||||||||||||
| 341 and 343 Oyster Point Boulevard, 7000 Shoreline Court, and Shoreway Science Center | South San Francisco and Greater Stanford/San Francisco Bay Area | 9/15/22 | 100 | % | 330,379 | 5.2 | % | 5.2 | % | 383,635 | $ | 1,161 | 223,127 | |||||||||||||||||||||||||||||||||||||||||||||||||||||||||||||||||||
| 3215 Merryfield Row | Torrey Pines/San Diego | 9/1/22 | 70 | % | 170,523 | 4.5 | % | 4.2 | % | 149,940 | (1) | $ | 1,256 | 42,214 | (2) | |||||||||||||||||||||||||||||||||||||||||||||||||||||||||||||||||
| Summers Ridge Science Park | Sorrento Mesa/San Diego | 9/15/22 | 70 | % | 316,531 | 4.9 | % | 4.6 | % | 159,600 | (1) | $ | 720 | 65,097 | (2) | |||||||||||||||||||||||||||||||||||||||||||||||||||||||||||||||||
| 7330 and 7360 Carroll Road | Sorrento Mesa/San Diego | 9/15/22 | 100 | % | 84,442 | 4.4 | % | 4.6 | % | 59,476 | $ | 704 | 35,463 | |||||||||||||||||||||||||||||||||||||||||||||||||||||||||||||||||||
| Other | Various | N/A | N/A | 230,496 | N/A | 77,003 | ||||||||||||||||||||||||||||||||||||||||||||||||||||||||||||||||||||||||||
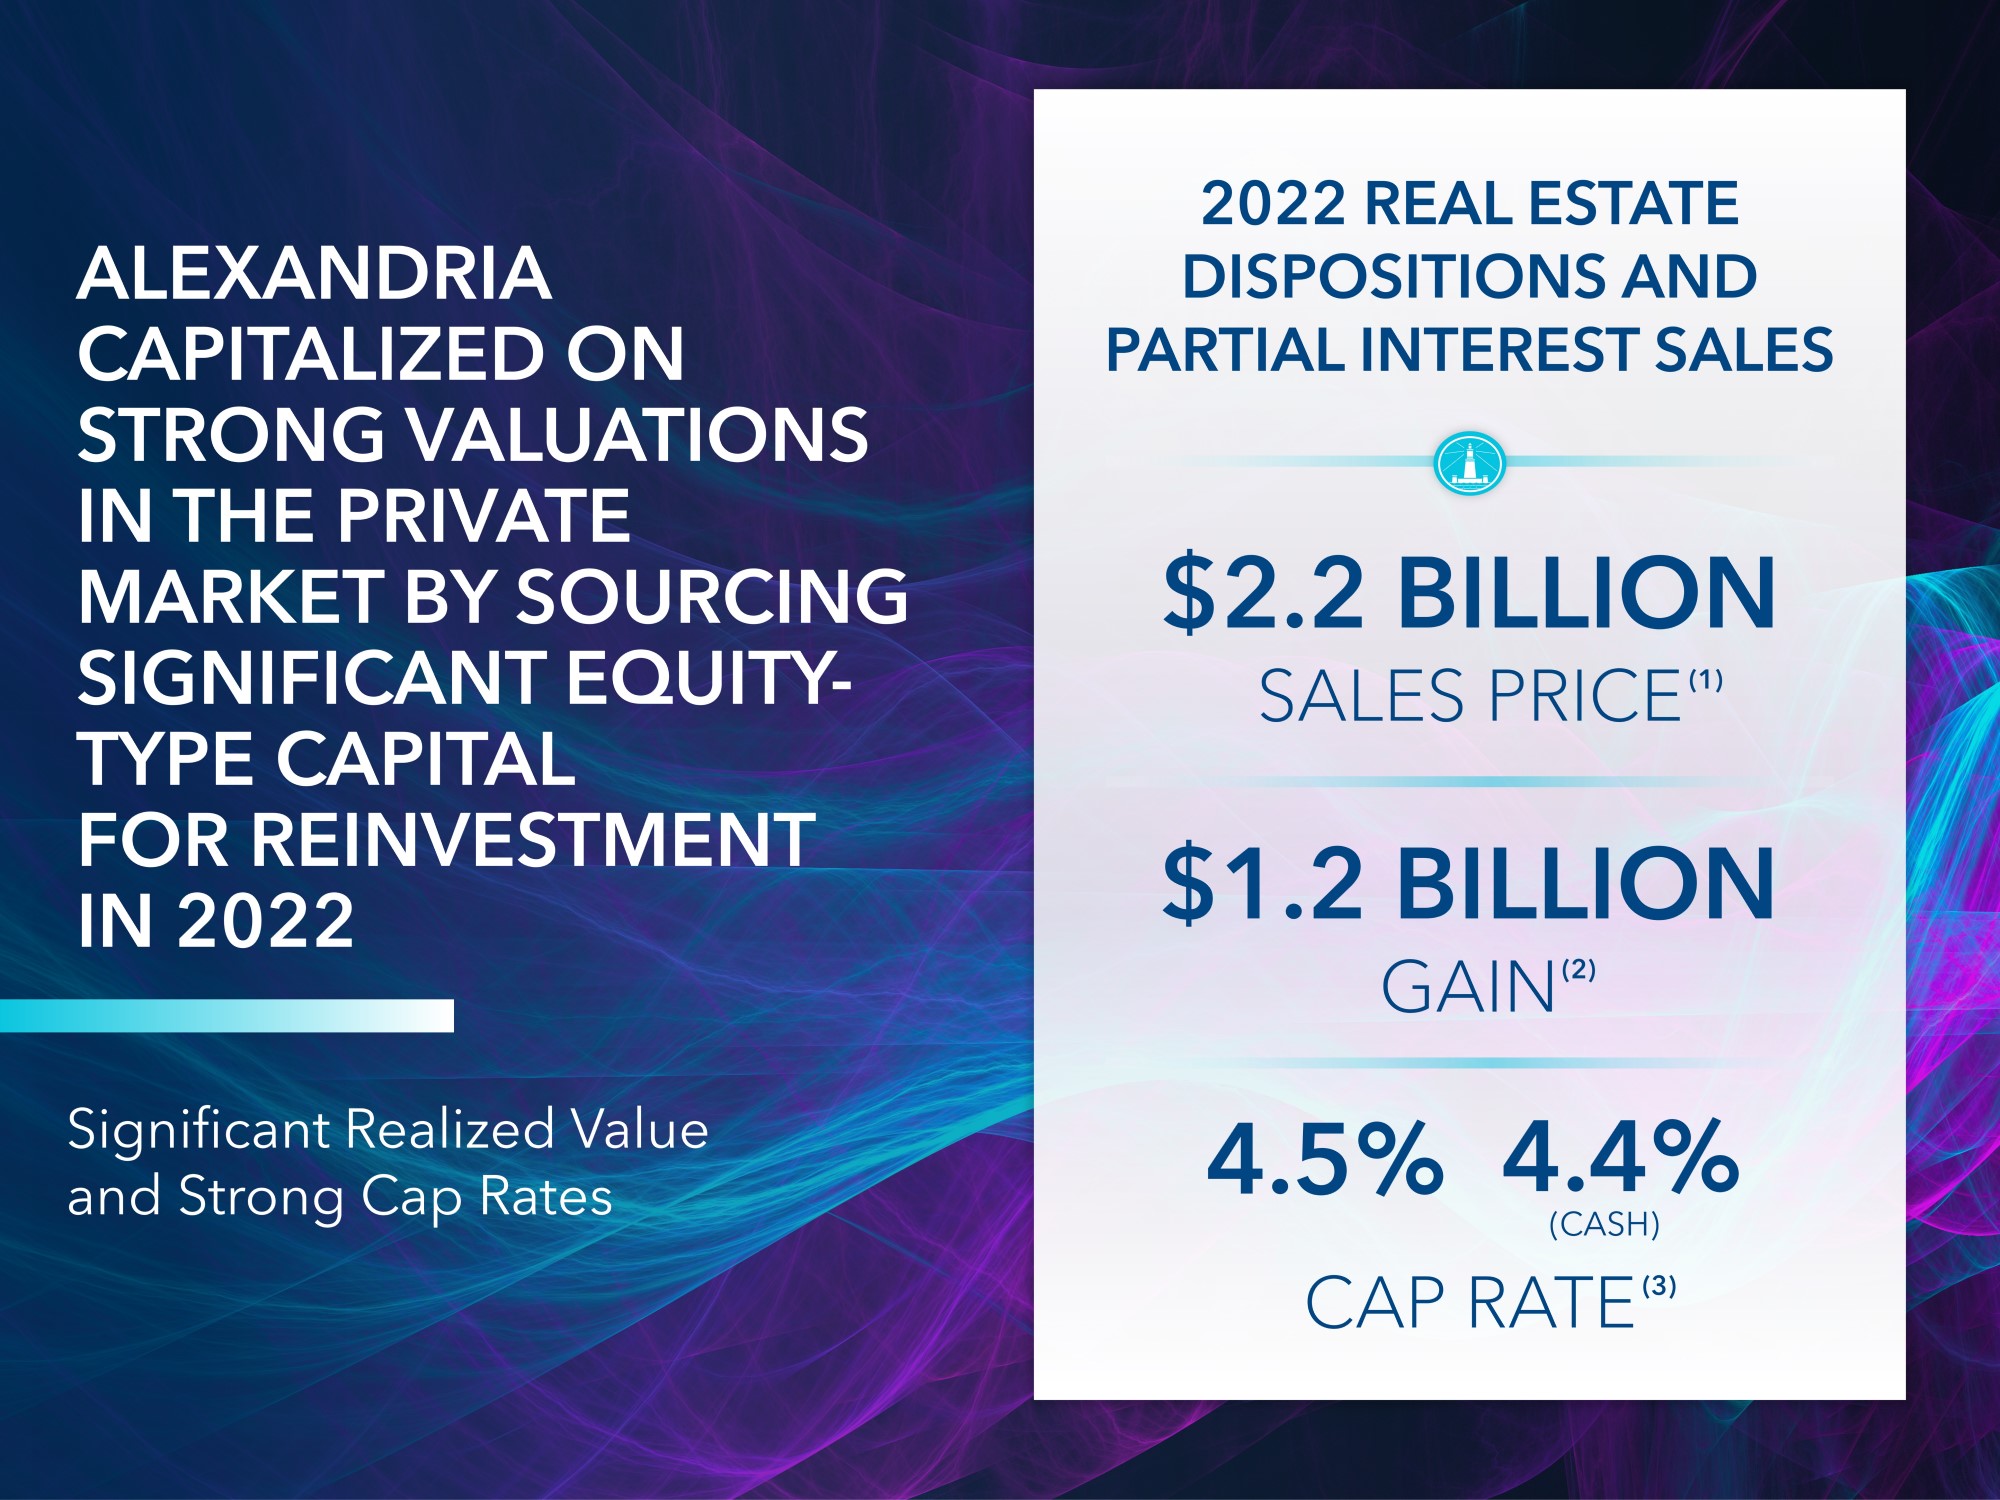
| Total 2022 dispositions and sales of partial interests | $ | 2,222,296 | $ | 1,181,947 | ||||||||||||||||||||||||||||||||||||||||||||||||||||||||||||||||||||||||||||
| Guidance | | ||||
December 31, 2022 | |||||
| (Dollars in millions, except per share amounts) | |||||
Projected 2023 Earnings per Share and Funds From Operations per Share Attributable to Alexandria’s Common Stockholders – Diluted | ||||||||||||||
Earnings per share(1) | $3.41 to $3.61 | |||||||||||||
| Depreciation and amortization of real estate assets | 5.50 | |||||||||||||
| Allocation to unvested restricted stock awards | (0.05) | |||||||||||||
Funds from operations per share(2) | $8.86 to $9.06 | |||||||||||||
| Midpoint | $8.96 | |||||||||||||
| Key Assumptions | Low | High | |||||||||||||||
Occupancy percentage in North America as of December 31, 2023 | 94.8% | 95.8% | |||||||||||||||
| Lease renewals and re-leasing of space: | |||||||||||||||||
| Rental rate increases | 27.0% | 32.0% | |||||||||||||||
| Rental rate increases (cash basis) | 11.0% | 16.0% | |||||||||||||||
| Same property performance: | |||||||||||||||||
| Net operating income increase | 2.0% | 4.0% | |||||||||||||||
| Net operating income increase (cash basis) | 4.0% | 6.0% | |||||||||||||||
| Straight-line rent revenue | $ | 130 | $ | 145 | |||||||||||||
| General and administrative expenses | $ | 183 | $ | 193 | |||||||||||||
| Capitalization of interest | $ | 342 | $ | 362 | |||||||||||||
| Interest expense | $ | 74 | $ | 94 | |||||||||||||
| Key Credit Metrics | 2023 Guidance | |||||||
Net debt and preferred stock to Adjusted EBITDA – 4Q23 annualized | Less than or equal to 5.1x | |||||||
Fixed-charge coverage ratio – 4Q23 annualized | 4.5x to 5.0x | |||||||
| Key Sources and Uses of Capital | Range | Midpoint | |||||||||||||||||||||
| Sources of capital: | |||||||||||||||||||||||
| Incremental debt | $ | 550 | $ | 850 | $ | 700 | |||||||||||||||||
| Excess 2022 bond capital held as cash at December 31, 2022 | 300 | 300 | 300 | ||||||||||||||||||||
| Net cash provided by operating activities after dividends | 350 | 400 | 375 | ||||||||||||||||||||
| Real estate dispositions, sales of partial interests, and issuances of common equity | 1,400 | 2,400 | 1,900 | (3) | |||||||||||||||||||
| Total sources of capital | $ | 2,600 | $ | 3,950 | $ | 3,275 | |||||||||||||||||
| Uses of capital: | |||||||||||||||||||||||
Construction (refer to page 48) | $ | 2,400 | $ | 3,550 | $ | 2,975 | |||||||||||||||||
Acquisitions (refer to page 4) | 200 | 400 | 300 | ||||||||||||||||||||
| Total uses of capital | $ | 2,600 | $ | 3,950 | $ | 3,275 | |||||||||||||||||
| Incremental debt (included above): | |||||||||||||||||||||||
| Issuance of unsecured senior notes payable | $ | 500 | $ | 1,000 | $ | 750 | |||||||||||||||||
| Unsecured senior line of credit, commercial paper, and other | 50 | (150) | (50) | ||||||||||||||||||||
| Incremental debt | $ | 550 | $ | 850 | $ | 700 | |||||||||||||||||
| |||||
| Earnings Call Information and About the Company | |||||
December 31, 2022 | |||||
| Consolidated Statements of Operations | | ||||
December 31, 2022 | |||||
| (Dollars in thousands, except per share amounts) | |||||
| Three Months Ended | Year Ended | |||||||||||||||||||||||||||||||||||||||||||
| 12/31/22 | 9/30/22 | 6/30/22 | 3/31/22 | 12/31/21 | 12/31/22 | 12/31/21 | ||||||||||||||||||||||||||||||||||||||
| Revenues: | ||||||||||||||||||||||||||||||||||||||||||||
| Income from rentals | $ | 665,674 | $ | 656,853 | $ | 640,959 | $ | 612,554 | $ | 574,656 | $ | 2,576,040 | $ | 2,108,249 | ||||||||||||||||||||||||||||||
| Other income | 4,607 | 2,999 | 2,805 | 2,511 | 2,267 | 12,922 | 5,901 | |||||||||||||||||||||||||||||||||||||
| Total revenues | 670,281 | 659,852 | 643,764 | 615,065 | 576,923 | 2,588,962 | 2,114,150 | |||||||||||||||||||||||||||||||||||||
| Expenses: | ||||||||||||||||||||||||||||||||||||||||||||
| Rental operations | 204,352 | 201,189 | 196,284 | 181,328 | 175,717 | 783,153 | 623,555 | |||||||||||||||||||||||||||||||||||||
| General and administrative | 42,992 | 49,958 | 43,397 | 40,931 | 41,654 | 177,278 | 151,461 | |||||||||||||||||||||||||||||||||||||
| Interest | 17,522 | 22,984 | 24,257 | 29,440 | 34,862 | 94,203 | 142,165 | |||||||||||||||||||||||||||||||||||||
| Depreciation and amortization | 264,480 | 254,929 | 242,078 | 240,659 | 239,254 | 1,002,146 | 821,061 | |||||||||||||||||||||||||||||||||||||
| Impairment of real estate | 26,186 | 38,783 | — | — | — | 64,969 | 52,675 | |||||||||||||||||||||||||||||||||||||
| Loss on early extinguishment of debt | — | — | 3,317 | — | — | 3,317 | 67,253 | |||||||||||||||||||||||||||||||||||||
| Total expenses | 555,532 | 567,843 | 509,333 | 492,358 | 491,487 | 2,125,066 | 1,858,170 | |||||||||||||||||||||||||||||||||||||
| Equity in earnings of unconsolidated real estate joint ventures | 172 | 40 | 213 | 220 | 3,018 | 645 | 12,255 | |||||||||||||||||||||||||||||||||||||
| Investment (loss) income | (19,653) | (32,305) | (39,481) | (240,319) | (112,884) | (331,758) | 259,477 | |||||||||||||||||||||||||||||||||||||
| Gain on sales of real estate | — | 323,699 | 214,219 | — | 124,226 | 537,918 | 126,570 | |||||||||||||||||||||||||||||||||||||
| Net income (loss) | 95,268 | 383,443 | 309,382 | (117,392) | 99,796 | 670,701 | 654,282 | |||||||||||||||||||||||||||||||||||||
| Net income attributable to noncontrolling interests | (40,949) | (38,747) | (37,168) | (32,177) | (24,901) | (149,041) | (83,035) | |||||||||||||||||||||||||||||||||||||
| Net income (loss) attributable to Alexandria Real Estate Equities, Inc.’s stockholders | 54,319 | 344,696 | 272,214 | (149,569) | 74,895 | 521,660 | 571,247 | |||||||||||||||||||||||||||||||||||||
Net income attributable to unvested restricted stock awards | (2,526) | (3,257) | (2,934) | (2,081) | (2,098) | (8,392) | (7,848) | |||||||||||||||||||||||||||||||||||||
| Net income (loss) attributable to Alexandria Real Estate Equities, Inc.’s common stockholders | $ | 51,793 | $ | 341,439 | $ | 269,280 | $ | (151,650) | $ | 72,797 | $ | 513,268 | $ | 563,399 | ||||||||||||||||||||||||||||||
| Net income (loss) per share attributable to Alexandria Real Estate Equities, Inc.’s common stockholders: | ||||||||||||||||||||||||||||||||||||||||||||
| Basic | $ | 0.31 | $ | 2.11 | $ | 1.67 | $ | (0.96) | $ | 0.47 | $ | 3.18 | $ | 3.83 | ||||||||||||||||||||||||||||||
| Diluted | $ | 0.31 | $ | 2.11 | $ | 1.67 | $ | (0.96) | $ | 0.47 | $ | 3.18 | $ | 3.82 | ||||||||||||||||||||||||||||||
| Weighted-average shares of common stock outstanding: | ||||||||||||||||||||||||||||||||||||||||||||
| Basic | 165,393 | 161,554 | 161,412 | 158,198 | 153,464 | 161,659 | 146,921 | |||||||||||||||||||||||||||||||||||||
| Diluted | 165,393 | 161,554 | 161,412 | 158,198 | 154,307 | 161,659 | 147,460 | |||||||||||||||||||||||||||||||||||||
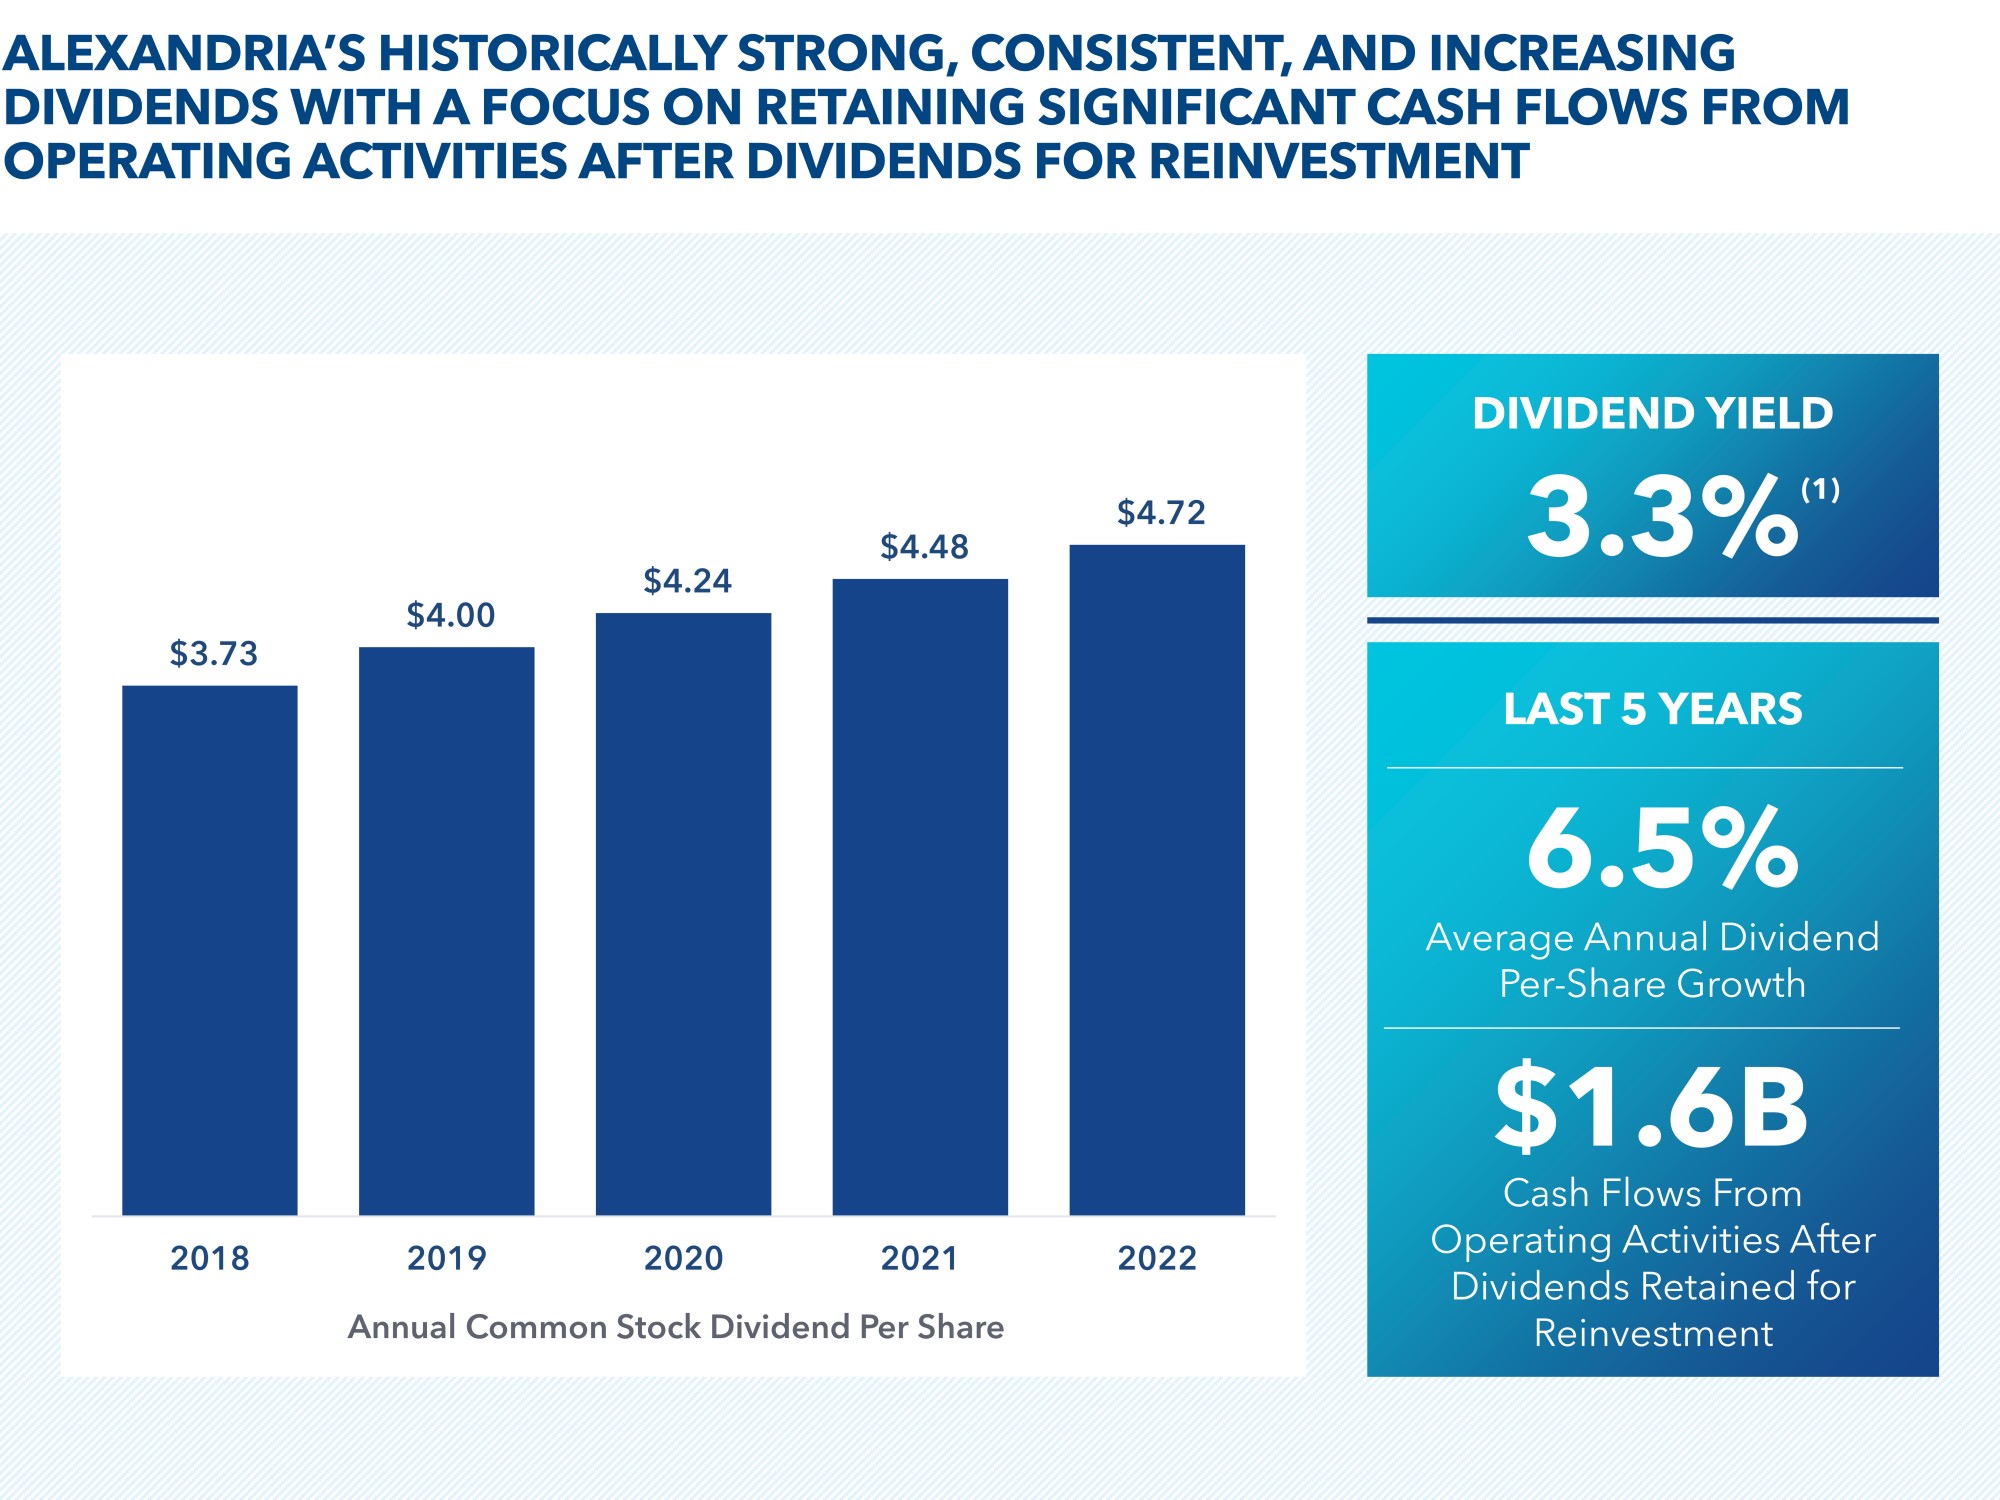
| Dividends declared per share of common stock | $ | 1.21 | $ | 1.18 | $ | 1.18 | $ | 1.15 | $ | 1.15 | $ | 4.72 | $ | 4.48 | ||||||||||||||||||||||||||||||
| Consolidated Balance Sheets | | ||||
December 31, 2022 | |||||
| (In thousands) | |||||
| 12/31/22 | 9/30/22 | 6/30/22 | 3/31/22 | 12/31/21 | ||||||||||||||||||||||||||||
| Assets | ||||||||||||||||||||||||||||||||
| Investments in real estate | $ | 29,945,440 | $ | 28,771,745 | $ | 27,952,931 | $ | 27,100,009 | $ | 24,980,669 | ||||||||||||||||||||||
| Investments in unconsolidated real estate joint ventures | 38,435 | 38,285 | 37,587 | 38,456 | 38,483 | |||||||||||||||||||||||||||
| Cash and cash equivalents | 825,193 | 533,824 | 420,258 | 775,060 | 361,348 | |||||||||||||||||||||||||||
| Restricted cash | 32,782 | 332,344 | 97,404 | 95,106 | 53,879 | |||||||||||||||||||||||||||
| Tenant receivables | 7,614 | 7,759 | 7,069 | 7,570 | 7,379 | |||||||||||||||||||||||||||
| Deferred rent | 942,646 | 918,995 | 905,699 | 881,743 | 839,335 | |||||||||||||||||||||||||||
| Deferred leasing costs | 516,275 | 506,864 | 498,434 | 484,184 | 402,898 | |||||||||||||||||||||||||||
| Investments | 1,615,074 | 1,624,921 | 1,657,461 | 1,661,101 | 1,876,564 | |||||||||||||||||||||||||||
| Other assets | 1,599,940 | 1,633,877 | 1,667,210 | 1,801,027 | 1,658,818 | |||||||||||||||||||||||||||
| Total assets | $ | 35,523,399 | $ | 34,368,614 | $ | 33,244,053 | $ | 32,844,256 | $ | 30,219,373 | ||||||||||||||||||||||
| Liabilities, Noncontrolling Interests, and Equity | ||||||||||||||||||||||||||||||||
| Secured notes payable | $ | 59,045 | $ | 40,594 | $ | 24,986 | $ | 208,910 | $ | 205,198 | ||||||||||||||||||||||
| Unsecured senior notes payable | 10,100,717 | 10,098,588 | 10,096,462 | 10,094,337 | 8,316,678 | |||||||||||||||||||||||||||
| Unsecured senior line of credit and commercial paper | — | 386,666 | 149,958 | — | 269,990 | |||||||||||||||||||||||||||
Accounts payable, accrued expenses, and other liabilities | 2,471,259 | 2,393,764 | 2,317,940 | 2,172,692 | 2,210,410 | |||||||||||||||||||||||||||
| Dividends payable | 209,131 | 193,623 | 192,571 | 187,701 | 183,847 | |||||||||||||||||||||||||||
| Total liabilities | 12,840,152 | 13,113,235 | 12,781,917 | 12,663,640 | 11,186,123 | |||||||||||||||||||||||||||
| Commitments and contingencies | ||||||||||||||||||||||||||||||||
| Redeemable noncontrolling interests | 9,612 | 9,612 | 9,612 | 9,612 | 9,612 | |||||||||||||||||||||||||||
Alexandria Real Estate Equities, Inc.’s stockholders’ equity: | ||||||||||||||||||||||||||||||||
Common stock | 1,707 | 1,626 | 1,615 | 1,614 | 1,580 | |||||||||||||||||||||||||||
| Additional paid-in capital | 18,991,492 | 17,639,434 | 17,149,571 | 16,934,094 | 16,195,256 | |||||||||||||||||||||||||||
| Accumulated other comprehensive loss | (20,812) | (24,725) | (11,851) | (5,727) | (7,294) | |||||||||||||||||||||||||||
| Alexandria Real Estate Equities, Inc.’s stockholders’ equity | 18,972,387 | 17,616,335 | 17,139,335 | 16,929,981 | 16,189,542 | |||||||||||||||||||||||||||
| Noncontrolling interests | 3,701,248 | 3,629,432 | 3,313,189 | 3,241,023 | 2,834,096 | |||||||||||||||||||||||||||
| Total equity | 22,673,635 | 21,245,767 | 20,452,524 | 20,171,004 | 19,023,638 | |||||||||||||||||||||||||||
Total liabilities, noncontrolling interests, and equity | $ | 35,523,399 | $ | 34,368,614 | $ | 33,244,053 | $ | 32,844,256 | $ | 30,219,373 | ||||||||||||||||||||||
| Funds From Operations and Funds From Operations per Share | | ||||
December 31, 2022 | |||||
| (In thousands) | |||||
| Three Months Ended | Year Ended | |||||||||||||||||||||||||||||||||||||||||||
| 12/31/22 | 9/30/22 | 6/30/22 | 3/31/22 | 12/31/21 | 12/31/22 | 12/31/21 | ||||||||||||||||||||||||||||||||||||||
| Net income (loss) attributable to Alexandria’s common stockholders | $ | 51,793 | $ | 341,439 | $ | 269,280 | $ | (151,650) | $ | 72,797 | $ | 513,268 | $ | 563,399 | ||||||||||||||||||||||||||||||
| Depreciation and amortization of real estate assets | 261,185 | 251,453 | 238,565 | 237,160 | 234,979 | 988,363 | 804,633 | |||||||||||||||||||||||||||||||||||||
Noncontrolling share of depreciation and amortization from consolidated real estate JVs | (29,702) | (27,790) | (26,418) | (23,681) | (21,265) | (107,591) | (70,880) | |||||||||||||||||||||||||||||||||||||
Our share of depreciation and amortization from unconsolidated real estate JVs | 982 | 795 | 934 | 955 | 3,058 | 3,666 | 13,734 | |||||||||||||||||||||||||||||||||||||
| Gain on sales of real estate | — | (323,699) | (214,219) | — | (124,226) | (537,918) | (126,570) | |||||||||||||||||||||||||||||||||||||
Impairment of real estate – rental properties | 20,899 | (1) | — | — | — | — | 20,899 | 25,485 | ||||||||||||||||||||||||||||||||||||
Allocation to unvested restricted stock awards | (953) | 1,002 | — | — | — | (1,118) | (6,315) | |||||||||||||||||||||||||||||||||||||
Funds from operations attributable to Alexandria’s common stockholders – diluted(2) | 304,204 | 243,200 | 268,142 | 62,784 | 165,343 | 879,569 | 1,203,486 | |||||||||||||||||||||||||||||||||||||
| Unrealized losses (gains) on non-real estate investments | 24,117 | 56,515 | 68,128 | 263,433 | 139,716 | 412,193 | (43,632) | |||||||||||||||||||||||||||||||||||||
| Significant realized gains on non-real estate investments | — | — | — | — | — | — | (110,119) | |||||||||||||||||||||||||||||||||||||
| Impairment of non-real estate investments | 20,512 | (3) | — | — | — | — | 20,512 | (3) | — | |||||||||||||||||||||||||||||||||||
Impairment of real estate | 5,287 | 38,783 | — | — | — | 44,070 | 27,190 | |||||||||||||||||||||||||||||||||||||
Loss on early extinguishment of debt | — | — | 3,317 | — | — | 3,317 | 67,253 | |||||||||||||||||||||||||||||||||||||
| Acceleration of stock compensation expense due to executive officer resignation | — | 7,185 | — | — | — | 7,185 | — | |||||||||||||||||||||||||||||||||||||
Allocation to unvested restricted stock awards | (482) | (1,033) | (778) | (1,604) | (1,432) | (5,137) | 710 | |||||||||||||||||||||||||||||||||||||
| Funds from operations attributable to Alexandria’s common stockholders – diluted, as adjusted | $ | 353,638 | $ | 344,650 | $ | 338,809 | $ | 324,613 | $ | 303,627 | $ | 1,361,709 | $ | 1,144,888 | ||||||||||||||||||||||||||||||
| Funds From Operations and Funds From Operations per Share (continued) | | ||||
December 31, 2022 | |||||
| (In thousands, except per share amounts) | |||||
| Three Months Ended | Year Ended | |||||||||||||||||||||||||||||||||||||||||||
| 12/31/22 | 9/30/22 | 6/30/22 | 3/31/22 | 12/31/21 | 12/31/22 | 12/31/21 | ||||||||||||||||||||||||||||||||||||||
| Net income (loss) per share attributable to Alexandria’s common stockholders – diluted | $ | 0.31 | $ | 2.11 | $ | 1.67 | $ | (0.96) | $ | 0.47 | $ | 3.18 | $ | 3.82 | ||||||||||||||||||||||||||||||
Depreciation and amortization of real estate assets | 1.41 | 1.39 | 1.32 | 1.36 | 1.40 | 5.47 | 5.07 | |||||||||||||||||||||||||||||||||||||
| Gain on sales of real estate | — | (2.00) | (1.33) | — | (0.80) | (3.33) | (0.86) | |||||||||||||||||||||||||||||||||||||
| Impairment of real estate – rental properties | 0.13 | (1) | — | — | — | — | 0.13 | 0.17 | ||||||||||||||||||||||||||||||||||||
Allocation to unvested restricted stock awards | (0.01) | 0.01 | — | — | — | (0.01) | (0.04) | |||||||||||||||||||||||||||||||||||||
Funds from operations per share attributable to Alexandria’s common stockholders – diluted | 1.84 | 1.51 | 1.66 | 0.40 | 1.07 | 5.44 | 8.16 | |||||||||||||||||||||||||||||||||||||
| Unrealized losses (gains) on non-real estate investments | 0.15 | 0.35 | 0.42 | 1.67 | 0.91 | 2.55 | (0.30) | |||||||||||||||||||||||||||||||||||||
| Significant realized gains on non-real estate investments | — | — | — | — | — | — | (0.75) | |||||||||||||||||||||||||||||||||||||
| Impairment of non-real estate investments | 0.12 | (1) | — | — | — | — | 0.13 | (1) | — | |||||||||||||||||||||||||||||||||||
| Impairment of real estate | 0.03 | 0.24 | — | — | — | 0.27 | 0.18 | |||||||||||||||||||||||||||||||||||||
Loss on early extinguishment of debt | — | — | 0.02 | — | — | 0.02 | 0.46 | |||||||||||||||||||||||||||||||||||||
| Acceleration of stock compensation expense due to executive officer resignation | — | 0.04 | — | — | — | 0.04 | — | |||||||||||||||||||||||||||||||||||||
Allocation to unvested restricted stock awards | — | (0.01) | — | (0.02) | (0.01) | (0.03) | 0.01 | |||||||||||||||||||||||||||||||||||||
Funds from operations per share attributable to Alexandria’s common stockholders – diluted, as adjusted | $ | 2.14 | $ | 2.13 | $ | 2.10 | $ | 2.05 | $ | 1.97 | $ | 8.42 | $ | 7.76 | ||||||||||||||||||||||||||||||
| Weighted-average shares of common stock outstanding for calculation of: | ||||||||||||||||||||||||||||||||||||||||||||
| Earnings per share – diluted | 165,393 | 161,554 | 161,412 | 158,198 | 154,307 | 161,659 | 147,460 | |||||||||||||||||||||||||||||||||||||
| Funds from operations, diluted, per share | 165,393 | 161,554 | 161,412 | 158,209 | 154,307 | 161,659 | 147,460 | |||||||||||||||||||||||||||||||||||||
| Funds from operations, diluted, as adjusted, per share | 165,393 | 161,554 | 161,412 | 158,209 | 154,307 | 161,659 | 147,460 | |||||||||||||||||||||||||||||||||||||
| |||||
| Company Profile | |||||
December 31, 2022 | |||||
| EXECUTIVE MANAGEMENT TEAM | ||||||||
| Joel S. Marcus | Peter M. Moglia | |||||||
| Executive Chairman & Founder | Chief Executive Officer & Co-Chief Investment Officer | |||||||
| Dean A. Shigenaga | Daniel J. Ryan | |||||||
| President & Chief Financial Officer | Co-Chief Investment Officer & Regional Market Director – San Diego | |||||||
| Hunter L. Kass | John H. Cunningham | |||||||
| Executive Vice President – Regional Market Director – Greater Boston | Executive Vice President – Regional Market Director – New York City | |||||||
| Lawrence J. Diamond | Vincent R. Ciruzzi | |||||||
| Co-Chief Operating Officer & Regional Market Director – Maryland | Chief Development Officer | |||||||
| Joseph Hakman | Jackie B. Clem | |||||||
| Co-Chief Operating Officer & Chief Strategic Transactions Officer | General Counsel & Secretary | |||||||
| Marc E. Binda | Andres R. Gavinet | |||||||
| Executive Vice President – Finance & Treasurer | Chief Accounting Officer | |||||||
| Gary D. Dean | Terezia C. Nemeth | |||||||
| Executive Vice President – Real Estate Legal Affairs | Executive Vice President – Regional Market Director – San Francisco Bay Area | |||||||
| Onn C. Lee | Kristina A. Fukuzaki-Carlson | |||||||
| Executive Vice President – Accounting | Executive Vice President – Business Operations | |||||||
| Madeleine T. Alsbrook | ||||||||
| Executive Vice President – Talent Management | ||||||||
| |||||
| Investor Information | |||||
December 31, 2022 | |||||
| Corporate Headquarters | New York Stock Exchange Trading Symbol | Information Requests | |||||||||||||||
| 26 North Euclid Avenue | Common stock: ARE | Phone: | (626) 578-0777 | ||||||||||||||
| Pasadena, California 91101 | Email: | corporateinformation@are.com | |||||||||||||||
| Website: | www.are.com | ||||||||||||||||
| Equity Research Coverage | ||
Alexandria is currently covered by the following research analysts. This list may be incomplete and is subject to change as firms initiate or discontinue coverage of our company. Please note that any opinions, estimates, or forecasts regarding our historical or predicted performance made by these analysts are theirs alone and do not represent opinions, estimates, or forecasts of Alexandria or our management. Alexandria does not by our reference or distribution of the information below imply our endorsement of or concurrence with any opinions, estimates, or forecasts of these analysts. Interested persons may obtain copies of analysts’ reports on their own as we do not distribute these reports. Several of these firms may, from time to time, own our stock and/or hold other long or short positions in our stock and may provide compensated services to us. | ||
| Bank of America Merrill Lynch | Citigroup Global Markets Inc. | JMP Securities | RBC Capital Markets | |||||||||||||||||
| Jeff Spector / Joshua Dennerlein | Nicholas Joseph / Michael Griffin | Aaron Hecht | Michael Carroll / Aditi Balachandran | |||||||||||||||||
| (646) 855-1363 / (646) 855-1681 | (212) 816-1909 / (212) 816-5871 | (415) 835-3963 | (440) 715-2649 / (212) 428-6200 | |||||||||||||||||
| BTIG, LLC | Evercore ISI | J.P. Morgan Securities LLC | Robert W. Baird & Co. Incorporated | |||||||||||||||||
| Tom Catherwood / John Nickodemus | Steve Sakwa / Jay Poskitt | Anthony Paolone / Ray Zhong | David Rodgers / Nicholas Thillman | |||||||||||||||||
| (212) 738-6140 / (212) 738-6050 | (212) 446-9462 / (212) 752-0886 | (212) 622-6682 / (212) 622-5411 | (216) 737-7341 / (414) 298-5053 | |||||||||||||||||
| CFRA | Green Street | Mizuho Securities USA LLC | SMBC Nikko Securities America, Inc. | |||||||||||||||||
| Kenneth Leon | Dylan Burzinski / Michael Manos | Vikram Malhotra / Georgi Dinkov | Richard Anderson / Jay Kornreich | |||||||||||||||||
| (646) 517-2552 | (949) 640-8780 / (949) 640-8780 | (212) 282-3827 / (617) 352-1721 | (646) 521-2351 / (646) 424-3202 | |||||||||||||||||
| Fixed Income Coverage | Rating Agencies | |||||||||||||||||||
| Barclays Capital Inc. | Stifel Financial Corp. | Moody’s Investors Service | S&P Global Ratings | |||||||||||||||||
| Srinjoy Banerjee | Thierry Perrein | (212) 553-0376 | Michael Souers | |||||||||||||||||
| (212) 526-3521 | (646) 376-5303 | (212) 438-2508 | ||||||||||||||||||
| J.P. Morgan Securities LLC | ||||||||||||||||||||
| Mark Streeter / Ian Snyder | ||||||||||||||||||||
| (212) 834-5086 / (212) 834-3798 | ||||||||||||||||||||
| Financial and Asset Base Highlights | | ||||
December 31, 2022 | |||||
| (Dollars in thousands, except per share amounts) | |||||
| Three Months Ended (unless stated otherwise) | ||||||||||||||||||||||||||||||||
| 12/31/22 | 9/30/22 | 6/30/22 | 3/31/22 | 12/31/21 | ||||||||||||||||||||||||||||
Selected financial data from consolidated financial statements and related information | ||||||||||||||||||||||||||||||||
Rental revenues | $ | 499,348 | $ | 496,146 | $ | 485,067 | $ | 469,537 | $ | 435,637 | ||||||||||||||||||||||
Tenant recoveries | $ | 166,326 | $ | 160,707 | $ | 155,892 | $ | 143,017 | $ | 139,019 | ||||||||||||||||||||||
| General and administrative expenses | $ | 42,992 | $ | 49,958 | $ | 43,397 | $ | 40,931 | $ | 41,654 | ||||||||||||||||||||||
General and administrative expenses as a percentage of net operating income – trailing 12 months | 9.8% | 10.1% | 9.8% | 10.0% | 10.2% | |||||||||||||||||||||||||||
| Operating margin | 70% | 70% | 70% | 71% | 70% | |||||||||||||||||||||||||||
Adjusted EBITDA margin | 69% | 69% | 70% | 71% | 71% | |||||||||||||||||||||||||||
Adjusted EBITDA – quarter annualized | $ | 1,846,936 | $ | 1,810,764 | $ | 1,797,488 | $ | 1,734,956 | $ | 1,631,244 | ||||||||||||||||||||||
Adjusted EBITDA – trailing 12 months | $ | 1,797,536 | $ | 1,743,613 | $ | 1,680,335 | $ | 1,601,857 | $ | 1,517,838 | ||||||||||||||||||||||
Net debt at end of period | $ | 9,376,705 | $ | 9,736,627 | $ | 9,832,722 | $ | 9,514,256 | $ | 8,442,115 | ||||||||||||||||||||||
| Net debt and preferred stock to Adjusted EBITDA – quarter annualized | 5.1x | 5.4x | 5.5x | 5.5x | 5.2x | |||||||||||||||||||||||||||
| Net debt and preferred stock to Adjusted EBITDA – trailing 12 months | 5.2x | 5.6x | 5.9x | 5.9x | 5.6x | |||||||||||||||||||||||||||
| Total debt and preferred stock at end of period | $ | 10,159,762 | $ | 10,525,848 | $ | 10,271,406 | $ | 10,303,247 | $ | 8,791,866 | ||||||||||||||||||||||
| Gross assets at end of period | $ | 39,877,462 | $ | 38,516,844 | $ | 37,304,589 | $ | 36,795,922 | $ | 33,990,614 | ||||||||||||||||||||||
| Total debt and preferred stock to gross assets at end of period | 25% | 27% | 28% | 28% | 26% | |||||||||||||||||||||||||||
Fixed-charge coverage ratio – quarter annualized | 5.0x | 4.9x | 5.1x | 5.1x | 5.3x | |||||||||||||||||||||||||||
Fixed-charge coverage ratio – trailing 12 months | 5.0x | 5.1x | 5.1x | 5.1x | 5.0x | |||||||||||||||||||||||||||
Unencumbered net operating income as a percentage of total net operating income | 100% | 100% | 100% | 97% | 97% | |||||||||||||||||||||||||||
Closing stock price at end of period | $ | 145.67 | $ | 140.19 | $ | 145.03 | $ | 201.25 | $ | 222.96 | ||||||||||||||||||||||
Common shares outstanding (in thousands) at end of period | 170,748 | 162,620 | 161,456 | 161,408 | 158,044 | |||||||||||||||||||||||||||
Total equity capitalization at end of period | $ | 24,872,919 | $ | 22,797,633 | $ | 23,415,970 | $ | 32,483,420 | $ | 35,237,463 | ||||||||||||||||||||||
Total market capitalization at end of period | $ | 35,032,681 | $ | 33,323,481 | $ | 33,687,376 | $ | 42,786,667 | $ | 44,029,329 | ||||||||||||||||||||||
Dividend per share – quarter/annualized | $1.21/$4.84 | $1.18/$4.72 | $1.18/$4.72 | $1.15/$4.60 | $1.15/$4.60 | |||||||||||||||||||||||||||
Dividend payout ratio for the quarter | 58% | 56% | 56% | 57% | 60% | |||||||||||||||||||||||||||
Dividend yield – annualized | 3.3% | 3.4% | 3.3% | 2.3% | 2.1% | |||||||||||||||||||||||||||
Amounts related to operating leases: | ||||||||||||||||||||||||||||||||
| Operating lease liabilities at end of period | $ | 406,700 | $ | 409,030 | $ | 412,535 | $ | 405,818 | $ | 434,745 | ||||||||||||||||||||||
Rent expense | $ | 8,722 | $ | 8,502 | $ | 7,924 | $ | 7,718 | $ | 7,124 | ||||||||||||||||||||||
Capitalized interest | $ | 79,491 | $ | 73,189 | $ | 68,202 | $ | 57,763 | $ | 44,078 | ||||||||||||||||||||||
Weighted-average interest rate for capitalization of interest during the period | 3.65% | 3.55% | 3.56% | 3.26% | 3.22% | |||||||||||||||||||||||||||
| Financial and Asset Base Highlights (continued) | | ||||
December 31, 2022 | |||||
| (Dollars in thousands, except annual rental revenue per occupied RSF amounts) | |||||
| Three Months Ended (unless stated otherwise) | ||||||||||||||||||||||||||||||||
| 12/31/22 | 9/30/22 | 6/30/22 | 3/31/22 | 12/31/21 | ||||||||||||||||||||||||||||
| Amounts included in funds from operations and non-revenue-enhancing capital expenditures | ||||||||||||||||||||||||||||||||
Straight-line rent revenue | $ | 24,185 | $ | 24,431 | $ | 27,362 | $ | 42,025 | $ | 25,942 | ||||||||||||||||||||||
Amortization of acquired below-market leases | $ | 20,125 | $ | 23,546 | $ | 16,760 | $ | 13,915 | $ | 15,737 | ||||||||||||||||||||||
| Straight-line rent expense on ground leases | $ | 487 | $ | 583 | $ | 354 | $ | 416 | $ | 301 | ||||||||||||||||||||||
Stock compensation expense | $ | 11,586 | $ | 17,786 | $ | 14,340 | $ | 14,028 | $ | 14,253 | ||||||||||||||||||||||
Amortization of loan fees | $ | 3,975 | $ | 3,235 | $ | 3,236 | $ | 3,103 | $ | 2,911 | ||||||||||||||||||||||
| Amortization of debt (discounts) premiums | $ | (272) | $ | (269) | $ | (267) | $ | 424 | $ | 502 | ||||||||||||||||||||||
Non-revenue-enhancing capital expenditures: | ||||||||||||||||||||||||||||||||
Building improvements | $ | 4,128 | $ | 3,963 | $ | 4,199 | $ | 4,110 | $ | 4,027 | ||||||||||||||||||||||
Tenant improvements and leasing commissions | $ | 25,049 | $ | 48,960 | $ | 24,562 | $ | 27,791 | $ | 109,516 | ||||||||||||||||||||||
Operating statistics and related information (at end of period) | ||||||||||||||||||||||||||||||||
Number of properties – North America | 432 | 431 | 436 | 446 | 414 | |||||||||||||||||||||||||||
RSF – North America (including development and redevelopment projects under construction) | 47,371,259 | 46,690,943 | 46,934,653 | 47,364,067 | 43,670,737 | |||||||||||||||||||||||||||
Total square feet – North America | 74,566,128 | 74,450,918 | 74,087,636 | 74,185,859 | 66,970,705 | |||||||||||||||||||||||||||
| Annual rental revenue per occupied RSF – North America | $ | 51.75 | $ | 50.99 | $ | 50.80 | $ | 49.42 | $ | 48.65 | ||||||||||||||||||||||
| Occupancy of operating properties – North America | 94.8% | 94.3% | 94.6% | 94.7% | 94.0% | |||||||||||||||||||||||||||
| Occupancy of operating and redevelopment properties – North America | 89.4% | 88.6% | 89.0% | 88.9% | 88.5% | |||||||||||||||||||||||||||
Weighted-average remaining lease term (in years) | 7.1 | 7.2 | 7.1 | 7.3 | 7.5 | |||||||||||||||||||||||||||
Total leasing activity – RSF | 2,000,322 | 1,662,069 | 2,279,758 | 2,463,438 | 4,094,174 | |||||||||||||||||||||||||||
Lease renewals and re-leasing of space – change in average new rental rates over expiring rates: | ||||||||||||||||||||||||||||||||
Rental rate increases | 26.0% | 27.1% | 45.4% | 32.2% | 35.9% | |||||||||||||||||||||||||||
| Rental rate increases (cash basis) | 19.6% | 22.6% | 33.9% | 16.5% | 22.9% | |||||||||||||||||||||||||||
| RSF (included in total leasing activity above) | 1,494,345 | 1,094,821 | 1,087,082 | 864,077 | 1,947,727 | |||||||||||||||||||||||||||
Same property – percentage change over comparable quarter from prior year: | ||||||||||||||||||||||||||||||||
| Net operating income increase | 4.7% | 5.1% | 7.5% | 7.6% | 5.0% | |||||||||||||||||||||||||||
| Net operating income increase (cash basis) | 10.9% | 10.6% | 10.2% | 7.3% | 7.5% | |||||||||||||||||||||||||||
| |||||
| High-Quality Client Base | |||||
December 31, 2022 | |||||
| Investment-Grade or Publicly Traded Large Cap Tenants | REIT Industry-Leading Tenant Client Base | ||||||||||||||||||||||
| 48% | |||||||||||||||||||||||
| 90% | |||||||||||||||||||||||
of ARE’s Total Annual Rental Revenue(1) | |||||||||||||||||||||||
| Long-Duration Lease Terms | |||||||||||||||||||||||
| of ARE’s Top 20 Tenants | |||||||||||||||||||||||
| 7.1 Years | Annual Rental Revenue | ||||||||||||||||||||||
| Is From Investment-Grade | |||||||||||||||||||||||
or Publicly Traded Large Cap Tenants(1) | |||||||||||||||||||||||
Weighted-Average Remaining Term(2) | |||||||||||||||||||||||
| |||||
| High-Quality and Diverse Client Base in AAA Locations | |||||
December 31, 2022 | |||||
Industry Mix of Approximately 1,000 Tenants | AAA Locations | |||||||
 | 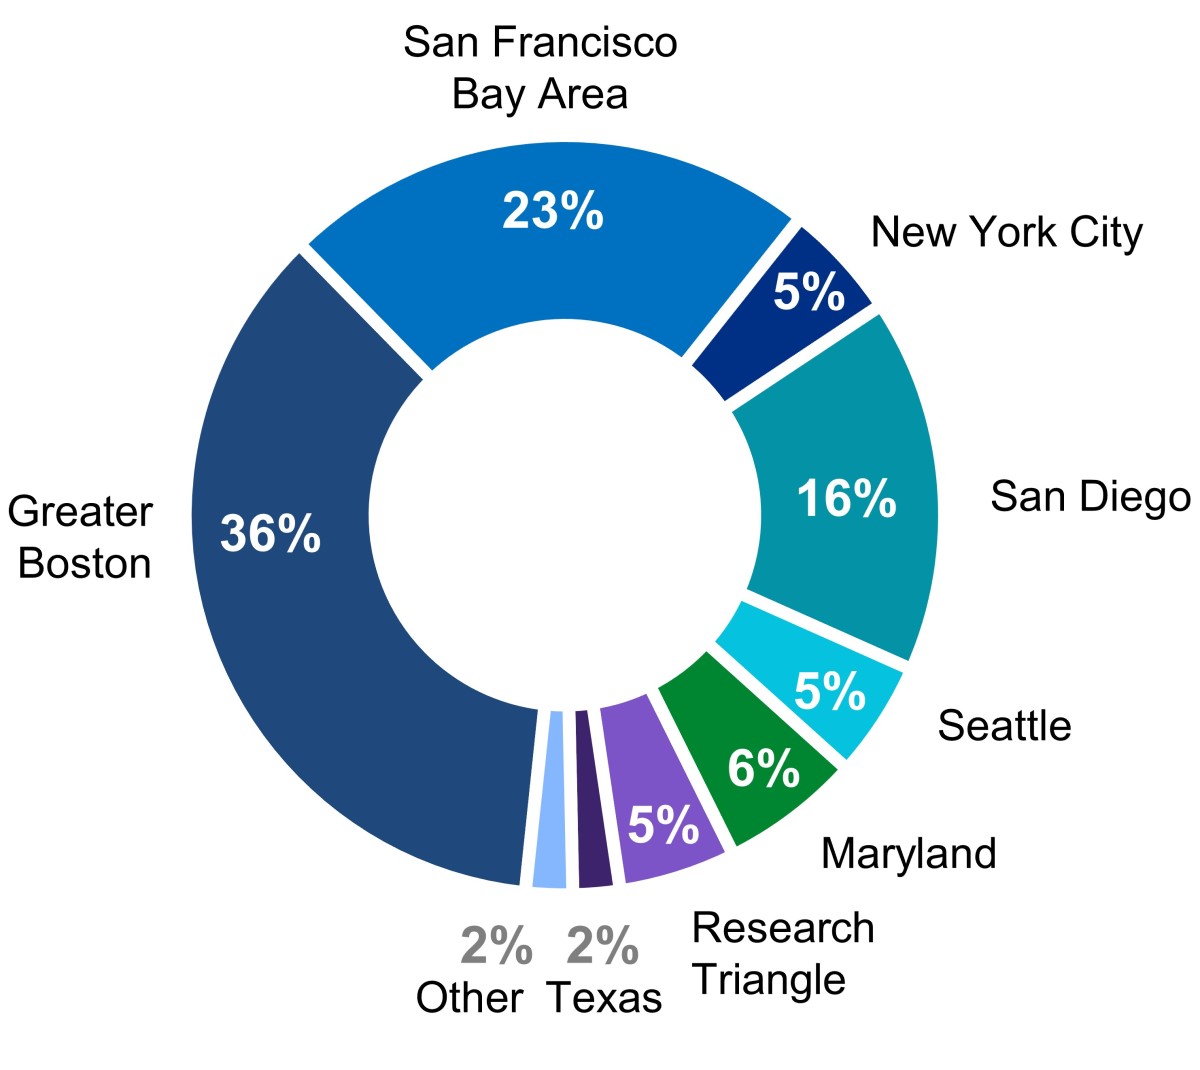 | |||||||
Percentage of ARE’s Annual Rental Revenue(3) | ||||||||
| |||||
| Occupancy | |||||
December 31, 2022 | |||||
Solid Historical Occupancy(1) | Occupancy Across Key Locations | |||||||||||||
 | ||||||||||||||
| 96% | ||||||||||||||
| Over 10 Years | ||||||||||||||
| |||||
| Key Operating Metrics | |||||
December 31, 2022 | |||||
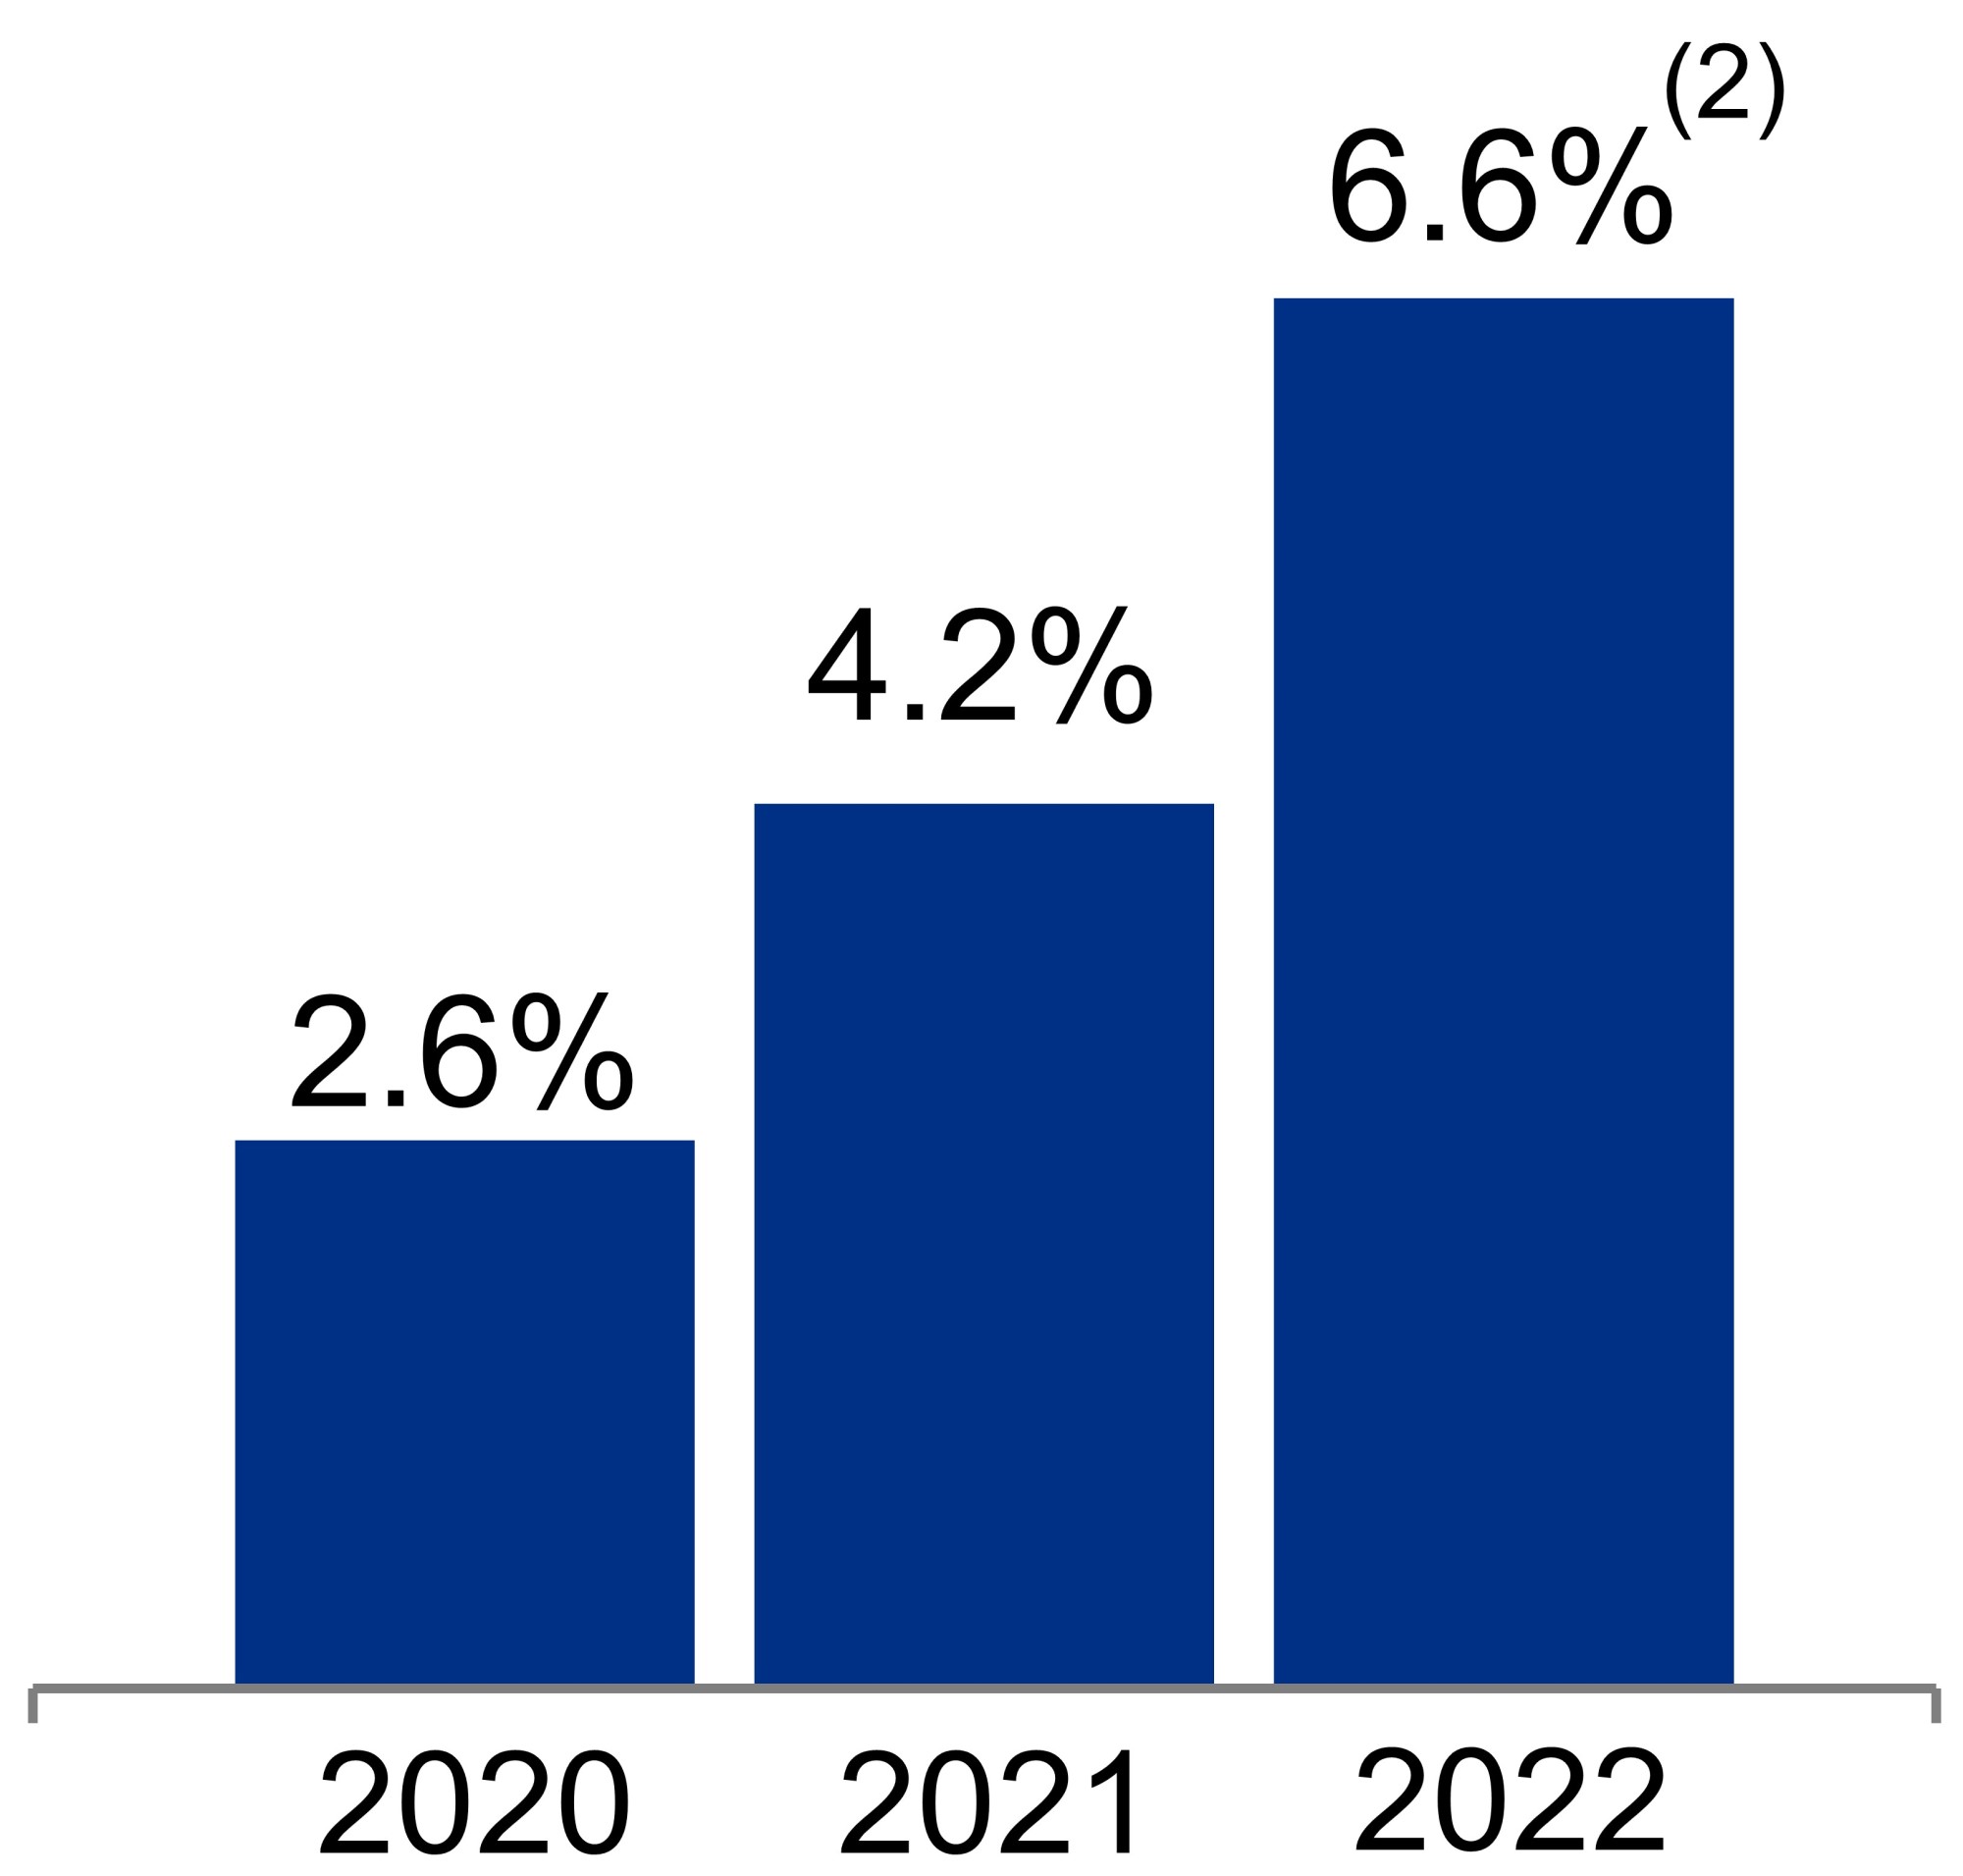
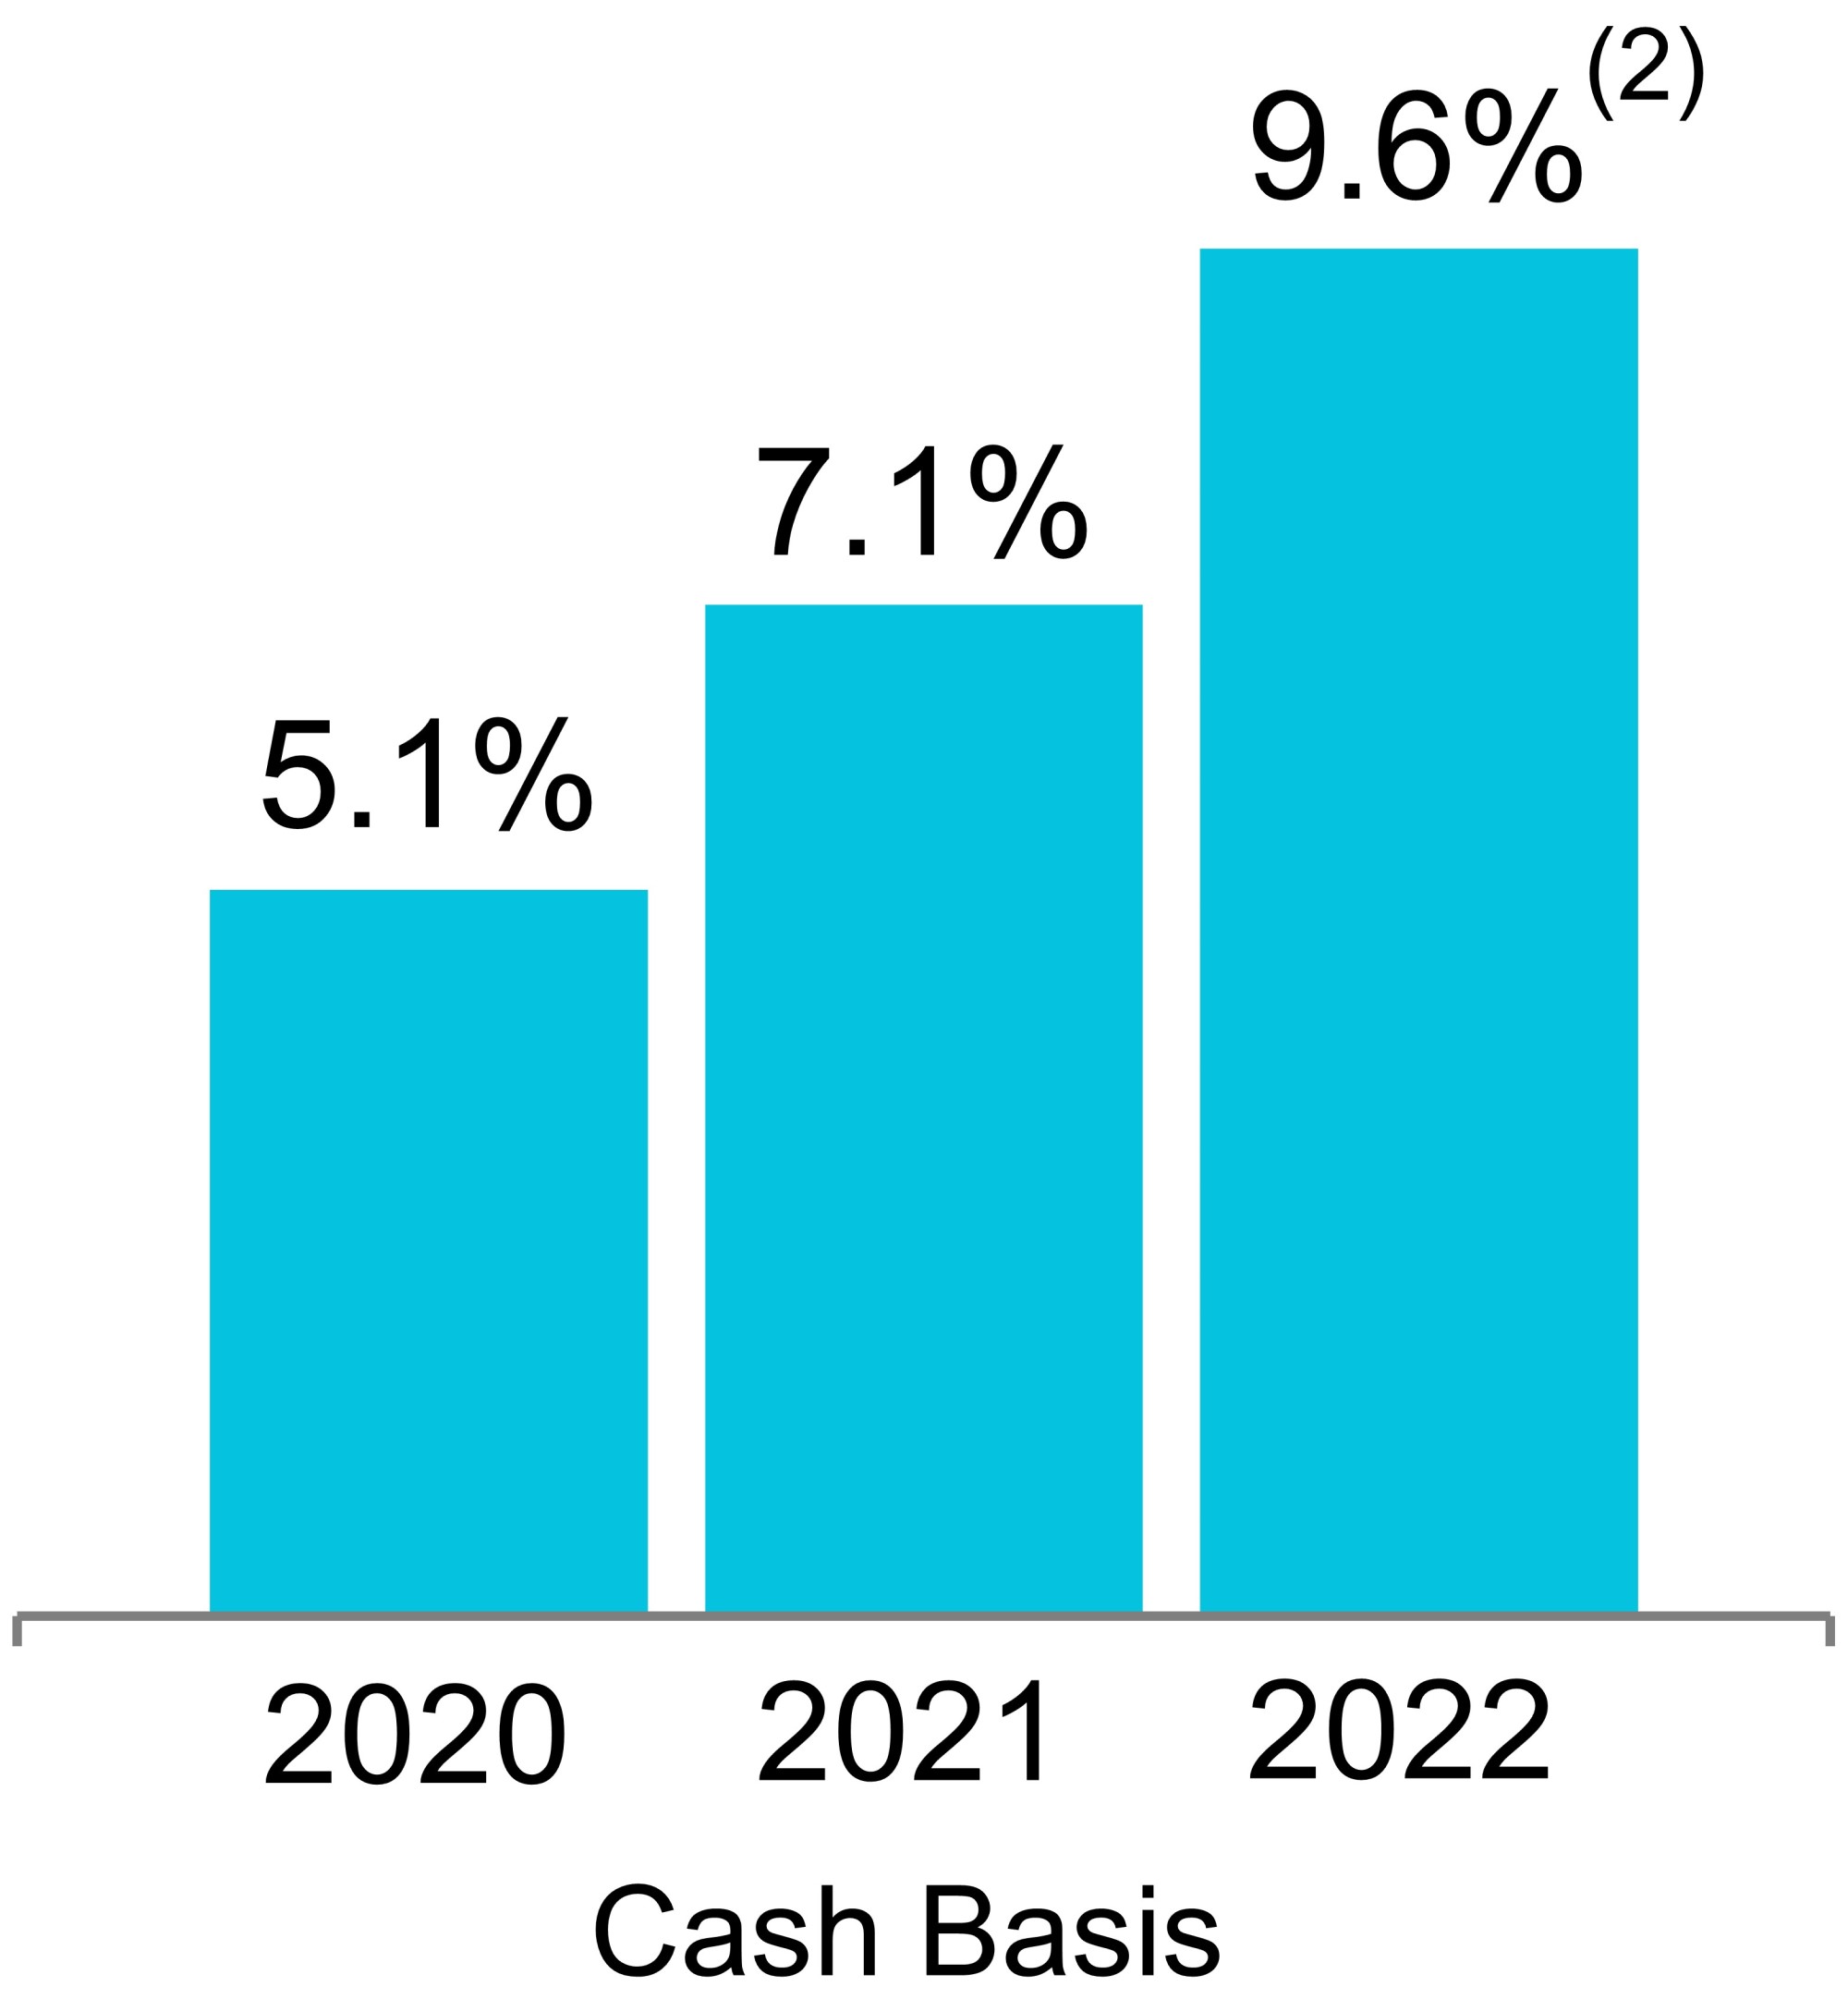
Historical Same Property Net Operating Income Growth(1) | Favorable Lease Structure(3) | |||||||||||||||||||||||||||||||
 |  | Strategic Lease Structure by Owner and Operator of Collaborative Life Science, Agtech, and Technology Campuses | ||||||||||||||||||||||||||||||
| Increasing cash flows | ||||||||||||||||||||||||||||||||
Percentage of leases containing annual rent escalations | 96% | |||||||||||||||||||||||||||||||
| Stable cash flows | ||||||||||||||||||||||||||||||||
Percentage of triple net leases | 93% | |||||||||||||||||||||||||||||||
| Lower capex burden | ||||||||||||||||||||||||||||||||
Percentage of leases providing for the recapture of capital expenditures | 93% | |||||||||||||||||||||||||||||||
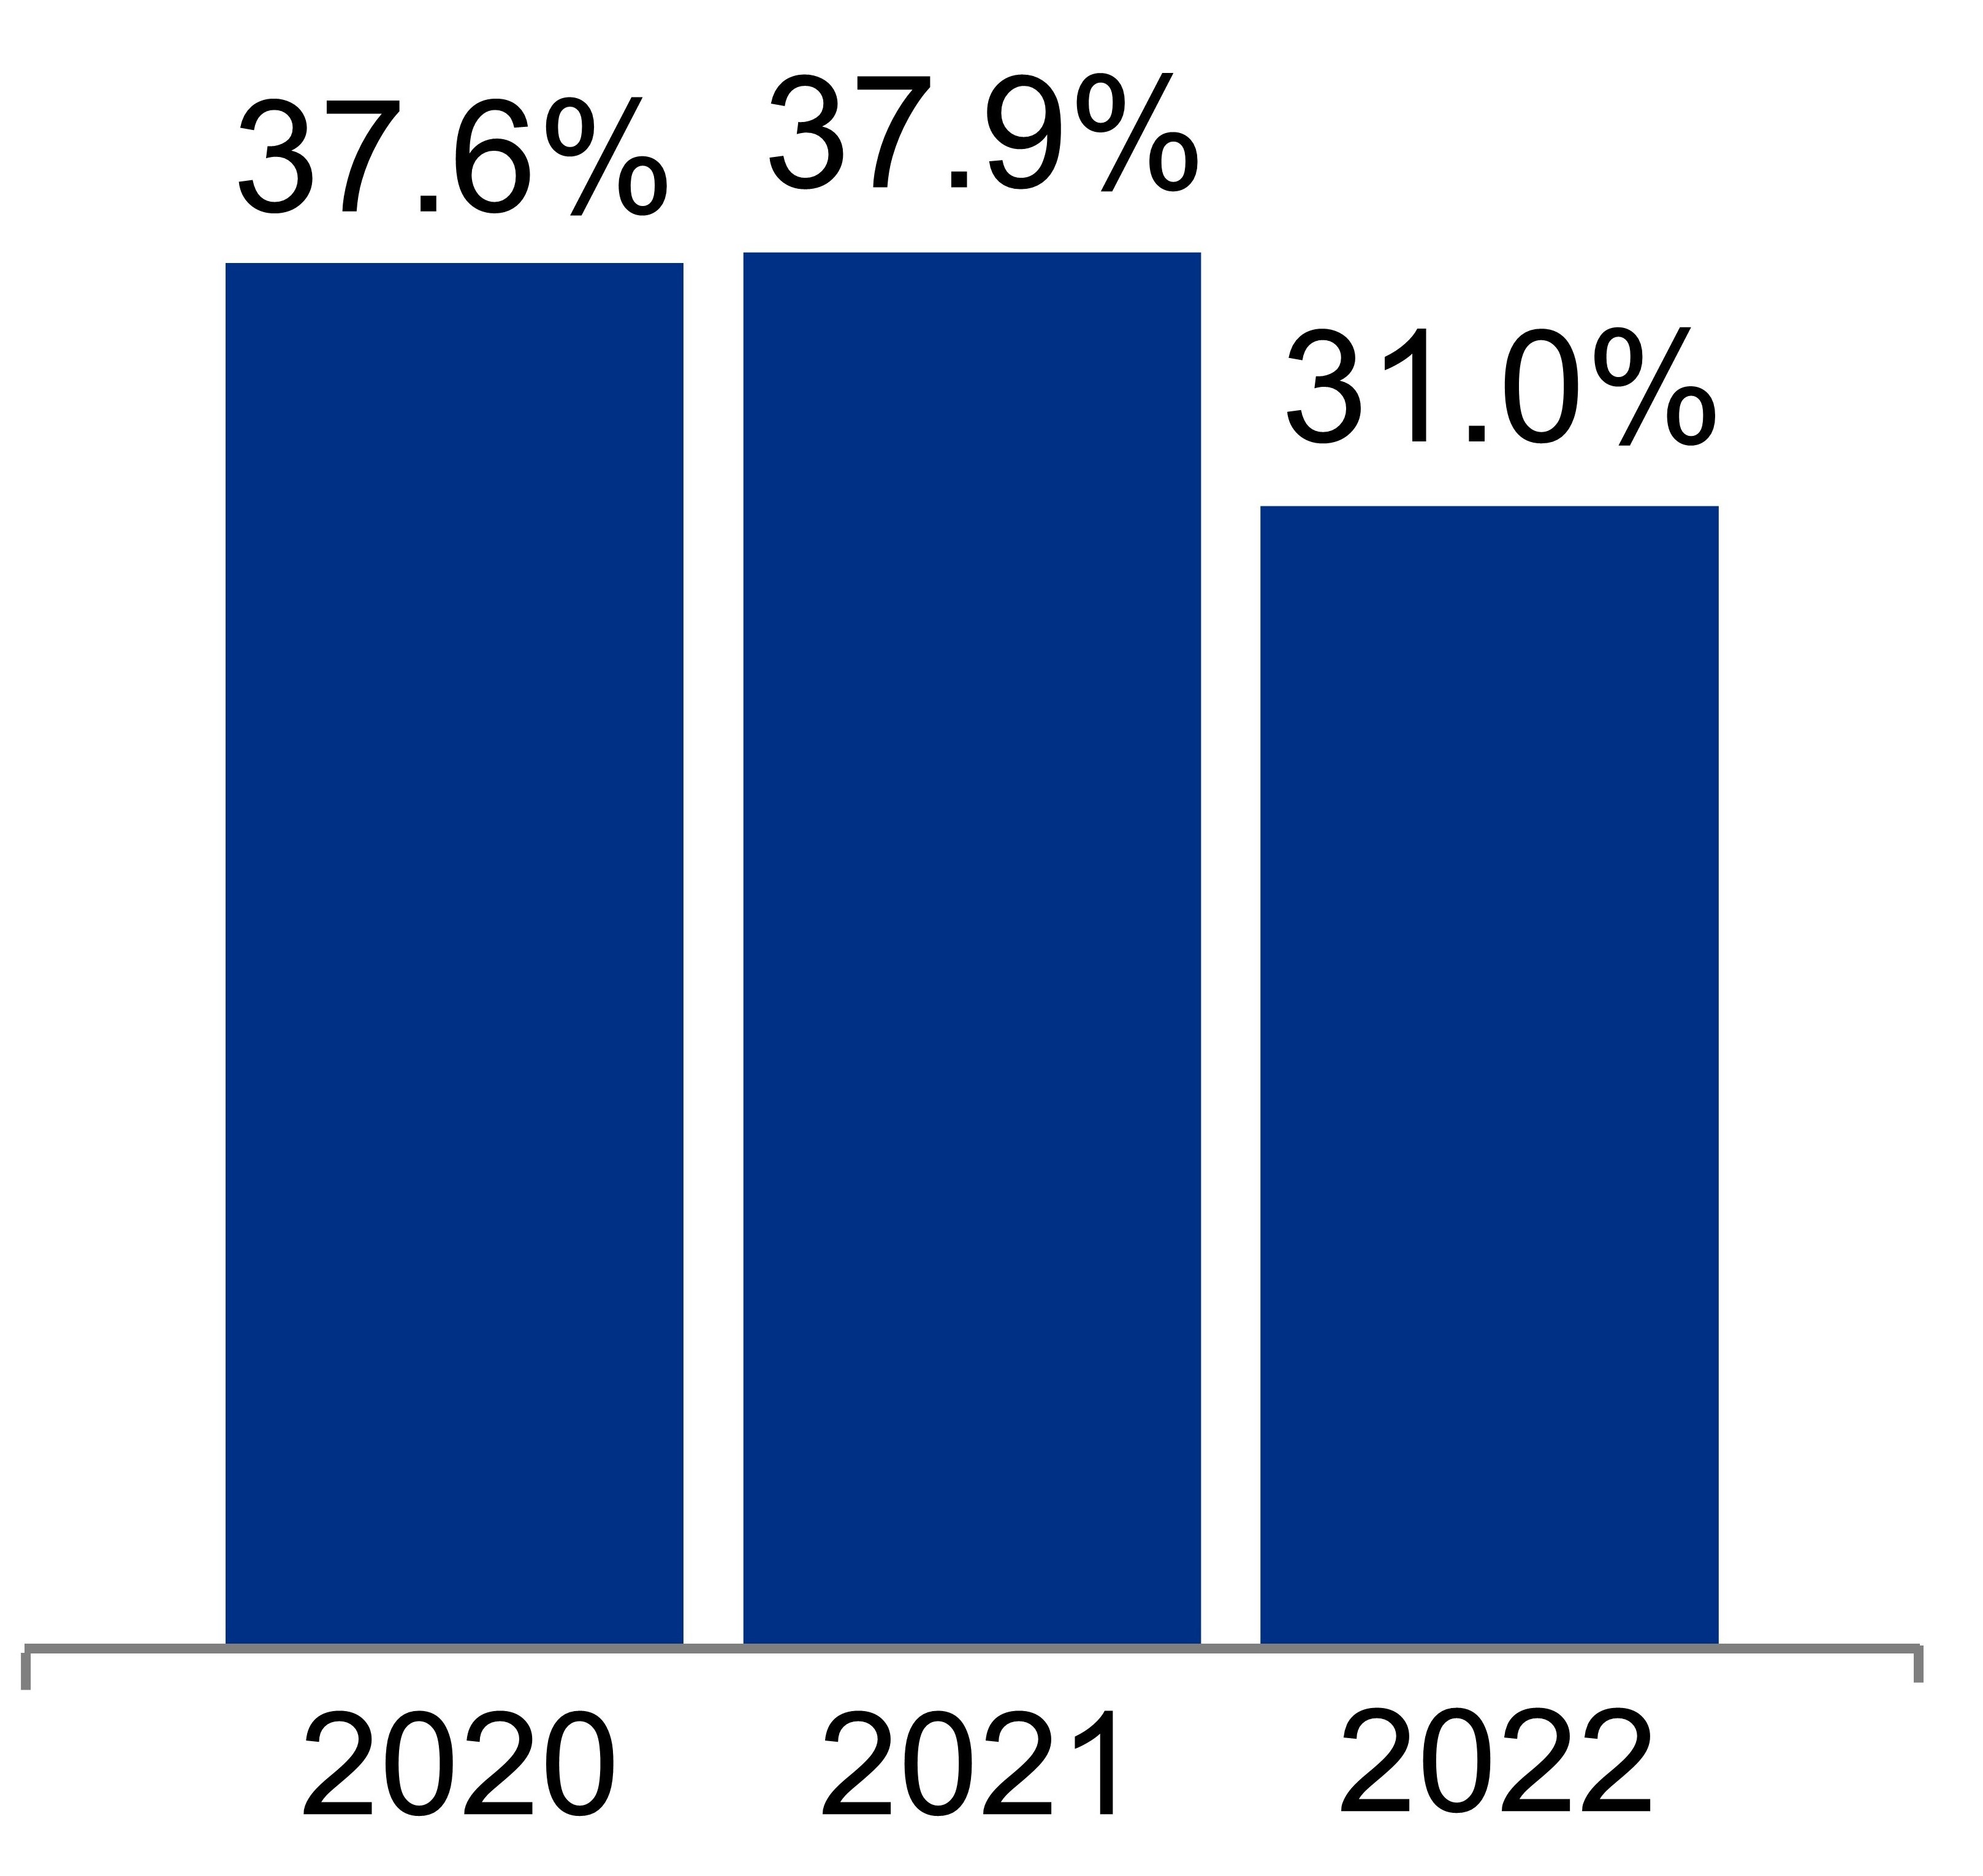
| Historical Rental Rate Growth: Renewed/Re-Leased Space | Margins(4) | |||||||||||||||||||||||||||||||
 |  | |||||||||||||||||||||||||||||||
| Operating | Adjusted EBITDA | |||||||||||||||||||||||||||||||
| 70% | 69% | |||||||||||||||||||||||||||||||
| Same Property Performance | | ||||
December 31, 2022 | |||||
| (Dollars in thousands) | |||||
| December 31, 2022 | December 31, 2022 | |||||||||||||||||||||||||||||||
Same Property Financial Data | Three Months Ended | Year Ended | Same Property Statistical Data | Three Months Ended | Year Ended | |||||||||||||||||||||||||||
Percentage change over comparable period from prior year: | Number of same properties | 306 | 253 | |||||||||||||||||||||||||||||
Net operating income increase | 4.7% | 6.6% | Rentable square feet | 31,099,211 | 26,121,796 | |||||||||||||||||||||||||||
Net operating income increase (cash basis) | 10.9% | 9.6% | Occupancy – current-period average | 95.2% | 95.7% | |||||||||||||||||||||||||||
Operating margin | 69% | 70% | Occupancy – same-period prior-year average | 94.9% | 94.7% | |||||||||||||||||||||||||||
| Three Months Ended December 31, | Year Ended December 31, | |||||||||||||||||||||||||||||||||||||||||||||||||
| 2022 | 2021 | $ Change | % Change | 2022 | 2021 | $ Change | % Change | |||||||||||||||||||||||||||||||||||||||||||
| Income from rentals: | ||||||||||||||||||||||||||||||||||||||||||||||||||
| Same properties | $ | 397,105 | $ | 375,258 | $ | 21,847 | 5.8 | % | $ | 1,385,380 | $ | 1,289,246 | $ | 96,134 | 7.5 | % | ||||||||||||||||||||||||||||||||||
| Non-same properties | 102,243 | 60,379 | 41,864 | 69.3 | 564,718 | 329,346 | 235,372 | 71.5 | ||||||||||||||||||||||||||||||||||||||||||
| Rental revenues | 499,348 | 435,637 | 63,711 | 14.6 | 1,950,098 | 1,618,592 | 331,506 | 20.5 | ||||||||||||||||||||||||||||||||||||||||||
| Same properties | 135,755 | 119,833 | 15,922 | 13.3 | 478,333 | 407,450 | 70,883 | 17.4 | ||||||||||||||||||||||||||||||||||||||||||
| Non-same properties | 30,571 | 19,186 | 11,385 | 59.3 | 147,609 | 82,207 | 65,402 | 79.6 | ||||||||||||||||||||||||||||||||||||||||||
| Tenant recoveries | 166,326 | 139,019 | 27,307 | 19.6 | 625,942 | 489,657 | 136,285 | 27.8 | ||||||||||||||||||||||||||||||||||||||||||
| Income from rentals | 665,674 | 574,656 | 91,018 | 15.8 | 2,576,040 | 2,108,249 | 467,791 | 22.2 | ||||||||||||||||||||||||||||||||||||||||||
| Same properties | 184 | 155 | 29 | 18.7 | 620 | 479 | 141 | 29.4 | ||||||||||||||||||||||||||||||||||||||||||
| Non-same properties | 4,423 | 2,112 | 2,311 | 109.4 | 12,302 | 5,422 | 6,880 | 126.9 | ||||||||||||||||||||||||||||||||||||||||||
| Other income | 4,607 | 2,267 | 2,340 | 103.2 | 12,922 | 5,901 | 7,021 | 119.0 | ||||||||||||||||||||||||||||||||||||||||||
| Same properties | 533,044 | 495,246 | 37,798 | 7.6 | 1,864,333 | 1,697,175 | 167,158 | 9.8 | ||||||||||||||||||||||||||||||||||||||||||
| Non-same properties | 137,237 | 81,677 | 55,560 | 68.0 | 724,629 | 416,975 | 307,654 | 73.8 | ||||||||||||||||||||||||||||||||||||||||||
| Total revenues | 670,281 | 576,923 | 93,358 | 16.2 | 2,588,962 | 2,114,150 | 474,812 | 22.5 | ||||||||||||||||||||||||||||||||||||||||||
| Same properties | 163,887 | 142,521 | 21,366 | 15.0 | 561,301 | 475,209 | 86,092 | 18.1 | ||||||||||||||||||||||||||||||||||||||||||
| Non-same properties | 40,465 | 33,196 | 7,269 | 21.9 | 221,852 | 148,346 | 73,506 | 49.6 | ||||||||||||||||||||||||||||||||||||||||||
| Rental operations | 204,352 | 175,717 | 28,635 | 16.3 | 783,153 | 623,555 | 159,598 | 25.6 | ||||||||||||||||||||||||||||||||||||||||||
| Same properties | 369,157 | 352,725 | 16,432 | 4.7 | 1,303,032 | 1,221,966 | 81,066 | 6.6 | ||||||||||||||||||||||||||||||||||||||||||
| Non-same properties | 96,772 | 48,481 | 48,291 | 99.6 | 502,777 | 268,629 | 234,148 | 87.2 | ||||||||||||||||||||||||||||||||||||||||||
| Net operating income | $ | 465,929 | $ | 401,206 | $ | 64,723 | 16.1 | % | $ | 1,805,809 | $ | 1,490,595 | $ | 315,214 | 21.1 | % | ||||||||||||||||||||||||||||||||||
Net operating income – same properties | $ | 369,157 | $ | 352,725 | $ | 16,432 | 4.7 | % | $ | 1,303,032 | $ | 1,221,966 | $ | 81,066 | 6.6 | % | ||||||||||||||||||||||||||||||||||
| Straight-line rent revenue | (8,498) | (24,362) | 15,864 | (65.1) | (54,991) | (79,602) | 24,611 | (30.9) | ||||||||||||||||||||||||||||||||||||||||||
| Amortization of acquired below-market leases | (9,274) | (11,492) | 2,218 | (19.3) | (26,224) | (27,252) | 1,028 | (3.8) | ||||||||||||||||||||||||||||||||||||||||||
Net operating income – same properties (cash basis) | $ | 351,385 | $ | 316,871 | $ | 34,514 | 10.9 | % | $ | 1,221,817 | $ | 1,115,112 | $ | 106,705 | 9.6 | % | ||||||||||||||||||||||||||||||||||
| Leasing Activity | | ||||
December 31, 2022 | |||||
| (Dollars per RSF) | |||||
| Three Months Ended | Year Ended | Year Ended | ||||||||||||||||||||||||||||||||||||||||||||||||||||||||||||||||||||||||
| December 31, 2022 | December 31, 2022 | December 31, 2021 | ||||||||||||||||||||||||||||||||||||||||||||||||||||||||||||||||||||||||
| Including Straight-Line Rent | Cash Basis | Including Straight-Line Rent | Cash Basis | Including Straight-Line Rent | Cash Basis | |||||||||||||||||||||||||||||||||||||||||||||||||||||||||||||||||||||
Leasing activity: | ||||||||||||||||||||||||||||||||||||||||||||||||||||||||||||||||||||||||||
Renewed/re-leased space(1) | ||||||||||||||||||||||||||||||||||||||||||||||||||||||||||||||||||||||||||
Rental rate changes | 26.0% | (2) | 19.6% | (2) | 31.0% | 22.1% | (3) | 37.9% | 22.6% | |||||||||||||||||||||||||||||||||||||||||||||||||||||||||||||||||
New rates | $35.59 | $34.17 | $50.37 | $48.48 | $59.00 | $55.60 | ||||||||||||||||||||||||||||||||||||||||||||||||||||||||||||||||||||
Expiring rates | $28.24 | $28.58 | $38.44 | $39.69 | $42.80 | $45.36 | ||||||||||||||||||||||||||||||||||||||||||||||||||||||||||||||||||||
RSF | 1,494,345 | 4,540,325 | 4,614,040 | |||||||||||||||||||||||||||||||||||||||||||||||||||||||||||||||||||||||
Tenant improvements/leasing commissions | $16.29 | $27.83 | $41.05 | |||||||||||||||||||||||||||||||||||||||||||||||||||||||||||||||||||||||
Weighted-average lease term | 5.2 years | 5.0 years | 6.3 years | |||||||||||||||||||||||||||||||||||||||||||||||||||||||||||||||||||||||
Developed/redeveloped/previously vacant space leased(4) | ||||||||||||||||||||||||||||||||||||||||||||||||||||||||||||||||||||||||||
New rates | $57.35 | $44.03 | $73.46 | $64.04 | $78.52 | $69.42 | ||||||||||||||||||||||||||||||||||||||||||||||||||||||||||||||||||||
RSF | 505,977 | 3,865,262 | 4,902,261 | |||||||||||||||||||||||||||||||||||||||||||||||||||||||||||||||||||||||
Weighted-average lease term | 6.1 years | 11.8 years | 11.2 years | |||||||||||||||||||||||||||||||||||||||||||||||||||||||||||||||||||||||
Leasing activity summary (totals): | ||||||||||||||||||||||||||||||||||||||||||||||||||||||||||||||||||||||||||
New rates | $41.10 | $36.67 | $60.98 | $55.64 | $69.05 | $62.72 | ||||||||||||||||||||||||||||||||||||||||||||||||||||||||||||||||||||
RSF | 2,000,322 | 8,405,587 | (3)(5) | 9,516,301 | ||||||||||||||||||||||||||||||||||||||||||||||||||||||||||||||||||||||
Weighted-average lease term | 5.4 years | 8.1 years | 8.8 years | |||||||||||||||||||||||||||||||||||||||||||||||||||||||||||||||||||||||
Lease expirations(1) | ||||||||||||||||||||||||||||||||||||||||||||||||||||||||||||||||||||||||||
Expiring rates | $30.62 | $31.01 | $37.41 | $38.06 | $41.53 | $43.70 | ||||||||||||||||||||||||||||||||||||||||||||||||||||||||||||||||||||
| RSF | 2,048,061 | 6,572,286 | 5,747,192 | |||||||||||||||||||||||||||||||||||||||||||||||||||||||||||||||||||||||
| |||||
| Contractual Lease Expirations | |||||
December 31, 2022 | |||||
| Year | RSF | Percentage of Occupied RSF | Annual Rental Revenue (per RSF)(1) | Percentage of Total Annual Rental Revenue | |||||||||||||||||||||||||||||||||||||||||||||||||||||||
| 2023 | (2) | 2,871,438 | 7.3 | % | $ | 45.10 | 6.5 | % | |||||||||||||||||||||||||||||||||||||||||||||||||||
| 2024 | 4,341,944 | 11.1 | % | $ | 46.70 | 10.2 | % | ||||||||||||||||||||||||||||||||||||||||||||||||||||
| 2025 | 3,312,092 | 8.5 | % | $ | 48.22 | 8.1 | % | ||||||||||||||||||||||||||||||||||||||||||||||||||||
| 2026 | 2,628,988 | 6.7 | % | $ | 50.79 | 6.7 | % | ||||||||||||||||||||||||||||||||||||||||||||||||||||
| 2027 | 2,669,028 | 6.8 | % | $ | 55.36 | 7.5 | % | ||||||||||||||||||||||||||||||||||||||||||||||||||||
| 2028 | 4,160,778 | 10.6 | % | $ | 51.51 | 10.8 | % | ||||||||||||||||||||||||||||||||||||||||||||||||||||
| 2029 | 2,467,070 | 6.3 | % | $ | 53.31 | 6.6 | % | ||||||||||||||||||||||||||||||||||||||||||||||||||||
| 2030 | 2,766,240 | 7.1 | % | $ | 58.03 | 8.1 | % | ||||||||||||||||||||||||||||||||||||||||||||||||||||
| 2031 | 3,006,892 | 7.7 | % | $ | 52.83 | 8.0 | % | ||||||||||||||||||||||||||||||||||||||||||||||||||||
| 2032 | 1,298,945 | 3.3 | % | $ | 56.91 | 3.7 | % | ||||||||||||||||||||||||||||||||||||||||||||||||||||
| Thereafter | 9,613,205 | 24.6 | % | $ | 48.72 | 23.8 | % | ||||||||||||||||||||||||||||||||||||||||||||||||||||
Market | 2023 Contractual Lease Expirations (in RSF) | Annual Rental Revenue (per RSF)(1) | 2024 Contractual Lease Expirations (in RSF) | Annual Rental Revenue (per RSF)(1) | ||||||||||||||||||||||||||||||||||||||||||||||||||||||||||||||||||||||||||||||||||
| Leased | Negotiating/ Anticipating | Targeted for Future Development/ Redevelopment(3) | Remaining Expiring Leases(4) | Total(2) | Leased | Negotiating/ Anticipating | Targeted for Future Development/ Redevelopment(3) | Remaining Expiring Leases(4) | Total | |||||||||||||||||||||||||||||||||||||||||||||||||||||||||||||||||||||||||||||
| Greater Boston | 61,091 | 83,346 | 323,110 | 428,905 | 896,452 | $ | 56.56 | 102,060 | 5,881 | 122,465 | 500,918 | 731,324 | $ | 73.74 | ||||||||||||||||||||||||||||||||||||||||||||||||||||||||||||||||||||||||
| San Francisco Bay Area | 30,876 | 10,208 | — | 342,952 | 384,036 | 52.63 | 35,798 | 407,369 | — | 592,252 | 1,035,419 | 50.33 | ||||||||||||||||||||||||||||||||||||||||||||||||||||||||||||||||||||||||||
| New York City | — | — | — | 88,372 | 88,372 | N/A | — | — | 349,947 | 5,645 | 355,592 | N/A | ||||||||||||||||||||||||||||||||||||||||||||||||||||||||||||||||||||||||||
| San Diego | 184,287 | 124,745 | — | 426,615 | 735,647 | 33.50 | — | — | 580,021 | 394,852 | 974,873 | 31.10 | ||||||||||||||||||||||||||||||||||||||||||||||||||||||||||||||||||||||||||
| Seattle | 14,979 | 8,167 | 18,680 | 266,038 | 307,864 | 27.22 | — | 267,350 | 50,552 | 415,503 | 733,405 | 35.04 | ||||||||||||||||||||||||||||||||||||||||||||||||||||||||||||||||||||||||||
| Maryland | 6,674 | 115,454 | — | 131,735 | 253,863 | 35.41 | — | 3,555 | — | 62,016 | 65,571 | 25.15 | ||||||||||||||||||||||||||||||||||||||||||||||||||||||||||||||||||||||||||
| Research Triangle | 81,956 | 15,043 | — | 77,286 | 174,285 | 33.08 | 15,519 | — | — | 194,008 | 209,527 | 52.01 | ||||||||||||||||||||||||||||||||||||||||||||||||||||||||||||||||||||||||||
| Texas | — | — | — | — | — | — | — | — | 126,034 | 72,938 | 198,972 | 33.91 | ||||||||||||||||||||||||||||||||||||||||||||||||||||||||||||||||||||||||||
| Canada | 13,321 | — | — | 2,484 | 15,805 | 28.89 | — | — | — | 6,786 | 6,786 | 24.38 | ||||||||||||||||||||||||||||||||||||||||||||||||||||||||||||||||||||||||||
| Non-cluster/other markets | — | — | — | 15,114 | 15,114 | 41.42 | — | — | — | 30,475 | 30,475 | 65.74 | ||||||||||||||||||||||||||||||||||||||||||||||||||||||||||||||||||||||||||
| Total | 393,184 | 356,963 | 341,790 | 1,779,501 | 2,871,438 | $ | 45.10 | 153,377 | 684,155 | 1,229,019 | 2,275,393 | 4,341,944 | $ | 46.70 | ||||||||||||||||||||||||||||||||||||||||||||||||||||||||||||||||||||||||
Percentage of expiring leases | 14 | % | 12 | % | 12 | % | 62 | % | 100 | % | 4 | % | 16 | % | 28 | % | 52 | % | 100 | % | ||||||||||||||||||||||||||||||||||||||||||||||||||||||||||||||||||
| Top 20 Tenants | | ||||
December 31, 2022 | |||||
| (Dollars in thousands, except average market cap amounts) | |||||
| Tenant | Remaining Lease Term(1) (in years) | Aggregate RSF | Annual Rental Revenue(1) | Percentage of Aggregate Annual Rental Revenue(1) | Investment-Grade Credit Ratings | Average Market Cap(1) (in billions) | |||||||||||||||||||||||||||||||||||||||||||||||||||||||||||||||||
| Moody’s | S&P | ||||||||||||||||||||||||||||||||||||||||||||||||||||||||||||||||||||||
| 1 | Bristol-Myers Squibb Company | 4.3 | 962,439 | $ | 69,870 | 3.5 | % | A2 | A+ | $ | 156.1 | ||||||||||||||||||||||||||||||||||||||||||||||||||||||||||||
| 2 | Moderna, Inc. | 13.8 | 908,340 | 51,926 | 2.6 | — | — | $ | 62.1 | ||||||||||||||||||||||||||||||||||||||||||||||||||||||||||||||
| 3 | Eli Lilly and Company | 6.2 | 743,267 | 49,890 | 2.5 | A2 | A+ | $ | 292.5 | ||||||||||||||||||||||||||||||||||||||||||||||||||||||||||||||
| 4 | Takeda Pharmaceutical Company Limited | 7.0 | 549,760 | 37,399 | 1.9 | Baa2 | BBB+ | $ | 45.0 | ||||||||||||||||||||||||||||||||||||||||||||||||||||||||||||||
| 5 | Illumina, Inc. | 7.6 | 891,495 | 36,204 | 1.8 | Baa3 | BBB | $ | 40.2 | ||||||||||||||||||||||||||||||||||||||||||||||||||||||||||||||
| 6 | Sanofi | 7.6 | 434,648 | 34,104 | 1.7 | A1 | AA | $ | 122.2 | ||||||||||||||||||||||||||||||||||||||||||||||||||||||||||||||
| 7 | 2seventy bio, Inc.(2) | 10.7 | 312,805 | 33,617 | 1.7 | — | — | $ | 0.5 | ||||||||||||||||||||||||||||||||||||||||||||||||||||||||||||||
| 8 | Novartis AG | 5.6 | 447,831 | 30,749 | 1.5 | A1 | AA- | $ | 206.3 | ||||||||||||||||||||||||||||||||||||||||||||||||||||||||||||||
| 9 | TIBCO Software, Inc. | 4.2 | (3) | 292,013 | 28,537 | 1.4 | — | — | $ | — | |||||||||||||||||||||||||||||||||||||||||||||||||||||||||||||
| 10 | Uber Technologies, Inc. | 59.7 | (4) | 1,009,188 | 27,704 | 1.4 | — | — | $ | 57.7 | |||||||||||||||||||||||||||||||||||||||||||||||||||||||||||||
| 11 | Roche | 6.5 | 417,011 | 27,188 | 1.4 | Aa2 | AA | $ | 290.6 | ||||||||||||||||||||||||||||||||||||||||||||||||||||||||||||||
| 12 | Amgen Inc. | 3.5 | 503,832 | 24,680 | 1.2 | Baa1 | BBB+ | $ | 133.2 | ||||||||||||||||||||||||||||||||||||||||||||||||||||||||||||||
| 13 | Pfizer Inc. | 1.7 | 416,996 | 22,376 | 1.1 | A1 | A+ | $ | 280.1 | ||||||||||||||||||||||||||||||||||||||||||||||||||||||||||||||
| 14 | Massachusetts Institute of Technology | 6.1 | 257,626 | 21,438 | 1.1 | Aaa | AAA | $ | — | ||||||||||||||||||||||||||||||||||||||||||||||||||||||||||||||
| 15 | Harvard University | 2.0 | (3) | 286,580 | 20,086 | 1.0 | Aaa | AAA | $ | — | |||||||||||||||||||||||||||||||||||||||||||||||||||||||||||||
| 16 | Boston Children’s Hospital | 13.8 | 269,816 | 20,066 | 1.0 | Aa2 | AA | $ | — | ||||||||||||||||||||||||||||||||||||||||||||||||||||||||||||||
| 17 | United States Government | 7.3 | 315,908 | 19,660 | 1.0 | Aaa | AA+ | $ | — | ||||||||||||||||||||||||||||||||||||||||||||||||||||||||||||||
| 18 | New York University | 8.9 | 203,500 | 19,241 | 1.0 | Aa1 | AA+ | $ | — | ||||||||||||||||||||||||||||||||||||||||||||||||||||||||||||||
| 19 | Merck & Co., Inc. | 11.3 | 300,930 | 18,913 | 0.9 | A1 | A+ | $ | 227.3 | ||||||||||||||||||||||||||||||||||||||||||||||||||||||||||||||
| 20 | AstraZeneca PLC | 3.8 | 348,363 | 18,641 | 0.9 | A3 | A | $ | 195.1 | ||||||||||||||||||||||||||||||||||||||||||||||||||||||||||||||
Total/weighted-average | 9.4 | (4) | 9,872,348 | $ | 612,289 | 30.6 | % | ||||||||||||||||||||||||||||||||||||||||||||||||||||||||||||||||
| Summary of Properties and Occupancy | | ||||
December 31, 2022 | |||||
| (Dollars in thousands, except per RSF amounts) | |||||
Market | RSF | Number of Properties | Annual Rental Revenue | ||||||||||||||||||||||||||||||||||||||||||||||||||||||||
| Operating | Development | Redevelopment | Total | % of Total | Total | % of Total | Per RSF | ||||||||||||||||||||||||||||||||||||||||||||||||||||
Greater Boston | 11,450,547 | 1,546,965 | 1,200,173 | 14,197,685 | 30 | % | 84 | $ | 731,010 | 36 | % | $ | 67.58 | ||||||||||||||||||||||||||||||||||||||||||||||
| San Francisco Bay Area | 8,100,245 | 443,388 | 300,010 | 8,843,643 | 19 | 67 | 452,191 | 23 | 61.88 | ||||||||||||||||||||||||||||||||||||||||||||||||||
New York City | 1,270,019 | — | — | 1,270,019 | 3 | 5 | 97,413 | 5 | 83.14 | ||||||||||||||||||||||||||||||||||||||||||||||||||
San Diego | 8,099,957 | 254,771 | — | 8,354,728 | 18 | 94 | 330,713 | 16 | 42.79 | ||||||||||||||||||||||||||||||||||||||||||||||||||
Seattle | 2,814,446 | 311,631 | 213,976 | 3,340,053 | 7 | 46 | 109,029 | 5 | 39.95 | ||||||||||||||||||||||||||||||||||||||||||||||||||
Maryland | 3,459,475 | 282,000 | 91,134 | 3,832,609 | 8 | 50 | 115,347 | 6 | 35.12 | ||||||||||||||||||||||||||||||||||||||||||||||||||
Research Triangle | 3,596,979 | 268,038 | 376,871 | 4,241,888 | 9 | 42 | 99,055 | 5 | 29.31 | ||||||||||||||||||||||||||||||||||||||||||||||||||
| Texas | 1,724,585 | — | 201,499 | 1,926,084 | 4 | 15 | 45,785 | 2 | 29.11 | ||||||||||||||||||||||||||||||||||||||||||||||||||
Canada | 577,225 | — | 107,081 | 684,306 | 1 | 8 | 9,868 | 1 | 21.15 | ||||||||||||||||||||||||||||||||||||||||||||||||||
| Non-cluster/other markets | 382,960 | — | — | 382,960 | 1 | 11 | 14,554 | 1 | 50.70 | ||||||||||||||||||||||||||||||||||||||||||||||||||
Properties held for sale | 297,284 | — | — | 297,284 | — | 10 | (1) | 2,476 | — | N/A | |||||||||||||||||||||||||||||||||||||||||||||||||
| North America | 41,773,722 | 3,106,793 | 2,490,744 | 47,371,259 | 100 | % | 432 | $ | 2,007,441 | 100 | % | $ | 51.75 | ||||||||||||||||||||||||||||||||||||||||||||||
| 5,597,537 | |||||||||||||||||||||||||||||||||||||||||||||||||||||||||||
| Operating Properties | Operating and Redevelopment Properties | |||||||||||||||||||||||||||||||||||||
| Market | 12/31/22 | 9/30/22 | 12/31/21 | 12/31/22 | 9/30/22 | 12/31/21 | ||||||||||||||||||||||||||||||||
| Greater Boston | 94.5 | % | 94.4 | % | 95.2 | % | 85.5 | % | 84.7 | % | 83.2 | % | ||||||||||||||||||||||||||
| San Francisco Bay Area | 96.7 | 96.2 | 93.0 | 93.3 | 92.8 | 92.6 | ||||||||||||||||||||||||||||||||
| New York City | 92.3 | 96.5 | 98.4 | 92.3 | 92.3 | 91.0 | ||||||||||||||||||||||||||||||||
| San Diego | 95.4 | 95.2 | 93.1 | 95.4 | 95.2 | 91.7 | ||||||||||||||||||||||||||||||||
| Seattle | 97.0 | 97.1 | 95.6 | 90.1 | 90.2 | 88.5 | ||||||||||||||||||||||||||||||||
| Maryland | 95.8 | 95.4 | 99.8 | 93.3 | 92.3 | 96.0 | ||||||||||||||||||||||||||||||||
| Research Triangle | 94.0 | 93.5 | 94.6 | 85.0 | 84.5 | 86.1 | ||||||||||||||||||||||||||||||||
| Texas | 91.2 | 78.4 | N/A | 81.6 | 69.9 | N/A | ||||||||||||||||||||||||||||||||
| Subtotal | 95.1 | 94.5 | 94.9 | 89.9 | 88.9 | 89.1 | ||||||||||||||||||||||||||||||||
| Canada | 80.8 | 93.0 | 78.6 | 68.2 | 78.5 | 78.6 | ||||||||||||||||||||||||||||||||
| Non-cluster/other markets | 75.0 | 75.0 | 75.1 | 75.0 | 75.0 | 75.1 | ||||||||||||||||||||||||||||||||
| North America | 94.8 | % | 94.3 | % | 94.0 | % | 89.4 | % | 88.6 | % | 88.5 | % | ||||||||||||||||||||||||||
| Property Listing | | ||||
December 31, 2022 | |||||
| (Dollars in thousands) | |||||
Market / Submarket / Address | RSF | Number of Properties | Annual Rental Revenue | Occupancy Percentage | |||||||||||||||||||||||||||||||||||||||||||||||||||||||||||||
| Operating | Operating and Redevelopment | ||||||||||||||||||||||||||||||||||||||||||||||||||||||||||||||||
| Operating | Development | Redevelopment | Total | ||||||||||||||||||||||||||||||||||||||||||||||||||||||||||||||
| Greater Boston | |||||||||||||||||||||||||||||||||||||||||||||||||||||||||||||||||
| Cambridge/Inner Suburbs | |||||||||||||||||||||||||||||||||||||||||||||||||||||||||||||||||
Mega Campus: Alexandria Center® at Kendall Square | 2,449,354 | — | 403,892 | 2,853,246 | 11 | $ | 198,373 | 99.1 | % | 85.1 | % | ||||||||||||||||||||||||||||||||||||||||||||||||||||||
50(2), 60(2), 75/125(2), 100(2), and 225(2) Binney Street, 215 First Street, 150 Second Street, 300 Third Street(2), 11 Hurley Street, One Rogers Street, and 100 Edwin H. Land Boulevard | |||||||||||||||||||||||||||||||||||||||||||||||||||||||||||||||||
Mega Campus: Alexandria Center® at One Kendall Square | 903,777 | 462,100 | — | 1,365,877 | 12 | 76,350 | 95.8 | 95.8 | |||||||||||||||||||||||||||||||||||||||||||||||||||||||||
| One Kendall Square (Buildings 100, 200, 300, 400, 500, 600/700, 1400, 1800, and 2000), 325 and 399 Binney Street, and One Hampshire Street | |||||||||||||||||||||||||||||||||||||||||||||||||||||||||||||||||
Mega Campus: Alexandria Technology Square® | 1,185,190 | — | — | 1,185,190 | 7 | 116,609 | 99.1 | 99.1 | |||||||||||||||||||||||||||||||||||||||||||||||||||||||||
100, 200, 300, 400, 500, 600, and 700 Technology Square | |||||||||||||||||||||||||||||||||||||||||||||||||||||||||||||||||
| Mega Campus: The Arsenal on the Charles | 872,665 | 248,018 | — | 1,120,683 | 13 | 50,582 | 96.2 | 96.2 | |||||||||||||||||||||||||||||||||||||||||||||||||||||||||
| 311, 321, and 343 Arsenal Street, 300, 400, and 500 North Beacon Street, 1, 2, 3, and 4 Kingsbury Avenue, and 100, 200, and 400 Talcott Avenue | |||||||||||||||||||||||||||||||||||||||||||||||||||||||||||||||||
| Mega Campus: 480 Arsenal Way and 446, 458, 500, and 550 Arsenal Street | 533,327 | — | — | 533,327 | 5 | 24,241 | 97.6 | 97.6 | |||||||||||||||||||||||||||||||||||||||||||||||||||||||||
99 Coolidge Avenue(2) | — | 320,809 | — | 320,809 | 1 | — | N/A | N/A | |||||||||||||||||||||||||||||||||||||||||||||||||||||||||
640 Memorial Drive | 242,477 | — | — | 242,477 | 1 | 19,320 | 77.6 | 77.6 | |||||||||||||||||||||||||||||||||||||||||||||||||||||||||
| 780 and 790 Memorial Drive | 99,658 | — | — | 99,658 | 2 | 9,257 | 100.0 | 100.0 | |||||||||||||||||||||||||||||||||||||||||||||||||||||||||
Cambridge/Inner Suburbs | 6,286,448 | 1,030,927 | 403,892 | 7,721,267 | 52 | 494,732 | 97.3 | 91.4 | |||||||||||||||||||||||||||||||||||||||||||||||||||||||||
| Fenway | |||||||||||||||||||||||||||||||||||||||||||||||||||||||||||||||||
Mega Campus: Alexandria Center® for Life Science – Fenway | 1,267,572 | 170,043 | — | 1,437,615 | 2 | 94,904 | 92.9 | 92.9 | |||||||||||||||||||||||||||||||||||||||||||||||||||||||||
401 Park Drive and 201 Brookline Avenue(2) | |||||||||||||||||||||||||||||||||||||||||||||||||||||||||||||||||
| Seaport Innovation District | |||||||||||||||||||||||||||||||||||||||||||||||||||||||||||||||||
5 and 15(2) Necco Street | 95,400 | 345,995 | — | 441,395 | 2 | 4,414 | 86.6 | 86.6 | |||||||||||||||||||||||||||||||||||||||||||||||||||||||||
| Mega Campus: 380 and 420 E Street | 195,506 | — | — | 195,506 | 2 | 4,490 | 100.0 | 100.0 | |||||||||||||||||||||||||||||||||||||||||||||||||||||||||
| Seaport Innovation District | 290,906 | 345,995 | — | 636,901 | 4 | 8,904 | 95.6 | 95.6 | |||||||||||||||||||||||||||||||||||||||||||||||||||||||||
| Route 128 | |||||||||||||||||||||||||||||||||||||||||||||||||||||||||||||||||
| Mega Campus: 40, 50, and 60 Sylvan Road, 35 Gatehouse Drive, and 840 Winter Street | 638,651 | — | 342,412 | 981,063 | 5 | 38,439 | 100.0 | 65.1 | |||||||||||||||||||||||||||||||||||||||||||||||||||||||||
| Mega Campus: One Moderna Way | 706,988 | — | — | 706,988 | 4 | 29,059 | 100.0 | 100.0 | |||||||||||||||||||||||||||||||||||||||||||||||||||||||||
| 19, 225, and 235 Presidential Way | 585,022 | — | — | 585,022 | 3 | 13,996 | 99.9 | 99.9 | |||||||||||||||||||||||||||||||||||||||||||||||||||||||||
275 Grove Street | 509,702 | — | — | 509,702 | 3 | 15,704 | 66.1 | 66.1 | |||||||||||||||||||||||||||||||||||||||||||||||||||||||||
225, 266, and 275 Second Avenue | 329,005 | — | — | 329,005 | 3 | 18,650 | 100.0 | 100.0 | |||||||||||||||||||||||||||||||||||||||||||||||||||||||||
100 Beaver Street | 82,330 | — | — | 82,330 | 1 | 5,262 | 100.0 | 100.0 | |||||||||||||||||||||||||||||||||||||||||||||||||||||||||
| Route 128 | 2,851,698 | — | 342,412 | 3,194,110 | 19 | 121,110 | 93.9 | 83.8 | |||||||||||||||||||||||||||||||||||||||||||||||||||||||||
| Other | 753,923 | — | 453,869 | 1,207,792 | 7 | 11,360 | 75.2 | 46.9 | |||||||||||||||||||||||||||||||||||||||||||||||||||||||||
Greater Boston | 11,450,547 | 1,546,965 | 1,200,173 | 14,197,685 | 84 | $ | 731,010 | 94.5 | % | 85.5 | % | ||||||||||||||||||||||||||||||||||||||||||||||||||||||
(1)Refer to “New Class A development and redevelopment properties: summary of pipeline” and to “Mega campus” in the “Definitions and reconciliations” of this Supplemental Information for additional details. (2)We own a partial interest in this property through a real estate joint venture. Refer to “Joint venture financial information” of this Supplemental Information for additional details. | |||||||||||||||||||||||||||||||||||||||||||||||||||||||||||||||||
| Property Listing (continued) | | ||||
December 31, 2022 | |||||
| (Dollars in thousands) | |||||
Market / Submarket / Address | RSF | Number of Properties | Annual Rental Revenue | Occupancy Percentage | |||||||||||||||||||||||||||||||||||||||||||||||||||||||||||||
| Operating | Operating and Redevelopment | ||||||||||||||||||||||||||||||||||||||||||||||||||||||||||||||||
| Operating | Development | Redevelopment | Total | ||||||||||||||||||||||||||||||||||||||||||||||||||||||||||||||
| San Francisco Bay Area | |||||||||||||||||||||||||||||||||||||||||||||||||||||||||||||||||
| Mission Bay | |||||||||||||||||||||||||||||||||||||||||||||||||||||||||||||||||
Mega Campus: Alexandria Center® for Science and Technology – Mission Bay(1) | 2,015,177 | 212,796 | — | 2,227,973 | 10 | $ | 98,444 | 100.0 | % | 100.0 | % | ||||||||||||||||||||||||||||||||||||||||||||||||||||||
1455(2), 1515(2), 1655, and 1725 Third Street, 409 and 499 Illinois Street, 1450, 1500, and 1700 Owens Street, and 455 Mission Bay Boulevard South | |||||||||||||||||||||||||||||||||||||||||||||||||||||||||||||||||
| Mission Bay | 2,015,177 | 212,796 | — | 2,227,973 | 10 | 98,444 | 100.0 | 100.0 | |||||||||||||||||||||||||||||||||||||||||||||||||||||||||
| South San Francisco | |||||||||||||||||||||||||||||||||||||||||||||||||||||||||||||||||
Mega Campus: Alexandria Technology Center® – Gateway(1) | 1,114,890 | 230,592 | 300,010 | 1,645,492 | 12 | 60,385 | 92.6 | 73.0 | |||||||||||||||||||||||||||||||||||||||||||||||||||||||||
600(2), 601, 611, 630(2), 650(2), 651, 681, 685, 701, 751, 901(2), and 951(2) Gateway Boulevard | |||||||||||||||||||||||||||||||||||||||||||||||||||||||||||||||||
Mega Campus: 213(1), 249, 259, 269, and 279 East Grand Avenue | 919,704 | — | — | 919,704 | 5 | 48,854 | 100.0 | 100.0 | |||||||||||||||||||||||||||||||||||||||||||||||||||||||||
| Mega Campus: 1122 and 1150 El Camino Real | 725,172 | — | — | 725,172 | 2 | 10,948 | 97.8 | 97.8 | |||||||||||||||||||||||||||||||||||||||||||||||||||||||||
Alexandria Center® for Life Science – South San Francisco | 504,551 | — | — | 504,551 | 3 | 37,153 | 100.0 | 100.0 | |||||||||||||||||||||||||||||||||||||||||||||||||||||||||
| 201 Haskins Way and 400 and 450 East Jamie Court | |||||||||||||||||||||||||||||||||||||||||||||||||||||||||||||||||
500 Forbes Boulevard(1) | 155,685 | — | — | 155,685 | 1 | 10,680 | 100.0 | 100.0 | |||||||||||||||||||||||||||||||||||||||||||||||||||||||||
849/863 Mitten Road/866 Malcolm Road | 103,857 | — | — | 103,857 | 1 | 4,834 | 100.0 | 100.0 | |||||||||||||||||||||||||||||||||||||||||||||||||||||||||
| South San Francisco | 3,523,859 | 230,592 | 300,010 | 4,054,461 | 24 | 172,854 | 97.2 | 89.6 | |||||||||||||||||||||||||||||||||||||||||||||||||||||||||
| Greater Stanford | |||||||||||||||||||||||||||||||||||||||||||||||||||||||||||||||||
Mega Campus: Alexandria Center® for Life Science – San Carlos | 739,192 | — | — | 739,192 | 9 | 49,953 | 97.3 | 97.3 | |||||||||||||||||||||||||||||||||||||||||||||||||||||||||
| 825, 835, 960, and 1501-1599 Industrial Road | |||||||||||||||||||||||||||||||||||||||||||||||||||||||||||||||||
Alexandria Stanford Life Science District | 703,742 | — | — | 703,742 | 9 | 65,349 | 100.0 | 100.0 | |||||||||||||||||||||||||||||||||||||||||||||||||||||||||
| 3160, 3165, 3170, and 3181 Porter Drive and 3301, 3303, 3305, 3307, and 3330 Hillview Avenue | |||||||||||||||||||||||||||||||||||||||||||||||||||||||||||||||||
| 3875 Fabian Way | 228,000 | — | — | 228,000 | 1 | 9,402 | 100.0 | 100.0 | |||||||||||||||||||||||||||||||||||||||||||||||||||||||||
| 3412, 3420, 3440, 3450, and 3460 Hillview Avenue | 338,751 | — | — | 338,751 | 5 | 20,926 | 73.8 | 73.8 | |||||||||||||||||||||||||||||||||||||||||||||||||||||||||
| 2100, 2200, 2300, and 2400 Geng Road | 196,276 | — | — | 196,276 | 4 | 8,448 | 70.7 | 70.7 | |||||||||||||||||||||||||||||||||||||||||||||||||||||||||
| 2475 and 2625/2627/2631 Hanover Street and 1450 Page Mill Road | 194,503 | — | — | 194,503 | 3 | 18,040 | 100.0 | 100.0 | |||||||||||||||||||||||||||||||||||||||||||||||||||||||||
2425 Garcia Avenue/2400/2450 Bayshore Parkway | 99,208 | — | — | 99,208 | 1 | 4,257 | 100.0 | 100.0 | |||||||||||||||||||||||||||||||||||||||||||||||||||||||||
3350 West Bayshore Road | 61,537 | — | — | 61,537 | 1 | 4,518 | 99.9 | 99.9 | |||||||||||||||||||||||||||||||||||||||||||||||||||||||||
| Greater Stanford | 2,561,209 | — | — | 2,561,209 | 33 | 180,893 | 93.5 | 93.5 | |||||||||||||||||||||||||||||||||||||||||||||||||||||||||
| San Francisco Bay Area | 8,100,245 | 443,388 | 300,010 | 8,843,643 | 67 | 452,191 | 96.7 | 93.3 | |||||||||||||||||||||||||||||||||||||||||||||||||||||||||
| New York City | |||||||||||||||||||||||||||||||||||||||||||||||||||||||||||||||||
| New York City | |||||||||||||||||||||||||||||||||||||||||||||||||||||||||||||||||
Mega Campus: Alexandria Center® for Life Science – New York City | 740,972 | — | — | 740,972 | 3 | 71,779 | 94.2 | 94.2 | |||||||||||||||||||||||||||||||||||||||||||||||||||||||||
430 and 450 East 29th Street | |||||||||||||||||||||||||||||||||||||||||||||||||||||||||||||||||
219 East 42nd Street | 349,947 | — | — | 349,947 | 1 | 18,638 | 100.0 | 100.0 | |||||||||||||||||||||||||||||||||||||||||||||||||||||||||
Alexandria Center® for Life Science – Long Island City | 179,100 | — | — | 179,100 | 1 | 6,996 | 69.1 | 69.1 | |||||||||||||||||||||||||||||||||||||||||||||||||||||||||
30-02 48th Avenue | |||||||||||||||||||||||||||||||||||||||||||||||||||||||||||||||||
New York City | 1,270,019 | — | — | 1,270,019 | 5 | $ | 97,413 | 92.3 | % | 92.3 | % | ||||||||||||||||||||||||||||||||||||||||||||||||||||||
Refer to “New Class A development and redevelopment properties: summary of pipeline” and to “Mega campus” in the “Definitions and reconciliations” of this Supplemental Information for additional details. (1)We own a partial interest in this property through a real estate joint venture. Refer to “Joint venture financial information” of this Supplemental Information for additional details. (2)We own 100% of this property. | |||||||||||||||||||||||||||||||||||||||||||||||||||||||||||||||||
| Property Listing (continued) | | ||||
December 31, 2022 | |||||
| (Dollars in thousands) | |||||
Market / Submarket / Address | RSF | Number of Properties | Annual Rental Revenue | Occupancy Percentage | |||||||||||||||||||||||||||||||||||||||||||||||||||||||||||||
| Operating | Operating and Redevelopment | ||||||||||||||||||||||||||||||||||||||||||||||||||||||||||||||||
| Operating | Development | Redevelopment | Total | ||||||||||||||||||||||||||||||||||||||||||||||||||||||||||||||
| San Diego | |||||||||||||||||||||||||||||||||||||||||||||||||||||||||||||||||
| Torrey Pines | |||||||||||||||||||||||||||||||||||||||||||||||||||||||||||||||||
Mega Campus: One Alexandria Square and One Alexandria North | 904,883 | — | — | 904,883 | 10 | $ | 53,236 | 99.9 | % | 99.9 | % | ||||||||||||||||||||||||||||||||||||||||||||||||||||||
3115 and 3215(1) Merryfield Row, 3010, 3013, and 3033 Science Park Road, 10975 and 11119 North Torrey Pines Road, 10975, 10995, and 10996 Torreyana Road, and 3545 Cray Court | |||||||||||||||||||||||||||||||||||||||||||||||||||||||||||||||||
ARE Torrey Ridge | 298,863 | — | — | 298,863 | 3 | 15,747 | 100.0 | 100.0 | |||||||||||||||||||||||||||||||||||||||||||||||||||||||||
| 10578, 10618, and 10628 Science Center Drive | |||||||||||||||||||||||||||||||||||||||||||||||||||||||||||||||||
ARE Nautilus | 213,900 | — | — | 213,900 | 4 | 11,297 | 88.1 | 88.1 | |||||||||||||||||||||||||||||||||||||||||||||||||||||||||
3530 and 3550 John Hopkins Court and 3535 and 3565 General Atomics Court | |||||||||||||||||||||||||||||||||||||||||||||||||||||||||||||||||
| Torrey Pines | 1,417,646 | — | — | 1,417,646 | 17 | 80,280 | 98.2 | 98.2 | |||||||||||||||||||||||||||||||||||||||||||||||||||||||||
| University Town Center | |||||||||||||||||||||||||||||||||||||||||||||||||||||||||||||||||
Mega Campus: Campus Point by Alexandria(1) | 1,662,342 | — | — | 1,662,342 | 11 | 75,970 | 97.7 | 97.7 | |||||||||||||||||||||||||||||||||||||||||||||||||||||||||
9880(2), 10010(2), 10140(2), 10210, 10260, 10290, and 10300 Campus Point Drive and 4161, 4224, 4242, and 4275(2) Campus Point Court | |||||||||||||||||||||||||||||||||||||||||||||||||||||||||||||||||
Mega Campus: 5200 Illumina Way(1) | 792,687 | — | — | 792,687 | 6 | 29,978 | 100.0 | 100.0 | |||||||||||||||||||||||||||||||||||||||||||||||||||||||||
| Mega Campus: University District | 415,462 | — | — | 415,462 | 7 | 18,641 | 100.0 | 100.0 | |||||||||||||||||||||||||||||||||||||||||||||||||||||||||
9625 Towne Centre Drive(1), 4755, 4757, and 4767 Nexus Center Drive, 4796 Executive Drive, 8505 Costa Verde Boulevard, and 4260 Nobel Drive | |||||||||||||||||||||||||||||||||||||||||||||||||||||||||||||||||
| University Town Center | 2,870,491 | — | — | 2,870,491 | 24 | 124,589 | 98.7 | 98.7 | |||||||||||||||||||||||||||||||||||||||||||||||||||||||||
| Sorrento Mesa | |||||||||||||||||||||||||||||||||||||||||||||||||||||||||||||||||
Mega Campus: SD Tech by Alexandria(1) | 1,059,754 | 254,771 | — | 1,314,525 | 15 | 43,387 | 94.1 | 94.1 | |||||||||||||||||||||||||||||||||||||||||||||||||||||||||
9605, 9645, 9675, 9685, 9725, 9735, 9808, 9855, and 9868 Scranton Road, 5505 Morehouse Drive(2), and 10055, 10065, 10075, 10121(2), and 10151(2) Barnes Canyon Road | |||||||||||||||||||||||||||||||||||||||||||||||||||||||||||||||||
| Mega Campus: Sequence District by Alexandria | 803,319 | — | — | 803,319 | 7 | 23,993 | 89.0 | 89.0 | |||||||||||||||||||||||||||||||||||||||||||||||||||||||||
| 6260, 6290, 6310, 6340, 6350, 6420, and 6450 Sequence Drive | |||||||||||||||||||||||||||||||||||||||||||||||||||||||||||||||||
Pacific Technology Park(1) | 544,352 | — | — | 544,352 | 5 | 8,106 | 88.6 | 88.6 | |||||||||||||||||||||||||||||||||||||||||||||||||||||||||
| 9389, 9393, 9401, 9455, and 9477 Waples Street | |||||||||||||||||||||||||||||||||||||||||||||||||||||||||||||||||
Summers Ridge Science Park(1) | 316,531 | — | — | 316,531 | 4 | 11,521 | 100.0 | 100.0 | |||||||||||||||||||||||||||||||||||||||||||||||||||||||||
| 9965, 9975, 9985, and 9995 Summers Ridge Road | |||||||||||||||||||||||||||||||||||||||||||||||||||||||||||||||||
| Scripps Science Park by Alexandria | 244,083 | — | — | 244,083 | 3 | 10,226 | 100.0 | 100.0 | |||||||||||||||||||||||||||||||||||||||||||||||||||||||||
| 10102 Hoyt Park Drive and 10256 and 10260 Meanley Drive | |||||||||||||||||||||||||||||||||||||||||||||||||||||||||||||||||
ARE Portola | 101,857 | — | — | 101,857 | 3 | 3,880 | 100.0 | 100.0 | |||||||||||||||||||||||||||||||||||||||||||||||||||||||||
6175, 6225, and 6275 Nancy Ridge Drive | |||||||||||||||||||||||||||||||||||||||||||||||||||||||||||||||||
5810/5820 Nancy Ridge Drive | 83,354 | — | — | 83,354 | 1 | 3,853 | 100.0 | 100.0 | |||||||||||||||||||||||||||||||||||||||||||||||||||||||||
| 9877 Waples Street | 63,774 | — | — | 63,774 | 1 | 2,521 | 100.0 | 100.0 | |||||||||||||||||||||||||||||||||||||||||||||||||||||||||
5871 Oberlin Drive | 33,842 | — | — | 33,842 | 1 | 1,772 | 100.0 | 100.0 | |||||||||||||||||||||||||||||||||||||||||||||||||||||||||
| Sorrento Mesa | 3,250,866 | 254,771 | — | 3,505,637 | 40 | $ | 109,259 | 93.5 | % | 93.5 | % | ||||||||||||||||||||||||||||||||||||||||||||||||||||||
Refer to “New Class A development and redevelopment properties: summary of pipeline” and to “Mega campus” in the “Definitions and reconciliations” of this Supplemental Information for additional details. (1)We own a partial interest in this property through a real estate joint venture. Refer to “Joint venture financial information” of this Supplemental Information for additional details. (2)We own 100% of this property. | |||||||||||||||||||||||||||||||||||||||||||||||||||||||||||||||||
| Property Listing (continued) | | ||||
December 31, 2022 | |||||
| (Dollars in thousands) | |||||
Market / Submarket / Address | RSF | Number of Properties | Annual Rental Revenue | Occupancy Percentage | |||||||||||||||||||||||||||||||||||||||||||||||||||||||||||||
| Operating | Operating and Redevelopment | ||||||||||||||||||||||||||||||||||||||||||||||||||||||||||||||||
| Operating | Development | Redevelopment | Total | ||||||||||||||||||||||||||||||||||||||||||||||||||||||||||||||
| San Diego (continued) | |||||||||||||||||||||||||||||||||||||||||||||||||||||||||||||||||
| Sorrento Valley | |||||||||||||||||||||||||||||||||||||||||||||||||||||||||||||||||
| 3911, 3931, 3985, 4025, and 4045 Sorrento Valley Boulevard | 131,698 | — | — | 131,698 | 5 | $ | 3,930 | 75.7 | % | 75.7 | % | ||||||||||||||||||||||||||||||||||||||||||||||||||||||
11025, 11035, 11045, 11055, 11065, and 11075 Roselle Street | 119,513 | — | — | 119,513 | 6 | 4,312 | 100.0 | 100.0 | |||||||||||||||||||||||||||||||||||||||||||||||||||||||||
| Sorrento Valley | 251,211 | — | — | 251,211 | 11 | 8,242 | 87.3 | 87.3 | |||||||||||||||||||||||||||||||||||||||||||||||||||||||||
| Other | 309,743 | — | — | 309,743 | 2 | 8,343 | 79.5 | 79.5 | |||||||||||||||||||||||||||||||||||||||||||||||||||||||||
San Diego | 8,099,957 | 254,771 | — | 8,354,728 | 94 | 330,713 | 95.4 | 95.4 | |||||||||||||||||||||||||||||||||||||||||||||||||||||||||
| Seattle | |||||||||||||||||||||||||||||||||||||||||||||||||||||||||||||||||
| Lake Union | |||||||||||||||||||||||||||||||||||||||||||||||||||||||||||||||||
| Mega Campus: The Eastlake Life Science Campus by Alexandria | 937,290 | 311,631 | — | 1,248,921 | 9 | 56,305 | 97.4 | 97.4 | |||||||||||||||||||||||||||||||||||||||||||||||||||||||||
1150, 1165, 1201(1), 1208(1), 1551, and 1616 Eastlake Avenue East, 188 and 199(1) East Blaine Street, and 1600 Fairview Avenue East | |||||||||||||||||||||||||||||||||||||||||||||||||||||||||||||||||
Mega Campus: Alexandria Center® for Life Science – South Lake Union | |||||||||||||||||||||||||||||||||||||||||||||||||||||||||||||||||
400(1) and 601 Dexter Avenue North | 309,434 | — | — | 309,434 | 2 | 15,494 | 100.0 | 100.0 | |||||||||||||||||||||||||||||||||||||||||||||||||||||||||
219 Terry Avenue North | 30,705 | — | — | 30,705 | 1 | 1,935 | 100.0 | 100.0 | |||||||||||||||||||||||||||||||||||||||||||||||||||||||||
| Lake Union | 1,277,429 | 311,631 | — | 1,589,060 | 12 | 73,734 | 98.1 | 98.1 | |||||||||||||||||||||||||||||||||||||||||||||||||||||||||
| SoDo | |||||||||||||||||||||||||||||||||||||||||||||||||||||||||||||||||
| 830 4th Avenue South | 42,380 | — | — | 42,380 | 1 | 1,691 | 70.5 | 70.5 | |||||||||||||||||||||||||||||||||||||||||||||||||||||||||
| Elliott Bay | |||||||||||||||||||||||||||||||||||||||||||||||||||||||||||||||||
3000/3018 Western Avenue | 47,746 | — | — | 47,746 | 1 | 3,147 | 100.0 | 100.0 | |||||||||||||||||||||||||||||||||||||||||||||||||||||||||
410 West Harrison Street and 410 Elliott Avenue West | 36,849 | — | — | 36,849 | 2 | 1,613 | 100.0 | 100.0 | |||||||||||||||||||||||||||||||||||||||||||||||||||||||||
| Elliott Bay | 84,595 | — | — | 84,595 | 3 | 4,760 | 100.0 | 100.0 | |||||||||||||||||||||||||||||||||||||||||||||||||||||||||
| Bothell | |||||||||||||||||||||||||||||||||||||||||||||||||||||||||||||||||
Mega Campus: Alexandria Center® for Advanced Technologies – Canyon Park | 1,060,958 | — | — | 1,060,958 | 22 | 23,042 | 96.7 | 96.7 | |||||||||||||||||||||||||||||||||||||||||||||||||||||||||
| 22121 and 22125 17th Avenue Southeast, 22021, 22025, 22026, 22030, 22118, and 22122 20th Avenue Southeast, 22333, 22422, 22515, 22522, 22722, and 22745 29th Drive Southeast, 21540, 22213, and 22309 30th Drive Southeast, and 1629, 1631, 1725, 1916, and 1930 220th Street Southeast | |||||||||||||||||||||||||||||||||||||||||||||||||||||||||||||||||
Alexandria Center® for Advanced Technologies – Monte Villa Parkway | 246,647 | — | 213,976 | 460,623 | 6 | 4,657 | 97.3 | 52.1 | |||||||||||||||||||||||||||||||||||||||||||||||||||||||||
| 3301, 3303, 3305, 3307, 3555, and 3755 Monte Villa Parkway | |||||||||||||||||||||||||||||||||||||||||||||||||||||||||||||||||
| Bothell | 1,307,605 | — | 213,976 | 1,521,581 | 28 | 27,699 | 96.8 | 83.2 | |||||||||||||||||||||||||||||||||||||||||||||||||||||||||
| Other | 102,437 | — | — | 102,437 | 2 | 1,145 | 93.5 | 93.5 | |||||||||||||||||||||||||||||||||||||||||||||||||||||||||
Seattle | 2,814,446 | 311,631 | 213,976 | 3,340,053 | 46 | $ | 109,029 | 97.0 | % | 90.1 | % | ||||||||||||||||||||||||||||||||||||||||||||||||||||||
Refer to “New Class A development and redevelopment properties: summary of pipeline” and to “Mega campus” in the “Definitions and reconciliations” of this Supplemental Information for additional details. (1)We own a partial interest in this property through a real estate joint venture. Refer to “Joint venture financial information” of this Supplemental Information for additional details. | |||||||||||||||||||||||||||||||||||||||||||||||||||||||||||||||||
| Property Listing (continued) | | ||||
December 31, 2022 | |||||
| (Dollars in thousands) | |||||
Market / Submarket / Address | RSF | Number of Properties | Annual Rental Revenue | Occupancy Percentage | |||||||||||||||||||||||||||||||||||||||||||||||||||||||||||||
| Operating | Operating and Redevelopment | ||||||||||||||||||||||||||||||||||||||||||||||||||||||||||||||||
| Operating | Development | Redevelopment | Total | ||||||||||||||||||||||||||||||||||||||||||||||||||||||||||||||
| Maryland | |||||||||||||||||||||||||||||||||||||||||||||||||||||||||||||||||
| Rockville | |||||||||||||||||||||||||||||||||||||||||||||||||||||||||||||||||
Mega Campus: Alexandria Center® for Life Science – Shady Grove | 1,090,102 | 282,000 | 61,322 | 1,433,424 | 19 | $ | 49,353 | 99.0 | % | 93.7 | % | ||||||||||||||||||||||||||||||||||||||||||||||||||||||
| 9601, 9603, 9605, 9704, 9708, 9712, 9714, 9800, 9804, 9808, 9900, and 9950 Medical Center Drive, 14920 and 15010 Broschart Road, 9920 Belward Campus Drive, and 9810 Darnestown Road | |||||||||||||||||||||||||||||||||||||||||||||||||||||||||||||||||
1330 Piccard Drive | 131,511 | — | — | 131,511 | 1 | 4,034 | 100.0 | 100.0 | |||||||||||||||||||||||||||||||||||||||||||||||||||||||||
1405 and 1450(1) Research Boulevard | 114,849 | — | — | 114,849 | 2 | 2,631 | 62.8 | 62.8 | |||||||||||||||||||||||||||||||||||||||||||||||||||||||||
1500 and 1550 East Gude Drive | 91,359 | — | — | 91,359 | 2 | 1,844 | 100.0 | 100.0 | |||||||||||||||||||||||||||||||||||||||||||||||||||||||||
5 Research Place | 63,852 | — | — | 63,852 | 1 | 2,999 | 100.0 | 100.0 | |||||||||||||||||||||||||||||||||||||||||||||||||||||||||
5 Research Court | 51,520 | — | — | 51,520 | 1 | 1,788 | 100.0 | 100.0 | |||||||||||||||||||||||||||||||||||||||||||||||||||||||||
12301 Parklawn Drive | 49,185 | — | — | 49,185 | 1 | 1,530 | 100.0 | 100.0 | |||||||||||||||||||||||||||||||||||||||||||||||||||||||||
| Rockville | 1,592,378 | 282,000 | 61,322 | 1,935,700 | 27 | 64,179 | 96.6 | 93.0 | |||||||||||||||||||||||||||||||||||||||||||||||||||||||||
| Gaithersburg | |||||||||||||||||||||||||||||||||||||||||||||||||||||||||||||||||
Alexandria Technology Center® – Gaithersburg I | 613,438 | — | — | 613,438 | 9 | 17,359 | 98.6 | 98.6 | |||||||||||||||||||||||||||||||||||||||||||||||||||||||||
| 9, 25, 35, 45, 50, and 55 West Watkins Mill Road and 910, 930, and 940 Clopper Road | |||||||||||||||||||||||||||||||||||||||||||||||||||||||||||||||||
Alexandria Technology Center® – Gaithersburg II | 486,324 | — | — | 486,324 | 7 | 17,632 | 96.5 | 96.5 | |||||||||||||||||||||||||||||||||||||||||||||||||||||||||
| 700, 704, and 708 Quince Orchard Road and 19, 20, 21, and 22 Firstfield Road | |||||||||||||||||||||||||||||||||||||||||||||||||||||||||||||||||
| 20400 Century Boulevard | 50,738 | — | 29,812 | 80,550 | 1 | 2,035 | 100.0 | 63.0 | |||||||||||||||||||||||||||||||||||||||||||||||||||||||||
401 Professional Drive | 63,154 | — | — | 63,154 | 1 | 1,918 | 100.0 | 100.0 | |||||||||||||||||||||||||||||||||||||||||||||||||||||||||
950 Wind River Lane | 50,000 | — | — | 50,000 | 1 | 1,234 | 100.0 | 100.0 | |||||||||||||||||||||||||||||||||||||||||||||||||||||||||
620 Professional Drive | 27,950 | — | — | 27,950 | 1 | 1,207 | 100.0 | 100.0 | |||||||||||||||||||||||||||||||||||||||||||||||||||||||||
| Gaithersburg | 1,291,604 | — | 29,812 | 1,321,416 | 20 | 41,385 | 98.0 | 95.8 | |||||||||||||||||||||||||||||||||||||||||||||||||||||||||
| Beltsville | |||||||||||||||||||||||||||||||||||||||||||||||||||||||||||||||||
| 8000/9000/10000 Virginia Manor Road | 191,884 | — | — | 191,884 | 1 | 2,951 | 100.0 | 100.0 | |||||||||||||||||||||||||||||||||||||||||||||||||||||||||
101 West Dickman Street(1) | 135,423 | — | — | 135,423 | 1 | 705 | 51.1 | 51.1 | |||||||||||||||||||||||||||||||||||||||||||||||||||||||||
| Beltsville | 327,307 | — | — | 327,307 | 2 | 3,656 | 79.8 | 79.8 | |||||||||||||||||||||||||||||||||||||||||||||||||||||||||
| Northern Virginia | |||||||||||||||||||||||||||||||||||||||||||||||||||||||||||||||||
| 14225 Newbrook Drive | 248,186 | — | — | 248,186 | 1 | 6,127 | 100.0 | 100.0 | |||||||||||||||||||||||||||||||||||||||||||||||||||||||||
Maryland | 3,459,475 | 282,000 | 91,134 | 3,832,609 | 50 | $ | 115,347 | 95.8 | % | 93.3 | % | ||||||||||||||||||||||||||||||||||||||||||||||||||||||
Refer to “New Class A development and redevelopment properties: summary of pipeline” and to “Mega campus” in the “Definitions and reconciliations” of this Supplemental Information for additional details. (1)We own a partial interest in this property through a real estate joint venture. Refer to “Joint venture financial information” of this Supplemental Information for additional details. | |||||||||||||||||||||||||||||||||||||||||||||||||||||||||||||||||
| Property Listing (continued) | | ||||
December 31, 2022 | |||||
| (Dollars in thousands) | |||||
Market / Submarket / Address | RSF | Number of Properties | Annual Rental Revenue | Occupancy Percentage | |||||||||||||||||||||||||||||||||||||||||||||||||||||||||||||
| Operating | Operating and Redevelopment | ||||||||||||||||||||||||||||||||||||||||||||||||||||||||||||||||
| Operating | Development | Redevelopment | Total | ||||||||||||||||||||||||||||||||||||||||||||||||||||||||||||||
| Research Triangle | |||||||||||||||||||||||||||||||||||||||||||||||||||||||||||||||||
| Research Triangle | |||||||||||||||||||||||||||||||||||||||||||||||||||||||||||||||||
Mega Campus: Alexandria Center® for Life Science – Durham | 1,880,185 | — | 376,871 | 2,257,056 | 16 | $ | 37,681 | 93.2 | % | 77.6 | % | ||||||||||||||||||||||||||||||||||||||||||||||||||||||
6, 8, 10, 12, 14, 40, 41, 42, and 65 Moore Drive, 21, 25, 27, 29, and 31 Alexandria Way, 2400 Ellis Road, and 14 TW Alexander Drive | |||||||||||||||||||||||||||||||||||||||||||||||||||||||||||||||||
Mega Campus: Alexandria Center® for Advanced Technologies – Research Triangle | 350,267 | 180,000 | — | 530,267 | 5 | 15,869 | 93.9 | 93.9 | |||||||||||||||||||||||||||||||||||||||||||||||||||||||||
| 4, 6, 8, 10, and 12 Davis Drive | |||||||||||||||||||||||||||||||||||||||||||||||||||||||||||||||||
Alexandria Center® for AgTech | 342,881 | — | — | 342,881 | 2 | 15,315 | 94.1 | 94.1 | |||||||||||||||||||||||||||||||||||||||||||||||||||||||||
| 5 and 9 Laboratory Drive | |||||||||||||||||||||||||||||||||||||||||||||||||||||||||||||||||
| 104, 108, 110, 112, and 114 TW Alexander Drive | 227,902 | — | — | 227,902 | 5 | 7,375 | 94.3 | 94.3 | |||||||||||||||||||||||||||||||||||||||||||||||||||||||||
Alexandria Technology Center® – Alston | 186,870 | — | — | 186,870 | 3 | 4,009 | 94.1 | 94.1 | |||||||||||||||||||||||||||||||||||||||||||||||||||||||||
| 100, 800, and 801 Capitola Drive | |||||||||||||||||||||||||||||||||||||||||||||||||||||||||||||||||
| 6040 George Watts Hill Drive | 61,547 | 88,038 | — | 149,585 | 2 | 2,148 | 100.0 | 100.0 | |||||||||||||||||||||||||||||||||||||||||||||||||||||||||
Alexandria Innovation Center® – Research Triangle | 136,729 | — | — | 136,729 | 3 | 3,963 | 97.2 | 97.2 | |||||||||||||||||||||||||||||||||||||||||||||||||||||||||
| 7010, 7020, and 7030 Kit Creek Road | |||||||||||||||||||||||||||||||||||||||||||||||||||||||||||||||||
7 Triangle Drive | 104,531 | — | — | 104,531 | 1 | 4,422 | 100.0 | 100.0 | |||||||||||||||||||||||||||||||||||||||||||||||||||||||||
2525 East NC Highway 54 | 82,996 | — | — | 82,996 | 1 | 3,651 | 100.0 | 100.0 | |||||||||||||||||||||||||||||||||||||||||||||||||||||||||
407 Davis Drive | 81,956 | — | — | 81,956 | 1 | 1,644 | 100.0 | 100.0 | |||||||||||||||||||||||||||||||||||||||||||||||||||||||||
601 Keystone Park Drive | 77,395 | — | — | 77,395 | 1 | 1,072 | 74.3 | 74.3 | |||||||||||||||||||||||||||||||||||||||||||||||||||||||||
5 Triangle Drive | 32,120 | — | — | 32,120 | 1 | 1,147 | 100.0 | 100.0 | |||||||||||||||||||||||||||||||||||||||||||||||||||||||||
6101 Quadrangle Drive | 31,600 | — | — | 31,600 | 1 | 759 | 100.0 | 100.0 | |||||||||||||||||||||||||||||||||||||||||||||||||||||||||
Research Triangle | 3,596,979 | 268,038 | 376,871 | 4,241,888 | 42 | 99,055 | 94.0 | 85.0 | |||||||||||||||||||||||||||||||||||||||||||||||||||||||||
| Texas | |||||||||||||||||||||||||||||||||||||||||||||||||||||||||||||||||
| Austin | |||||||||||||||||||||||||||||||||||||||||||||||||||||||||||||||||
| Mega Campus: Intersection Campus | 1,525,613 | — | — | 1,525,613 | 12 | 39,039 | 90.0 | 90.0 | |||||||||||||||||||||||||||||||||||||||||||||||||||||||||
| 1001 Trinity Street and 1020 Red River Street | 198,972 | — | — | 198,972 | 2 | 6,746 | 100.0 | 100.0 | |||||||||||||||||||||||||||||||||||||||||||||||||||||||||
| Austin | 1,724,585 | — | — | 1,724,585 | 14 | 45,785 | 90.0 | 90.0 | |||||||||||||||||||||||||||||||||||||||||||||||||||||||||
| Greater Houston | |||||||||||||||||||||||||||||||||||||||||||||||||||||||||||||||||
| 8800 Technology Forest Place | — | — | 201,499 | 201,499 | 1 | — | N/A | — | |||||||||||||||||||||||||||||||||||||||||||||||||||||||||
| Texas | 1,724,585 | — | 201,499 | 1,926,084 | 15 | 45,785 | 91.2 | 81.6 | |||||||||||||||||||||||||||||||||||||||||||||||||||||||||
Canada | 577,225 | — | 107,081 | 684,306 | 8 | 9,868 | 80.8 | 68.2 | |||||||||||||||||||||||||||||||||||||||||||||||||||||||||
| Non-cluster/other markets | 382,960 | — | — | 382,960 | 11 | 14,554 | 75.0 | 75.0 | |||||||||||||||||||||||||||||||||||||||||||||||||||||||||
North America, excluding properties held for sale | 41,476,438 | 3,106,793 | 2,490,744 | 47,073,975 | 422 | 2,004,965 | 94.8 | % | 89.4 | % | |||||||||||||||||||||||||||||||||||||||||||||||||||||||
Properties held for sale | 297,284 | — | — | 297,284 | 10 | 2,476 | 34.0 | % | 34.0 | % | |||||||||||||||||||||||||||||||||||||||||||||||||||||||
Total – North America | 41,773,722 | 3,106,793 | 2,490,744 | 47,371,259 | 432 | $ | 2,007,441 | ||||||||||||||||||||||||||||||||||||||||||||||||||||||||||
| Investments in Real Estate | | ||||
December 31, 2022 | |||||
| Investments in Real Estate | | ||||
December 31, 2022 | |||||
| (Dollars in thousands) | |||||
| Development and Redevelopment | ||||||||||||||||||||||||||||||||||||||||||||
| Operating | Under Construction | Near Term | Intermediate Term | Future | Subtotal | Total | ||||||||||||||||||||||||||||||||||||||
| Investments in real estate | ||||||||||||||||||||||||||||||||||||||||||||
Gross book value as of December 31, 2022(1) | $ | 25,568,121 | $ | 4,055,353 | $ | 1,738,913 | $ | 918,528 | $ | 2,002,541 | $ | 8,715,335 | $ | 34,283,456 | ||||||||||||||||||||||||||||||
Square footage | ||||||||||||||||||||||||||||||||||||||||||||
| Operating | 41,773,722 | — | — | — | — | — | 41,773,722 | |||||||||||||||||||||||||||||||||||||
| New Class A development and redevelopment properties | — | 5,597,537 | 6,248,830 | (2) | 4,780,268 | 20,716,308 | 37,342,943 | 37,342,943 | ||||||||||||||||||||||||||||||||||||
Value-creation square feet currently included in rental properties(3) | — | — | (656,378) | (434,776) | (3,459,383) | (4,550,537) | (4,550,537) | |||||||||||||||||||||||||||||||||||||
Total square footage | 41,773,722 | 5,597,537 | 5,592,452 | 4,345,492 | 17,256,925 | 32,792,406 | 74,566,128 | |||||||||||||||||||||||||||||||||||||
| New Class A Development and Redevelopment Properties: Recent Deliveries | | ||||
December 31, 2022 | |||||
| The Arsenal on the Charles | 201 Brookline Avenue | 201 Haskins Way | 825 and 835 Industrial Road | |||||||||||||||||
| Greater Boston/ Cambridge/Inner Suburbs | Greater Boston/ Fenway | San Francisco Bay Area/ South San Francisco | San Francisco Bay Area/ Greater Stanford | |||||||||||||||||
| 387,678 RSF | 340,073 RSF | 323,190 RSF | 526,129 RSF | |||||||||||||||||
| 96% Occupancy | 100% Occupancy | 100% Occupancy | 100% Occupancy | |||||||||||||||||
 |  |  |  | |||||||||||||||||
| 3160 Porter Drive | 30-02 48th Avenue | 3115 Merryfield Row | 10055 Barnes Canyon Road | |||||||||||||||||
| San Francisco Bay Area/ Greater Stanford | New York City/New York City | San Diego/Torrey Pines | San Diego/Sorrento Mesa | |||||||||||||||||
| 92,300 RSF | 137,187 RSF | 146,456 RSF | 195,435 RSF | |||||||||||||||||
| 83% Occupancy | 69% Occupancy | 93% Occupancy | 100% Occupancy | |||||||||||||||||
 |  |  | 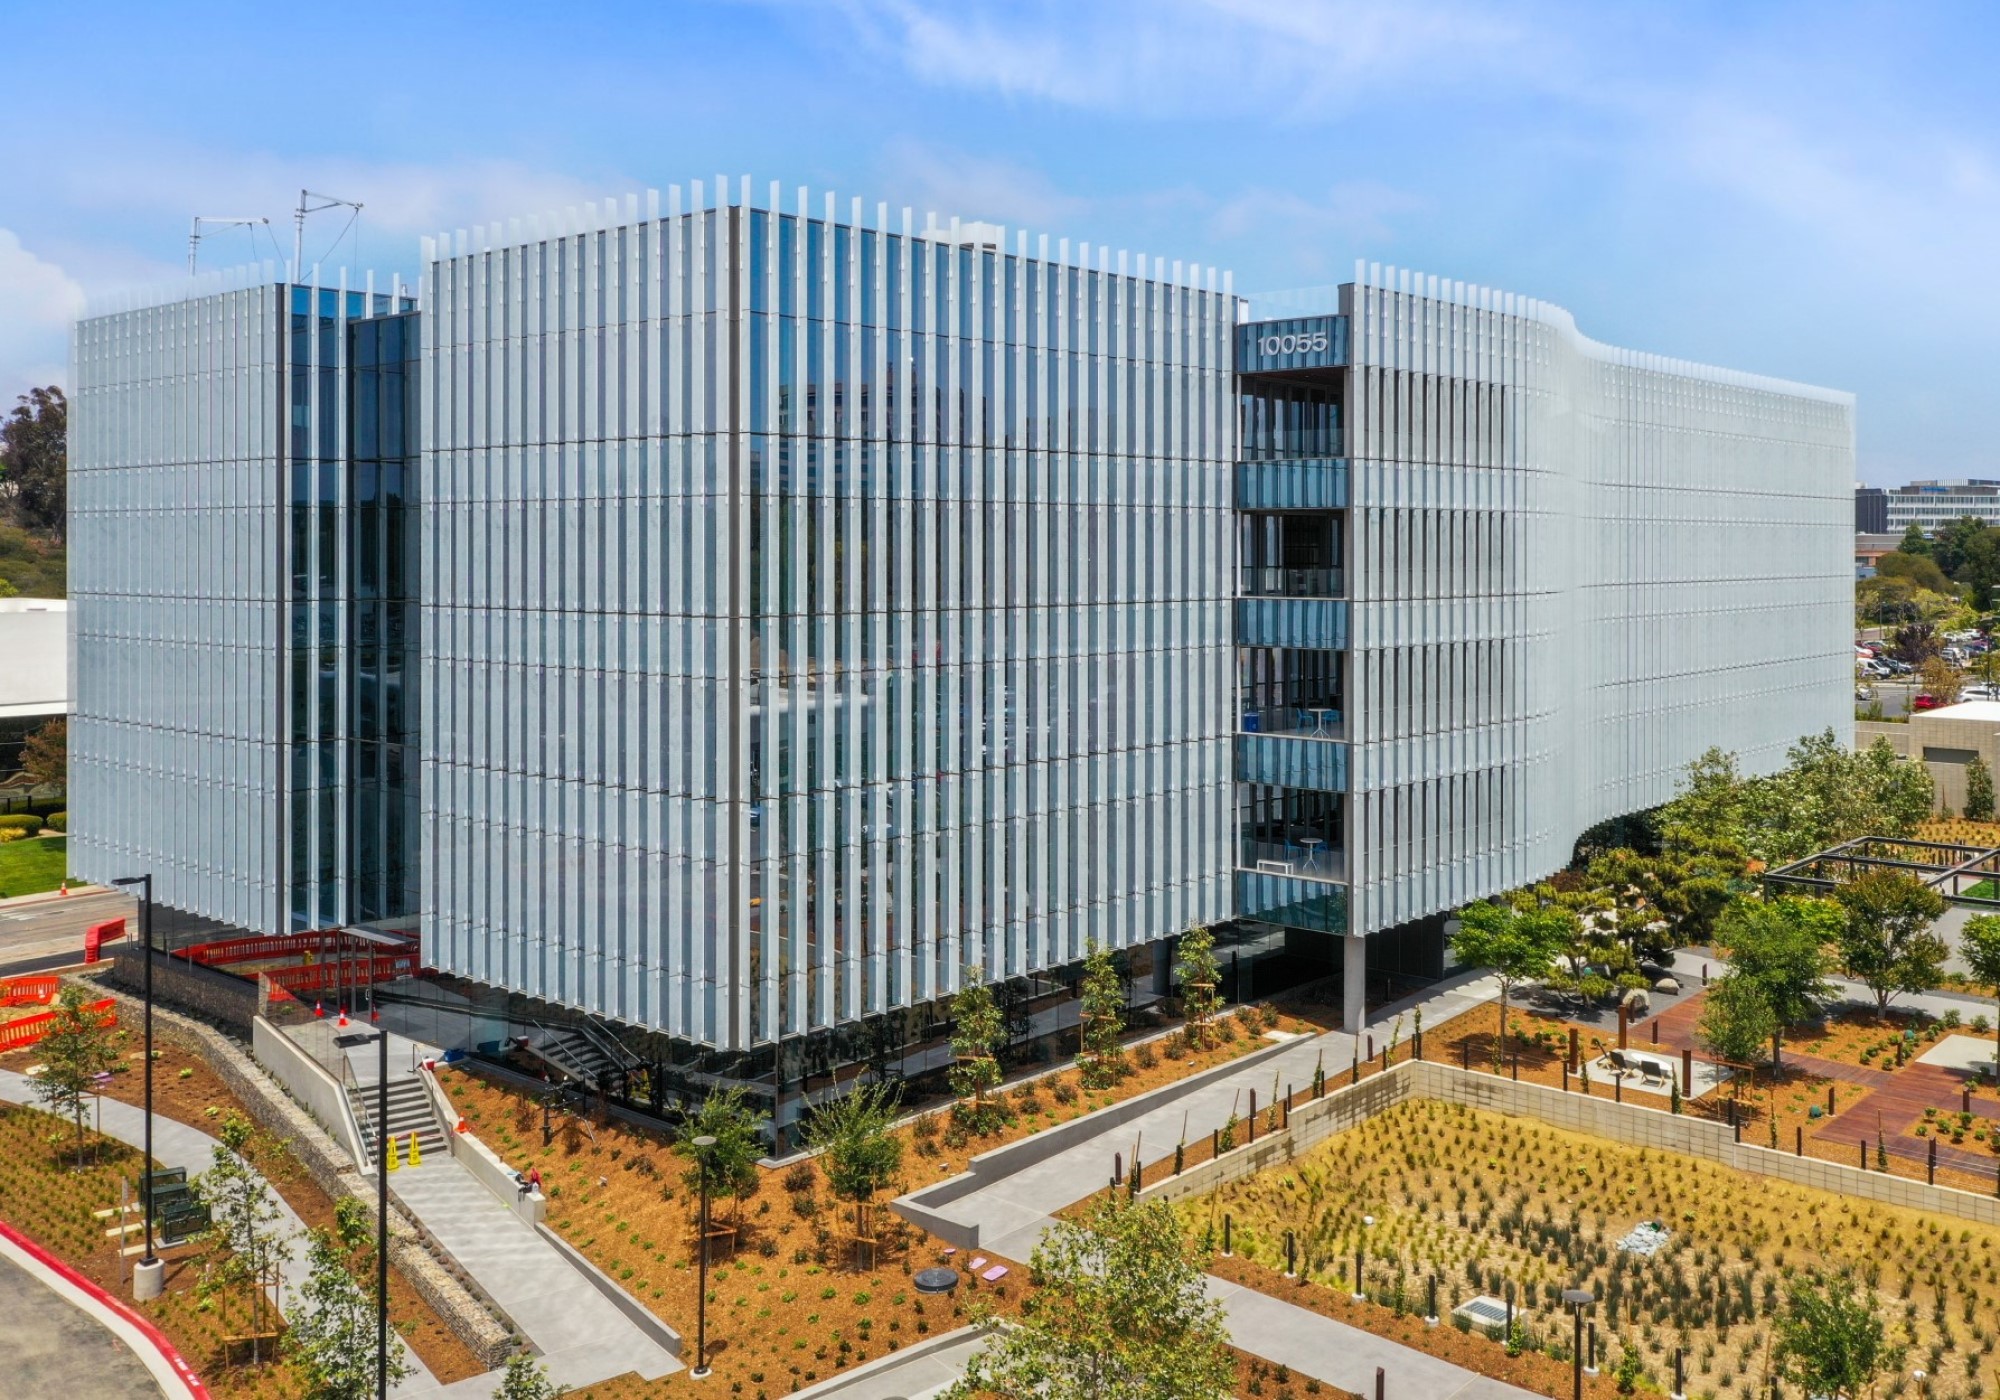 | |||||||||||||||||
| New Class A Development and Redevelopment Properties: Recent Deliveries (continued) | |||||
| |||||
December 31, 2022 | |||||
| 10102 Hoyt Park Drive | 5505 Morehouse Drive | 9601 and 9603 Medical Center Drive | 9950 Medical Center Drive | |||||||||||||||||
| San Diego/Sorrento Mesa | San Diego/Sorrento Mesa | Maryland/Rockville | Maryland/Rockville | |||||||||||||||||
| 144,113 RSF | 79,945 RSF | 34,589 RSF | 84,264 RSF | |||||||||||||||||
| 100% Occupancy | 100% Occupancy | 100% Occupancy | 100% Occupancy | |||||||||||||||||
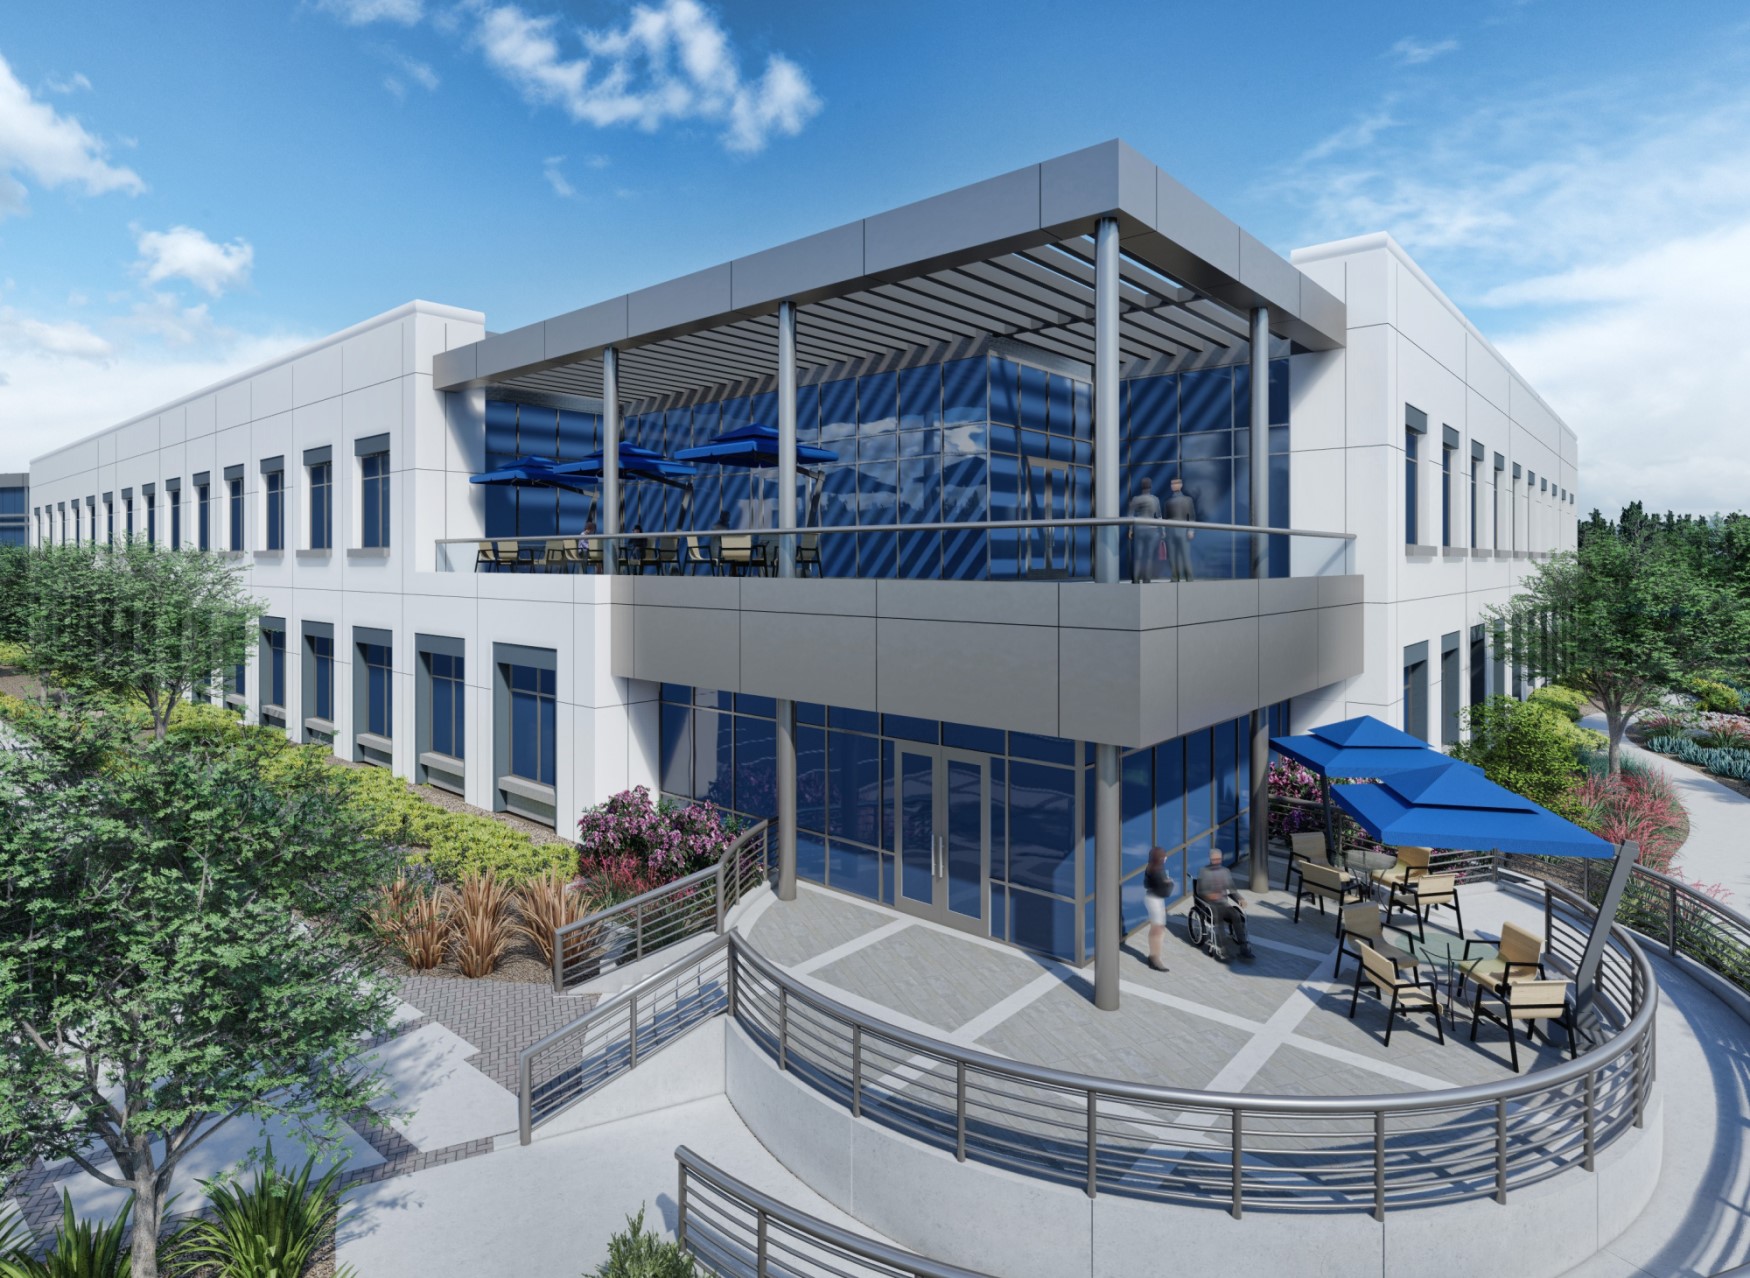 | 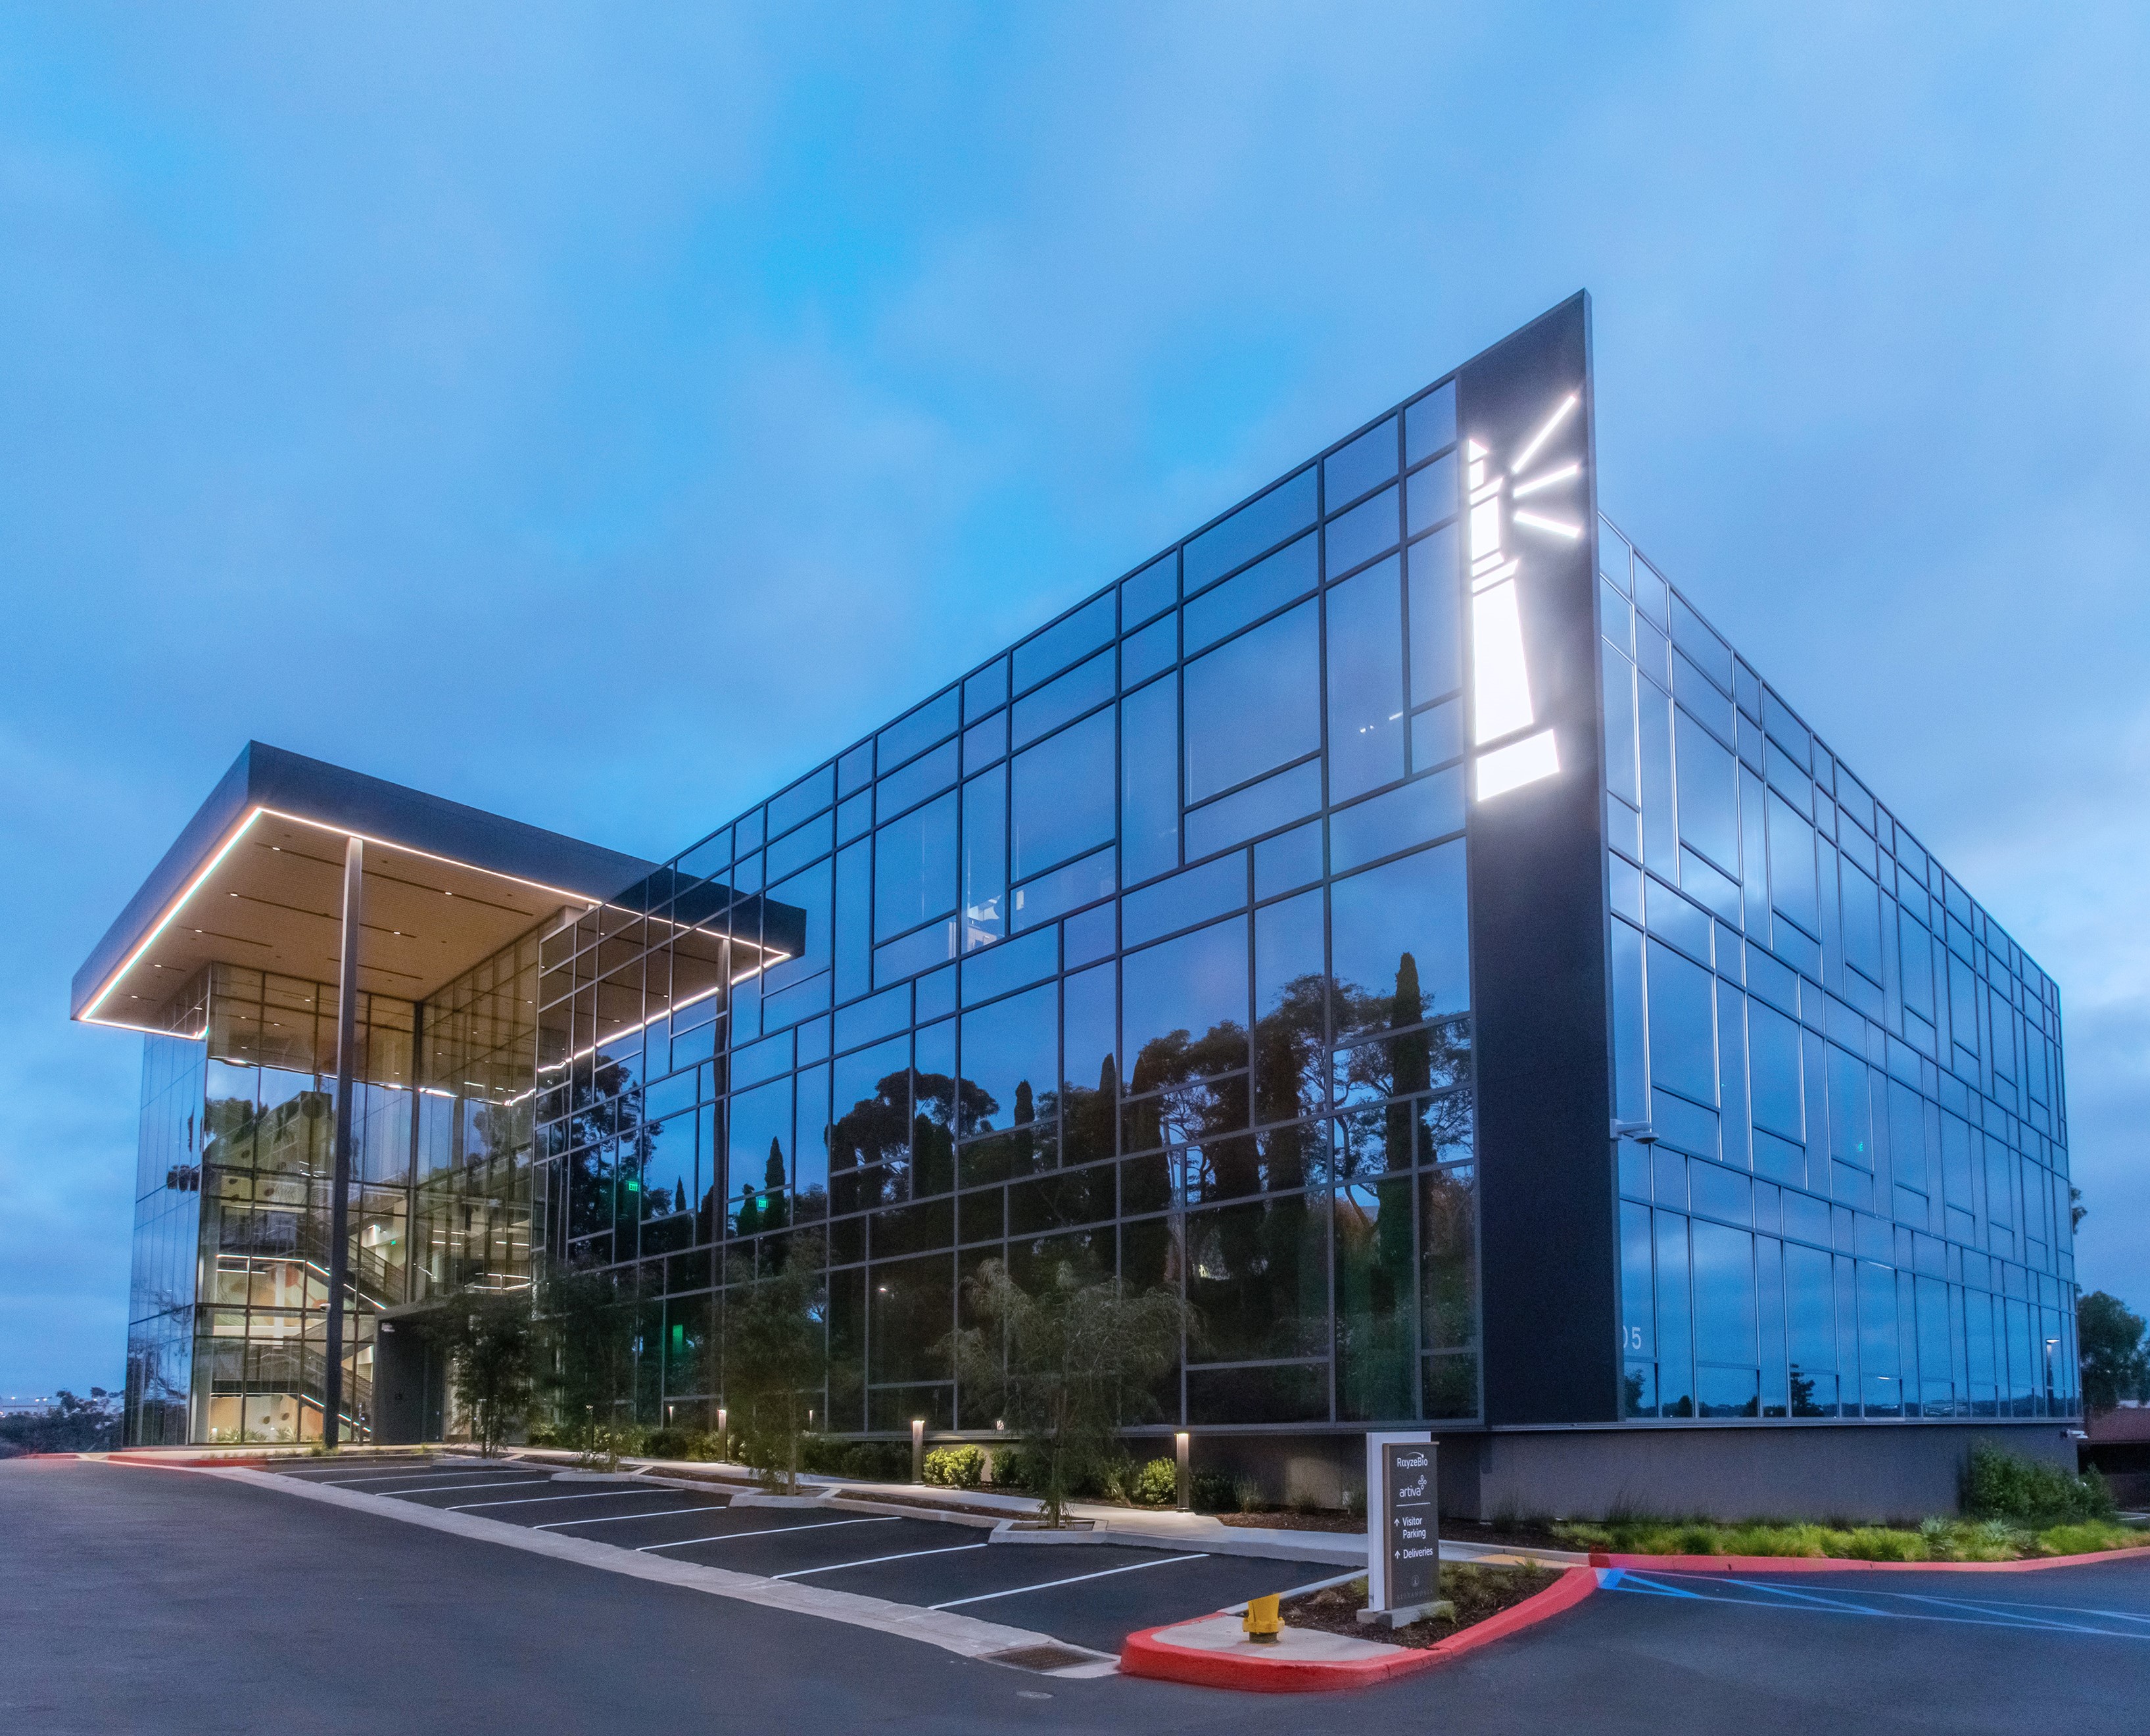 | 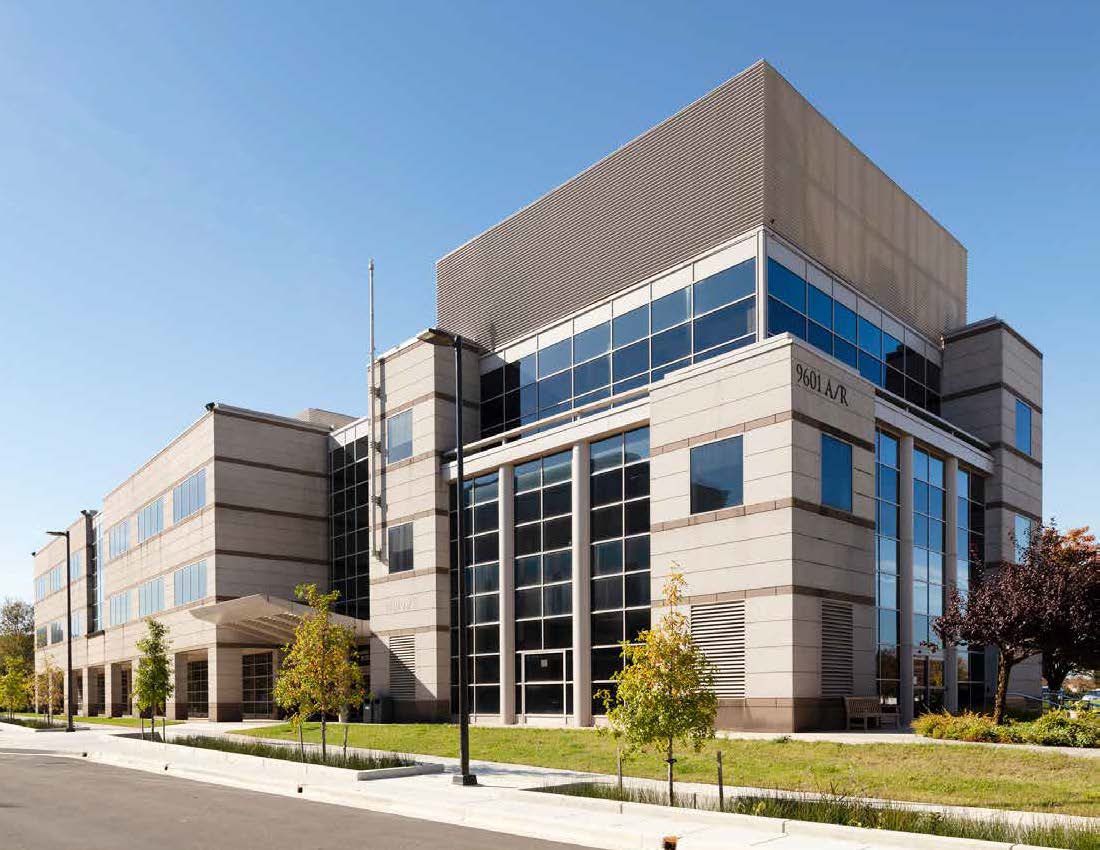 |  | |||||||||||||||||
| 20400 Century Boulevard | 2400 Ellis Road, 40 and 41 Moore Drive, and 14 TW Alexander Drive(1) | 5 and 9 Laboratory Drive(2) | 8 and 10 Davis Drive(3) | |||||||||||||||||
| Maryland/Gaithersburg | Research Triangle/Research Triangle | Research Triangle/Research Triangle | Research Triangle/Research Triangle | |||||||||||||||||
| 50,738 RSF | 326,445 RSF | 342,881 RSF | 250,000 RSF | |||||||||||||||||
| 100% Occupancy | 100% Occupancy | 94% Occupancy | 94% Occupancy | |||||||||||||||||
 |  |  |  | |||||||||||||||||
| New Class A Development and Redevelopment Properties: Recent Deliveries (continued) | |||||
| |||||
December 31, 2022 | |||||
| (Dollars in thousands) | |||||
| Property/Market/Submarket | Our Ownership Interest | RSF Placed in Service | Occupancy Percentage(2) | Total Project | Unlevered Yields | |||||||||||||||||||||||||||||||||||||||||||||||||||||||||||||||||||||||||||||||||||||||||||||
4Q22 Delivery Date(1) | Prior to 1/1/22 | 1Q22 | 2Q22 | 3Q22 | 4Q22 | Total | Initial Stabilized | Initial Stabilized (Cash Basis) | ||||||||||||||||||||||||||||||||||||||||||||||||||||||||||||||||||||||||||||||||||||||||||
| RSF | Investment | |||||||||||||||||||||||||||||||||||||||||||||||||||||||||||||||||||||||||||||||||||||||||||||||||
| Development projects | ||||||||||||||||||||||||||||||||||||||||||||||||||||||||||||||||||||||||||||||||||||||||||||||||||
| 201 Brookline Avenue/Greater Boston/Fenway | 11/3/22 | 98.8% | — | — | — | 261,990 | 78,083 | 340,073 | 100% | 510,116 | $ | 734,000 | 7.2 | % | 6.2 | % | ||||||||||||||||||||||||||||||||||||||||||||||||||||||||||||||||||||||||||||||||||
| 201 Haskins Way/San Francisco Bay Area/South San Francisco | N/A | 100% | 270,879 | 52,311 | — | — | — | 323,190 | 100% | 323,190 | 367,000 | 6.3 | 6.0 | |||||||||||||||||||||||||||||||||||||||||||||||||||||||||||||||||||||||||||||||||||||
| 825 and 835 Industrial Road/San Francisco Bay Area/Greater Stanford | N/A | 100% | 476,211 | 49,918 | — | — | — | 526,129 | 100% | 526,129 | 631,000 | 6.7 | 6.5 | |||||||||||||||||||||||||||||||||||||||||||||||||||||||||||||||||||||||||||||||||||||
| 3115 Merryfield Row/San Diego/Torrey Pines | N/A | 100% | — | 146,456 | — | — | — | 146,456 | 93% | 146,456 | 150,000 | 6.3 | 6.2 | |||||||||||||||||||||||||||||||||||||||||||||||||||||||||||||||||||||||||||||||||||||
| 10055 Barnes Canyon Road/San Diego/Sorrento Mesa | 11/21/22 | 50.0% | — | — | 110,454 | 9,473 | 75,508 | 195,435 | 100% | 195,435 | 189,000 | 7.2 | 6.7 | |||||||||||||||||||||||||||||||||||||||||||||||||||||||||||||||||||||||||||||||||||||
| 10102 Hoyt Park Drive/San Diego/Sorrento Mesa | 11/15/22 | 100% | — | — | — | — | 144,113 | 144,113 | 100% | 144,113 | 114,000 | 7.4 | 6.8 | |||||||||||||||||||||||||||||||||||||||||||||||||||||||||||||||||||||||||||||||||||||
| 9950 Medical Center Drive/Maryland/Rockville | N/A | 100% | — | 84,264 | — | — | — | 84,264 | 100% | 84,264 | 57,000 | 8.9 | 7.8 | |||||||||||||||||||||||||||||||||||||||||||||||||||||||||||||||||||||||||||||||||||||
| 5 and 9 Laboratory Drive/Research Triangle/Research Triangle | 12/21/22 | 100% | 267,509 | 11,211 | — | 1,485 | 62,676 | 342,881 | 94% | 342,881 | 221,000 | 6.9 | 7.0 | |||||||||||||||||||||||||||||||||||||||||||||||||||||||||||||||||||||||||||||||||||||
| 8 and 10 Davis Drive/Research Triangle/ Research Triangle | N/A | 100% | 65,247 | 44,980 | 139,773 | — | — | 250,000 | 94% | 250,000 | 159,000 | 7.6 | 7.3 | |||||||||||||||||||||||||||||||||||||||||||||||||||||||||||||||||||||||||||||||||||||
| Redevelopment projects | ||||||||||||||||||||||||||||||||||||||||||||||||||||||||||||||||||||||||||||||||||||||||||||||||||
| The Arsenal on the Charles/Greater Boston/Cambridge/Inner Suburbs | 12/31/22 | 100% | 137,111 | 99,796 | 50,663 | 43,351 | 56,757 | 387,678 | 96% | 872,665 | 834,000 | 6.3 | 5.6 | |||||||||||||||||||||||||||||||||||||||||||||||||||||||||||||||||||||||||||||||||||||
| 3160 Porter Drive/San Francisco Bay Area/Greater Stanford | N/A | 100% | 57,696 | 34,604 | — | — | — | 92,300 | 83% | 92,300 | 117,000 | 4.6 | 4.6 | |||||||||||||||||||||||||||||||||||||||||||||||||||||||||||||||||||||||||||||||||||||
| 30-02 48th Avenue/New York City/New York City | 12/31/22 | 100% | 41,848 | 11,092 | 18,689 | 10,197 | 55,361 | 137,187 | 69% | 179,100 | 248,000 | 5.8 | 6.0 | |||||||||||||||||||||||||||||||||||||||||||||||||||||||||||||||||||||||||||||||||||||
| 5505 Morehouse Drive/San Diego/Sorrento Mesa | N/A | 100% | 28,324 | — | 51,621 | — | — | 79,945 | 100% | 79,945 | 68,000 | 7.1 | 7.2 | |||||||||||||||||||||||||||||||||||||||||||||||||||||||||||||||||||||||||||||||||||||
| 9601 and 9603 Medical Center Drive/Maryland/Rockville | 11/17/22 | 100% | 17,378 | — | — | — | 17,211 | 34,589 | 100% | 95,911 | 54,000 | 8.4 | 7.1 | |||||||||||||||||||||||||||||||||||||||||||||||||||||||||||||||||||||||||||||||||||||
| 20400 Century Boulevard/Maryland/Gaithersburg | 10/17/22 | 100% | — | 32,033 | 4,194 | 6,465 | 8,046 | 50,738 | 100% | 80,550 | 35,000 | 8.5 | 8.6 | |||||||||||||||||||||||||||||||||||||||||||||||||||||||||||||||||||||||||||||||||||||
| 2400 Ellis Road, 40 and 41 Moore Drive, and 14 TW Alexander Drive/Research Triangle/Research Triangle | N/A | 100% | 326,445 | — | — | — | — | 326,445 | 100% | 703,316 | 337,000 | 7.5 | 6.7 | |||||||||||||||||||||||||||||||||||||||||||||||||||||||||||||||||||||||||||||||||||||
| Weighted average/total | 11/18/22 | 1,688,648 | 566,665 | 375,394 | 332,961 | 497,755 | 3,461,423 | 4,626,371 | $ | 4,315,000 | 6.8 | % | 6.3 | % | ||||||||||||||||||||||||||||||||||||||||||||||||||||||||||||||||||||||||||||||||||||
| New Class A Development and Redevelopment Properties: Current Projects | | ||||
December 31, 2022 | |||||
| 325 Binney Street | One Rogers Street | 99 Coolidge Avenue | 500 North Beacon Street and 4 Kingsbury Avenue(1) | 201 Brookline Avenue | ||||||||||||||||||||||
| Greater Boston/ Cambridge/Inner Suburbs | Greater Boston/ Cambridge/Inner Suburbs | Greater Boston/ Cambridge/Inner Suburbs | Greater Boston/ Cambridge/Inner Suburbs | Greater Boston/Fenway | ||||||||||||||||||||||
| 462,100 RSF | 403,892 RSF | 320,809 RSF | 248,018 RSF | 170,043 RSF | ||||||||||||||||||||||
| 100% Leased | 100% Leased | 36% Leased/Negotiating | 85% Leased/Negotiating | 98% Leased/Negotiating | ||||||||||||||||||||||
 |  |  | 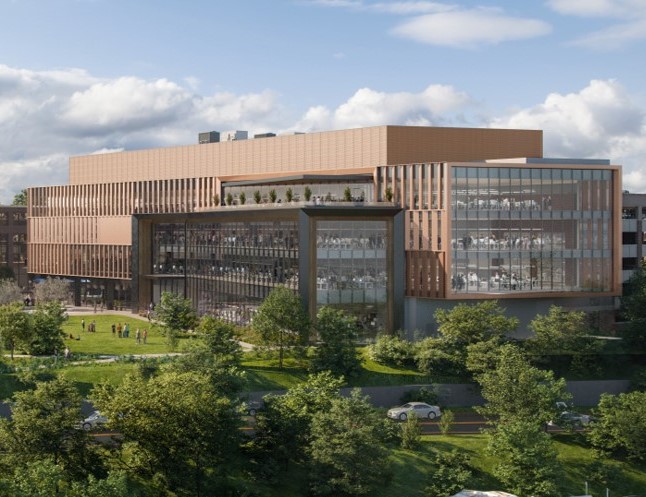 | | ||||||||||||||||||||||
| 15 Necco Street | 40, 50, and 60 Sylvan Road(2) | 1450 Owens Street | 651 Gateway Boulevard | 751 Gateway Boulevard | ||||||||||||||||||||||
| Greater Boston/ Seaport Innovation District | Greater Boston/Route 128 | San Francisco Bay Area/ Mission Bay | San Francisco Bay Area/ South San Francisco | San Francisco Bay Area/ South San Francisco | ||||||||||||||||||||||
| 345,995 RSF | 202,428 RSF | 212,796 RSF | 300,010 RSF | 230,592 RSF | ||||||||||||||||||||||
| 97% Leased/Negotiating | 61% Leased/Negotiating | —% Leased/Negotiating | 7% Leased/Negotiating | 100% Leased | ||||||||||||||||||||||
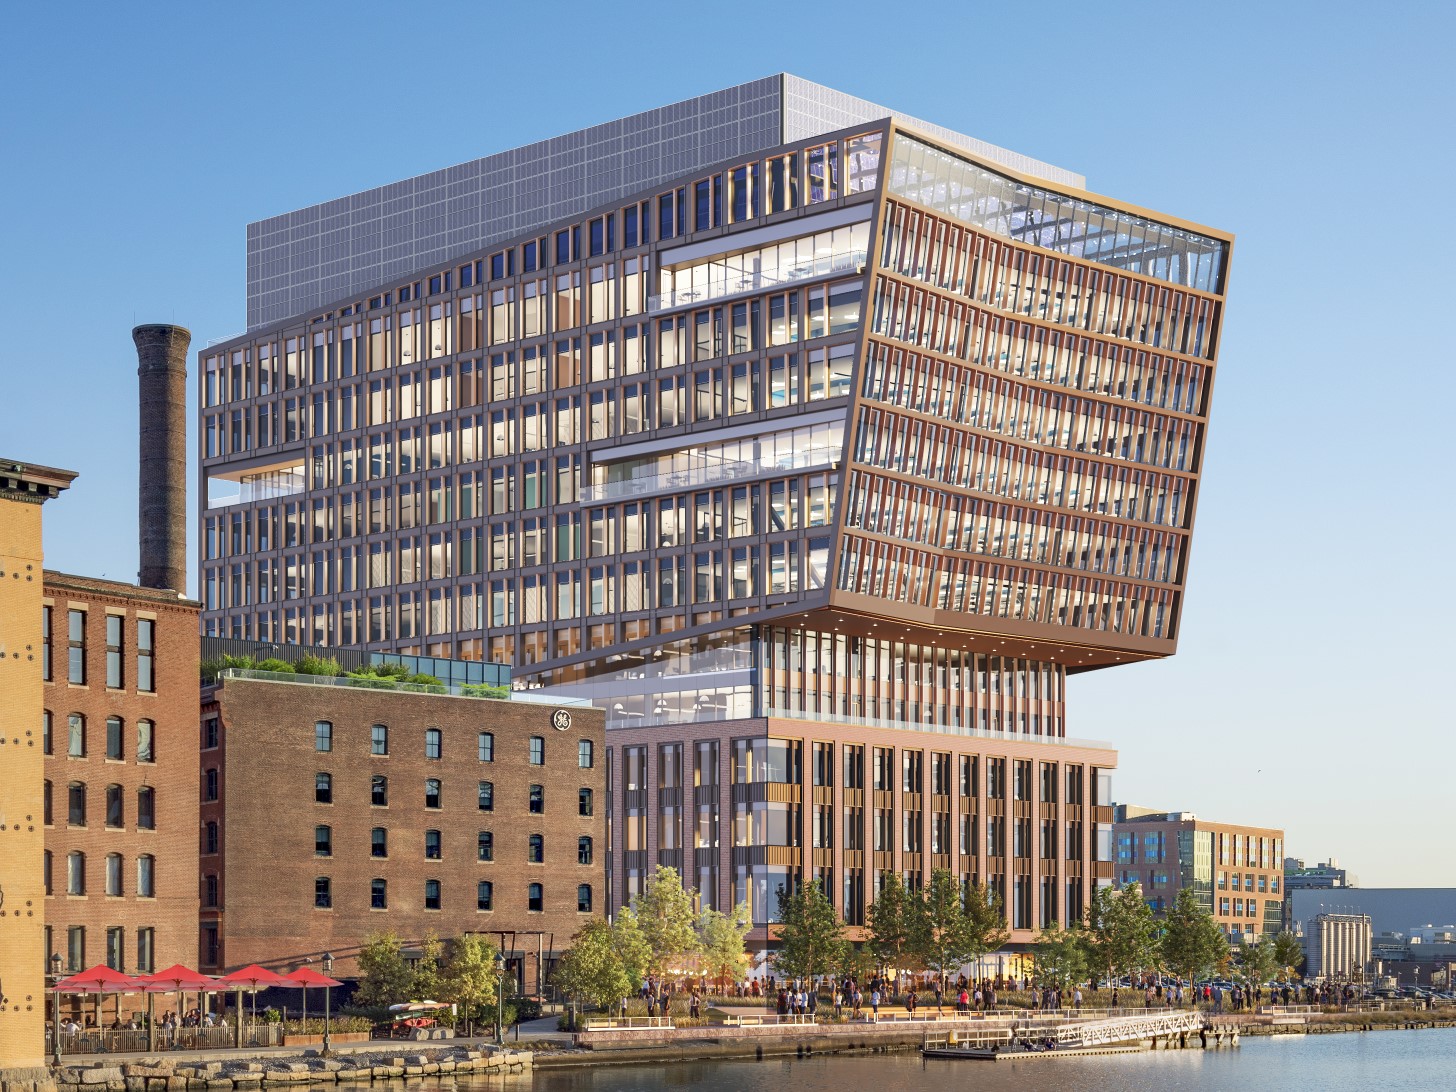 | 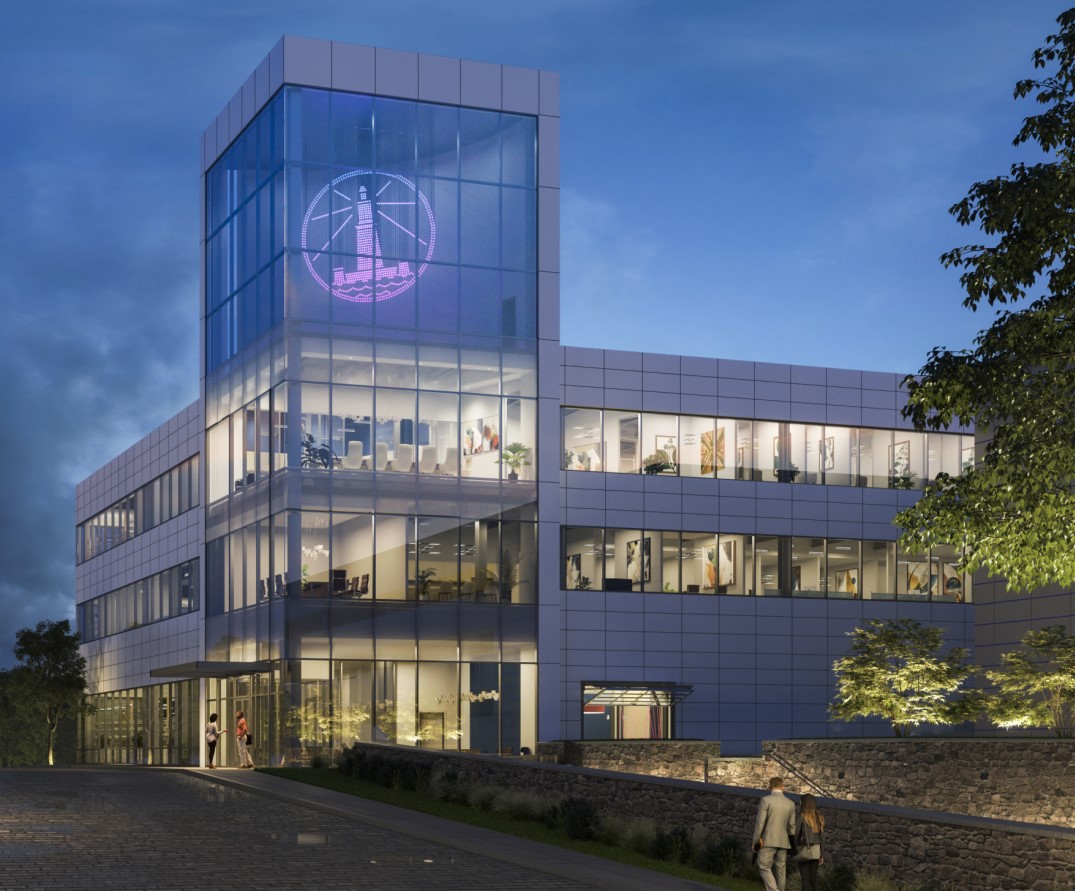 | 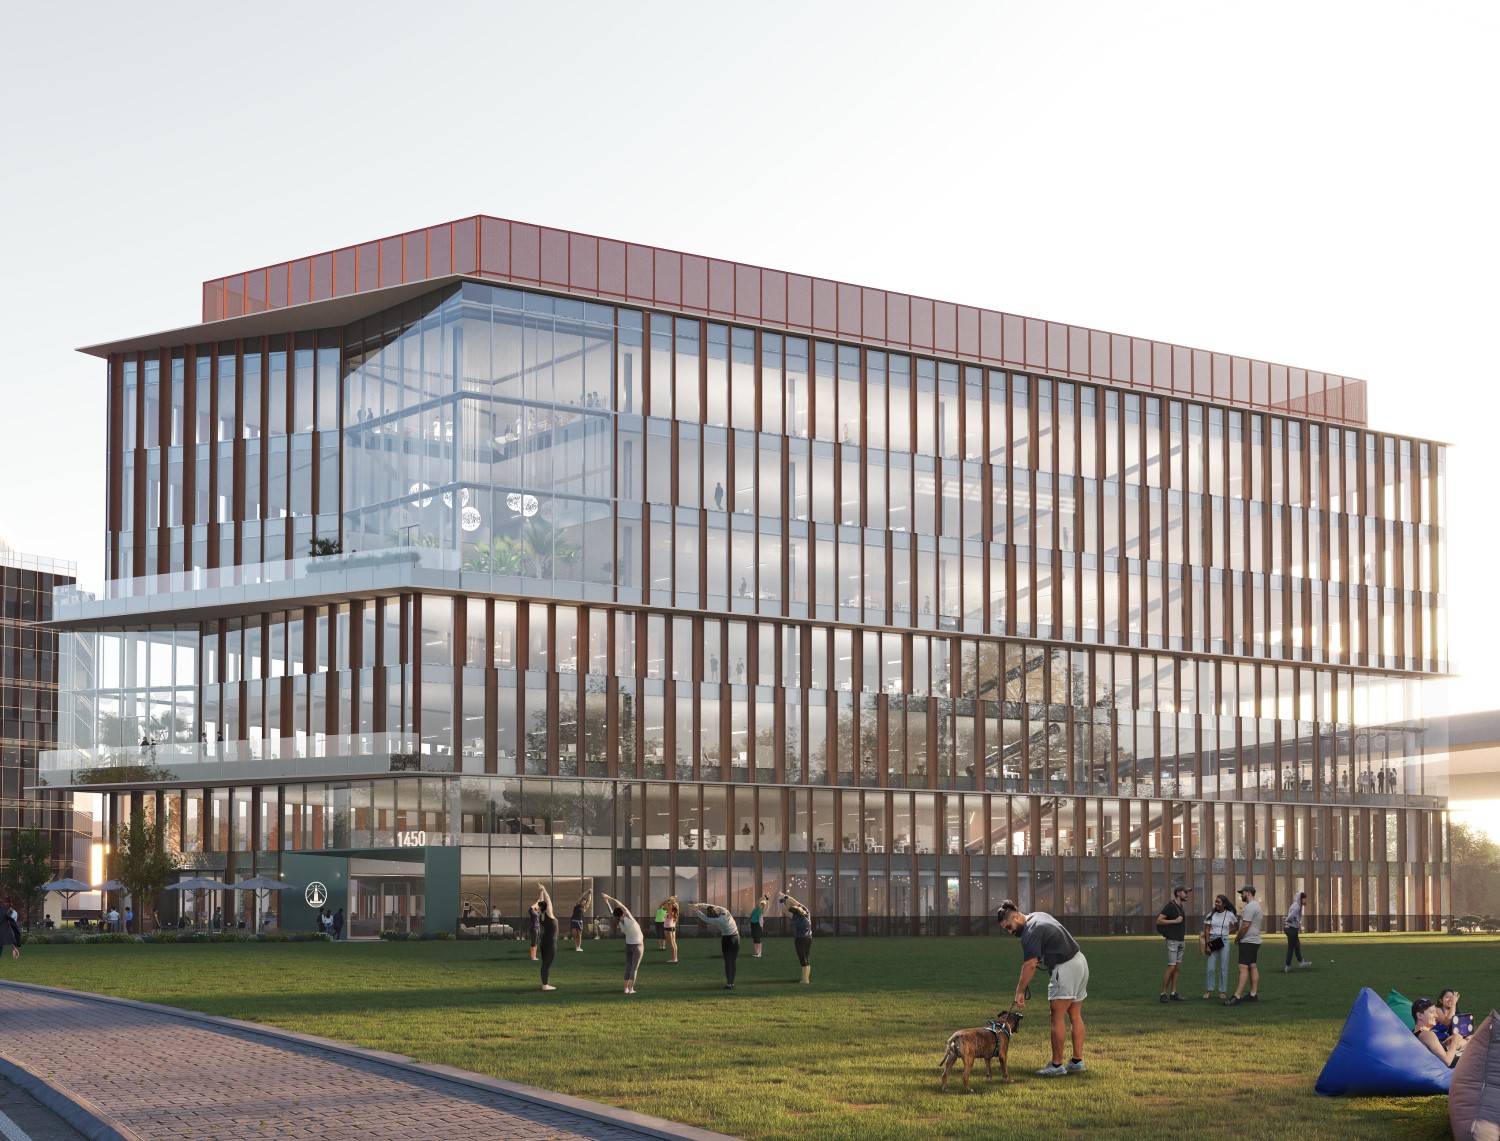 | 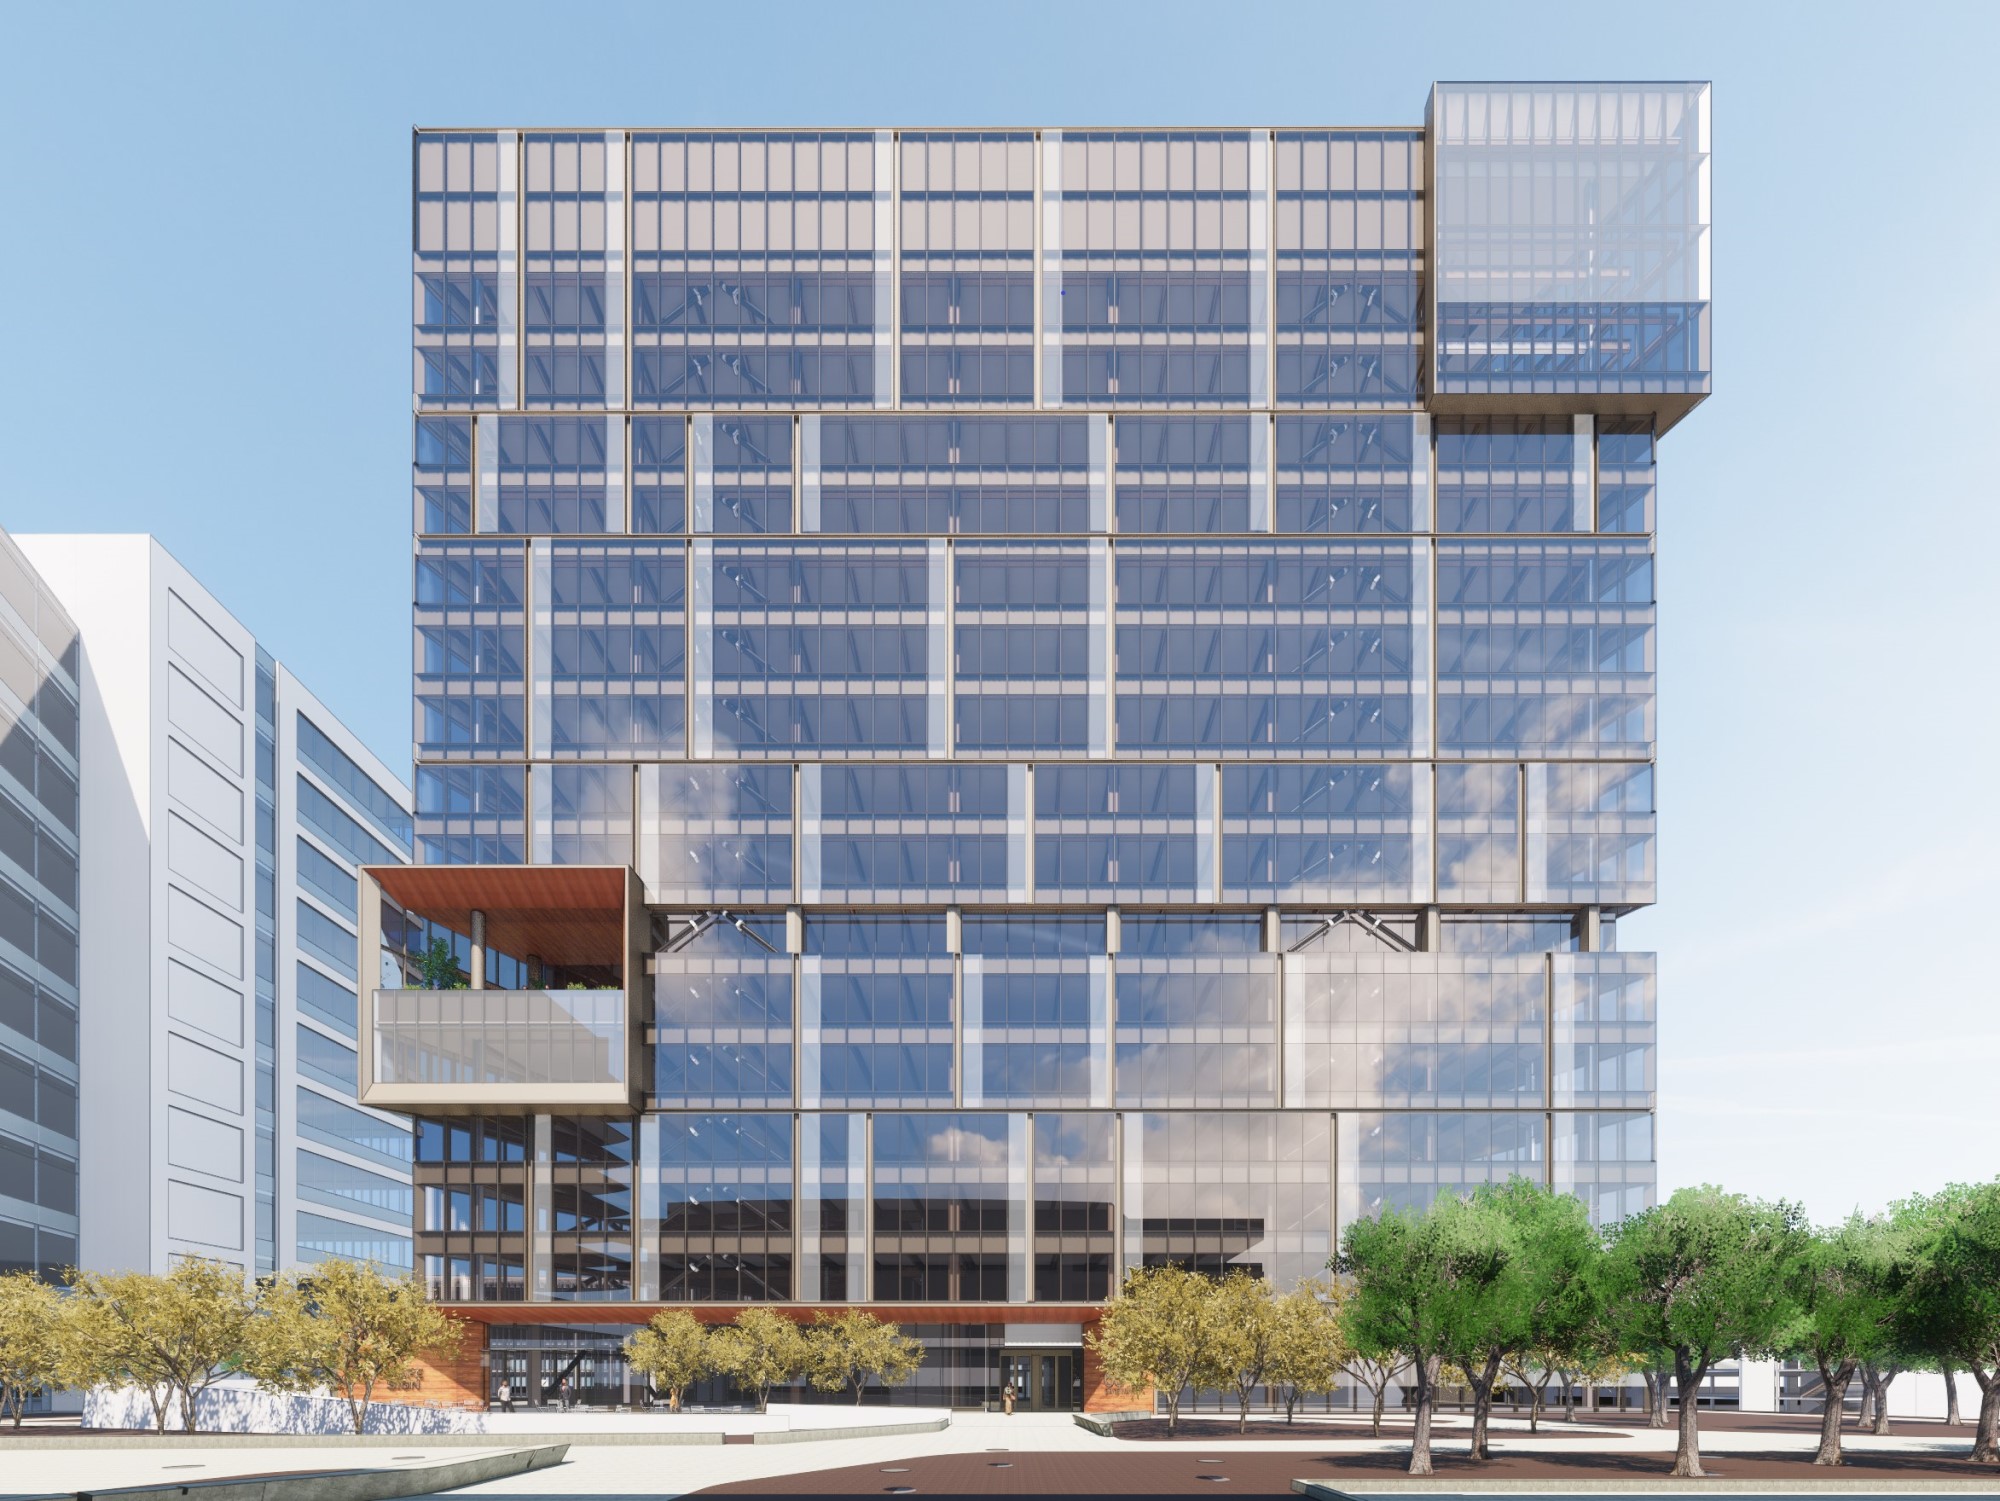 | 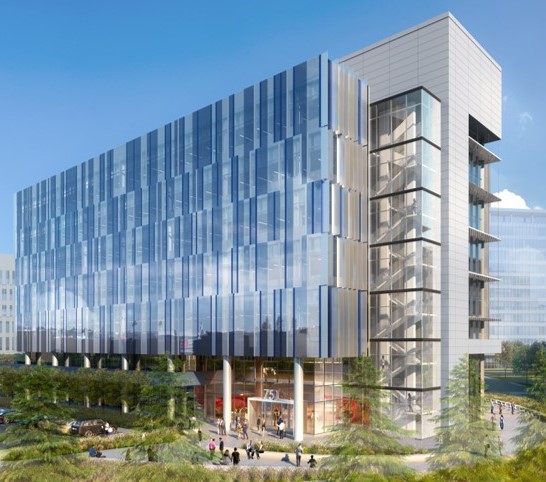 | ||||||||||||||||||||||
| New Class A Development and Redevelopment Properties: Current Projects (continued) | | ||||
December 31, 2022 | |||||
| 10075 Barnes Canyon Road | 1150 Eastlake Avenue East | 9810 Darnestown Road | 9808 Medical Center Drive | ||||||||||||||||||||
| San Diego/Sorrento Mesa | Seattle/Lake Union | Maryland/Rockville | Maryland/Rockville | ||||||||||||||||||||
| 254,771 RSF | 311,631 RSF | 192,000 RSF | 90,000 RSF | ||||||||||||||||||||
| —% Leased/Negotiating | 89% Leased/Negotiating | 100% Leased | 73% Leased/Negotiating | ||||||||||||||||||||
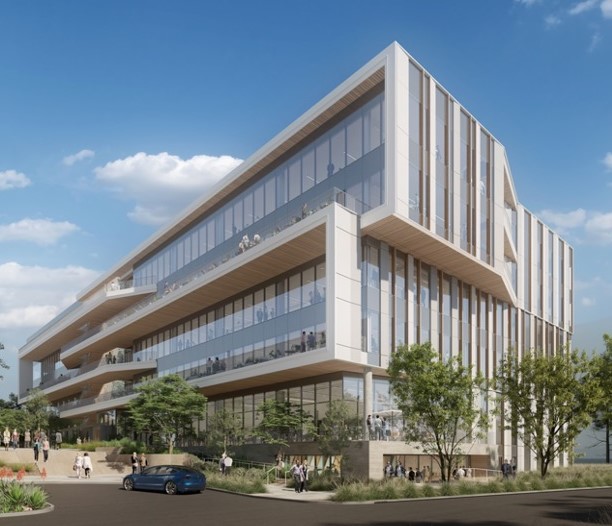 | 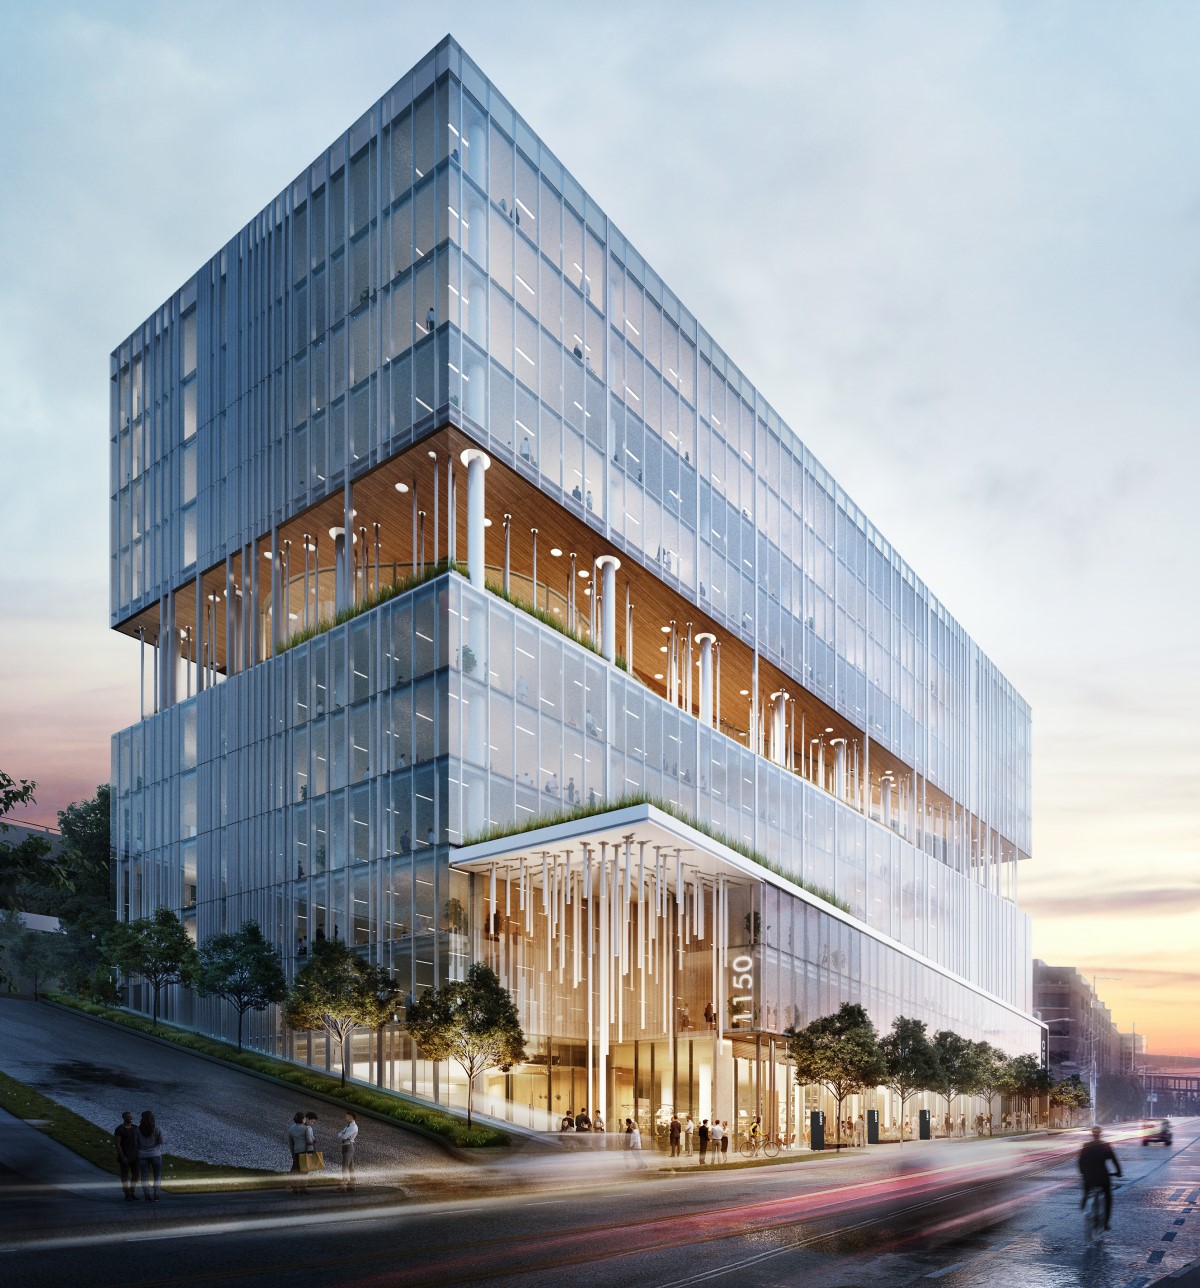 |  |  | ||||||||||||||||||||
| 9601 and 9603 Medical Center Drive | 2400 Ellis Road, 40 and 41 Moore Drive, and 14 TW Alexander Drive(1) | 4 Davis Drive | 6040 George Watts Hill Drive, Phase II | |||||||||||||||||
| Maryland/Rockville | Research Triangle/Research Triangle | Research Triangle/Research Triangle | Research Triangle/Research Triangle | |||||||||||||||||
| 61,322 RSF | 376,871 RSF | 180,000 RSF | 88,038 RSF | |||||||||||||||||
| 100% Leased | 86% Leased/Negotiating | 6% Leased/Negotiating | 100% Leased | |||||||||||||||||
|  |  |  | |||||||||||||||||
| New Class A Development and Redevelopment Properties: Current Projects (continued) | | ||||
December 31, 2022 | |||||
Market Property/Submarket | Square Footage | Percentage | Occupancy(1) | |||||||||||||||||||||||||||||||||||||||||||||||||||||||||||
| Dev/Redev | In Service | CIP | Total | Leased | Leased/Negotiating | Initial | Stabilized | |||||||||||||||||||||||||||||||||||||||||||||||||||||||
| Under construction | ||||||||||||||||||||||||||||||||||||||||||||||||||||||||||||||
| Greater Boston | ||||||||||||||||||||||||||||||||||||||||||||||||||||||||||||||
| 325 Binney Street/Cambridge/Inner Suburbs | Dev | — | 462,100 | 462,100 | 100 | % | 100 | % | 2023 | 2024 | ||||||||||||||||||||||||||||||||||||||||||||||||||||
| One Rogers Street/Cambridge/Inner Suburbs | Redev | 4,367 | 403,892 | 408,259 | 100 | 100 | 2023 | 2023 | ||||||||||||||||||||||||||||||||||||||||||||||||||||||
| 99 Coolidge Avenue/Cambridge/Inner Suburbs | Dev | — | 320,809 | 320,809 | 36 | 36 | 2024 | 2025 | ||||||||||||||||||||||||||||||||||||||||||||||||||||||
| 500 North Beacon Street and 4 Kingsbury Avenue/Cambridge/Inner Suburbs | Dev | — | 248,018 | 248,018 | 85 | 85 | 2024 | 2025 | ||||||||||||||||||||||||||||||||||||||||||||||||||||||
| 201 Brookline Avenue/Fenway | Dev | 340,073 | 170,043 | 510,116 | 97 | 98 | 3Q22 | 2023 | ||||||||||||||||||||||||||||||||||||||||||||||||||||||
| 15 Necco Street/Seaport Innovation District | Dev | — | 345,995 | 345,995 | 97 | 97 | 2024 | 2024 | ||||||||||||||||||||||||||||||||||||||||||||||||||||||
| 40, 50, and 60 Sylvan Road/Route 128 | Redev | 312,845 | 202,428 | 515,273 | 61 | 61 | 2023 | 2024 | ||||||||||||||||||||||||||||||||||||||||||||||||||||||
| 840 Winter Street/Route 128 | Redev | 28,230 | 139,984 | 168,214 | 100 | 100 | 2024 | 2024 | ||||||||||||||||||||||||||||||||||||||||||||||||||||||
| Other | Redev | — | 453,869 | 453,869 | — | — | (2) | 2023 | 2025 | |||||||||||||||||||||||||||||||||||||||||||||||||||||
| San Francisco Bay Area | ||||||||||||||||||||||||||||||||||||||||||||||||||||||||||||||
| 1450 Owens Street/Mission Bay | Dev | — | 212,796 | 212,796 | — | — | (2) | 2024 | 2025 | |||||||||||||||||||||||||||||||||||||||||||||||||||||
| 651 Gateway Boulevard/South San Francisco | Redev | — | 300,010 | 300,010 | 7 | 7 | (2) | 2023 | 2025 | |||||||||||||||||||||||||||||||||||||||||||||||||||||
| 751 Gateway Boulevard/South San Francisco | Dev | — | 230,592 | 230,592 | 100 | 100 | 2023 | 2023 | ||||||||||||||||||||||||||||||||||||||||||||||||||||||
| San Diego | ||||||||||||||||||||||||||||||||||||||||||||||||||||||||||||||
| 10075 Barnes Canyon Road/Sorrento Mesa | Dev | — | 254,771 | 254,771 | — | — | (2) | 2024 | 2025 | |||||||||||||||||||||||||||||||||||||||||||||||||||||
| Seattle | ||||||||||||||||||||||||||||||||||||||||||||||||||||||||||||||
| 1150 Eastlake Avenue East/Lake Union | Dev | — | 311,631 | 311,631 | 89 | 89 | 2023 | 2024 | ||||||||||||||||||||||||||||||||||||||||||||||||||||||
Alexandria Center® for Advanced Technologies – Monte Villa Parkway/Bothell | Redev | 246,647 | 213,976 | 460,623 | 84 | 84 | 2023 | 2024 | ||||||||||||||||||||||||||||||||||||||||||||||||||||||
| Maryland | ||||||||||||||||||||||||||||||||||||||||||||||||||||||||||||||
| 9810 Darnestown Road/Rockville | Dev | — | 192,000 | 192,000 | 100 | 100 | 2024 | 2024 | ||||||||||||||||||||||||||||||||||||||||||||||||||||||
| 9808 Medical Center Drive/Rockville | Dev | — | 90,000 | 90,000 | 29 | 73 | 2023 | 2024 | ||||||||||||||||||||||||||||||||||||||||||||||||||||||
| 9601 and 9603 Medical Center Drive/Rockville | Redev | 34,589 | 61,322 | 95,911 | 100 | 100 | 4Q21 | 2023 | ||||||||||||||||||||||||||||||||||||||||||||||||||||||
| 20400 Century Boulevard/Gaithersburg | Redev | 50,738 | 29,812 | 80,550 | 100 | 100 | 1Q22 | 2023 | ||||||||||||||||||||||||||||||||||||||||||||||||||||||
| Research Triangle | ||||||||||||||||||||||||||||||||||||||||||||||||||||||||||||||
2400 Ellis Road, 40 and 41 Moore Drive, and 14 TW Alexander Drive/ Research Triangle | Redev | 326,445 | 376,871 | 703,316 | 86 | 86 | 2Q21 | 2024 | ||||||||||||||||||||||||||||||||||||||||||||||||||||||
| 4 Davis Drive/Research Triangle | Dev | — | 180,000 | 180,000 | — | 6 | (2) | 2023 | 2024 | |||||||||||||||||||||||||||||||||||||||||||||||||||||
| 6040 George Watts Hill Drive, Phase II/Research Triangle | Dev | — | 88,038 | 88,038 | 100 | 100 | 2024 | 2024 | ||||||||||||||||||||||||||||||||||||||||||||||||||||||
| Texas | ||||||||||||||||||||||||||||||||||||||||||||||||||||||||||||||
| 8800 Technology Forest Place/Greater Houston | Redev | — | 201,499 | 201,499 | 23 | 23 | 2023 | 2024 | ||||||||||||||||||||||||||||||||||||||||||||||||||||||
| Canada | ||||||||||||||||||||||||||||||||||||||||||||||||||||||||||||||
| Canada | Redev | 22,992 | 107,081 | 130,073 | 71 | 81 | 2023 | 2024 | ||||||||||||||||||||||||||||||||||||||||||||||||||||||
| 1,366,926 | 5,597,537 | 6,964,463 | 67 | % | 68 | % | ||||||||||||||||||||||||||||||||||||||||||||||||||||||||
(1)Initial occupancy dates are subject to leasing and/or market conditions. Multi-tenant projects may have occupancy by tenants over a period of time. Stabilized occupancy may vary depending on single tenancy versus multi-tenancy. (2)This project is focused on demand from our existing tenants in our adjacent properties/campuses and will also address demand from other non-Alexandria properties/campuses. | ||||||||||||||||||||||||||||||||||||||||||||||||||||||||||||||
| New Class A Development and Redevelopment Properties: Current Projects (continued) | |||||
| |||||
December 31, 2022 | |||||
Market Property/Submarket | Square Footage | Percentage | ||||||||||||||||||||||||||||||||||||||||||||||||||||||||||||
| Dev/Redev | In Service | CIP | Total | Leased | Leased/Negotiating | |||||||||||||||||||||||||||||||||||||||||||||||||||||||||
Near-term projects expected to commence construction in the next four quarters | ||||||||||||||||||||||||||||||||||||||||||||||||||||||||||||||
| San Francisco Bay Area | ||||||||||||||||||||||||||||||||||||||||||||||||||||||||||||||
| 230 Harriet Tubman Way/South San Francisco | Dev | — | 285,346 | 285,346 | 100 | % | 100 | % | ||||||||||||||||||||||||||||||||||||||||||||||||||||||
| San Diego | ||||||||||||||||||||||||||||||||||||||||||||||||||||||||||||||
| 11255 and 11355 North Torrey Pines Road/Torrey Pines | Dev | — | 309,094 | 309,094 | 100 | 100 | ||||||||||||||||||||||||||||||||||||||||||||||||||||||||
| 10931 and 10933 North Torrey Pines Road/Torrey Pines | Dev | — | 299,158 | 299,158 | 100 | 100 | ||||||||||||||||||||||||||||||||||||||||||||||||||||||||
| Campus Point by Alexandria, Phase II/University Town Center | Dev | — | 426,927 | 426,927 | 100 | 100 | ||||||||||||||||||||||||||||||||||||||||||||||||||||||||
| Campus Point by Alexandria, Phase I/University Town Center | Dev | — | 171,102 | 171,102 | 100 | 100 | ||||||||||||||||||||||||||||||||||||||||||||||||||||||||
| Seattle | ||||||||||||||||||||||||||||||||||||||||||||||||||||||||||||||
| 701 Dexter Avenue North/Lake Union | Dev | — | 226,586 | 226,586 | — | — | (1) | |||||||||||||||||||||||||||||||||||||||||||||||||||||||
| Maryland | ||||||||||||||||||||||||||||||||||||||||||||||||||||||||||||||
| 9820 Darnestown Road/Rockville | Dev | — | 250,000 | 250,000 | 100 | 100 | ||||||||||||||||||||||||||||||||||||||||||||||||||||||||
| — | 1,968,213 | 1,968,213 | 88 | 88 | ||||||||||||||||||||||||||||||||||||||||||||||||||||||||||
| Total | 1,366,926 | 7,565,750 | 8,932,676 | 72 | % | 72 | % | |||||||||||||||||||||||||||||||||||||||||||||||||||||||
(1)This project was initiated due to demand from neighboring tenants. | ||||||||||||||||||||||||||||||||||||||||||||||||||||||||||||||
| New Class A Development and Redevelopment Properties: Current Projects (continued) | | ||||
December 31, 2022 | |||||
| (Dollars in thousands) | |||||
| Our Ownership Interest | At 100% | Unlevered Yields | |||||||||||||||||||||||||||||||||||||||||||||||||||||||||
Market Property/Submarket | In Service | CIP | Cost to Complete | Total at Completion | Initial Stabilized | Initial Stabilized (Cash Basis) | |||||||||||||||||||||||||||||||||||||||||||||||||||||
| Under construction | |||||||||||||||||||||||||||||||||||||||||||||||||||||||||||
| Greater Boston | |||||||||||||||||||||||||||||||||||||||||||||||||||||||||||
| 325 Binney Street/Cambridge/Inner Suburbs | 100 | % | $ | — | $ | 477,206 | $ | 413,794 | $ | 891,000 | 8.5 | % | 7.2 | % | |||||||||||||||||||||||||||||||||||||||||||||
| One Rogers Street/Cambridge/Inner Suburbs | 100 | % | 10,814 | 1,040,421 | 154,765 | 1,206,000 | 5.2 | % | 4.2 | % | |||||||||||||||||||||||||||||||||||||||||||||||||
| 99 Coolidge Avenue/Cambridge/Inner Suburbs | 75.0 | % | — | 174,817 | TBD | ||||||||||||||||||||||||||||||||||||||||||||||||||||||
| 500 North Beacon Street and 4 Kingsbury Avenue/Cambridge/Inner Suburbs | 100 | % | — | 156,299 | 270,701 | 427,000 | 6.2 | % | 5.5 | % | |||||||||||||||||||||||||||||||||||||||||||||||||
| 201 Brookline Avenue/Fenway | 98.8 | % | 482,455 | 208,188 | 43,357 | 734,000 | 7.2 | % | 6.2 | % | |||||||||||||||||||||||||||||||||||||||||||||||||
| 15 Necco Street/Seaport Innovation District | 90.0 | % | — | 339,207 | 227,793 | 567,000 | 6.7 | % | 5.5 | % | |||||||||||||||||||||||||||||||||||||||||||||||||
| 40, 50, and 60 Sylvan Road/Route 128 | 100 | % | 173,686 | 151,887 | TBD | ||||||||||||||||||||||||||||||||||||||||||||||||||||||
| 840 Winter Street/Route 128 | 100 | % | 13,642 | 99,117 | 95,241 | 208,000 | 7.5 | % | 6.5 | % | |||||||||||||||||||||||||||||||||||||||||||||||||
| Other | 100 | % | — | 128,736 | TBD | ||||||||||||||||||||||||||||||||||||||||||||||||||||||
| San Francisco Bay Area | |||||||||||||||||||||||||||||||||||||||||||||||||||||||||||
| 1450 Owens Street/Mission Bay | 59.7 | % | — | 122,012 | TBD | ||||||||||||||||||||||||||||||||||||||||||||||||||||||
| 651 Gateway Boulevard/South San Francisco | 50.0 | % | — | 182,941 | |||||||||||||||||||||||||||||||||||||||||||||||||||||||
| 751 Gateway Boulevard/South San Francisco | 51.0 | % | — | 171,315 | 118,685 | 290,000 | 6.5 | % | 6.3 | % | |||||||||||||||||||||||||||||||||||||||||||||||||
| San Diego | |||||||||||||||||||||||||||||||||||||||||||||||||||||||||||
| 10075 Barnes Canyon Road/Sorrento Mesa | 50.0 | % | — | 51,389 | TBD | ||||||||||||||||||||||||||||||||||||||||||||||||||||||
| Seattle | |||||||||||||||||||||||||||||||||||||||||||||||||||||||||||
| 1150 Eastlake Avenue East/Lake Union | 100 | % | — | 213,339 | 191,661 | 405,000 | 6.4 | % | 6.2 | % | |||||||||||||||||||||||||||||||||||||||||||||||||
Alexandria Center® for Advanced Technologies – Monte Villa Parkway/Bothell | 100 | % | 59,309 | 99,001 | 70,690 | 229,000 | 6.3 | % | 6.2 | % | |||||||||||||||||||||||||||||||||||||||||||||||||
| Maryland | |||||||||||||||||||||||||||||||||||||||||||||||||||||||||||
| 9810 Darnestown Road/Rockville | 100 | % | — | 78,508 | 54,492 | 133,000 | 6.9 | % | 6.2 | % | |||||||||||||||||||||||||||||||||||||||||||||||||
| 9808 Medical Center Drive/Rockville | 100 | % | — | 51,050 | TBD | ||||||||||||||||||||||||||||||||||||||||||||||||||||||
| 9601 and 9603 Medical Center Drive/Rockville | 100 | % | 18,187 | 30,907 | 4,906 | 54,000 | 8.4 | % | 7.1 | % | |||||||||||||||||||||||||||||||||||||||||||||||||
| 20400 Century Boulevard/Gaithersburg | 100 | % | 21,185 | 7,584 | 6,231 | 35,000 | 8.5 | % | 8.6 | % | |||||||||||||||||||||||||||||||||||||||||||||||||
| Research Triangle | |||||||||||||||||||||||||||||||||||||||||||||||||||||||||||
| 2400 Ellis Road, 40 and 41 Moore Drive, and 14 TW Alexander Drive/Research Triangle | 100 | % | 93,858 | 121,944 | 121,198 | 337,000 | 7.5 | % | 6.7 | % | |||||||||||||||||||||||||||||||||||||||||||||||||
| 4 Davis Drive/Research Triangle | 100 | % | — | 38,090 | TBD | ||||||||||||||||||||||||||||||||||||||||||||||||||||||
| 6040 George Watts Hill Drive, Phase II/Research Triangle | 100 | % | — | 20,583 | 43,417 | 64,000 | 8.0 | % | 7.0 | % | |||||||||||||||||||||||||||||||||||||||||||||||||
| Texas | |||||||||||||||||||||||||||||||||||||||||||||||||||||||||||
| 8800 Technology Forest Place/Greater Houston | 100 | % | — | 73,436 | TBD | ||||||||||||||||||||||||||||||||||||||||||||||||||||||
| Canada | |||||||||||||||||||||||||||||||||||||||||||||||||||||||||||
| Canada | 100 | % | 3,154 | 17,376 | TBD | ||||||||||||||||||||||||||||||||||||||||||||||||||||||
| $ | 876,290 | $ | 4,055,353 | $ | 3,690,000 | (1) | $ | 8,620,000 | (1) | ||||||||||||||||||||||||||||||||||||||||||||||||||
(1)Amounts rounded to the nearest $10 million and include preliminary estimated amounts for projects listed as TBD. | |||||||||||||||||||||||||||||||||||||||||||||||||||||||||||
| New Class A Development and Redevelopment Properties: Current Projects (continued) | |||||
| |||||
December 31, 2022 | |||||
| (Dollars in thousands) | |||||
| Our Ownership Interest | At 100% | ||||||||||||||||||||||||||||||||||||||||||||||||||||||||||
Market Property/Submarket | In Service | CIP | Cost to Complete | Total at Completion | |||||||||||||||||||||||||||||||||||||||||||||||||||||||
| Near-term projects expected to commence construction in the next four quarters | |||||||||||||||||||||||||||||||||||||||||||||||||||||||||||
| San Francisco Bay Area | TBD | ||||||||||||||||||||||||||||||||||||||||||||||||||||||||||
| 230 Harriet Tubman Way/South San Francisco | 45.3 | % | $ | — | $ | 110,278 | |||||||||||||||||||||||||||||||||||||||||||||||||||||
| San Diego | |||||||||||||||||||||||||||||||||||||||||||||||||||||||||||
| 11255 and 11355 North Torrey Pines Road/Torrey Pines | 100 | % | — | 126,748 | |||||||||||||||||||||||||||||||||||||||||||||||||||||||
| 10931 and 10933 North Torrey Pines Road/Torrey Pines | 100 | % | — | 83,241 | |||||||||||||||||||||||||||||||||||||||||||||||||||||||
| Campus Point by Alexandria, Phase II/University Town Center | 55.0 | % | — | 53,495 | |||||||||||||||||||||||||||||||||||||||||||||||||||||||
| Campus Point by Alexandria, Phase I/University Town Center | 55.0 | % | — | 46,821 | |||||||||||||||||||||||||||||||||||||||||||||||||||||||
| Seattle | |||||||||||||||||||||||||||||||||||||||||||||||||||||||||||
| 701 Dexter Avenue North/Lake Union | 100 | % | — | 124,303 | |||||||||||||||||||||||||||||||||||||||||||||||||||||||
| Maryland | |||||||||||||||||||||||||||||||||||||||||||||||||||||||||||
| 9820 Darnestown Road/Rockville | 100 | % | — | 38,952 | |||||||||||||||||||||||||||||||||||||||||||||||||||||||
| — | 583,838 | 1,830,000 | (1) | 2,420,000 | (1) | ||||||||||||||||||||||||||||||||||||||||||||||||||||||
| Total | $ | 876,290 | $ | 4,639,191 | $ | 5,520,000 | (1) | $ | 11,040,000 | (1) | |||||||||||||||||||||||||||||||||||||||||||||||||
Our share of investment(2) | $ | 4,660,000 | (1) | $ | 9,730,000 | (1) | |||||||||||||||||||||||||||||||||||||||||||||||||||||
| New Class A Development and Redevelopment Properties: Summary of Pipeline | | ||||
December 31, 2022 | |||||
| (Dollars in thousands) | |||||
Market Property/Submarket | Our Ownership Interest | Book Value | Square Footage | |||||||||||||||||||||||||||||||||||||||||||||||
| Development and Redevelopment | ||||||||||||||||||||||||||||||||||||||||||||||||||
| Under Construction | Near Term | Intermediate Term | Future | Total(1) | ||||||||||||||||||||||||||||||||||||||||||||||
| Greater Boston | ||||||||||||||||||||||||||||||||||||||||||||||||||
Mega Campus: Alexandria Center® at One Kendall Square/Cambridge/ Inner Suburbs | 100 | % | $ | 477,206 | 462,100 | — | — | — | 462,100 | |||||||||||||||||||||||||||||||||||||||||
| 325 Binney Street | ||||||||||||||||||||||||||||||||||||||||||||||||||
Mega Campus: Alexandria Center® at Kendall Square/Cambridge/ Inner Suburbs | 100 | % | 1,097,991 | 403,892 | 104,500 | — | 41,955 | 550,347 | ||||||||||||||||||||||||||||||||||||||||||
| One Rogers Street and 100 Edwin H. Land Boulevard | ||||||||||||||||||||||||||||||||||||||||||||||||||
| 99 Coolidge Avenue/Cambridge/Inner Suburbs | 75.0 | % | 174,817 | 320,809 | — | — | — | 320,809 | ||||||||||||||||||||||||||||||||||||||||||
| Mega Campus: The Arsenal on the Charles/Cambridge/Inner Suburbs | 100 | % | 167,226 | 248,018 | — | — | 342,603 | 590,621 | ||||||||||||||||||||||||||||||||||||||||||
| 311 Arsenal Street, 500 North Beacon Street, and 4 Kingsbury Avenue | ||||||||||||||||||||||||||||||||||||||||||||||||||
Mega Campus: Alexandria Center® for Life Science – Fenway/Fenway | (2) | 524,791 | 170,043 | 507,997 | — | — | 678,040 | |||||||||||||||||||||||||||||||||||||||||||
| 201 Brookline Avenue and 421 Park Drive | ||||||||||||||||||||||||||||||||||||||||||||||||||
| 15 Necco Street/Seaport Innovation District | 90.0 | % | 339,207 | 345,995 | — | — | — | 345,995 | ||||||||||||||||||||||||||||||||||||||||||
| Mega Campus: 40, 50, and 60 Sylvan Road, 35 Gatehouse Drive, and 840 Winter Street/Route 128 | 100 | % | 308,205 | 342,412 | 341,075 | — | 515,000 | 1,198,487 | ||||||||||||||||||||||||||||||||||||||||||
| 275 Grove Street/Route 128 | 100 | % | — | — | 160,251 | — | — | 160,251 | ||||||||||||||||||||||||||||||||||||||||||
| 10 Necco Street/Seaport Innovation District | 100 | % | 98,667 | — | — | 175,000 | — | 175,000 | ||||||||||||||||||||||||||||||||||||||||||
| 215 Presidential Way/Route 128 | 100 | % | 6,808 | — | — | 112,000 | — | 112,000 | ||||||||||||||||||||||||||||||||||||||||||
| Mega Campus: 480 Arsenal Way and 446, 458, 500, and 550 Arsenal Street/Cambridge/Inner Suburbs | 100 | % | 77,582 | — | — | — | 902,000 | 902,000 | ||||||||||||||||||||||||||||||||||||||||||
| 446, 458, and 550 Arsenal Street | ||||||||||||||||||||||||||||||||||||||||||||||||||
Mega Campus: Alexandria Technology Square®/Cambridge/Inner Suburbs | 100 | % | 7,881 | — | — | — | 100,000 | 100,000 | ||||||||||||||||||||||||||||||||||||||||||
| Mega Campus: 380 and 420 E Street/Seaport Innovation District | 100 | % | 125,786 | — | — | — | 1,000,000 | 1,000,000 | ||||||||||||||||||||||||||||||||||||||||||
| 99 A Street/Seaport Innovation District | 100 | % | 49,800 | — | — | — | 235,000 | 235,000 | ||||||||||||||||||||||||||||||||||||||||||
| Mega Campus: One Moderna Way/Route 128 | 100 | % | 24,686 | — | — | — | 1,100,000 | 1,100,000 | ||||||||||||||||||||||||||||||||||||||||||
| Other value-creation projects | 100 | % | 202,708 | 453,869 | 260,992 | — | 449,549 | 1,164,410 | ||||||||||||||||||||||||||||||||||||||||||
| $ | 3,683,361 | 2,747,138 | 1,374,815 | 287,000 | 4,686,107 | 9,095,060 | ||||||||||||||||||||||||||||||||||||||||||||
Refer to “Mega campus” in the “Definitions and reconciliations” of this Supplemental Information for additional details. (1)Represents total square footage upon completion of development or redevelopment of one or more new Class A properties. Square footage presented includes RSF of buildings currently in operation at properties that also have inherent future development or redevelopment opportunities. Upon expiration of existing in-place leases, we have the intent to demolish or redevelop the existing property and commence future construction. Refer to “Definitions and reconciliations” of this Supplemental Information for additional details on value-creation square feet currently included in rental properties. (2)We have a 98.8% ownership interest in 201 Brookline Avenue aggregating 170,043 RSF, which is currently under construction, and a 100% ownership interest in the near-term development project at 421 Park Drive aggregating 507,997 SF. | ||||||||||||||||||||||||||||||||||||||||||||||||||
| New Class A Development and Redevelopment Properties: Summary of Pipeline (continued) | | ||||
December 31, 2022 | |||||
| (Dollars in thousands) | |||||
Market Property/Submarket | Our Ownership Interest | Book Value | Square Footage | |||||||||||||||||||||||||||||||||||||||||||||||
| Development and Redevelopment | ||||||||||||||||||||||||||||||||||||||||||||||||||
| Under Construction | Near Term | Intermediate Term | Future | Total(1) | ||||||||||||||||||||||||||||||||||||||||||||||
| San Francisco Bay Area | ||||||||||||||||||||||||||||||||||||||||||||||||||
Mega Campus: Alexandria Center® for Science and Technology – Mission Bay/Mission Bay | 59.7 | % | $ | 122,012 | 212,796 | — | — | — | 212,796 | |||||||||||||||||||||||||||||||||||||||||
| 1450 Owens Street | ||||||||||||||||||||||||||||||||||||||||||||||||||
Mega Campus: Alexandria Technology Center® – Gateway/ South San Francisco | (2) | 378,730 | 530,602 | — | — | 291,000 | 821,602 | |||||||||||||||||||||||||||||||||||||||||||
| 651 and 751 Gateway Boulevard | ||||||||||||||||||||||||||||||||||||||||||||||||||
Alexandria Center® for Life Science – Millbrae/South San Francisco | 45.3 | % | 252,173 | — | 633,747 | — | — | 633,747 | ||||||||||||||||||||||||||||||||||||||||||
| 230 Harriet Tubman Way, 201 and 231 Adrian Road, and 6 and 30 Rollins Road | ||||||||||||||||||||||||||||||||||||||||||||||||||
| 3825 and 3875 Fabian Way/Greater Stanford | 100 | % | 137,076 | — | — | 250,000 | 228,000 | 478,000 | ||||||||||||||||||||||||||||||||||||||||||
Mega Campus: Alexandria Center® for Life Science – San Carlos/Greater Stanford | 100 | % | 397,323 | — | 105,000 | 700,000 | 692,830 | 1,497,830 | ||||||||||||||||||||||||||||||||||||||||||
| 960 Industrial Road, 987 and 1075 Commercial Street, and 888 Bransten Road | ||||||||||||||||||||||||||||||||||||||||||||||||||
| 901 California Avenue/Greater Stanford | 100 | % | 11,698 | — | 56,924 | — | — | 56,924 | ||||||||||||||||||||||||||||||||||||||||||
| Mega Campus: 88 Bluxome Street/SoMa | 100 | % | 348,135 | — | 1,070,925 | — | — | 1,070,925 | ||||||||||||||||||||||||||||||||||||||||||
| Mega Campus: 1122, 1150, and 1178 El Camino Real/South San Francisco | 100 | % | 350,590 | — | — | — | 1,930,000 | 1,930,000 | ||||||||||||||||||||||||||||||||||||||||||
Mega Campus: 211(3), 213(3), 249, 259, 269, and 279 East Grand Avenue/ South San Francisco | 100 | % | 6,655 | — | — | — | 90,000 | 90,000 | ||||||||||||||||||||||||||||||||||||||||||
| 211 East Grand Avenue | ||||||||||||||||||||||||||||||||||||||||||||||||||
| Other value-creation projects | 100 | % | — | — | — | — | 25,000 | 25,000 | ||||||||||||||||||||||||||||||||||||||||||
| 2,004,392 | 743,398 | 1,866,596 | 950,000 | 3,256,830 | 6,816,824 | |||||||||||||||||||||||||||||||||||||||||||||
| New York City | ||||||||||||||||||||||||||||||||||||||||||||||||||
Mega Campus: Alexandria Center® for Life Science – New York City/ New York City | 100 | % | 133,505 | — | — | 550,000 | (4) | — | 550,000 | |||||||||||||||||||||||||||||||||||||||||
| 219 East 42nd Street/New York City | 100 | % | — | — | — | 579,947 | — | 579,947 | ||||||||||||||||||||||||||||||||||||||||||
| $ | 133,505 | — | — | 1,129,947 | — | 1,129,947 | ||||||||||||||||||||||||||||||||||||||||||||
Refer to “Mega campus” in the “Definitions and reconciliations” of this Supplemental Information for additional details. (1)Represents total square footage upon completion of development or redevelopment of one or more new Class A properties. Square footage presented includes RSF of buildings currently in operation at properties that also have inherent future development or redevelopment opportunities. Upon expiration of existing in-place leases, we have the intent to demolish or redevelop the existing property and commence future construction. Refer to “Definitions and reconciliations” of this Supplemental Information for additional details on value-creation square feet currently included in rental properties. (2)We own a 50.0% ownership interest in 651 Gateway Boulevard aggregating 300,010 RSF and a 51.0% ownership interest in 751 Gateway Boulevard aggregating 230,592 RSF. (3)We own a partial interest in this property through a real estate joint venture. Refer to “Joint venture financial information” of this Supplemental Information for additional details. (4)Pursuant to an option agreement, we are currently negotiating a long-term ground lease with the City of New York for the future site of a new building of approximately 550,000 SF. | ||||||||||||||||||||||||||||||||||||||||||||||||||
| New Class A Development and Redevelopment Properties: Summary of Pipeline (continued) | | ||||
December 31, 2022 | |||||
| (Dollars in thousands) | |||||
Market Property/Submarket | Our Ownership Interest | Book Value | Square Footage | |||||||||||||||||||||||||||||||||||||||||||||||
| Development and Redevelopment | ||||||||||||||||||||||||||||||||||||||||||||||||||
| Under Construction | Near Term | Intermediate Term | Future | Total(1) | ||||||||||||||||||||||||||||||||||||||||||||||
| San Diego | ||||||||||||||||||||||||||||||||||||||||||||||||||
| Mega Campus: SD Tech by Alexandria/Sorrento Mesa | 50.0 | % | $ | 116,330 | 254,771 | — | 160,000 | 333,845 | 748,616 | |||||||||||||||||||||||||||||||||||||||||
| 9805 Scranton Road and 10065 and 10075 Barnes Canyon Road | ||||||||||||||||||||||||||||||||||||||||||||||||||
| Mega Campus: One Alexandria Square and One Alexandria North/Torrey Pines | 100 | % | 262,456 | — | 608,252 | 125,280 | — | 733,532 | ||||||||||||||||||||||||||||||||||||||||||
| 10931, 10933, 11255, and 11355 North Torrey Pines Road and 10975 and 10995 Torreyana Road | ||||||||||||||||||||||||||||||||||||||||||||||||||
| Mega Campus: Campus Point by Alexandria/University Town Center | 55.0 | % | 259,044 | — | 598,029 | — | 1,074,445 | 1,672,474 | ||||||||||||||||||||||||||||||||||||||||||
10010(2), 10140(2), and 10260 Campus Point Drive and 4110, 4150, 4161, and 4275(2) Campus Point Court | ||||||||||||||||||||||||||||||||||||||||||||||||||
| Mega Campus: Sequence District by Alexandria/Sorrento Mesa | 100 | % | 43,100 | — | 200,000 | 509,000 | 1,089,915 | 1,798,915 | ||||||||||||||||||||||||||||||||||||||||||
| 6260, 6290, 6310, 6340, 6350, and 6450 Sequence Drive | ||||||||||||||||||||||||||||||||||||||||||||||||||
| Scripps Science Park by Alexandria/Sorrento Mesa | 100 | % | 69,978 | — | 105,000 | 175,041 | 164,000 | 444,041 | ||||||||||||||||||||||||||||||||||||||||||
| 10048 and 10219 Meanley Drive, and 10277 Scripps Ranch Boulevard | ||||||||||||||||||||||||||||||||||||||||||||||||||
| Mega Campus: University District/University Town Center | 100 | % | 143,990 | — | — | 937,000 | — | 937,000 | ||||||||||||||||||||||||||||||||||||||||||
| 9363, 9373, and 9393 Towne Centre Drive, 8410-8750 Genesee Avenue, and 4282 Esplanade Court | ||||||||||||||||||||||||||||||||||||||||||||||||||
| Pacific Technology Park/Sorrento Mesa | 50.0 | % | 21,981 | — | — | 149,000 | — | 149,000 | ||||||||||||||||||||||||||||||||||||||||||
| 9444 Waples Street | ||||||||||||||||||||||||||||||||||||||||||||||||||
| Mega Campus: 5200 Illumina Way/University Town Center | 51.0 | % | 16,652 | — | — | — | 451,832 | 451,832 | ||||||||||||||||||||||||||||||||||||||||||
| 4025, 4031, 4045, and 4075 Sorrento Valley Boulevard/Sorrento Valley | 100 | % | 21,282 | — | — | — | 247,000 | 247,000 | ||||||||||||||||||||||||||||||||||||||||||
| Other value-creation projects | 100 | % | 68,606 | — | — | — | 475,000 | 475,000 | ||||||||||||||||||||||||||||||||||||||||||
| 1,023,419 | 254,771 | 1,511,281 | 2,055,321 | 3,836,037 | 7,657,410 | |||||||||||||||||||||||||||||||||||||||||||||
| Seattle | ||||||||||||||||||||||||||||||||||||||||||||||||||
Mega Campus: The Eastlake Life Science Campus by Alexandria/ Lake Union | 100 | % | 213,339 | 311,631 | — | — | — | 311,631 | ||||||||||||||||||||||||||||||||||||||||||
| 1150 Eastlake Avenue East | ||||||||||||||||||||||||||||||||||||||||||||||||||
Alexandria Center® for Advanced Technologies – Monte Villa Parkway/Bothell | 100 | % | 99,001 | 213,976 | 50,552 | — | — | 264,528 | ||||||||||||||||||||||||||||||||||||||||||
| 3301, 3555, and 3755 Monte Villa Parkway | ||||||||||||||||||||||||||||||||||||||||||||||||||
Mega Campus: Alexandria Center® for Life Science – South Lake Union/ Lake Union | (3) | 377,870 | — | 1,095,586 | — | 188,400 | 1,283,986 | |||||||||||||||||||||||||||||||||||||||||||
| 601 and 701 Dexter Avenue North and 800 Mercer Street | ||||||||||||||||||||||||||||||||||||||||||||||||||
| 830 and 1010 4th Avenue South/SoDo | 100 | % | $ | 53,937 | — | — | — | 597,313 | 597,313 | |||||||||||||||||||||||||||||||||||||||||
Refer to “Mega campus” in the “Definitions and reconciliations” of this Supplemental Information for additional details. (1)Represents total square footage upon completion of development or redevelopment of one or more new Class A properties. Square footage presented includes RSF of buildings currently in operation at properties that also have inherent future development or redevelopment opportunities. Upon expiration of existing in-place leases, we have the intent to demolish or redevelop the existing property and commence future construction. Refer to “Definitions and reconciliations” of this Supplemental Information for additional details on value-creation square feet currently included in rental properties. (2)We have a 100% ownership interest in this property. (3)We have a 100% ownership interest in 601 and 701 Dexter Avenue North aggregating 414,986 SF and a 60% ownership interest in the near-term development project at 800 Mercer Street aggregating 869,000 SF. | ||||||||||||||||||||||||||||||||||||||||||||||||||
| New Class A Development and Redevelopment Properties: Summary of Pipeline (continued) | | ||||
December 31, 2022 | |||||
| (Dollars in thousands) | |||||
Market Property/Submarket | Our Ownership Interest | Book Value | Square Footage | |||||||||||||||||||||||||||||||||||||||||||||||
| Development and Redevelopment | ||||||||||||||||||||||||||||||||||||||||||||||||||
| Under Construction | Near Term | Intermediate Term | Future | Total(1) | ||||||||||||||||||||||||||||||||||||||||||||||
| Seattle (continued) | ||||||||||||||||||||||||||||||||||||||||||||||||||
Mega Campus: Alexandria Center® for Advanced Technologies – Canyon Park/Bothell | 100 | % | $ | 14,059 | — | — | — | 230,000 | 230,000 | |||||||||||||||||||||||||||||||||||||||||
| 21660 20th Avenue Southeast | ||||||||||||||||||||||||||||||||||||||||||||||||||
| Other value-creation projects | 100 | % | 84,369 | — | — | — | 691,000 | 691,000 | ||||||||||||||||||||||||||||||||||||||||||
| 842,575 | 525,607 | 1,146,138 | — | 1,706,713 | 3,378,458 | |||||||||||||||||||||||||||||||||||||||||||||
| Maryland | ||||||||||||||||||||||||||||||||||||||||||||||||||
Mega Campus: Alexandria Center® for Life Science – Shady Grove/Rockville | 100 | % | 218,117 | 343,322 | 250,000 | 258,000 | 38,000 | 889,322 | ||||||||||||||||||||||||||||||||||||||||||
| 9601, 9603, and 9808 Medical Center Drive and 9810, 9820, and 9830 Darnestown Road | ||||||||||||||||||||||||||||||||||||||||||||||||||
| 20400 Century Boulevard/Gaithersburg | 100 | % | 7,584 | 29,812 | — | — | — | 29,812 | ||||||||||||||||||||||||||||||||||||||||||
| 225,701 | 373,134 | 250,000 | 258,000 | 38,000 | 919,134 | |||||||||||||||||||||||||||||||||||||||||||||
| Research Triangle | ||||||||||||||||||||||||||||||||||||||||||||||||||
Mega Campus: Alexandria Center® for Life Science – Durham/ Research Triangle | 100 | % | 271,547 | 376,871 | — | — | 2,060,000 | 2,436,871 | ||||||||||||||||||||||||||||||||||||||||||
| 40 and 41 Moore Drive and 14 TW Alexander Drive | ||||||||||||||||||||||||||||||||||||||||||||||||||
Mega Campus: Alexandria Center® for Advanced Technologies – Research Triangle/Research Triangle | 100 | % | 74,801 | 180,000 | — | — | 990,000 | 1,170,000 | ||||||||||||||||||||||||||||||||||||||||||
| 4 and 12 Davis Drive | ||||||||||||||||||||||||||||||||||||||||||||||||||
| 6040 George Watts Hill Drive, Phase II/Research Triangle | 100 | % | 20,583 | 88,038 | — | — | — | 88,038 | ||||||||||||||||||||||||||||||||||||||||||
Mega Campus: Alexandria Center® for NextGen Medicines/ Research Triangle | 100 | % | 100,290 | — | 100,000 | 100,000 | 855,000 | 1,055,000 | ||||||||||||||||||||||||||||||||||||||||||
| 3029 East Cornwallis Road | ||||||||||||||||||||||||||||||||||||||||||||||||||
| 120 TW Alexander Drive, 2752 East NC Highway 54, and 10 South Triangle Drive/Research Triangle | 100 | % | 51,083 | — | — | — | 750,000 | 750,000 | ||||||||||||||||||||||||||||||||||||||||||
| Other value-creation projects | 100 | % | 4,185 | — | — | — | 76,262 | 76,262 | ||||||||||||||||||||||||||||||||||||||||||
| $ | 522,489 | 644,909 | 100,000 | 100,000 | 4,731,262 | 5,576,171 | ||||||||||||||||||||||||||||||||||||||||||||
Refer to “Mega campus” in the “Definitions and reconciliations” of this Supplemental Information for additional details. (1)Represents total square footage upon completion of development or redevelopment of one or more new Class A properties. Square footage presented includes RSF of buildings currently in operation at properties that also have inherent future development or redevelopment opportunities. Upon expiration of existing in-place leases, we have the intent to demolish or redevelop the existing property and commence future construction. Refer to “Definitions and reconciliations” of this Supplemental Information for additional details on value-creation square feet currently included in rental properties. | ||||||||||||||||||||||||||||||||||||||||||||||||||
| New Class A Development and Redevelopment Properties: Summary of Pipeline (continued) | | ||||
December 31, 2022 | |||||
| (Dollars in thousands) | |||||
Market Property/Submarket | Our Ownership Interest | Book Value | Square Footage | |||||||||||||||||||||||||||||||||||||||||||||||
| Development and Redevelopment | ||||||||||||||||||||||||||||||||||||||||||||||||||
| Under Construction | Near Term | Intermediate Term | Future | Total(1) | ||||||||||||||||||||||||||||||||||||||||||||||
| Texas | ||||||||||||||||||||||||||||||||||||||||||||||||||
| 8800 Technology Forest Place/Greater Houston | 100 | % | $ | 84,514 | 201,499 | — | — | 116,287 | 317,786 | |||||||||||||||||||||||||||||||||||||||||
| 1020 Red River Street/Austin | 100 | % | 9,197 | — | — | — | 177,072 | 177,072 | ||||||||||||||||||||||||||||||||||||||||||
| Other value-creation projects | 100 | % | 127,618 | — | — | — | 1,694,000 | 1,694,000 | ||||||||||||||||||||||||||||||||||||||||||
| 221,329 | 201,499 | — | — | 1,987,359 | 2,188,858 | |||||||||||||||||||||||||||||||||||||||||||||
| Canada | 100 | % | 17,376 | 107,081 | — | — | 124,000 | 231,081 | ||||||||||||||||||||||||||||||||||||||||||
| Other value-creation projects | 100 | % | 41,188 | — | — | — | 350,000 | 350,000 | ||||||||||||||||||||||||||||||||||||||||||
Total pipeline as of December 31, 2022 | $ | 8,715,335 | (2) | 5,597,537 | 6,248,830 | 4,780,268 | 20,716,308 | 37,342,943 | ||||||||||||||||||||||||||||||||||||||||||
| Construction Spending | | ||||
December 31, 2022 | |||||
| (In thousands) | |||||
| Year Ended December 31, 2022 | ||||||||||||||||||||
| Construction Spending | ||||||||||||||||||||
Additions to real estate – consolidated projects | $ | 3,307,313 | ||||||||||||||||||
| Investments in unconsolidated real estate joint ventures | 1,442 | |||||||||||||||||||
| Contributions from noncontrolling interests | (320,057) | |||||||||||||||||||
| Construction spending (cash basis) | 2,988,698 | |||||||||||||||||||
| Change in accrued construction | 102,801 | |||||||||||||||||||
| Construction spending | $ | 3,091,499 | ||||||||||||||||||
| Year Ending December 31, 2023 | ||||||||||||||||||||
| Projected Construction Spending | ||||||||||||||||||||
| Development, redevelopment, and pre-construction projects | $ | 3,549,000 | ||||||||||||||||||
Contributions from noncontrolling interests (consolidated real estate joint ventures) | (794,000) | (1) | ||||||||||||||||||
Revenue-enhancing and repositioning capital expenditures | 160,000 | |||||||||||||||||||
| Non-revenue-enhancing capital expenditures | 60,000 | |||||||||||||||||||
| Guidance midpoint | $ | 2,975,000 | ||||||||||||||||||
(1)Approximately 55% of this amount represents contractual funding commitments from our existing consolidated real estate joint ventures, and the remaining amount is from projected new real estate joint ventures. | ||||||||||||||||||||
| |||||
| Joint Venture Financial Information | |||||
December 31, 2022 | |||||
| Consolidated Real Estate Joint Ventures | ||||||||||||||||||||||||||||||||||||||
| Property | Market | Submarket | Noncontrolling Interest Share(1) | Operating RSF at 100% | ||||||||||||||||||||||||||||||||||
| 50 and 60 Binney Street | Greater Boston | Cambridge/Inner Suburbs | 66.0% | 532,395 | ||||||||||||||||||||||||||||||||||
| 75/125 Binney Street | Greater Boston | Cambridge/Inner Suburbs | 60.0% | 388,270 | ||||||||||||||||||||||||||||||||||
| 100 and 225 Binney Street and 300 Third Street | Greater Boston | Cambridge/Inner Suburbs | 70.0% | 870,106 | ||||||||||||||||||||||||||||||||||
| 99 Coolidge Avenue | Greater Boston | Cambridge/Inner Suburbs | 25.0% | — | (2) | |||||||||||||||||||||||||||||||||
Alexandria Center® for Science and Technology – Mission Bay(3) | San Francisco Bay Area | Mission Bay | 75.0% | 1,005,989 | ||||||||||||||||||||||||||||||||||
| 1450 Owens Street | San Francisco Bay Area | Mission Bay | 40.3% | (4) | — | (2) | ||||||||||||||||||||||||||||||||
| 601, 611, 651, 681, 685, and 701 Gateway Boulevard | San Francisco Bay Area | South San Francisco | 50.0% | 789,567 | ||||||||||||||||||||||||||||||||||
| 751 Gateway Boulevard | San Francisco Bay Area | South San Francisco | 49.0% | — | (2) | |||||||||||||||||||||||||||||||||
| 211 and 213 East Grand Avenue | San Francisco Bay Area | South San Francisco | 70.0% | 300,930 | ||||||||||||||||||||||||||||||||||
| 500 Forbes Boulevard | San Francisco Bay Area | South San Francisco | 90.0% | 155,685 | ||||||||||||||||||||||||||||||||||
Alexandria Center® for Life Science – Millbrae | San Francisco Bay Area | South San Francisco | 54.7% | — | ||||||||||||||||||||||||||||||||||
| 3215 Merryfield Row | San Diego | Torrey Pines | 70.0% | 170,523 | ||||||||||||||||||||||||||||||||||
Campus Point by Alexandria(5) | San Diego | University Town Center | 45.0% | 1,337,916 | ||||||||||||||||||||||||||||||||||
| 5200 Illumina Way | San Diego | University Town Center | 49.0% | 792,687 | ||||||||||||||||||||||||||||||||||
| 9625 Towne Centre Drive | San Diego | University Town Center | 49.9% | 163,648 | ||||||||||||||||||||||||||||||||||
SD Tech by Alexandria(6) | San Diego | Sorrento Mesa | 50.0% | 876,869 | ||||||||||||||||||||||||||||||||||
| Pacific Technology Park | San Diego | Sorrento Mesa | 50.0% | 544,352 | ||||||||||||||||||||||||||||||||||
Summers Ridge Science Park(7) | San Diego | Sorrento Mesa | 70.0% | 316,531 | ||||||||||||||||||||||||||||||||||
| 1201 and 1208 Eastlake Avenue East and 199 East Blaine Street | Seattle | Lake Union | 70.0% | 321,218 | ||||||||||||||||||||||||||||||||||
| 400 Dexter Avenue North | Seattle | Lake Union | 70.0% | 290,754 | ||||||||||||||||||||||||||||||||||
| 800 Mercer Street | Seattle | Lake Union | 40.0% | — | ||||||||||||||||||||||||||||||||||
| Unconsolidated Real Estate Joint Ventures | ||||||||||||||||||||||||||||||||||||||
| Property | Market | Submarket | Our Ownership Share(8) | Operating RSF at 100% | ||||||||||||||||||||||||||||||||||
| 1655 and 1725 Third Street | San Francisco Bay Area | Mission Bay | 10.0% | 586,208 | ||||||||||||||||||||||||||||||||||
| 1401/1413 Research Boulevard | Maryland | Rockville | 65.0% | (9) | (10) | |||||||||||||||||||||||||||||||||
| 1450 Research Boulevard | Maryland | Rockville | 73.2% | (11) | 42,679 | |||||||||||||||||||||||||||||||||
| 101 West Dickman Street | Maryland | Beltsville | 57.9% | (11) | 135,423 | |||||||||||||||||||||||||||||||||
| Joint Venture Financial Information (continued) | | ||||
December 31, 2022 | |||||
| (In thousands) | |||||
| As of December 31, 2022 | ||||||||||||||||||||||||||
| Noncontrolling Interest Share of Consolidated Real Estate JVs | Our Share of Unconsolidated Real Estate JVs | |||||||||||||||||||||||||
| Investments in real estate | $ | 3,392,839 | $ | 114,664 | ||||||||||||||||||||||
| Cash, cash equivalents, and restricted cash | 129,186 | 4,729 | ||||||||||||||||||||||||
| Other assets | 386,667 | 11,346 | ||||||||||||||||||||||||
Secured notes payable (refer to page 54) | (14,599) | (87,694) | ||||||||||||||||||||||||
| Other liabilities | (183,233) | (4,610) | ||||||||||||||||||||||||
| Redeemable noncontrolling interests | (9,612) | — | ||||||||||||||||||||||||
| $ | 3,701,248 | $ | 38,435 | |||||||||||||||||||||||
| Noncontrolling Interest Share of Consolidated Real Estate JVs | Our Share of Unconsolidated Real Estate JVs | ||||||||||||||||||||||||||||||||||||||||||||||
| December 31, 2022 | December 31, 2022 | ||||||||||||||||||||||||||||||||||||||||||||||
| Three Months Ended | Year Ended | Three Months Ended | Year Ended | ||||||||||||||||||||||||||||||||||||||||||||
| Total revenues | $ | 102,013 | $ | 366,794 | $ | 2,689 | $ | 11,130 | |||||||||||||||||||||||||||||||||||||||
| Rental operations | (31,176) | (109,358) | (753) | (3,197) | |||||||||||||||||||||||||||||||||||||||||||
| 70,837 | 257,436 | 1,936 | 7,933 | ||||||||||||||||||||||||||||||||||||||||||||
| General and administrative | (372) | (1,594) | (10) | (106) | |||||||||||||||||||||||||||||||||||||||||||
| Interest | (15) | (15) | (772) | (3,516) | |||||||||||||||||||||||||||||||||||||||||||
| Depreciation and amortization of real estate assets | (29,702) | (107,591) | (982) | (3,666) | |||||||||||||||||||||||||||||||||||||||||||
Fixed returns allocated to redeemable noncontrolling interests(1) | 201 | 805 | — | — | |||||||||||||||||||||||||||||||||||||||||||
| $ | 40,949 | $ | 149,041 | $ | 172 | $ | 645 | ||||||||||||||||||||||||||||||||||||||||
| Straight-line rent and below-market lease revenue | $ | 3,858 | $ | 15,776 | $ | 274 | $ | 1,136 | |||||||||||||||||||||||||||||||||||||||
Funds from operations(2) | $ | 70,651 | $ | 256,632 | $ | 1,154 | $ | 4,311 | |||||||||||||||||||||||||||||||||||||||
| Investments | | ||||
December 31, 2022 | |||||
| (Dollars in thousands) | |||||
| December 31, 2022 | |||||||||||||||||||||||||||||
| Three Months Ended | Year Ended | Year Ended December 31, 2021 | |||||||||||||||||||||||||||
| Realized gains | $ | 4,464 | (1) | $ | 80,435 | (1) | $ | 215,845 | (2) | ||||||||||||||||||||
| Unrealized (losses) gains | (24,117) | (412,193) | 43,632 | ||||||||||||||||||||||||||
| Investment (loss) income | $ | (19,653) | $ | (331,758) | $ | 259,477 | |||||||||||||||||||||||
| December 31, 2022 | |||||||||||||||||||||||||||||
| Investments | Cost | Unrealized Gains | Unrealized Losses | Carrying Amount | |||||||||||||||||||||||||
| Publicly traded companies | $ | 210,986 | $ | 96,271 | $ | (100,118) | $ | 207,139 | |||||||||||||||||||||
| Entities that report NAV | 452,391 | 315,071 | (7,710) | 759,752 | |||||||||||||||||||||||||
| Entities that do not report NAV: | |||||||||||||||||||||||||||||
| Entities with observable price changes | 100,296 | 95,062 | (1,574) | 193,784 | |||||||||||||||||||||||||
| Entities without observable price changes | 388,940 | — | — | 388,940 | |||||||||||||||||||||||||
| Investments accounted for under the equity method of accounting | N/A | N/A | N/A | 65,459 | |||||||||||||||||||||||||
| December 31, 2022 | $ | 1,152,613 | (3) | $ | 506,404 | $ | (109,402) | $ | 1,615,074 | ||||||||||||||||||||
| December 31, 2021 | $ | 1,007,303 | $ | 830,863 | $ | (33,190) | $ | 1,876,564 | |||||||||||||||||||||
| Public/Private Mix (Cost) | ||||||||
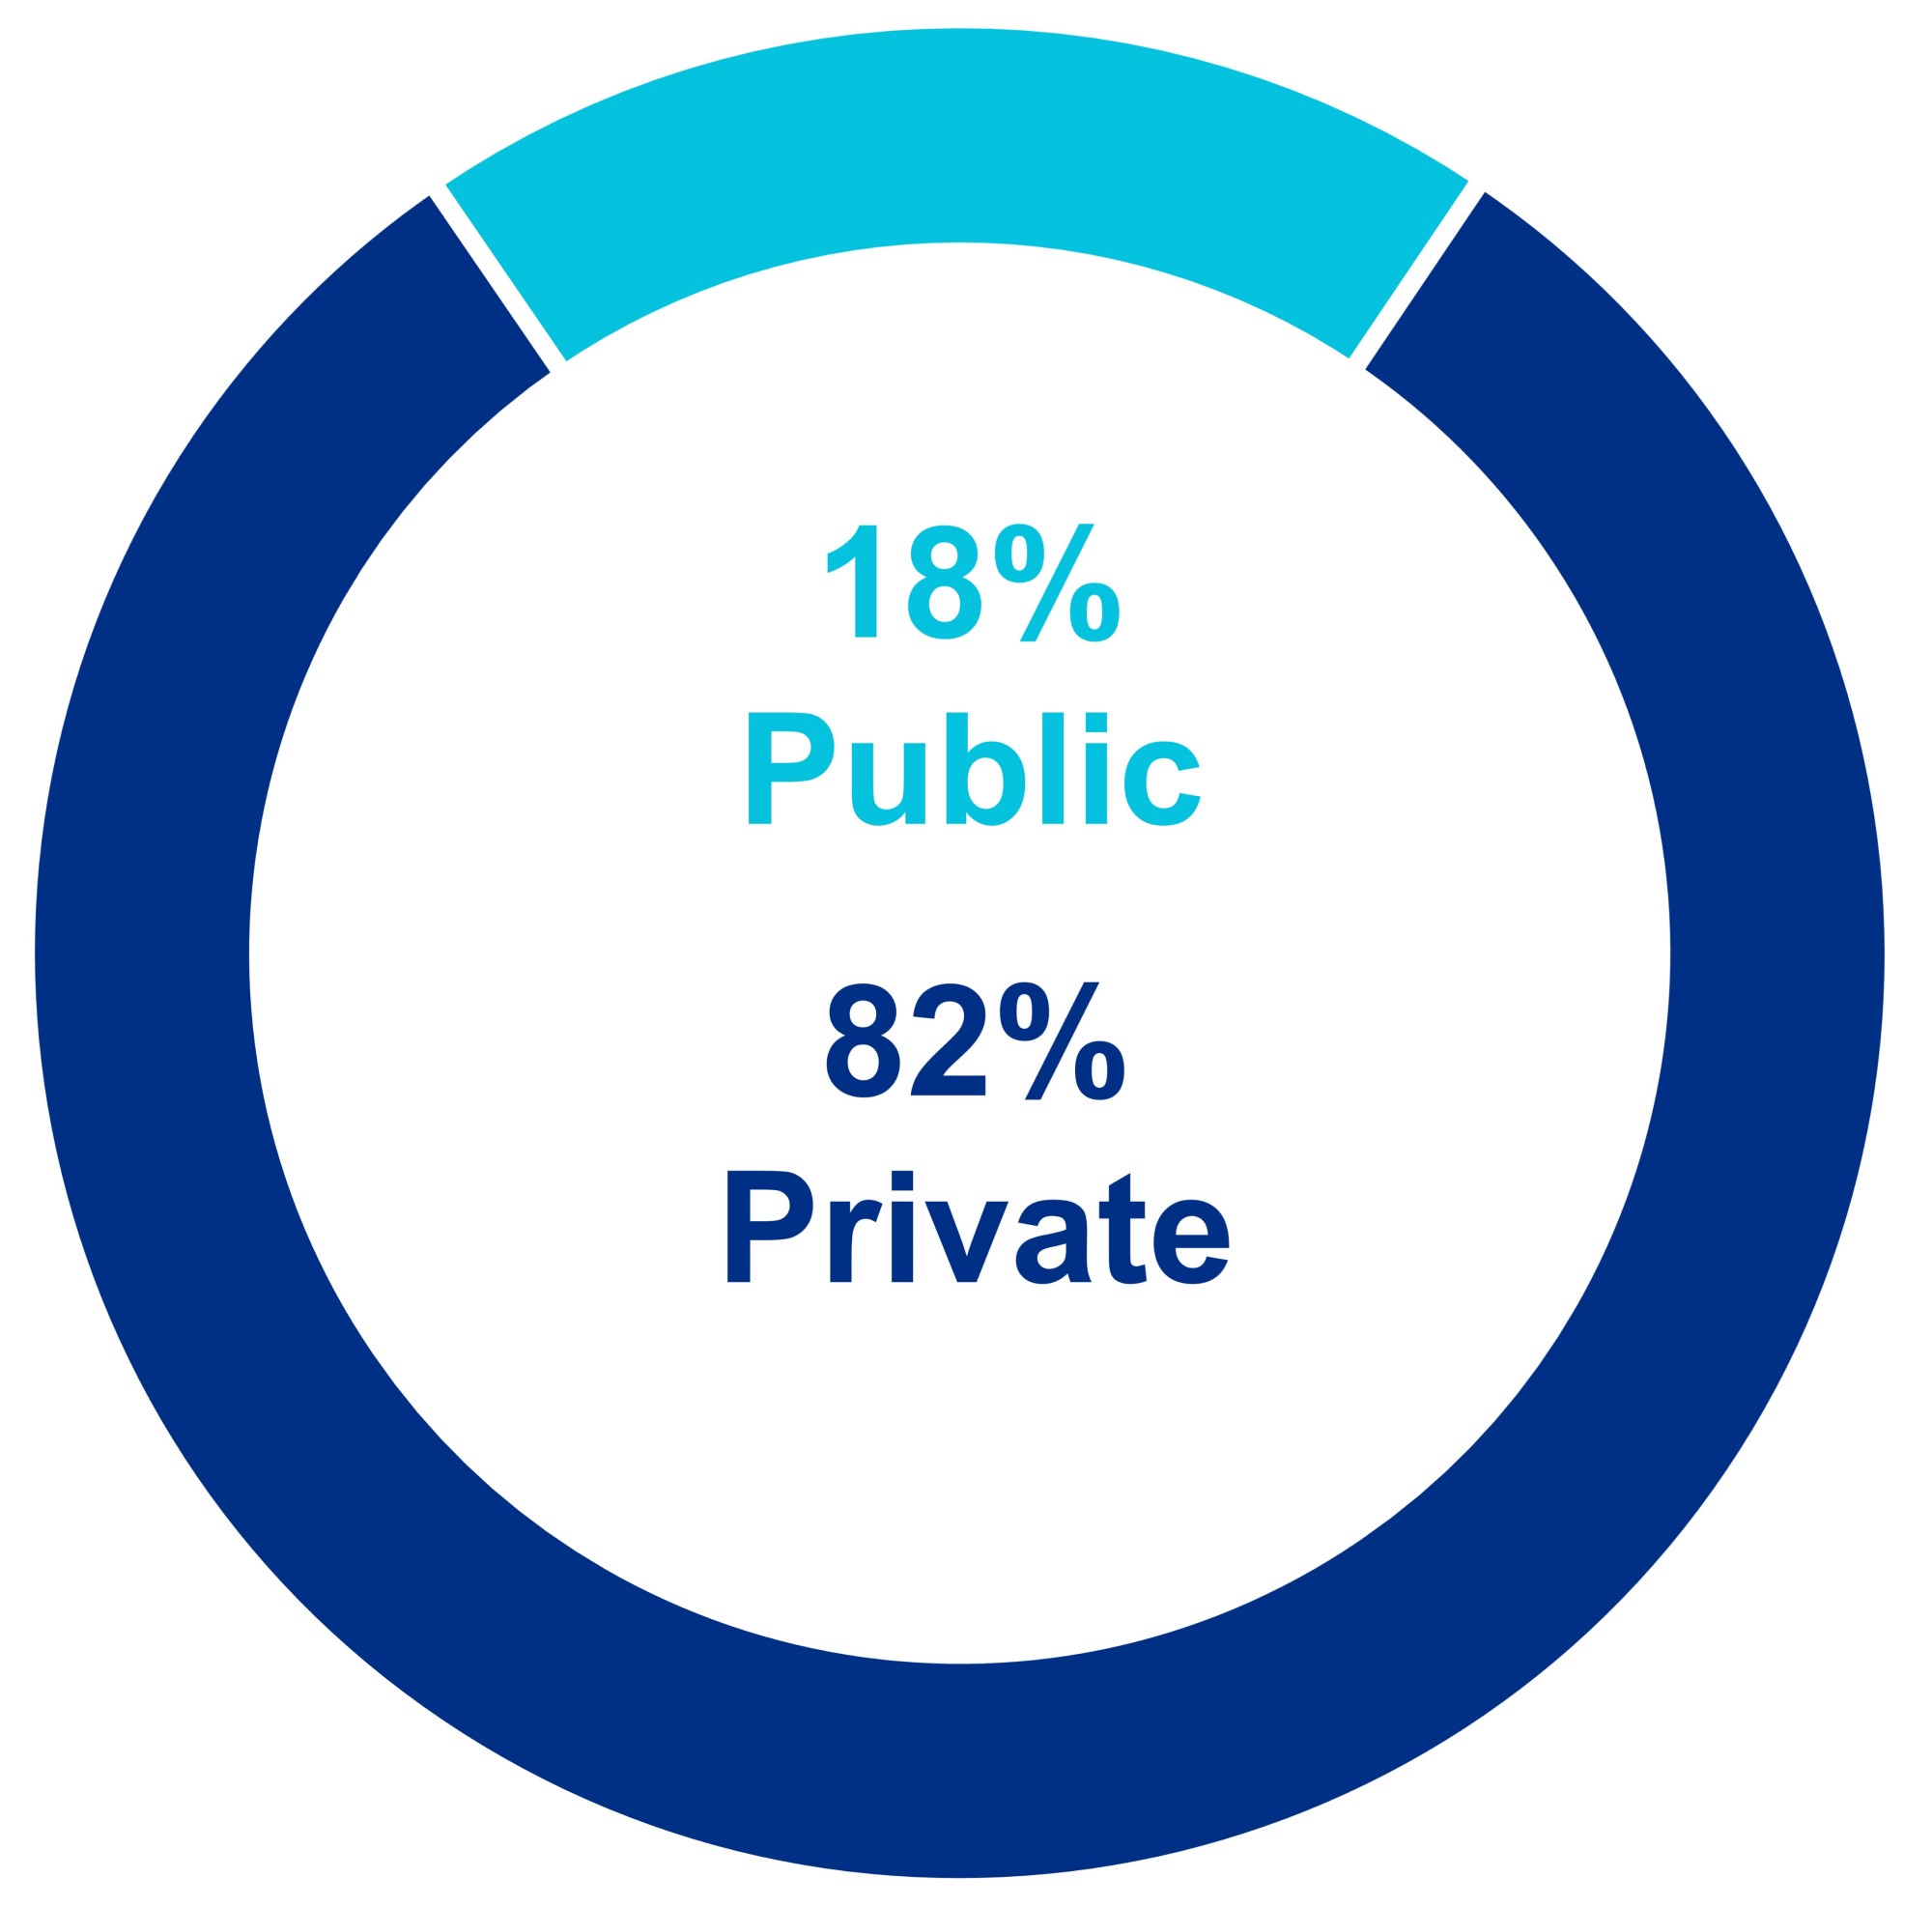 | ||||||||
| Tenant/Non-Tenant Mix (Cost) | ||||||||
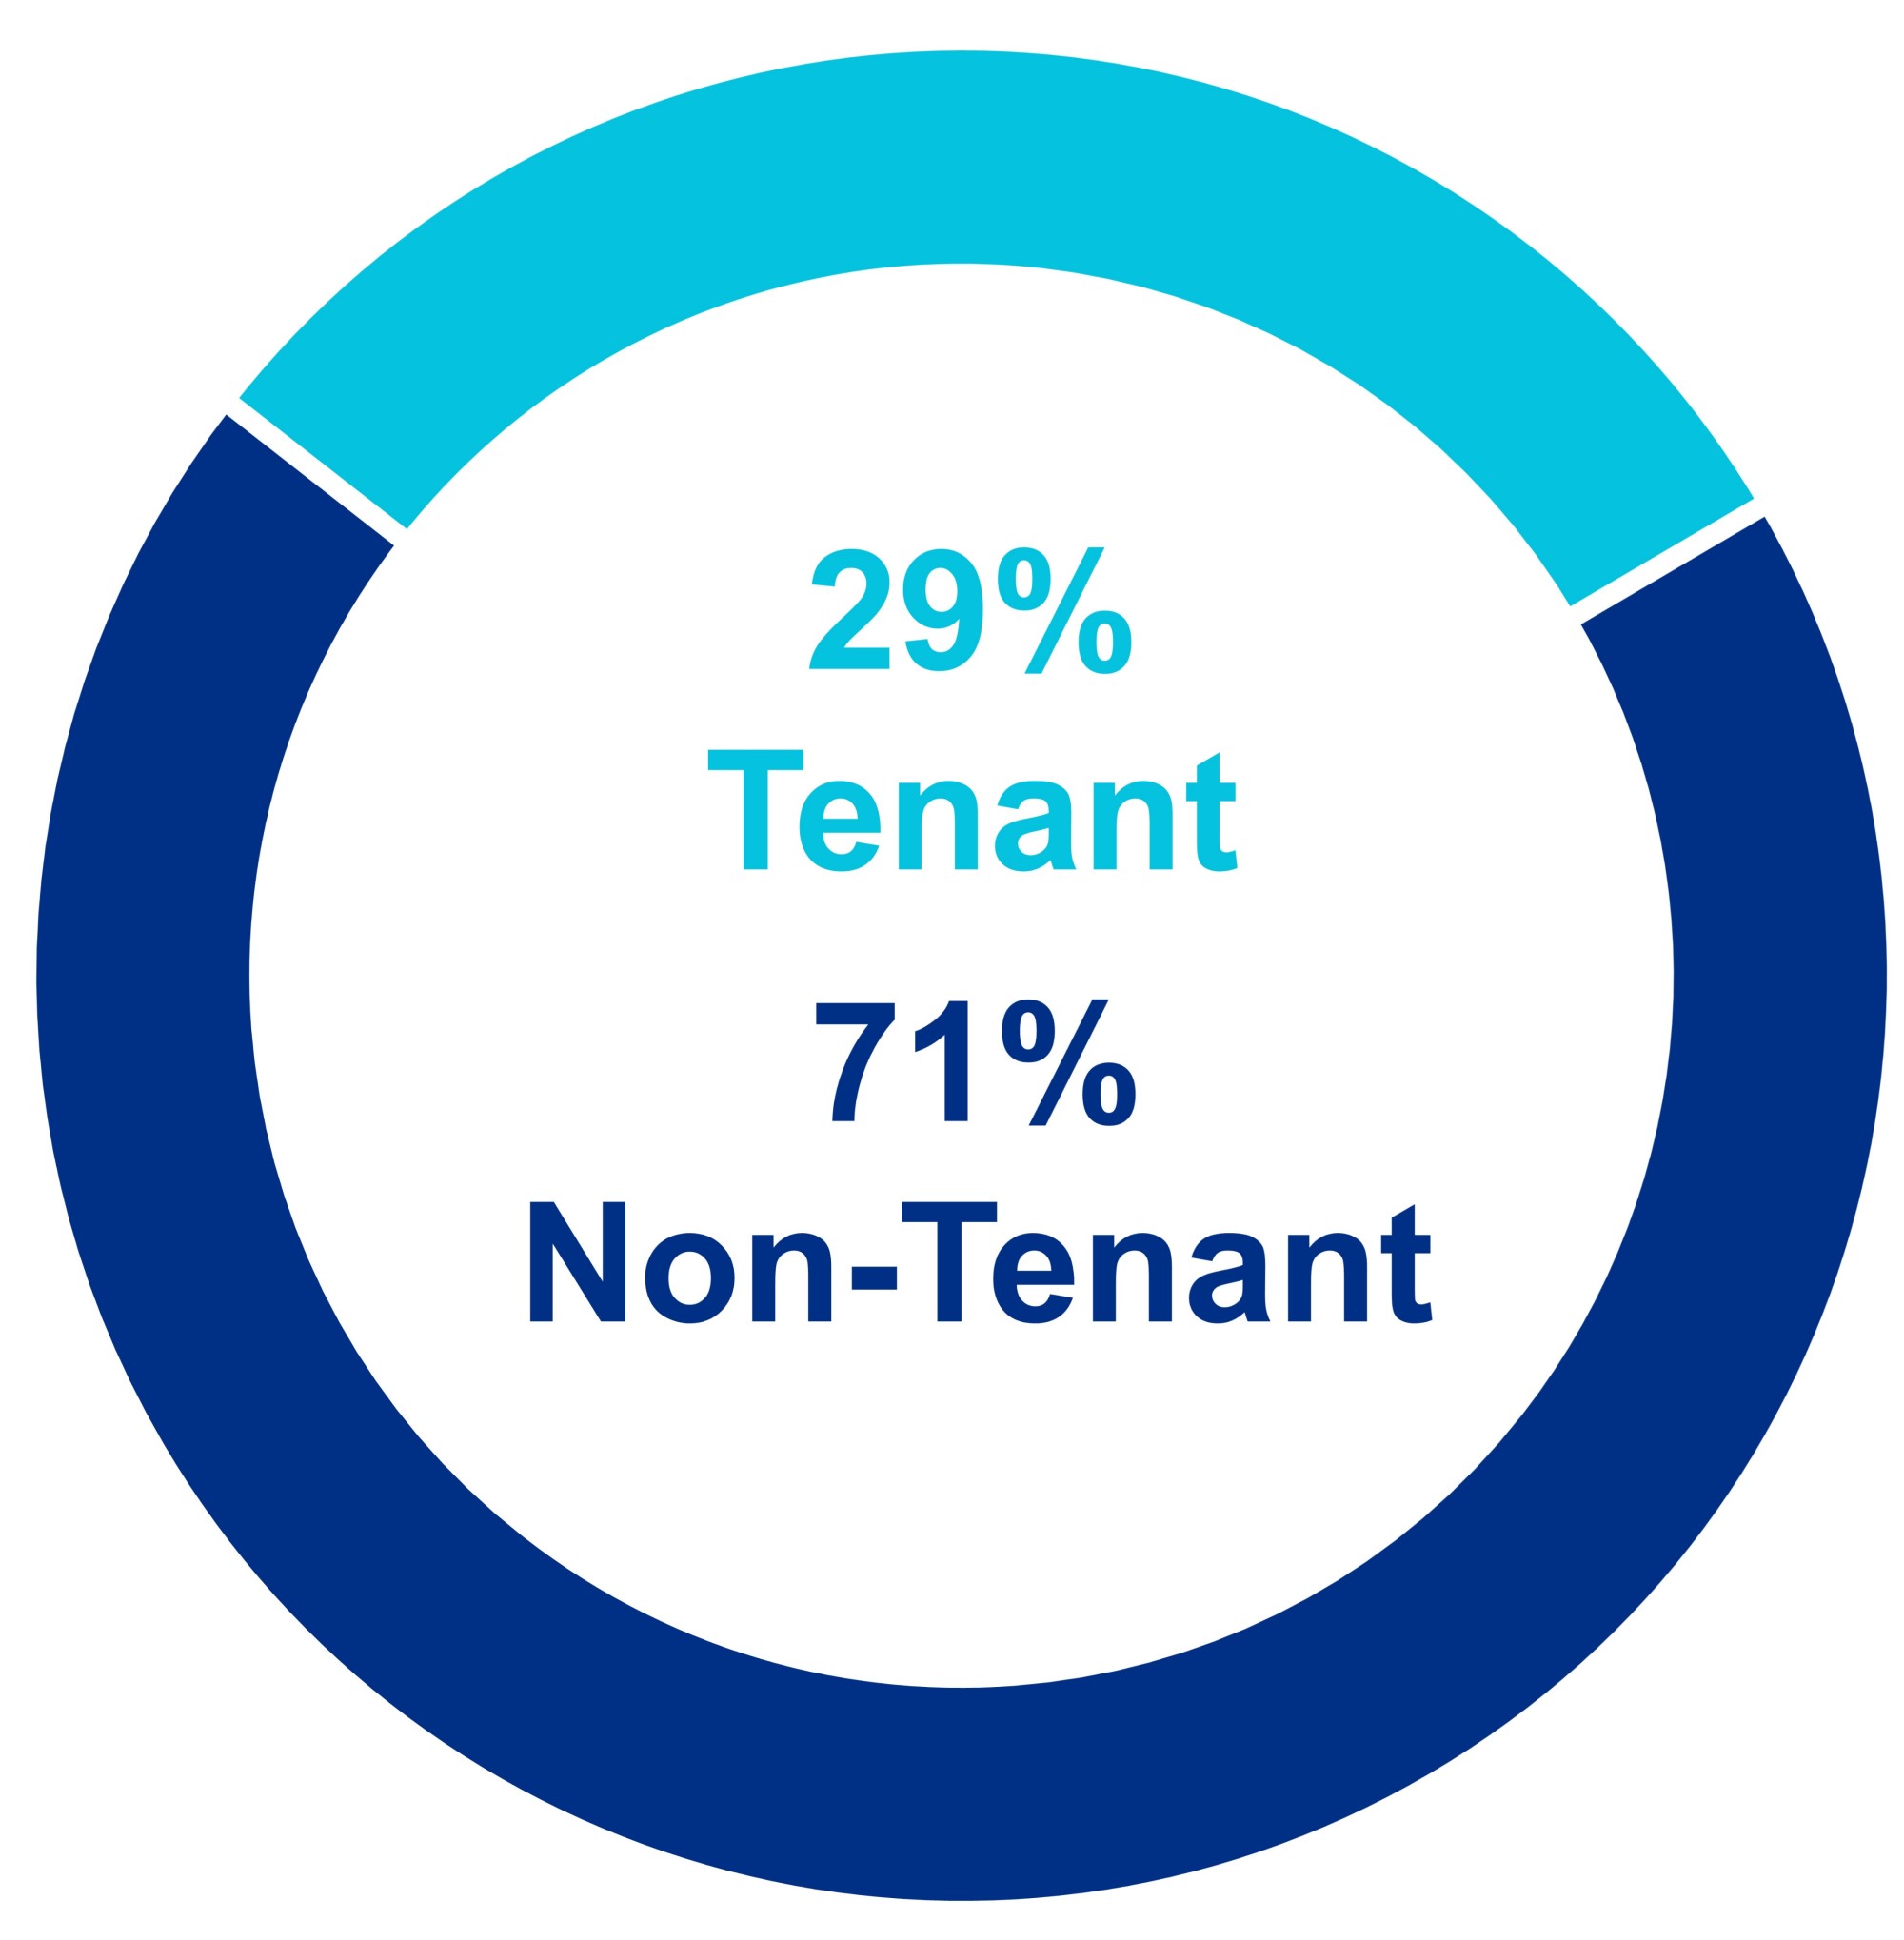 | ||||||||
| |||||
| Key Credit Metrics | |||||
December 31, 2022 | |||||
| Liquidity | Minimal Outstanding Borrowings and Significant Availability on Unsecured Senior Line of Credit | |||||||||||||||||||||||||
| (in millions) | ||||||||||||||||||||||||||
| $5.3B | 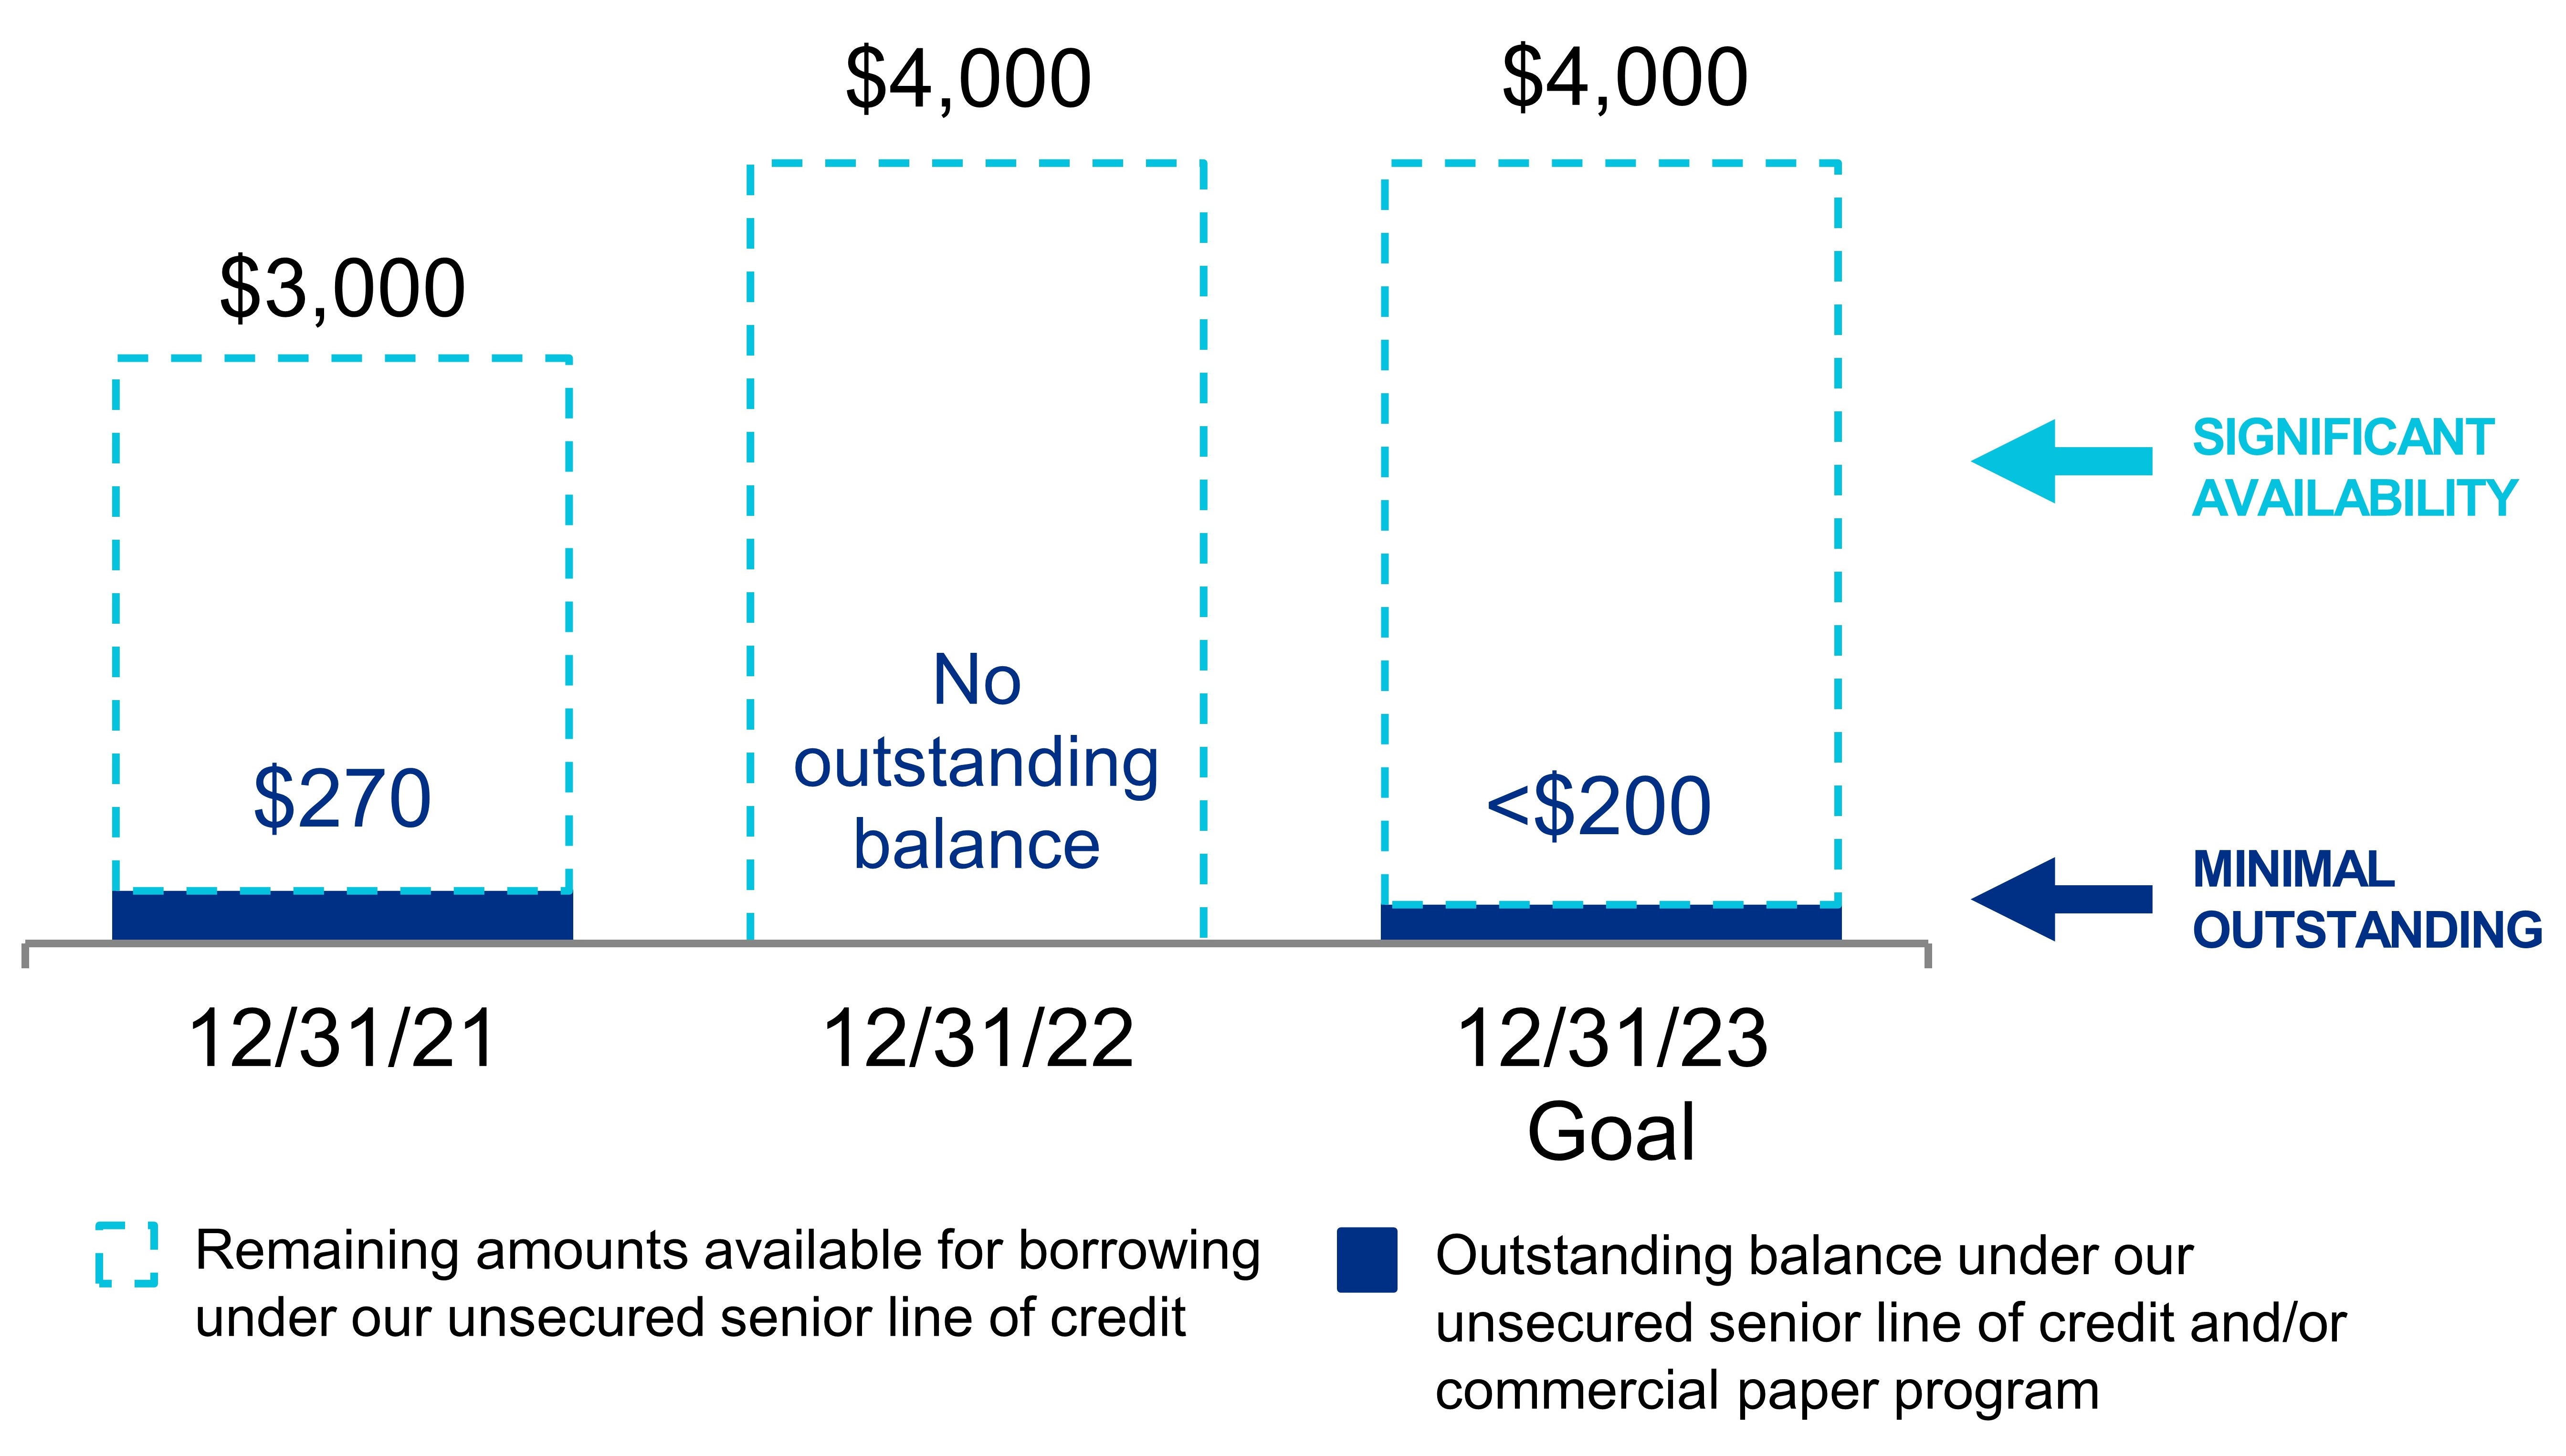 | |||||||||||||||||||||||||
| (in millions) | ||||||||||||||||||||||||||
| Availability under our unsecured senior line of credit, net of amounts outstanding under our commercial paper program | $ | 4,000 | ||||||||||||||||||||||||
Outstanding forward equity sales agreements(1) | 102 | |||||||||||||||||||||||||
| Cash, cash equivalents, and restricted cash | 858 | |||||||||||||||||||||||||
| Remaining construction loan commitments | 136 | |||||||||||||||||||||||||
| Investments in publicly traded companies | 207 | |||||||||||||||||||||||||
Liquidity as of December 31, 2022 | $ | 5,303 | ||||||||||||||||||||||||
Net Debt and Preferred Stock to Adjusted EBITDA(2) | Fixed-Charge Coverage Ratio(2) | |||||||||||||||||||||||||
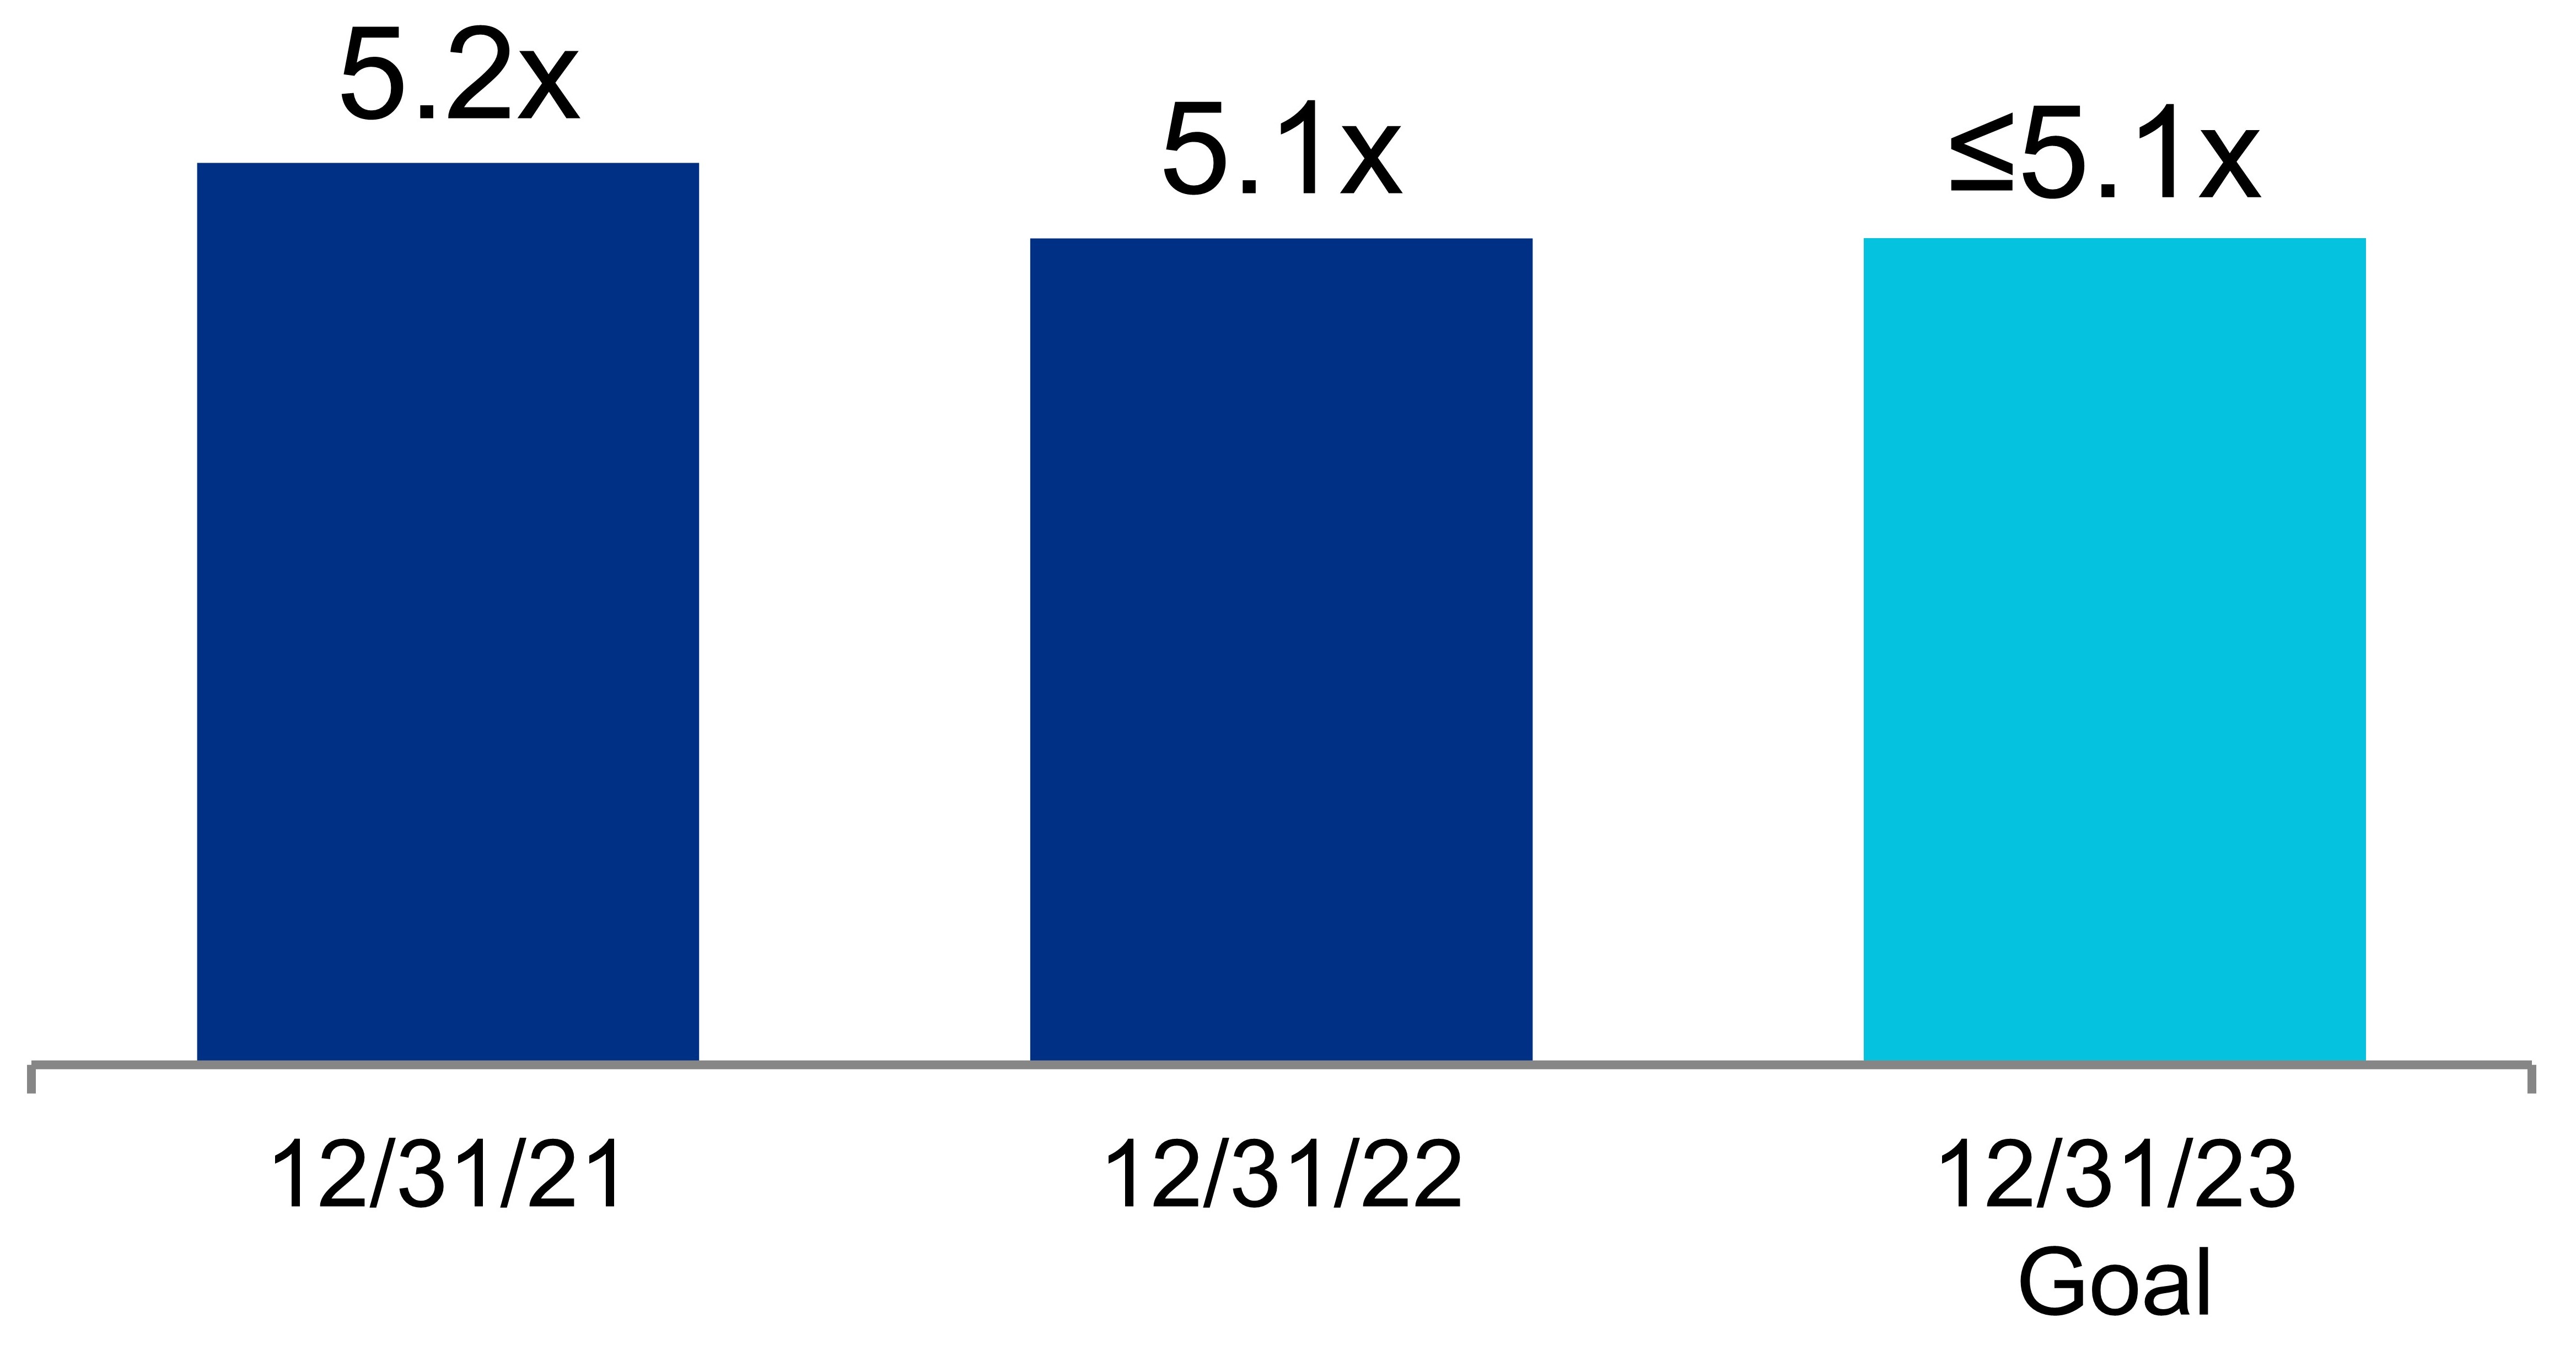 | 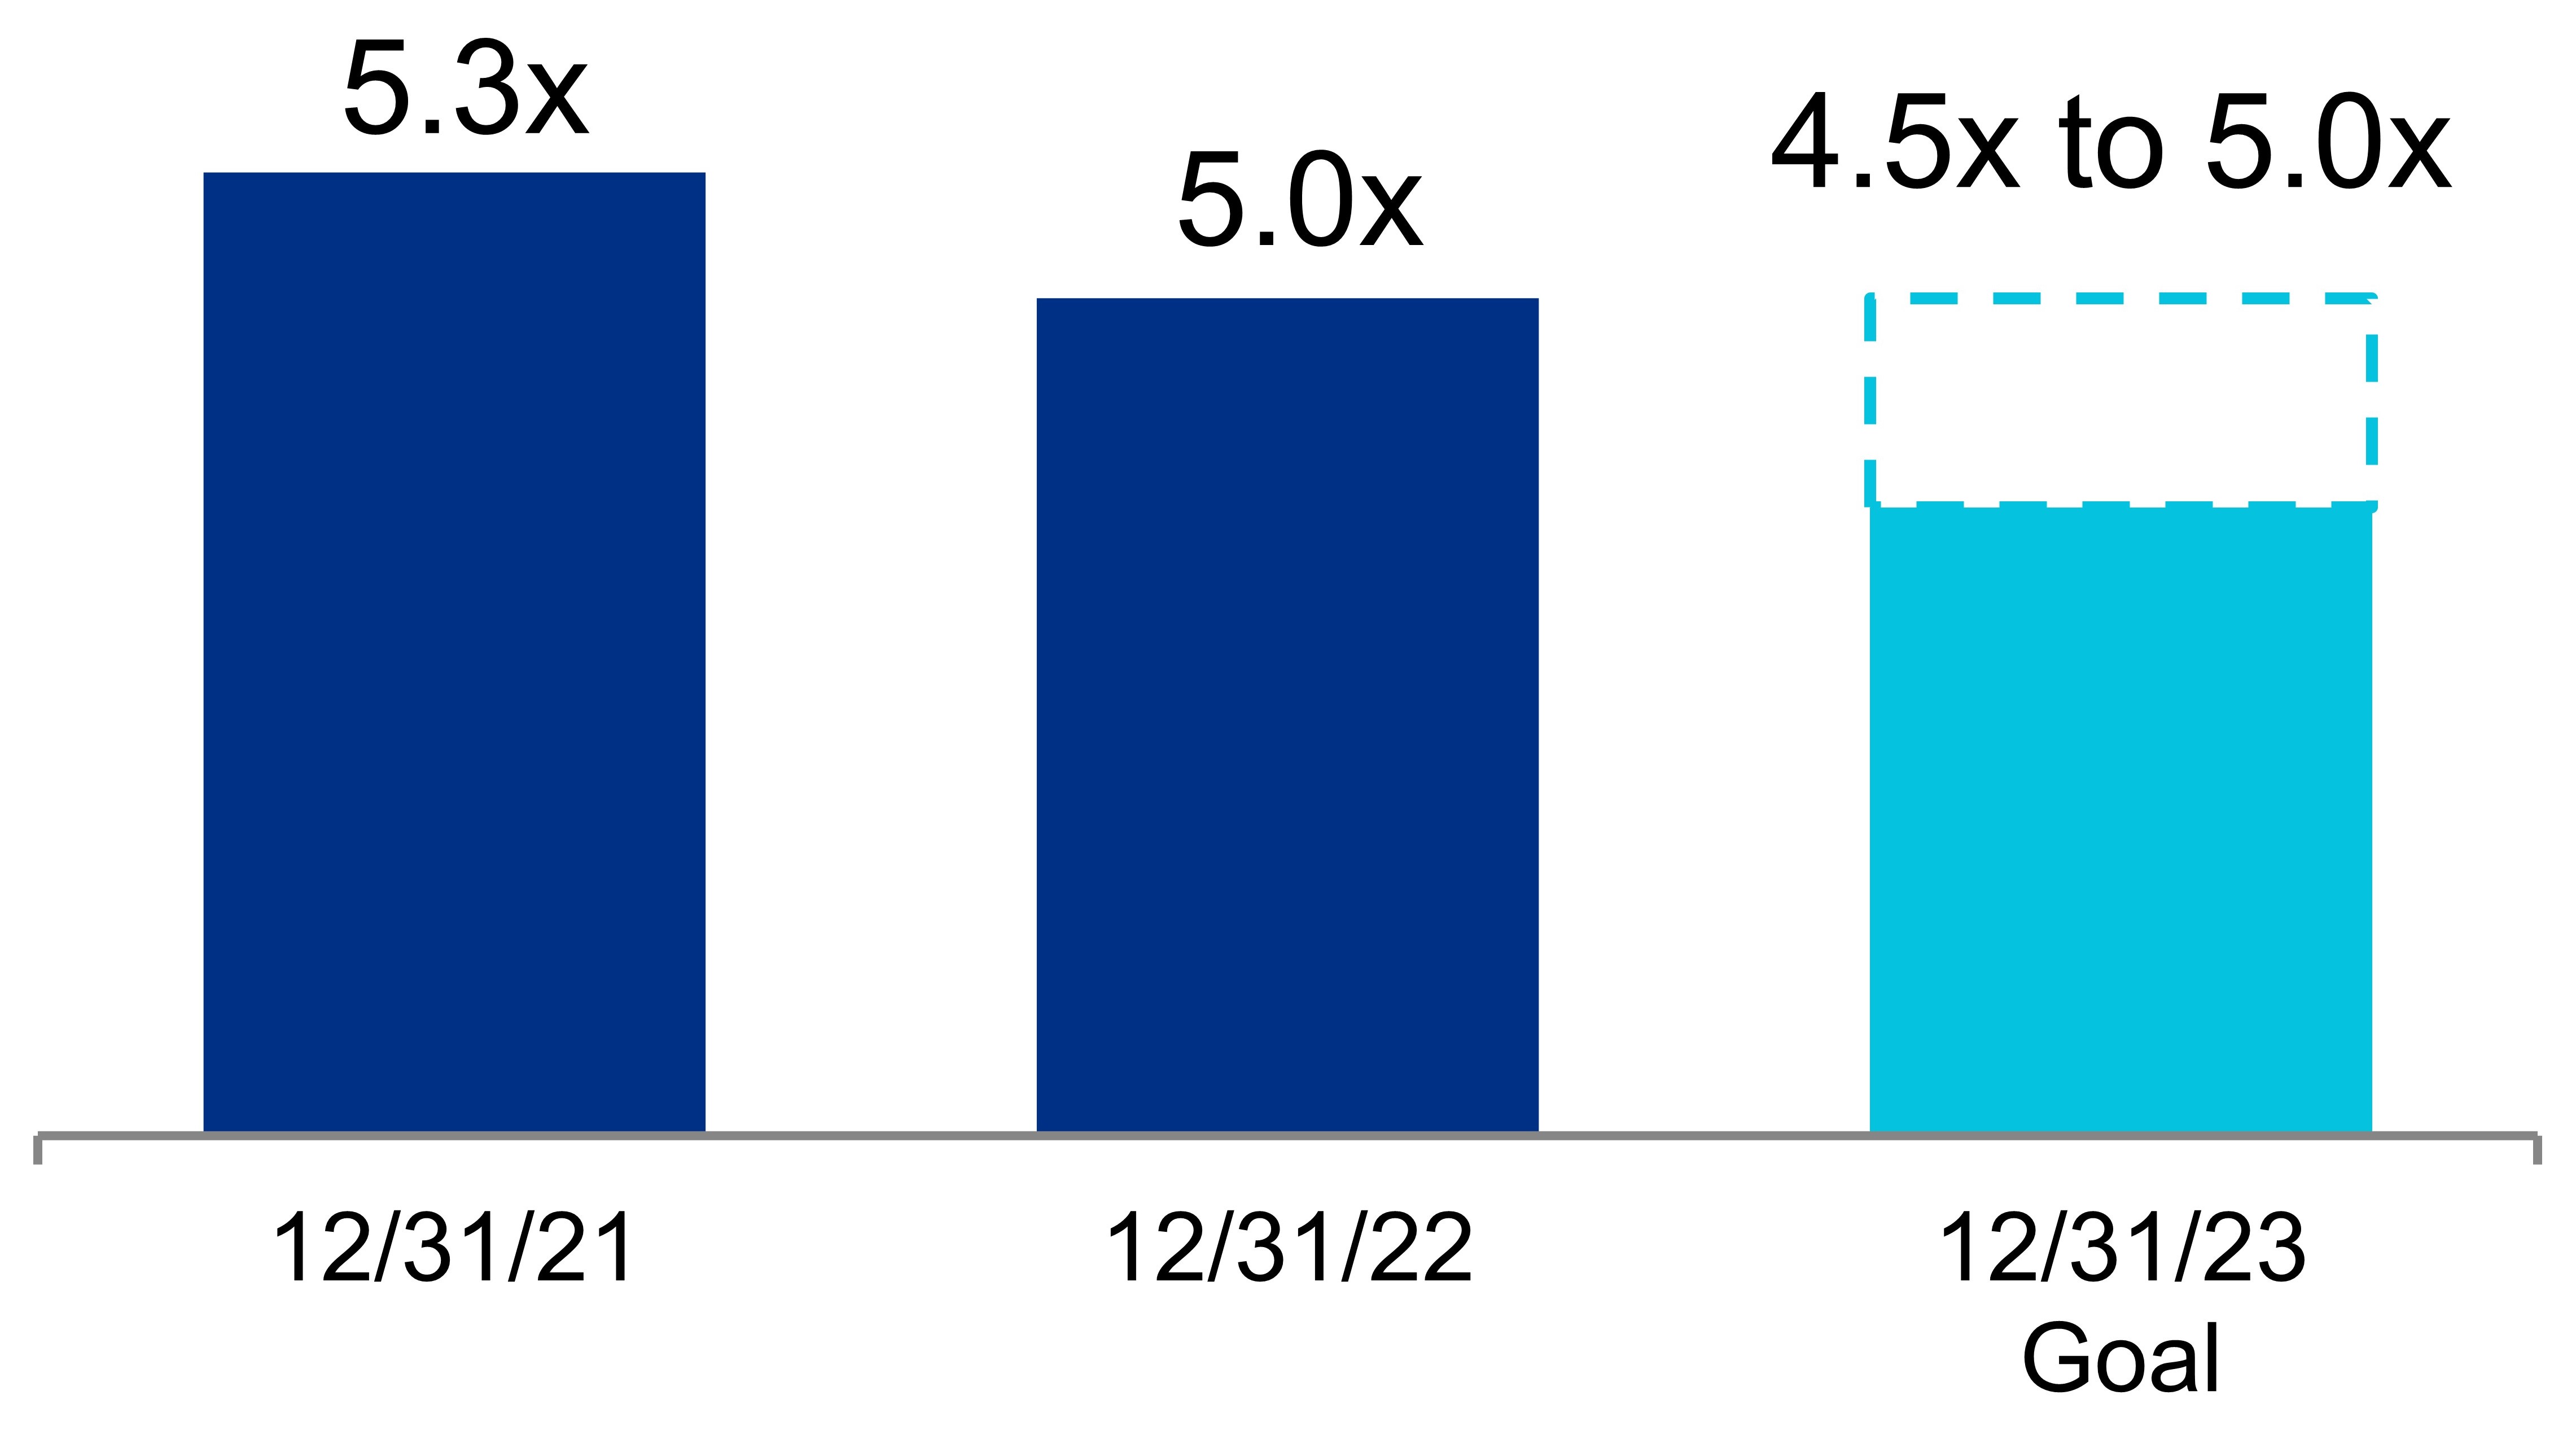 | |||||||||||||||||||||||||
| Summary of Debt | | ||||
December 31, 2022 | |||||
| (In millions) | |||||
 | ||||||||
| Summary of Debt (continued) | | ||||
December 31, 2022 | |||||
| (Dollars in thousands) | |||||
| Fixed-rate and variable-rate debt | Fixed-Rate Debt | Variable-Rate Debt | Total | Percentage | Weighted-Average | |||||||||||||||||||||||||||||||||
Interest Rate(1) | Remaining Term (in years) | |||||||||||||||||||||||||||||||||||||
| Secured notes payable | $ | 649 | $ | 58,396 | $ | 59,045 | 0.6 | % | 6.75 | % | 4.0 | |||||||||||||||||||||||||||
| Unsecured senior notes payable | 10,100,717 | — | 10,100,717 | 99.4 | 3.51 | 13.3 | ||||||||||||||||||||||||||||||||
Unsecured senior line of credit(2) and commercial paper program(3) | — | — | — | — | N/A | 5.1 | (4) | |||||||||||||||||||||||||||||||
| Total/weighted average | $ | 10,101,366 | $ | 58,396 | $ | 10,159,762 | 100.0 | % | 3.53 | % | 13.2 | (4) | ||||||||||||||||||||||||||
| Percentage of total debt | 99.4 | % | 0.6 | % | 100.0 | % | ||||||||||||||||||||||||||||||||
| Average debt outstanding and weighted-average interest rate | Average Debt Outstanding | Weighted-Average Interest Rate | |||||||||||||||||||||||||||
| December 31, 2022 | December 31, 2022 | ||||||||||||||||||||||||||||
| Three Months Ended | Year Ended | Three Months Ended | Year Ended | ||||||||||||||||||||||||||
| Long-term fixed-rate debt | $ | 10,174,809 | $ | 9,999,145 | 3.51 | % | 3.50 | % | |||||||||||||||||||||
Short-term variable-rate unsecured senior line of credit and commercial paper program debt | 341,175 | 564,649 | 4.10 | 1.72 | |||||||||||||||||||||||||
| Blended average interest rate | 10,515,984 | 10,563,794 | 3.53 | 3.40 | |||||||||||||||||||||||||
| Loan fee amortization and annual facility fee related to unsecured senior line of credit | N/A | N/A | 0.12 | 0.11 | |||||||||||||||||||||||||
| Total/weighted average | $ | 10,515,984 | $ | 10,563,794 | 3.65 | % | 3.51 | % | |||||||||||||||||||||
| Summary of Debt (continued) | | ||||
December 31, 2022 | |||||
| (Dollars in thousands) | |||||
| Debt covenants | Unsecured Senior Notes Payable | Unsecured Senior Line of Credit | |||||||||||||||||||||||||||
Debt Covenant Ratios(1) | Requirement | December 31, 2022 | Requirement | December 31, 2022 | |||||||||||||||||||||||||
| Total Debt to Total Assets | ≤ 60% | 27% | ≤ 60.0% | 26.6% | |||||||||||||||||||||||||
| Secured Debt to Total Assets | ≤ 40% | 0.2% | ≤ 45.0% | 0.1% | |||||||||||||||||||||||||
| Consolidated EBITDA to Interest Expense | ≥ 1.5x | 18.2x | ≥ 1.50x | 4.34x | |||||||||||||||||||||||||
| Unencumbered Total Asset Value to Unsecured Debt | ≥ 150% | 363% | N/A | N/A | |||||||||||||||||||||||||
| Unsecured Interest Coverage Ratio | N/A | N/A | ≥ 1.75x | 18.87x | |||||||||||||||||||||||||
| Unconsolidated real estate joint ventures’ debt | At 100% | |||||||||||||||||||||||||||||||||||||||||||
| Unconsolidated Joint Venture | Maturity Date | Stated Rate | Interest Rate(1) | Aggregate Commitment | Debt Balance(2) | Our Share | ||||||||||||||||||||||||||||||||||||||
| 1401/1413 Research Boulevard | 12/23/24 | 2.70% | 3.33% | $ | 28,500 | $ | 28,146 | 65.0% | ||||||||||||||||||||||||||||||||||||
1655 and 1725 Third Street | 3/10/25 | 4.50% | 4.57% | 600,000 | 599,081 | 10.0% | ||||||||||||||||||||||||||||||||||||||
| 101 West Dickman Street | 11/10/26 | SOFR+1.95% | (3) | 6.38% | 26,750 | 11,575 | 57.9% | |||||||||||||||||||||||||||||||||||||
| 1450 Research Boulevard | 12/10/26 | SOFR+1.95% | (3) | 6.44% | 13,000 | 3,802 | 73.2% | |||||||||||||||||||||||||||||||||||||
| $ | 668,250 | $ | 642,604 | |||||||||||||||||||||||||||||||||||||||||
| Summary of Debt (continued) | | ||||
December 31, 2022 | |||||
| (Dollars in thousands) | |||||
| Debt | Stated Rate | Interest Rate(1) | Maturity Date(2) | Principal Payments Remaining for the Periods Ending December 31, | Principal | Unamortized (Deferred Financing Cost), (Discount)/Premium | Total | |||||||||||||||||||||||||||||||||||||||||||||||||||||||||||||||||||||||||
| 2023 | 2024 | 2025 | 2026 | 2027 | Thereafter | |||||||||||||||||||||||||||||||||||||||||||||||||||||||||||||||||||||||||||
Secured notes payable | ||||||||||||||||||||||||||||||||||||||||||||||||||||||||||||||||||||||||||||||||
Greater Boston(3) | SOFR+2.70 | % | 6.75 | % | 11/19/26 | $ | — | $ | — | $ | — | $ | 59,717 | $ | — | $ | — | $ | 59,717 | $ | (1,321) | $ | 58,396 | |||||||||||||||||||||||||||||||||||||||||||||||||||||||||
| San Francisco Bay Area | 6.50 | % | 6.50 | 7/1/36 | 30 | 32 | 34 | 36 | 38 | 479 | 649 | — | 649 | |||||||||||||||||||||||||||||||||||||||||||||||||||||||||||||||||||
Secured debt weighted-average interest rate/subtotal | 6.75 | 30 | 32 | 34 | 59,753 | 38 | 479 | 60,366 | (1,321) | 59,045 | ||||||||||||||||||||||||||||||||||||||||||||||||||||||||||||||||||||||
Unsecured senior line of credit and commercial paper program(4) | (4) | N/A | (4) | 1/22/28 | (4) | (4) | — | — | — | — | — | (4) | — | — | — | |||||||||||||||||||||||||||||||||||||||||||||||||||||||||||||||||
Unsecured senior notes payable | 3.45 | % | 3.62 | 4/30/25 | — | — | 600,000 | — | — | — | 600,000 | (2,061) | 597,939 | |||||||||||||||||||||||||||||||||||||||||||||||||||||||||||||||||||
Unsecured senior notes payable | 4.30 | % | 4.50 | 1/15/26 | — | — | — | 300,000 | — | — | 300,000 | (1,507) | 298,493 | |||||||||||||||||||||||||||||||||||||||||||||||||||||||||||||||||||
Unsecured senior notes payable – green bond | 3.80 | % | 3.96 | 4/15/26 | — | — | — | 350,000 | — | — | 350,000 | (1,631) | 348,369 | |||||||||||||||||||||||||||||||||||||||||||||||||||||||||||||||||||
Unsecured senior notes payable | 3.95 | % | 4.13 | 1/15/27 | — | — | — | — | 350,000 | — | 350,000 | (2,074) | 347,926 | |||||||||||||||||||||||||||||||||||||||||||||||||||||||||||||||||||
Unsecured senior notes payable | 3.95 | % | 4.07 | 1/15/28 | — | — | — | — | — | 425,000 | 425,000 | (2,152) | 422,848 | |||||||||||||||||||||||||||||||||||||||||||||||||||||||||||||||||||
Unsecured senior notes payable | 4.50 | % | 4.60 | 7/30/29 | — | — | — | — | — | 300,000 | 300,000 | (1,469) | 298,531 | |||||||||||||||||||||||||||||||||||||||||||||||||||||||||||||||||||
Unsecured senior notes payable | 2.75 | % | 2.87 | 12/15/29 | — | — | — | — | — | 400,000 | 400,000 | (2,879) | 397,121 | |||||||||||||||||||||||||||||||||||||||||||||||||||||||||||||||||||
Unsecured senior notes payable | 4.70 | % | 4.81 | 7/1/30 | — | — | — | — | — | 450,000 | 450,000 | (2,796) | 447,204 | |||||||||||||||||||||||||||||||||||||||||||||||||||||||||||||||||||
Unsecured senior notes payable | 4.90 | % | 5.05 | 12/15/30 | — | — | — | — | — | 700,000 | 700,000 | (6,290) | 693,710 | |||||||||||||||||||||||||||||||||||||||||||||||||||||||||||||||||||
Unsecured senior notes payable | 3.375 | % | 3.48 | 8/15/31 | — | — | — | — | — | 750,000 | 750,000 | (5,628) | 744,372 | |||||||||||||||||||||||||||||||||||||||||||||||||||||||||||||||||||
| Unsecured senior notes payable – green bond | 2.00 | % | 2.12 | 5/18/32 | — | — | — | — | — | 900,000 | 900,000 | (8,802) | 891,198 | |||||||||||||||||||||||||||||||||||||||||||||||||||||||||||||||||||
Unsecured senior notes payable | 1.875 | % | 1.97 | 2/1/33 | — | — | — | — | — | 1,000,000 | 1,000,000 | (8,840) | 991,160 | |||||||||||||||||||||||||||||||||||||||||||||||||||||||||||||||||||
| Unsecured senior notes payable – green bond | 2.95 | % | 3.07 | 3/15/34 | — | — | — | — | — | 800,000 | 800,000 | (8,737) | 791,263 | |||||||||||||||||||||||||||||||||||||||||||||||||||||||||||||||||||
Unsecured senior notes payable | 4.85 | % | 4.93 | 4/15/49 | — | — | — | — | — | 300,000 | 300,000 | (3,102) | 296,898 | |||||||||||||||||||||||||||||||||||||||||||||||||||||||||||||||||||
Unsecured senior notes payable | 4.00 | % | 3.91 | 2/1/50 | — | — | — | — | — | 700,000 | 700,000 | 10,222 | 710,222 | |||||||||||||||||||||||||||||||||||||||||||||||||||||||||||||||||||
Unsecured senior notes payable | 3.00 | % | 3.08 | 5/18/51 | — | — | — | — | — | 850,000 | 850,000 | (11,988) | 838,012 | |||||||||||||||||||||||||||||||||||||||||||||||||||||||||||||||||||
Unsecured senior notes payable | 3.55 | % | 3.63 | 3/15/52 | — | — | — | — | — | 1,000,000 | 1,000,000 | (14,549) | 985,451 | |||||||||||||||||||||||||||||||||||||||||||||||||||||||||||||||||||
| Unsecured debt weighted average/subtotal | 3.51 | — | — | 600,000 | 650,000 | 350,000 | 8,575,000 | 10,175,000 | (74,283) | 10,100,717 | ||||||||||||||||||||||||||||||||||||||||||||||||||||||||||||||||||||||
Weighted-average interest rate/total | 3.53 | % | $ | 30 | $ | 32 | $ | 600,034 | $ | 709,753 | $ | 350,038 | $ | 8,575,479 | $ | 10,235,366 | $ | (75,604) | $ | 10,159,762 | ||||||||||||||||||||||||||||||||||||||||||||||||||||||||||||
Balloon payments | $ | — | $ | — | $ | 600,000 | $ | 709,717 | $ | 350,000 | $ | 8,575,068 | $ | 10,234,785 | $ | — | $ | 10,234,785 | ||||||||||||||||||||||||||||||||||||||||||||||||||||||||||||||
Principal amortization | 30 | 32 | 34 | 36 | 38 | 411 | 581 | (75,604) | (75,023) | |||||||||||||||||||||||||||||||||||||||||||||||||||||||||||||||||||||||
| Total debt | $ | 30 | $ | 32 | $ | 600,034 | $ | 709,753 | $ | 350,038 | $ | 8,575,479 | $ | 10,235,366 | $ | (75,604) | $ | 10,159,762 | ||||||||||||||||||||||||||||||||||||||||||||||||||||||||||||||
| Fixed-rate debt | $ | 30 | $ | 32 | $ | 600,034 | $ | 650,036 | $ | 350,038 | $ | 8,575,479 | $ | 10,175,649 | $ | (74,283) | $ | 10,101,366 | ||||||||||||||||||||||||||||||||||||||||||||||||||||||||||||||
| Variable-rate debt | — | — | — | 59,717 | — | — | 59,717 | (1,321) | 58,396 | |||||||||||||||||||||||||||||||||||||||||||||||||||||||||||||||||||||||
Total debt | $ | 30 | $ | 32 | $ | 600,034 | $ | 709,753 | $ | 350,038 | $ | 8,575,479 | $ | 10,235,366 | $ | (75,604) | $ | 10,159,762 | ||||||||||||||||||||||||||||||||||||||||||||||||||||||||||||||
Weighted-average stated rate on maturing debt | N/A | N/A | 3.45% | 3.92% | 3.95% | 3.33% | ||||||||||||||||||||||||||||||||||||||||||||||||||||||||||||||||||||||||||
| |||||
| Definitions and Reconciliations | |||||
December 31, 2022 | |||||
| Three Months Ended | |||||||||||||||||||||||||||||
(Dollars in thousands) | 12/31/22 | 9/30/22 | 6/30/22 | 3/31/22 | 12/31/21 | ||||||||||||||||||||||||
| Net income (loss) | $ | 95,268 | $ | 383,443 | $ | 309,382 | $ | (117,392) | $ | 99,796 | |||||||||||||||||||
Interest expense | 17,522 | 22,984 | 24,257 | 29,440 | 34,862 | ||||||||||||||||||||||||
Income taxes | 2,063 | 1,950 | 2,089 | 3,571 | 4,156 | ||||||||||||||||||||||||
| Depreciation and amortization | 264,480 | 254,929 | 242,078 | 240,659 | 239,254 | ||||||||||||||||||||||||
| Stock compensation expense | 11,586 | 17,786 | 14,340 | 14,028 | 14,253 | ||||||||||||||||||||||||
Loss on early extinguishment of debt | — | — | 3,317 | — | — | ||||||||||||||||||||||||
| Gain on sales of real estate | — | (323,699) | (214,219) | — | (124,226) | ||||||||||||||||||||||||
| Unrealized losses on non-real estate investments | 24,117 | 56,515 | 68,128 | 263,433 | 139,716 | ||||||||||||||||||||||||
Impairment of real estate | 26,186 | 38,783 | — | — | — | ||||||||||||||||||||||||
| Impairment of non-real estate investments | 20,512 | — | — | — | — | ||||||||||||||||||||||||
Adjusted EBITDA | $ | 461,734 | $ | 452,691 | $ | 449,372 | $ | 433,739 | $ | 407,811 | |||||||||||||||||||
| Total revenues | $ | 670,281 | $ | 659,852 | $ | 643,764 | $ | 615,065 | $ | 576,923 | |||||||||||||||||||
Adjusted EBITDA margin | 69% | 69% | 70% | 71% | 71% | ||||||||||||||||||||||||
| |||||
| Definitions and Reconciliations (continued) | |||||
December 31, 2022 | |||||
| Space Intentionally Blank | |||||
| |||||
| Definitions and Reconciliations (continued) | |||||
December 31, 2022 | |||||
| Three Months Ended | |||||||||||||||||||||||||||||
| (Dollars in thousands) | 12/31/22 | 9/30/22 | 6/30/22 | 3/31/22 | 12/31/21 | ||||||||||||||||||||||||
| Adjusted EBITDA | $ | 461,734 | $ | 452,691 | $ | 449,372 | $ | 433,739 | $ | 407,811 | |||||||||||||||||||
Interest expense | $ | 17,522 | $ | 22,984 | $ | 24,257 | $ | 29,440 | $ | 34,862 | |||||||||||||||||||
| Capitalized interest | 79,491 | 73,189 | 68,202 | 57,763 | 44,078 | ||||||||||||||||||||||||
| Amortization of loan fees | (3,975) | (3,235) | (3,236) | (3,103) | (2,911) | ||||||||||||||||||||||||
| Amortization of debt (discounts) premiums | (272) | (269) | (267) | 424 | 502 | ||||||||||||||||||||||||
| Cash interest and fixed charges | $ | 92,766 | $ | 92,669 | $ | 88,956 | $ | 84,524 | $ | 76,531 | |||||||||||||||||||
Fixed-charge coverage ratio: | |||||||||||||||||||||||||||||
| – quarter annualized | 5.0x | 4.9x | 5.1x | 5.1x | 5.3x | ||||||||||||||||||||||||
| – trailing 12 months | 5.0x | 5.1x | 5.1x | 5.1x | 5.0x | ||||||||||||||||||||||||
| Noncontrolling Interest Share of Consolidated Real Estate JVs | Our Share of Unconsolidated Real Estate JVs | ||||||||||||||||||||||
| December 31, 2022 | December 31, 2022 | ||||||||||||||||||||||
| (In thousands) | Three Months Ended | Year Ended | Three Months Ended | Year Ended | |||||||||||||||||||
| Net income | $ | 40,949 | $ | 149,041 | $ | 172 | $ | 645 | |||||||||||||||
| Depreciation and amortization of real estate assets | 29,702 | 107,591 | 982 | 3,666 | |||||||||||||||||||
| Funds from operations | $ | 70,651 | $ | 256,632 | $ | 1,154 | $ | 4,311 | |||||||||||||||
| (In thousands) | 12/31/22 | 9/30/22 | 6/30/22 | 3/31/22 | 12/31/21 | ||||||||||||||||||||||||
| Total assets | $ | 35,523,399 | $ | 34,368,614 | $ | 33,244,053 | $ | 32,844,256 | $ | 30,219,373 | |||||||||||||||||||
| Accumulated depreciation | 4,354,063 | 4,148,230 | 4,060,536 | 3,951,666 | 3,771,241 | ||||||||||||||||||||||||
| Gross assets | $ | 39,877,462 | $ | 38,516,844 | $ | 37,304,589 | $ | 36,795,922 | $ | 33,990,614 | |||||||||||||||||||
| |||||
| Definitions and Reconciliations (continued) | |||||
December 31, 2022 | |||||
| Space Intentionally Blank | |||||
| Statements of Operations | ||||||||||||||||||||
| Balance Sheet | Gains and Losses | |||||||||||||||||||
| Carrying Amount | Unrealized | Realized | ||||||||||||||||||
| Difference between proceeds received upon disposition and historical cost | ||||||||||||||||||||
Publicly traded companies | Fair value | Changes in fair value | ||||||||||||||||||
Privately held entities without readily determinable fair values that: | ||||||||||||||||||||
| Report NAV | Fair value, using NAV as a practical expedient | Changes in NAV, as a practical expedient to fair value | ||||||||||||||||||
| Do not report NAV | Cost, adjusted for observable price changes and impairments(1) | Observable price changes(1) | Impairments to reduce costs to fair value, which result in an adjusted cost basis and the differences between proceeds received upon disposition and adjusted or historical cost | |||||||||||||||||
| Equity method investments | Contributions, adjusted for our share of the investee’s earnings or losses, less distributions received, reduced by other-than-temporary impairments | Our share of unrealized gains or losses reported by the investee | Our share of realized gains or losses reported by the investee, and other-than-temporary impairments | |||||||||||||||||
| (In thousands) | Investments in Real Estate | ||||||||||
| Gross investments in real estate – North America | $ | 34,283,456 | |||||||||
| Less: accumulated depreciation – North America | (4,349,780) | ||||||||||
| Net investments in real estate – North America | 29,933,676 | ||||||||||
| Net investments in real estate – Asia | 11,764 | ||||||||||
| Investments in real estate | $ | 29,945,440 | |||||||||
| |||||
| Definitions and Reconciliations (continued) | |||||
December 31, 2022 | |||||
| Dev/ Redev | RSF of Lease Expirations Targeted for Development and Redevelopment | |||||||||||||||||||||||||||||||
| Property/Submarket | 2023 | 2024 | Thereafter(1) | Total | ||||||||||||||||||||||||||||
| Near-term projects: | ||||||||||||||||||||||||||||||||
| 100 Edwin H. Land Boulevard/Cambridge/Inner Suburbs | Redev | — | 104,500 | — | 104,500 | |||||||||||||||||||||||||||
| 40 Sylvan Road/Route 128 | Redev | 312,845 | — | — | 312,845 | |||||||||||||||||||||||||||
| 275 Grove Street/Route 128 | Redev | — | — | 160,251 | 160,251 | |||||||||||||||||||||||||||
| 840 Winter Street/Route 128 | Redev | 10,265 | 17,965 | — | 28,230 | |||||||||||||||||||||||||||
| 3301 Monte Villa Parkway/Bothell | Redev | — | 50,552 | — | 50,552 | |||||||||||||||||||||||||||
| 323,110 | 173,017 | 160,251 | 656,378 | |||||||||||||||||||||||||||||
| Intermediate-term projects: | ||||||||||||||||||||||||||||||||
| 219 East 42nd Street/New York City | Dev | — | 349,947 | — | 349,947 | |||||||||||||||||||||||||||
| 10975 and 10995 Torreyana Road/Torrey Pines | Dev | — | 84,829 | — | 84,829 | |||||||||||||||||||||||||||
| — | 434,776 | — | 434,776 | |||||||||||||||||||||||||||||
| Future projects: | ||||||||||||||||||||||||||||||||
| 311 Arsenal Street/Cambridge/Inner Suburbs | Redev | — | — | 308,446 | 308,446 | |||||||||||||||||||||||||||
| 550 Arsenal Street/Cambridge/Inner Suburbs | Dev | — | — | 260,867 | 260,867 | |||||||||||||||||||||||||||
| 446 and 458 Arsenal Street/Cambridge/Inner Suburbs | Dev | — | — | 38,200 | 38,200 | |||||||||||||||||||||||||||
| 380 and 420 E Street/Seaport Innovation District | Dev | — | — | 195,506 | 195,506 | |||||||||||||||||||||||||||
| Other/Greater Boston | Redev | — | — | 167,549 | 167,549 | |||||||||||||||||||||||||||
| 1122 and 1150 El Camino Real/South San Francisco | Dev | — | — | 655,172 | 655,172 | |||||||||||||||||||||||||||
| 3875 Fabian Way/Greater Stanford | Dev | — | — | 228,000 | 228,000 | |||||||||||||||||||||||||||
| 960 Industrial Road/Greater Stanford | Dev | — | — | 110,000 | 110,000 | |||||||||||||||||||||||||||
| Campus Point by Alexandria/University Town Center | Dev | — | 495,192 | — | 495,192 | |||||||||||||||||||||||||||
| Sequence District by Alexandria/Sorrento Mesa | Dev/Redev | — | — | 688,034 | 688,034 | |||||||||||||||||||||||||||
| 4025 and 4045 Sorrento Valley Boulevard/Sorrento Valley | Dev | — | — | 22,886 | 22,886 | |||||||||||||||||||||||||||
| 601 Dexter Avenue North/Lake Union | Dev | 18,680 | — | — | 18,680 | |||||||||||||||||||||||||||
| 830 4th Avenue South/SoDo | Dev | — | — | 42,380 | 42,380 | |||||||||||||||||||||||||||
| Other/Seattle | Dev | — | — | 102,437 | 102,437 | |||||||||||||||||||||||||||
| 1020 Red River Street/Austin | Redev | — | 126,034 | — | 126,034 | |||||||||||||||||||||||||||
| 18,680 | 621,226 | 2,819,477 | 3,459,383 | |||||||||||||||||||||||||||||
| 341,790 | 1,229,019 | 2,979,728 | 4,550,537 | |||||||||||||||||||||||||||||
| |||||
| Definitions and Reconciliations (continued) | |||||
December 31, 2022 | |||||
| Operating RSF | ||||||||
| Mega campus | 28,554,356 | |||||||
| Non-mega campus | 13,219,366 | |||||||
| Total | 41,773,722 | |||||||
| Mega campus RSF as a percentage of total operating property RSF | 68 | % | ||||||
| (Dollars in thousands) | 12/31/22 | 9/30/22 | 6/30/22 | 3/31/22 | 12/31/21 | |||||||||||||||||||||||||||
| Secured notes payable | $ | 59,045 | $ | 40,594 | $ | 24,986 | $ | 208,910 | $ | 205,198 | ||||||||||||||||||||||
| Unsecured senior notes payable | 10,100,717 | 10,098,588 | 10,096,462 | 10,094,337 | 8,316,678 | |||||||||||||||||||||||||||
| Unsecured senior line of credit and commercial paper | — | 386,666 | 149,958 | — | 269,990 | |||||||||||||||||||||||||||
| Unamortized deferred financing costs | 74,918 | 76,947 | 78,978 | 81,175 | 65,476 | |||||||||||||||||||||||||||
| Cash and cash equivalents | (825,193) | (533,824) | (420,258) | (775,060) | (361,348) | |||||||||||||||||||||||||||
| Restricted cash | (32,782) | (332,344) | (97,404) | (95,106) | (53,879) | |||||||||||||||||||||||||||
| Preferred stock | — | — | — | — | — | |||||||||||||||||||||||||||
| Net debt and preferred stock | $ | 9,376,705 | $ | 9,736,627 | $ | 9,832,722 | $ | 9,514,256 | $ | 8,442,115 | ||||||||||||||||||||||
| Adjusted EBITDA: | ||||||||||||||||||||||||||||||||
| – quarter annualized | $ | 1,846,936 | $ | 1,810,764 | $ | 1,797,488 | $ | 1,734,956 | $ | 1,631,244 | ||||||||||||||||||||||
| – trailing 12 months | $ | 1,797,536 | $ | 1,743,613 | $ | 1,680,335 | $ | 1,601,857 | $ | 1,517,838 | ||||||||||||||||||||||
| Net debt and preferred stock to Adjusted EBITDA: | ||||||||||||||||||||||||||||||||
| – quarter annualized | 5.1 | x | 5.4 | x | 5.5 | x | 5.5 | x | 5.2 | x | ||||||||||||||||||||||
| – trailing 12 months | 5.2 | x | 5.6 | x | 5.9 | x | 5.9 | x | 5.6 | x | ||||||||||||||||||||||
| Space Intentionally Blank | |||||
| |||||
| Definitions and Reconciliations (continued) | |||||
December 31, 2022 | |||||
| Three Months Ended | Year Ended | |||||||||||||||||||||||||
| (Dollars in thousands) | 12/31/22 | 12/31/21 | 12/31/22 | 12/31/21 | ||||||||||||||||||||||
| Net income | $ | 95,268 | $ | 99,796 | $ | 670,701 | $ | 654,282 | ||||||||||||||||||
| Equity in earnings of unconsolidated real estate joint ventures | (172) | (3,018) | (645) | (12,255) | ||||||||||||||||||||||
General and administrative expenses | 42,992 | 41,654 | 177,278 | 151,461 | ||||||||||||||||||||||
| Interest expense | 17,522 | 34,862 | 94,203 | 142,165 | ||||||||||||||||||||||
Depreciation and amortization | 264,480 | 239,254 | 1,002,146 | 821,061 | ||||||||||||||||||||||
Impairment of real estate | 26,186 | — | 64,969 | 52,675 | ||||||||||||||||||||||
Loss on early extinguishment of debt | — | — | 3,317 | 67,253 | ||||||||||||||||||||||
| Gain on sales of real estate | — | (124,226) | (537,918) | (126,570) | ||||||||||||||||||||||
| Investment loss (income) | 19,653 | 112,884 | 331,758 | (259,477) | ||||||||||||||||||||||
| Net operating income | 465,929 | 401,206 | 1,805,809 | 1,490,595 | ||||||||||||||||||||||
Straight-line rent revenue | (24,185) | (25,942) | (118,003) | (115,145) | ||||||||||||||||||||||
Amortization of acquired below-market leases | (20,125) | (15,737) | (74,346) | (54,780) | ||||||||||||||||||||||
| Net operating income (cash basis) | $ | 421,619 | $ | 359,527 | $ | 1,613,460 | $ | 1,320,670 | ||||||||||||||||||
Net operating income (cash basis) – annualized | $ | 1,686,476 | $ | 1,438,108 | $ | 1,613,460 | $ | 1,320,670 | ||||||||||||||||||
| Net operating income (from above) | $ | 465,929 | $ | 401,206 | $ | 1,805,809 | $ | 1,490,595 | ||||||||||||||||||
| Total revenues | $ | 670,281 | $ | 576,923 | $ | 2,588,962 | $ | 2,114,150 | ||||||||||||||||||
| Operating margin | 70% | 70% | 70% | 71% | ||||||||||||||||||||||
| |||||
| Definitions and Reconciliations (continued) | |||||
December 31, 2022 | |||||
| Space Intentionally Blank | |||||
Redevelopment – placed into | |||||||||||||||||||||||
| Development – under construction | Properties | service after January 1, 2021 | Properties | ||||||||||||||||||||
| 4 Davis Drive | 1 | 700 Quince Orchard Road | 1 | ||||||||||||||||||||
| 201 Brookline Avenue | 1 | 3160 Porter Drive | 1 | ||||||||||||||||||||
| 15 Necco Street | 1 | 5505 Morehouse Drive | 1 | ||||||||||||||||||||
| 751 Gateway Boulevard | 1 | The Arsenal on the Charles | 11 | ||||||||||||||||||||
| 325 Binney Street | 1 | 30-02 48th Avenue | 1 | ||||||||||||||||||||
| 1150 Eastlake Avenue East | 1 | Other | 1 | ||||||||||||||||||||
| 9810 Darnestown Road | 1 | 16 | |||||||||||||||||||||
| 99 Coolidge Avenue | 1 | Acquisitions after January 1, 2021 | Properties | ||||||||||||||||||||
| 500 North Beacon Street and 4 Kingsbury Avenue | 2 | 3301, 3303, 3305, 3307, 3420, and 3440 Hillview Avenue | 6 | ||||||||||||||||||||
| 9808 Medical Center Drive | 1 | Sequence District by Alexandria | 5 | ||||||||||||||||||||
| 6040 George Watts Hill Drive | 1 | Alexandria Center® for Life Science – Fenway | 1 | ||||||||||||||||||||
| 1450 Owens Street | 1 | ||||||||||||||||||||||
| 10075 Barnes Canyon Road | 1 | 550 Arsenal Street | 1 | ||||||||||||||||||||
| 14 | 1501-1599 Industrial Road | 6 | |||||||||||||||||||||
Development – placed into | One Investors Way | 2 | |||||||||||||||||||||
service after January 1, 2021 | Properties | 2475 Hanover Street | 1 | ||||||||||||||||||||
| 1165 Eastlake Avenue East | 1 | 10975 and 10995 Torreyana Road | 2 | ||||||||||||||||||||
| 201 Haskins Way | 1 | Pacific Technology Park | 5 | ||||||||||||||||||||
| 825 and 835 Industrial Road | 2 | 1122 and 1150 El Camino Real | 2 | ||||||||||||||||||||
| 9950 Medical Center Drive | 1 | 12 Davis Drive | 1 | ||||||||||||||||||||
| 3115 Merryfield Row | 1 | 8505 Costa Verde Boulevard and 4260 Nobel Drive | 2 | ||||||||||||||||||||
| 8 and 10 Davis Drive | 2 | ||||||||||||||||||||||
| 5 and 9 Laboratory Drive | 2 | 225 and 235 Presidential Way | 2 | ||||||||||||||||||||
| 10055 Barnes Canyon Road | 1 | 104 TW Alexander Drive | 4 | ||||||||||||||||||||
| 10102 Hoyt Park Drive | 1 | One Hampshire Street | 1 | ||||||||||||||||||||
| 12 | Intersection Campus | 12 | |||||||||||||||||||||
| Redevelopment – under construction | Properties | 100 Edwin H. Land Boulevard | 1 | ||||||||||||||||||||
| 2400 Ellis Road, 40 and 41 Moore Drive, and 14 TW Alexander Drive | 4 | 10010 and 10140 Campus Point Drive and 4275 Campus Point Court | 3 | ||||||||||||||||||||
| 840 Winter Street | 1 | 446 and 458 Arsenal Street | 2 | ||||||||||||||||||||
| 20400 Century Boulevard | 1 | 35 Gatehouse Drive | 1 | ||||||||||||||||||||
| 9601 and 9603 Medical Center Drive | 2 | 1001 Trinity Street and 1020 Red River Street | 2 | ||||||||||||||||||||
| One Rogers Street | 1 | ||||||||||||||||||||||
| 40, 50, and 60 Sylvan Road | 3 | Other | 37 | ||||||||||||||||||||
Alexandria Center® for Advanced Technologies – Monte Villa Parkway | 6 | 99 | |||||||||||||||||||||
| Unconsolidated real estate JVs | 4 | ||||||||||||||||||||||
| 651 Gateway Boulevard | 1 | Properties held for sale | 10 | ||||||||||||||||||||
| 8800 Technology Forest Place | 1 | Total properties excluded from same properties | 179 | ||||||||||||||||||||
| Canada | 2 | ||||||||||||||||||||||
| Other | 2 | Same properties | 253 | ||||||||||||||||||||
| 24 | Total properties in North America as of December 31, 2022 | 432 | |||||||||||||||||||||
| |||||
| Definitions and Reconciliations (continued) | |||||
December 31, 2022 | |||||
| Three Months Ended | Year Ended | ||||||||||||||||||||||||||||||||||||||||
| (In thousands) | 12/31/22 | 9/30/22 | 6/30/22 | 3/31/22 | 12/31/21 | 12/31/22 | 12/31/21 | ||||||||||||||||||||||||||||||||||
| Income from rentals | $ | 665,674 | $ | 656,853 | $ | 640,959 | $ | 612,554 | $ | 574,656 | $ | 2,576,040 | $ | 2,108,249 | |||||||||||||||||||||||||||
| Rental revenues | (499,348) | (496,146) | (485,067) | (469,537) | (435,637) | (1,950,098) | (1,618,592) | ||||||||||||||||||||||||||||||||||
| Tenant recoveries | $ | 166,326 | $ | 160,707 | $ | 155,892 | $ | 143,017 | $ | 139,019 | $ | 625,942 | $ | 489,657 | |||||||||||||||||||||||||||
| Three Months Ended | |||||||||||||||||||||||||||||
(Dollars in thousands) | 12/31/22 | 9/30/22 | 6/30/22 | 3/31/22 | 12/31/21 | ||||||||||||||||||||||||
Unencumbered net operating income | $ | 464,944 | $ | 457,656 | $ | 446,473 | $ | 420,960 | $ | 390,017 | |||||||||||||||||||
Encumbered net operating income | 985 | 1,007 | 1,007 | 12,777 | 11,189 | ||||||||||||||||||||||||
| Total net operating income | $ | 465,929 | $ | 458,663 | $ | 447,480 | $ | 433,737 | $ | 401,206 | |||||||||||||||||||
Unencumbered net operating income as a percentage of total net operating income | 100% | 100% | 100% | 97% | 97% | ||||||||||||||||||||||||
| Space Intentionally Blank | |||||
| |||||
| Definitions and Reconciliations (continued) | |||||
December 31, 2022 | |||||
| Three Months Ended | Year Ended | ||||||||||||||||||||||||||||||||||||||||
| (In thousands) | 12/31/22 | 9/30/22 | 6/30/22 | 3/31/22 | 12/31/21 | 12/31/22 | 12/31/21 | ||||||||||||||||||||||||||||||||||
| Basic shares for earnings per share | 165,393 | 161,554 | 161,412 | 158,198 | 153,464 | 161,659 | 146,921 | ||||||||||||||||||||||||||||||||||
| Forward Agreements | — | — | — | — | 843 | — | 539 | ||||||||||||||||||||||||||||||||||
| Diluted shares for earnings per share | 165,393 | 161,554 | 161,412 | 158,198 | 154,307 | 161,659 | 147,460 | ||||||||||||||||||||||||||||||||||
| Basic shares for funds from operations per share and funds from operations per share, as adjusted | 165,393 | 161,554 | 161,412 | 158,198 | 153,464 | 161,659 | 146,921 | ||||||||||||||||||||||||||||||||||
| Forward Agreements | — | — | — | 11 | 843 | — | 539 | ||||||||||||||||||||||||||||||||||
| Diluted shares for funds from operations per share and funds from operations per share, as adjusted | 165,393 | 161,554 | 161,412 | 158,209 | 154,307 | 161,659 | 147,460 | ||||||||||||||||||||||||||||||||||
| Unvested restricted shares used in the allocation of net income, funds from operations, and funds from operations, as adjusted | 1,614 | 1,648 | 1,806 | 1,826 | 1,813 | 1,723 | 1,782 | ||||||||||||||||||||||||||||||||||