The Union Street Partners Value Fund (the “Fund”) seeks to achieve capital appreciation.
This table describes the fees and expenses that you may pay if you buy, hold and sell shares of the Fund. You may qualify for sales charge discounts if you and your family invest, or agree to invest in the future, at least $50,000 in the Fund. More information about these and other discounts is available from your financial professional and in the section “Distribution Arrangements” of this prospectus and in the section “Distribution” in the Fund’s statement of additional information.
Shareholder Fees - Union Street Partners Value Fund - USD ($) |
Class A Shares |
Class C Shares |
Advisor Class Shares |
|
|---|---|---|---|---|
| Maximum sales charge (load) | 5.75% | none | none | |
| Maximum deferred sales charges (load) (as a percentage of the net asset value at time of purchase) | none | [1] | 1.00% | none |
| Redemption Fee | none | [2] | none | none |
| Exchange Fee | none | none | none | |
| [1] | With respect to certain purchases made without the imposition of a sales charge at the time of purchase, you may be charged a 1.00% contingent deferred sales charge on Class A shares if you redeem your shares less than 1 year after you purchase them. |
| [2] | If the Fund waives the contingent deferred sales charge on your purchase of Class A shares in order to qualify the Fund for inclusion in certain brokerage platforms, wrap programs and fund supermarkets, you will be subject to a 1.00% redemption fee if you redeem your shares less than 1 year after you purchase them. |
Annual Fund Operating Expenses - Union Street Partners Value Fund |
Class A Shares |
Class C Shares |
Advisor Class Shares |
|
|---|---|---|---|---|
| Management Fee | 1.00% | 1.00% | 1.00% | |
| Distribution (12b-1) and Service Fees | 0.25% | 1.00% | none | |
| Other Expenses | [1] | 0.51% | 0.50% | 0.51% |
| Shareholder Services Plan | 0.03% | 0.04% | 0.10% | |
| Total Annual Fund Operating Expenses | 1.79% | 2.54% | 1.61% | |
| Fee Waivers and/or Expense Reimbursements | [1] | (0.29%) | (0.29%) | (0.36%) |
| Total Annual Fund Operating Expenses (after fee waivers and expense reimbursements) | [1] | 1.50% | 2.25% | 1.25% |
| [1] | Union Street Partners, LLC (the “Adviser”) entered into a written expense limitation agreement under which it has agreed to limit the total expenses of the Fund (exclusive of interest, distribution fees pursuant to Rule 12b-1 Plans, taxes, acquired fund fees and expenses, brokerage commissions, extraordinary expenses and dividend expense on short sales) to an annual rate of 1.25% of the average daily net assets of the Fund. The Trust and the Adviser may terminate the expense limitation agreement prior to January 31, 2024 only by mutual written consent. Each fee waiver and/or reimbursement of an expense by the Adviser is subject to repayment by the Fund within three years following the date such waiver and/or reimbursement was made, provided that the Fund is able to make the repayment without exceeding the expense limitation in place at the time of the waiver or reimbursement and at the time the waiver or reimbursement is recouped. |
This example is intended to help you compare the cost of investing in the Fund with the cost of investing in other mutual funds. The example assumes that you invest $10,000 in the Fund for the time periods indicated and then redeem all of your shares at the end of those periods. The example also assumes that your investment has a 5% return each year and that the Fund’s operating expenses remain the same. The effect of the Adviser’s agreement to waive fees and/or reimburse expenses is only reflected in the first year of each example shown below. Although your actual costs may be higher or lower, based on these assumptions your costs would be:
Expense Example - Union Street Partners Value Fund - USD ($) |
Expense Example, with Redemption, 1 Year |
Expense Example, with Redemption, 3 Years |
Expense Example, with Redemption, 5 Years |
Expense Example, with Redemption, 10 Years |
|
|---|---|---|---|---|---|
| Class A Shares | 719 | 1,079 | 1,463 | 2,537 | |
| Class C Shares | 328 | [1] | 763 | 1,325 | 2,854 |
| Advisor Class Shares | 127 | 473 | 842 | 1,881 | |
| [1] | If you did not redeem your shares, your cost would be $228 for the one-year period. |
The Fund pays transaction costs, such as commissions, when it buys and sells securities (or “turns over” its portfolio). A higher portfolio turnover rate may indicate higher transaction costs and may result in higher taxes when Fund shares are held in a taxable account. These costs, which are not reflected in Total Annual Fund Operating Expenses or in the example, affect the Fund’s performance. During the Fund’s most recent fiscal year ended September 30, 2022, the Fund’s portfolio turnover rate was 18.43% of the average value of its portfolio.
Under normal market conditions, the Fund will invest primarily in the equity securities of large capitalization (“large-cap”) U.S. companies. The Fund defines a large-cap company as one whose market capitalization is $5 billion or greater at the time of purchase. The Fund will normally hold a core position of between 25 and 30 securities. The number of securities held by the Fund may occasionally exceed this range at times, such as when the portfolio managers are accumulating new positions, phasing out and replacing existing positions, or responding to exceptional market conditions.
Equity securities consist of common stock, depositary receipts (including American Depositary Receipts (“ADRs”), European Depositary Receipts (“EDRs”), Global Depositary Receipts (“GDRs”) and unsponsored depositary receipts), real estate investment trusts (“REITs”), master limited partnerships (“MLPs”), and securities convertible into common stock, such as warrants, rights, convertible bonds, debentures and convertible preferred stocks. ADRs are receipts typically issued by an American bank or trust company that evidence underlying securities issued by a foreign corporation. EDRs (issued in Europe) and GDRs (issued throughout the world) each evidence a similar ownership arrangement. MLPs are generally energy-related businesses and the Fund may invest in energy, real estate, and/or finance-related MLPs if the Adviser believes the business will deliver desirable returns.
The Fund may invest up to 20% of its net assets in high quality money market instruments and repurchase agreements. The Fund may also invest in shares of other registered investment companies, such as closed-end investment companies and exchange-traded funds (“ETFs”).
McGinn Investment Management, Inc. (the “Sub-Adviser”) utilizes a value approach to investing in that it selects investments for the Fund based on its belief that stock prices fluctuate around the true value of a company. The Sub-Adviser analyzes valuation ratios and typically selects stocks with low ratios of price/earnings, price/cash flow, price/book value and price/dividend.
The Sub-Adviser desires to produce superior risk adjusted returns by building portfolios of businesses with outstanding risk/reward profiles without running a high degree of capital risk. The Sub-Adviser only invests in those businesses it understands and where it has confidence in the company’s management and financial strength. Emphasis is placed on those companies which the Sub-Adviser believes are most likely to prosper under various economic conditions.
The Sub-Adviser sells or reduces the Fund’s position in a security (1) when it approaches the Sub-Adviser’s estimate of its fair value, (2) when its economic fundamentals have deteriorated, or (3) when the facts or the analysis surrounding the reason to originally put the security in the Fund’s portfolio have changed.
The Fund is a “non-diversified” fund, which means it can invest in fewer securities at any one time than a diversified fund. Also, from time to time the Fund may invest a significant portion of its assets in a limited number of industry sectors, but will not concentrate in any particular industry.
Risks of Investing in Common Stocks. Overall stock market risks may affect the value of the Fund. Factors such as domestic economic growth and market conditions, interest rate levels, and political events affect the securities markets. When the value of the Fund’s investments goes down, your investment in the Fund decreases in value and you could lose money.
Risks of Investing in Undervalued Securities. Undervalued securities are, by definition, out of favor with investors (meaning they have lost investors’ attention), and there is no way to predict when, if ever, the securities may return to favor.
Risk of Non-Diversification. The Fund is a non-diversified portfolio, which means that it has the ability to take larger positions in a smaller number of securities than a portfolio that is “diversified.” Non-diversification increases the risk that the value of the Fund could go down because of the poor performance of a single investment.
Risks of Investing in Investment Companies and ETFs. To the extent the Fund invests in other investment companies, the Fund will indirectly bear its proportionate share of any expenses (such as operating expenses and advisory fees) that may be paid by certain of the investment companies in which it invests. These expenses would be in addition to the advisory and other expenses that the Fund bears in connection with its own operations. In addition, investments in other investment companies, including ETFs, are subject to product specific risk and market risk. If the specific investments in which the investment company or ETF focuses its investments does not perform as expected, the value of the investment may decline. Similarly, to the extent the investment company or ETF is intended to replicate the performance of a particular index or benchmark and that index or benchmark does not perform as expected for any reason, the value of the investment in the investment company or ETF may decline.
When the Fund invests in other investment companies or ETFs, it will be subject to substantially the same risks as those associated with the direct ownership of securities comprising the underlying investment companies or ETFs or the index on which the other investment company or ETF is based and the value of the Fund’s investments will fluctuate in response to the performance and risks of the underlying investments or index.
MLP Risk. MLPs are generally considered interest-rate sensitive investments. During periods of interest rate volatility, these investments may not provide attractive returns. Depending on the state of interest rates in general, the use of MLPs could enhance or harm the overall performance of the Fund.
Repurchase Agreement Risk. The Fund’s investment in repurchase agreements may be subject to market and credit risk with respect to the collateral securing the repurchase agreements. Investments in repurchase agreements also may be subject to the risk that the market value of the underlying obligations may decline prior to the expiration date of the repurchase agreement term.
Risks of Investing in Convertible Securities. Most convertible securities are subject to the risks and price fluctuations of the underlying stock. They may be subject to the risk that the issuer will not be able to pay interest or dividends when due and their market value may change based on changes in the issuer’s credit rating or the market’s perception of the issuer’s creditworthiness.
Risk of Investing in REITs. REITs may be subject to certain risks associated with the direct ownership of real estate, including declines in the value of real estate, risks related to general and local economic conditions, overbuilding and increased competition, increases in property taxes and operating expenses, and variations in rental income.
Risk of Investing in Depositary Receipts. ADRs are dollar-denominated depositary receipts that typically are issued by a United States bank or trust company and represent the deposit with that bank or trust company of a security of a foreign issuer. Generally, ADRs are designed for trading on U.S. securities exchanges or other markets. ADRs may be sponsored or unsponsored. EDRs are issued in Europe and GDRs are issued throughout the world.
Although depositary receipts provide a convenient means to invest in non-U.S. securities, such investments involve risks generally similar to investments directly in foreign securities including the risk that there is often less publicly available information about foreign issuers, and there is the possibility of negative governmental actions and of political and social unrest. The issuers of unsponsored depositary receipts may not receive information from the foreign issuer, and it is under no obligation to distribute shareholder communications or other information received from the foreign issuer of the deposited securities or to pass through voting rights to the holders of the depositary receipts. Additionally, although depositary receipts have risks similar to the securities that they represent, they may involve higher expenses, may trade at a discount (or premium) to the underlying security, may not pass through voting and other shareholder rights, and may be less liquid than the underlying securities listed on an exchange. To the extent that the Fund invests in issuers (or depositary receipts of issuers) located in emerging markets, the foreign securities risk may be heightened.
Sector Risk. The Fund may emphasize investment in one or more particular business sectors at times, which may cause the value of its share price to be more susceptible to the financial, market, or economic events affecting issuers and industries within those sectors than a fund that does not emphasize investment in particular sectors. Economic or market factors, regulation or deregulation, and technological or other developments may negatively impact all companies in a particular sector and may increase the risk of loss of an investment in the Fund. This may increase the risk of loss associated with an investment in the Fund and increase the volatility of the Fund’s net asset value per share.
The bar chart and table below provide some indication of the risks of investing in the Fund by showing changes in the Fund’s performance from year to year and by showing how the Fund’s average annual returns for the periods indicated compare with those of a broad measure of market performance. The bar chart figures do not include sales charges that may have been paid when investors bought and sold shares of the Fund. If sales charges were included, the returns would be lower. The Fund’s past performance (before and after taxes) is not necessarily an indication of how the Fund will perform in the future. Updated performance information is available by calling toll-free 800-673-0550.
The following bar chart shows the annual returns for Class A shares of the Fund for each full calendar year of the Fund’s operations. The performance of the Fund’s Class C shares and Advisor Class shares will differ because the expenses of the Classes differ.
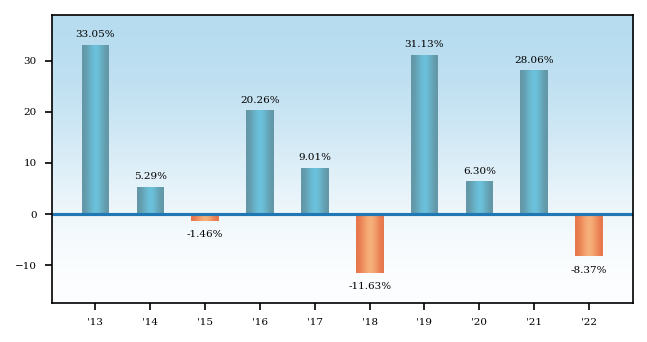
During the periods shown in the bar chart, the Class A shares was % (quarter ended ) and the Class A shares was % (quarter ended ).
The table below shows how the average annual total returns of the Fund’s Classes of shares compare to those of the Fund’s benchmark. The table also presents the impact of taxes on the Fund’s Class A shares. After-tax returns are calculated using the historical highest individual federal marginal income tax rates and do not reflect the impact of state and local taxes. Actual after-tax returns depend on an investor’s tax situation and may differ from those shown. After-tax returns shown are not relevant to investors who hold their Fund shares through tax-deferred arrangements, such as 401(k) plans or individual retirement accounts. After-tax returns for the Class C and Advisor Class shares will differ from those of the Class A shares as the expenses of the Classes differ.
Average Annual Total Returns - Union Street Partners Value Fund |
1 Year |
5 Years |
10 Years |
Since Inception |
Inception Date |
|---|---|---|---|---|---|
| Class A Shares | (8.37%) | 7.65% | 10.09% | 9.17% | Dec. 29, 2010 |
| Class A Shares | Return Before Taxes - with maximum load of 5.75% | (13.64%) | 6.38% | 9.44% | 8.63% | Dec. 29, 2010 |
| Class A Shares | Return After Taxes on Distributions | (8.55%) | 7.29% | 9.62% | 8.75% | Dec. 29, 2010 |
| Class A Shares | Return After Taxes on Distributions and Sale of Fund Shares | (4.95%) | 5.84% | 8.12% | 7.43% | Dec. 29, 2010 |
| Class A Shares | Russell 1000® Value Index (reflects no deduction for fees, expenses, or taxes) | (7.54%) | 6.67% | 10.29% | 10.01% | Dec. 29, 2010 |
| Class C Shares | (9.06%) | 6.88% | 9.30% | 8.40% | Apr. 14, 2011 |
| Advisor Class Shares | (8.13%) | 7.96% | 9.90% | Apr. 27, 2016 |