| | |
SEC Technical Report Summary Pre-Feasibility Study Salar de Atacama Región II, Chile
Effective Date: August 31, 2021 Report Date: January 28, 2022 Amended Date: December 16, 2022 |
Report Prepared for Albemarle Corporation 4350 Congress Street Suite 700 Charlotte, North Carolina 28209 |
Report Prepared by SRK Consulting (U.S.), Inc. 1125 Seventeenth Street, Suite 600 Denver, CO 80202
SRK Project Number: 515800.040 |
SRK Consulting (U.S.), Inc.
| | | | | |
SEC Technical Report Summary – Salar de Atacama | Page ii |
Table of Contents
| | | | | |
SalardeAtacama_SEC_Report_515800.040 | December 2022 |
SRK Consulting (U.S.), Inc.
| | | | | |
SEC Technical Report Summary – Salar de Atacama | Page iii |
| | | | | |
SalardeAtacama_SEC_Report_515800.040 | December 2022 |
SRK Consulting (U.S.), Inc.
| | | | | |
SEC Technical Report Summary – Salar de Atacama | Page iv |
| | | | | |
SalardeAtacama_SEC_Report_515800.040 | December 2022 |
SRK Consulting (U.S.), Inc.
| | | | | |
SEC Technical Report Summary – Salar de Atacama | Page v |
| | | | | |
| |
| |
| |
| |
| |
| |
| |
| |
| |
| |
| |
| |
| |
| |
| |
| |
| |
| |
| |
| |
| |
| |
| |
| |
| |
| |
| |
| |
| |
| 210 |
| 210 |
| 211 |
| 213 |
| 217 |
| 217 |
| 218 |
| 219 |
| 220 |
| 221 |
| 224 |
| | | | | |
SalardeAtacama_SEC_Report_515800.040 | December 2022 |
SRK Consulting (U.S.), Inc.
| | | | | |
SEC Technical Report Summary – Salar de Atacama | Page vi |
| | | | | |
| 225 |
| 225 |
| 225 |
| 230 |
| 232 |
| 232 |
| 232 |
| 232 |
| 234 |
| 235 |
| 236 |
| 237 |
| 237 |
| 238 |
| 238 |
| 241 |
| 245 |
| 245 |
| 245 |
| 245 |
| 246 |
| 251 |
| 254 |
| 256 |
| 256 |
| 259 |
| 259 |
| 263 |
| 264 |
| 264 |
| 264 |
| 264 |
| 265 |
| 265 |
| 265 |
| 265 |
| 265 |
| 266 |
| 266 |
| 266 |
| 267 |
| | | | | |
SalardeAtacama_SEC_Report_515800.040 | December 2022 |
SRK Consulting (U.S.), Inc.
| | | | | |
SEC Technical Report Summary – Salar de Atacama | Page vii |
| | | | | |
| 268 |
| 268 |
| 268 |
| 268 |
| 269 |
| 269 |
| 270 |
| 274 |
| Signature Page | 275 |
List of Tables
| | | | | |
SalardeAtacama_SEC_Report_515800.040 | December 2022 |
SRK Consulting (U.S.), Inc.
| | | | | |
SEC Technical Report Summary – Salar de Atacama | Page viii |
| | | | | |
| |
| |
| |
| |
| |
| |
| |
| |
| |
| |
| |
| |
| |
| |
| |
| |
| |
| |
| |
| |
| |
| 205 |
| 205 |
| 205 |
| 206 |
| 206 |
| 206 |
| |
| 209 |
| 221 |
| 222 |
| 224 |
| 227 |
| 230 |
| 234 |
| 239 |
| 241 |
| 242 |
| 243 |
| | | | | |
SalardeAtacama_SEC_Report_515800.040 | December 2022 |
SRK Consulting (U.S.), Inc.
| | | | | |
SEC Technical Report Summary – Salar de Atacama | Page ix |
| | | | | |
| 244 |
| 245 |
| 246 |
| 247 |
| 248 |
| 248 |
| 250 |
| 250 |
| 251 |
| 253 |
| 259 |
| 259 |
| 260 |
| 262 |
| 269 |
| 274 |
| | | | | |
SalardeAtacama_SEC_Report_515800.040 | December 2022 |
SRK Consulting (U.S.), Inc.
| | | | | |
SEC Technical Report Summary – Salar de Atacama | Page x |
List of Figures
| | | | | |
SalardeAtacama_SEC_Report_515800.040 | December 2022 |
SRK Consulting (U.S.), Inc.
| | | | | |
SEC Technical Report Summary – Salar de Atacama | Page xi |
| | | | | |
SalardeAtacama_SEC_Report_515800.040 | December 2022 |
SRK Consulting (U.S.), Inc.
| | | | | |
SEC Technical Report Summary – Salar de Atacama | Page xii |
| | | | | |
SalardeAtacama_SEC_Report_515800.040 | December 2022 |
SRK Consulting (U.S.), Inc.
| | | | | |
SEC Technical Report Summary – Salar de Atacama | Page xiii |
| | | | | |
| 212 |
| 215 |
| 236 |
| 244 |
| 246 |
| 247 |
| 248 |
| 249 |
| 249 |
| 251 |
| 254 |
| 254 |
| 257 |
| 258 |
| 258 |
| 261 |
| | | | | |
SalardeAtacama_SEC_Report_515800.040 | December 2022 |
SRK Consulting (U.S.), Inc.
| | | | | |
SEC Technical Report Summary – Salar de Atacama | Page xiv |
List of Abbreviations
The metric system has been used throughout this report. Tonnes are metric of 1,000 kg, or 2,204.6 lb. All currency is in U.S. dollars (US$) unless otherwise stated.
| | | | | |
| Abbreviation | Definition |
| °C | degrees Celsius |
| 2D | two dimensional |
| 3D | three dimensional |
| A/P | Accounts Payable |
| A/R | Accounts Receivable |
| ADI | Indigenous Development Area |
| Albemarle | Albemarle Corporation |
| APVC | Altiplano-Puna volcanic complex |
| BEV | battery electric vehicle |
| BG | Battery grade |
| BNEF | Bloomberg New Energy Finance |
| CoG | cut off grade |
| CONAF | National Forestry Corporation |
| DGA | General Water Directorate |
| ET | Evapotranspiration |
| EWMP | Environmental Water Monitoring Plan |
H2SO4 | sulfuric acid |
| ha | hectares |
| HCl | hydrochloric acid |
| ICE | internal combustion engine |
| ID2 | Inverse Distance Squared |
| IDW | inverse distance weighting |
| KE | kriging efficiency |
| kg | kilograms |
| kg/d | kilograms per day |
| km | kilometers |
km2 | square kilometers |
| L | liter |
| l/s | liters per second |
| LCE | lithium carbonate equivalent |
| Li | lithium |
| LiCl | lithium chloride |
| LME | lithium metal equivalent |
| LoM | life of mine |
| m | meters |
| m/d | meters per day |
| m3/y | cubic meters per year |
| Ma | mega annum |
| mamsl | meters above mean seal level |
| mg/L | milligrams per liter |
| mm | millimeters |
| mm/y | millimeters per year |
| MNT | Monturaqui-Negrillar-Tilopozo |
| MOP | muriate of potash |
| MRE | Mineral Resource Estimate |
| | | | | |
SalardeAtacama_SEC_Report_515800.040 | December 2022 |
SRK Consulting (U.S.), Inc.
| | | | | |
SEC Technical Report Summary – Salar de Atacama | Page xv |
| | | | | |
| Mt/y | million tonnes per year |
| NaOH | sodium hydroxide |
| NMR | Nuclear Magnetic Resonance |
| NN | nearest neighbor |
| OK | ordinary kriging |
| PAT | Early Warning Plan |
| PFS | prefeasibility study |
| PMB | Environmental Monitoring Plan |
| PPE | personal protective equipment |
| QA/QC | Quality Assurance/Quality Control |
| QP | Qualified Person |
| RAMSAR | Convention on Wetlands |
| RMSE | root mean square error |
| SCL | Chilean Society of Limited Lithium |
| SEA | Environmental Assessment Service |
| SEC | Securities and Exchange Commission |
| SEIA | Chilean Environmental Impact System |
| SEN | Sistema Eléctrico Nacional |
| SEP | Sistema de Empresas |
| SERNAGEOMIN | National Service of Geology and Mining |
| SMA | Environmental Superintendence |
| SOR | slope or regression value |
| SRK | SRK Consulting (U.S.), Inc. |
| SS | specific storage |
| Sy | specific yield |
| SYIP | Salar Yield Improvement Program |
| t | metric tonnes |
| t/y | tonnes per year |
| TG | technical grade |
| TRS | Technical Report Summary |
| VGC | Volcanic, Gypsum and clastic |
| ZOIT | Zone of Tourist Interest |
| | | | | |
SalardeAtacama_SEC_Report_515800.040 | December 2022 |
SRK Consulting (U.S.), Inc.
| | | | | |
SEC Technical Report Summary – Salar de Atacama | Page 16 |
1Executive Summary
This report was prepared as a prefeasibility study (PFS)-level Technical Report Summary (TRS) in accordance with the Securities and Exchange Commission (SEC) S-K regulations (Title 17, Part 229, Items 601 and 1300 until 1305) for Albemarle Corporation (Albemarle) by SRK Consulting (U.S.), Inc. (SRK). This TRS is for the portion of the Salar de Atacama lithium-rich brine deposit controlled by Albemarle and the associated brine concentration facilities and La Negra lithium processing facilities owned by Albemarle, combined referred to as the “Project ” located in Region II, Chile. The purpose of this TRS is to support public disclosure of Albemarle’s mineral resources and mineral reserves for the Salar de Atacama for Albemarle’s public disclosure purposes.
The report was amended to include additional clarifying information in December 2022. The basis of the report is unchanged. The summary of the changes and location in document are summarized in Chapter 2.1.
1.1Property Description and Ownership
The Salar de Atacama Basin is located in the commune of San Pedro de Atacama, with the operations approximately 100 kilometers (km) to the south of this commune, in the extreme east of the Antofagasta Region and close to the border with the republics of Argentina and Bolivia. In a regional context, the salar is located in a remote area with the nearest city, Calama, approximately 190 km by road to the northwest. The regional capital, Antofagasta, which also is located near the La Negra processing facilities, is located approximately 280 km, by road to the west.
Albemarle's mining properties within the Salar de Atacama include two groups of exploitation concessions, CASEME (Carlos Sáez – Eduardo Morales Echeverría) and OMA, which cover a total of 5,227 mining properties. They comprise of approximately 25 km at the widest zone in the East-West direction and 12 km in the widest North-South zone. For the purpose of the reserve estimate, the OMA concessions are those that are relevant. The CASEME concessions include 1,883 properties and the same number of hectares (ha). The OMA concessions include 3,344 mining properties of 5 ha each, which corresponds to 16,720 ha.
Albemarle owns the land on which the extraction/processing facilities at Salar de Atacama and the processing facility at La Negra operate. However, the ownership of the land at the Salar de Atacama will revert to the Chilean government once all amounts of lithium remaining under Albemarle’s contracts with the Chilean government are sold (the ownership of the land and fixed assets at La Negra will remain unchanged).
Albemarle’s mineral rights at the Salar de Atacama in Chile consist of the right to extract lithium brine, pursuant to a long-term contract with the Chilean government, originally entered into in 1980 by Foote Minerals, a predecessor of Albemarle. This contract has been subsequently amended and restated.
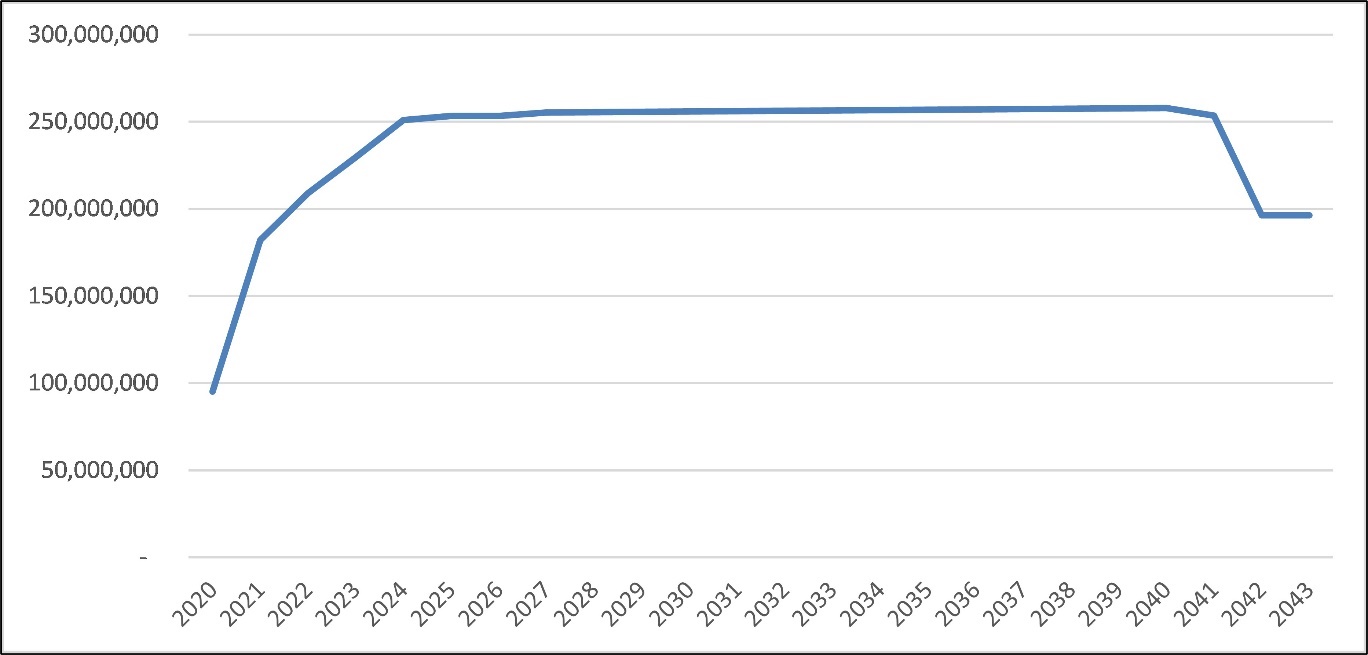
Albemarle’s predecessor’s initial contract with the Chilean government will remain in effect until the date on which it has produced and sold 200,000 metric tonnes (t) of lithium metal equivalent (LME), although the lithium can be produced in any of its forms, from the Salar de Atacama. As of August 31, 2021, the remaining amount of lithium from the initial contract equals approximately 78,038 t of LME. On November 25, 2016, CORFO and Albemarle entered into an annex to the initial agreement adding an additional 262,132 t LME to the total quota and setting an expiry for production of the
| | | | | |
SalardeAtacama_SEC_Report_515800.040 | December 2022 |
SRK Consulting (U.S.), Inc.
| | | | | |
SEC Technical Report Summary – Salar de Atacama | Page 17 |
quota of January 1, 2044 (i.e., any remaining quota after this date will be forfeited). As of August 31, 2021, the remaining amount of lithium from the second quota equals 262,132 t. Combined, as of the effective date of this TRS, August 31, 2021, Albemarle has a remaining quota of 340,170 t of LME, expiring January 1, 2044.
1.2Geology and Mineralization
Salar de Atacama is located in the Central Andes of Chile, a region which is host to some of the most prolific lithium (Li) brine deposits in the world. The Central Andean Plateau and the Atacama Desert are two important physiographic features that contribute to the generation of Li brines in the Central Andes. In these environments, the combination of hyper-arid climate, closed basins, volcanism, and hydrothermal activity has led to extensive deposition of evaporite deposits since approximately 15 mega annum (Ma) (Alonso et al., 1991). The extreme size and longevity of these closed basins is favorable for lithium-rich brine generation, particularly where thick evaporite deposits (halite, gypsum and less commonly borates) have removed ions from solution and further concentrated lithium.
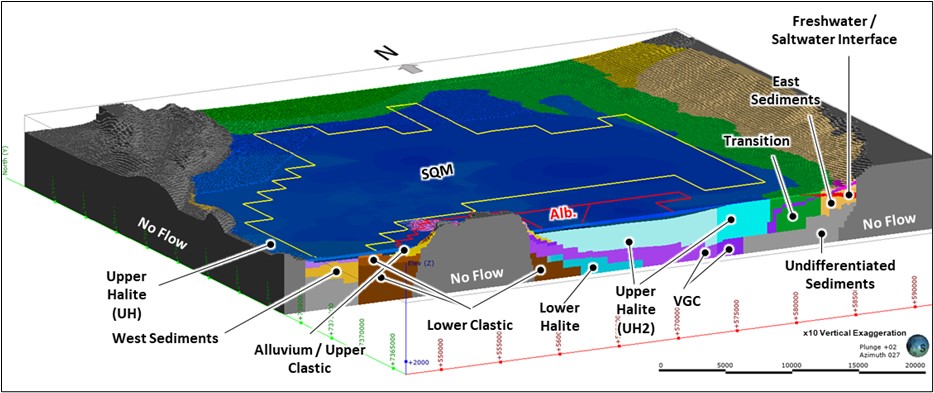
Basin fill materials at the Salar de Atacama are dominated by the Vilama Formation and modern evaporite and clastic materials currently being deposited in the basin. In the Albemarle operation area, the Vilama Formation is up to approximately 1 km thick and is host to the production aquifer system. The formation is composed of evaporite chemical sediments including intervals of carbonate, gypsum and halite punctuated by volcanic deposits of large ignimbrite sheets, volcanic ashes and minor clastic deposits. These deposits are best observed in outcrop along the salar margin and in drill cores from the Albemarle project site.
Lithium-rich brines are produced from a halite aquifer within the salar nucleus. Carbonate and sulfate flank the basin and indicate that carbonate and sulfate mineral precipitation may have played a role in producing the brine. In addition to the evaporative concentration processes, the distillation of lithium from geothermal heating of fluids may further concentrate lithium in these brines and provide prolonged replenishment of brines that are in production. Since many lithium-rich brines exist over, or in close proximity to, relatively shallow magma chambers, the late-stage magmatic fluids and vapors may have pathways through faults and fractures to migrate into the closed basin.
Waters in the Salar de Atacama basin and the adjacent Andean arc vary in lithium concentration from approximately 0.05 to 5 milligrams per liter (mg/L) Li in the Andean inflow waters, 5 to 100 mg/L Li in shallow groundwaters in the south and east flanks of the basin and in excess of 5,000 mg/L Li in brines in the nucleus (Munk et al., 2018). This indicates that the lithium-rich brine in the basin is concentrated by up to five orders of magnitude compared to water entering the basin. This is a unique hydrogeochemical circumstance to the salar compared to other lithium brine systems.
1.3Mineral Resource
Mineral resources have been estimated by SRK. SRK generated a three dimensional (3D) geological model informed by various data types (drill hole, geophysical data, surface geologic mapping, interpreted cross sections and surface/downhole structural observations) to constrain and control the shapes of aquifers which host the lithium.
Lithium concentration data from the brine sampling exploration data set was regularized to equal lengths, when was possible, for constant sample volume (Compositing). Lithium grades were interpolated into a block model using ordinary kriging (OK) and inverse distance weighting (IDW)
| | | | | |
SalardeAtacama_SEC_Report_515800.040 | December 2022 |
SRK Consulting (U.S.), Inc.
| | | | | |
SEC Technical Report Summary – Salar de Atacama | Page 18 |
methods. Results were validated visually and via various statistical comparisons. The estimate was depleted for current production, categorized in a manner consistent with industry standards and statistical parameters. Mineral resources have been reported above a cutoff grade (CoG) supporting reasonable potential for eventual economic extraction of the resource. Mineral resources, as of August 31, 2021, exclusive of reserves, are summarized in Table 1-1. Mineral resources, as of August 31, 2021, inclusive of reserves, are summarized in Table 1-2.
| | | | | |
SalardeAtacama_SEC_Report_515800.040 | December 2022 |
SRK Consulting (U.S.), Inc.
| | | | | |
SEC Technical Report Summary – Salar de Atacama | Page 19 |
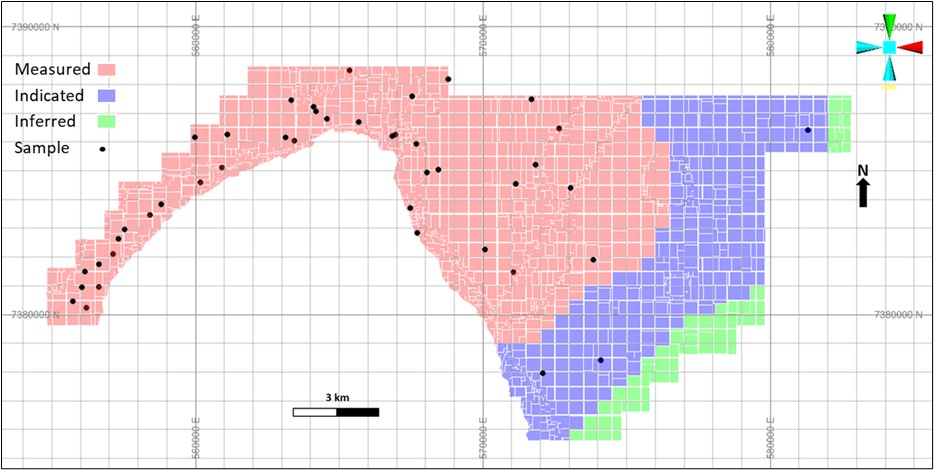
Table 1-1: Salar de Atacama Mineral Resource Estimate, Exclusive of Mineral Reserves (Effective August 31, 2021)
| | | | | | | | | | | | | | | | | | | | | | | | | | |
| Measured Resource | Indicated Resource | Measured + Indicated Resource | Inferred Resource |
| Contained Li (Tonnes x 1000) | Brine Concentration (mg/L Li) | Contained Li (Tonnes x 1000) | Brine Concentration (mg/L Li) | Contained Li (Tonnes x 1000) | Brine Concentration (mg/L Li) | Contained Li (Tonnes x 1000) | Brine Concentration (mg/L Li) |
| Total | 717 | 2,211 | 687 | 1,747 | 1,404 | 1,959 | 131 | 1,593 |
Source: SRK, 2021
•Mineral resources are reported exclusive of mineral reserves. Mineral resources are not mineral reserves and do not have demonstrated economic viability.
•Given the dynamic reserve versus the static resource, a direct measurement of resources post-reserve extraction is not practical. Therefore, as a simplification, to calculate mineral resources, exclusive of reserves, the quantity of lithium pumped in the life of mine plan was subtracted from the overall resource without modification to lithium concentration. Measured and indicated resource were deducted proportionate to their contribution to the overall mineral resource.
•Resources are reported on an in-situ basis.
•Resources are reported between the elevations of 2,299 masl and 2,200 masl. Resources are reported as lithium metal
•Resources have been categorized subject to the opinion of a QP based on the amount/robustness of informing data for the estimate, consistency of geological/grade distribution, survey information.
•Resources have been calculated using drainable porosity estimated from measured values in Upper Halite and VGC units, and bibliographical values based on the lithology and QP’s experience in similar deposits
•The estimated economic cutoff grade utilized for resource reporting purposes is 670 mg/l lithium, based on the following assumptions:
◦A technical grade lithium carbonate price of US$11,000 / metric tonne CIF La Negra. This is a 10% premium to the price utilized for reserve reporting purposes. The 10% premium applied to the resource versus the reserve was selected to generate a resource larger than the reserve, ensuring the resource fully encompassed the reserve while still maintaining reasonable prospect for eventual economic extraction.
◦Recovery factors for the salar operation increase gradually over the span of four years, from the current 40% to the proposed SYIP 65% recovery in 2025. After that point, evaporation pond recovery is assumed constant at 65%, considering the installation of a liming plant is assumed in 2027. An additional recovery factor of 80% lithium recovery is applied to the La Negra lithium carbonate plant.
◦A fixed average annual brine pumping rate of 442 l/s is assumed, consistent with Albemarle’s permit conditions.
◦Operating cost estimates are based on a combination of fixed brine extraction, G&A and plant costs and variable costs associated with raw brine pumping rate or lithium production rate. Average life of mine operating cost is calculated at approximately $3,000/metric tonne CIF Asia.
◦Sustaining capital costs are included in the cutoff grade calculation and post the SYIP installation, average around US$54M per year.
◦Government royalties are excluded from the cutoff grade calculation as these costs are variable, depending upon price. A 3.5% community royalty is included in the cutoff grade as this royalty is fixed.
•Mineral Resources tonnage and contained metal have been rounded to reflect the accuracy of the estimate, and numbers may not add due to rounding.
•SRK Consulting (U.S.) Inc. is responsible for the Mineral Resources with an effective date: August 31, 2021. The geologic block model is incorporating all relevant exploration data as of June 30, 2020 and there is no additional data since that date. The resource has been depleted to August 31, 2021.
| | | | | |
SalardeAtacama_SEC_Report_515800.040 | December 2022 |
SRK Consulting (U.S.), Inc.
| | | | | |
SEC Technical Report Summary – Salar de Atacama | Page 20 |
Table 1-2: Salar de Atacama Mineral Resource Estimate, Inclusive of Mineral Reserves (Effective August 31, 2021)
| | | | | | | | | | | | | | | | | | | | | | | | | | |
| Measured Resource | Indicated Resource | Measured + Indicated Resource | Inferred Resource |
| Contained Li (Tonnes x 1000) | Brine Concentration (mg/L Li) | Contained Li (Tonnes x 1000) | Brine Concentration (mg/L Li) | Contained Li (Tonnes x 1000) | Brine Concentration (mg/L Li) | Contained Li (Tonnes x 1000) | Brine Concentration (mg/L Li) |
| In Situ | 1,029 | 2,211 | 966 | 1,747 | 1,995 | 1,959 | 131 | 1,593 |
| In Process | 24 | 2,685 | 0 | 0 | 24 | 2,685 | - | - |
Source: SRK, 2021
•Mineral resources are reported inclusive of mineral reserves. Mineral resources are not mineral reserves and do not have demonstrated economic viability.
•Resources are reported as in situ and in process. In process resources quantify the prior 24 months of pumping data and reflect the raw brine, at the time of pumping.
•In situ resources are reported between the elevations of 2,299 masl and 2,200 masl.
•Resources are reported as lithium metal
•Resources have been categorized subject to the opinion of a QP based on the amount/robustness of informing data for the estimate, consistency of geological/grade distribution, survey information.
•Resources have been calculated using drainable porosity estimated from measured values in Upper Halite and VGC units, and bibliographical values based on the lithology and QP’s experience in similar deposits
•The estimated economic cutoff grade utilized for resource reporting purposes is 670 mg/l lithium, based on the following assumptions:
◦A technical grade lithium carbonate price of US$11,000 / metric tonne CIF La Negra. This is a 10% premium to the price utilized for reserve reporting purposes. The 10% premium applied to the resource versus the reserve was selected to generate a resource larger than the reserve, ensuring the resource fully encompassed the reserve while still maintaining reasonable prospect for eventual economic extraction.
◦Recovery factors for the salar operation increase gradually over the span of 4 years, from the current 40% to the proposed SYIP 65% recovery in 2025. After that point, evaporation pond recovery is assumed constant at 65%, considering the installation of a liming plant is assumed in 2027. An additional recovery factor of 80% lithium recovery is applied to the La Negra lithium carbonate plant.
◦A fixed average annual brine pumping rate of 442 l/s is assumed, consistent with Albemarle’s permit conditions.
◦Operating cost estimates are based on a combination of fixed brine extraction, G&A and plant costs and variable costs associated with raw brine pumping rate or lithium production rate. Average life of mine operating cost is calculated at approximately $3,000/metric tonne CIF Asia.
◦Sustaining capital costs are included in the cutoff grade calculation and post the SYIP installation, average around US$54M per year.
◦Government royalties are excluded from the cutoff grade calculation as these costs are variable, depending upon price. A 3.5% community royalty is included in the cutoff grade as this royalty is fixed.
•Mineral Resources tonnage and contained metal have been rounded to reflect the accuracy of the estimate, and numbers may not add due to rounding.
•SRK Consulting (U.S.) Inc. is responsible for the Mineral Resources with an effective date: August 31, 2021. The geologic block model is incorporating all relevant exploration data as of June 30, 2020 and there is no additional data since that date. The resource has been depleted to August 31, 2021.
| | | | | |
SalardeAtacama_SEC_Report_515800.040 | December 2022 |
SRK Consulting (U.S.), Inc.
| | | | | |
SEC Technical Report Summary – Salar de Atacama | Page 21 |
1.4Mining Methods and Mineral Reserve Estimates
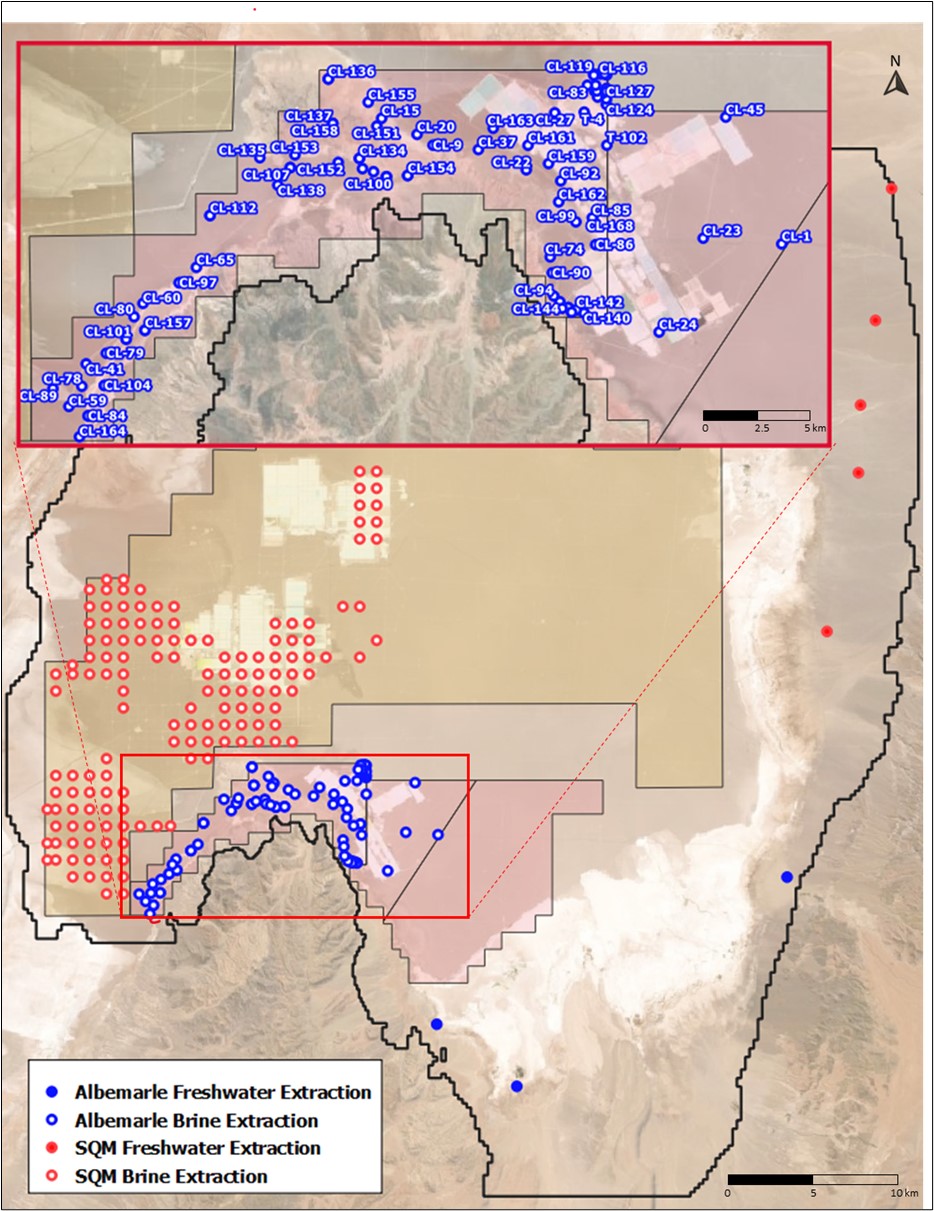
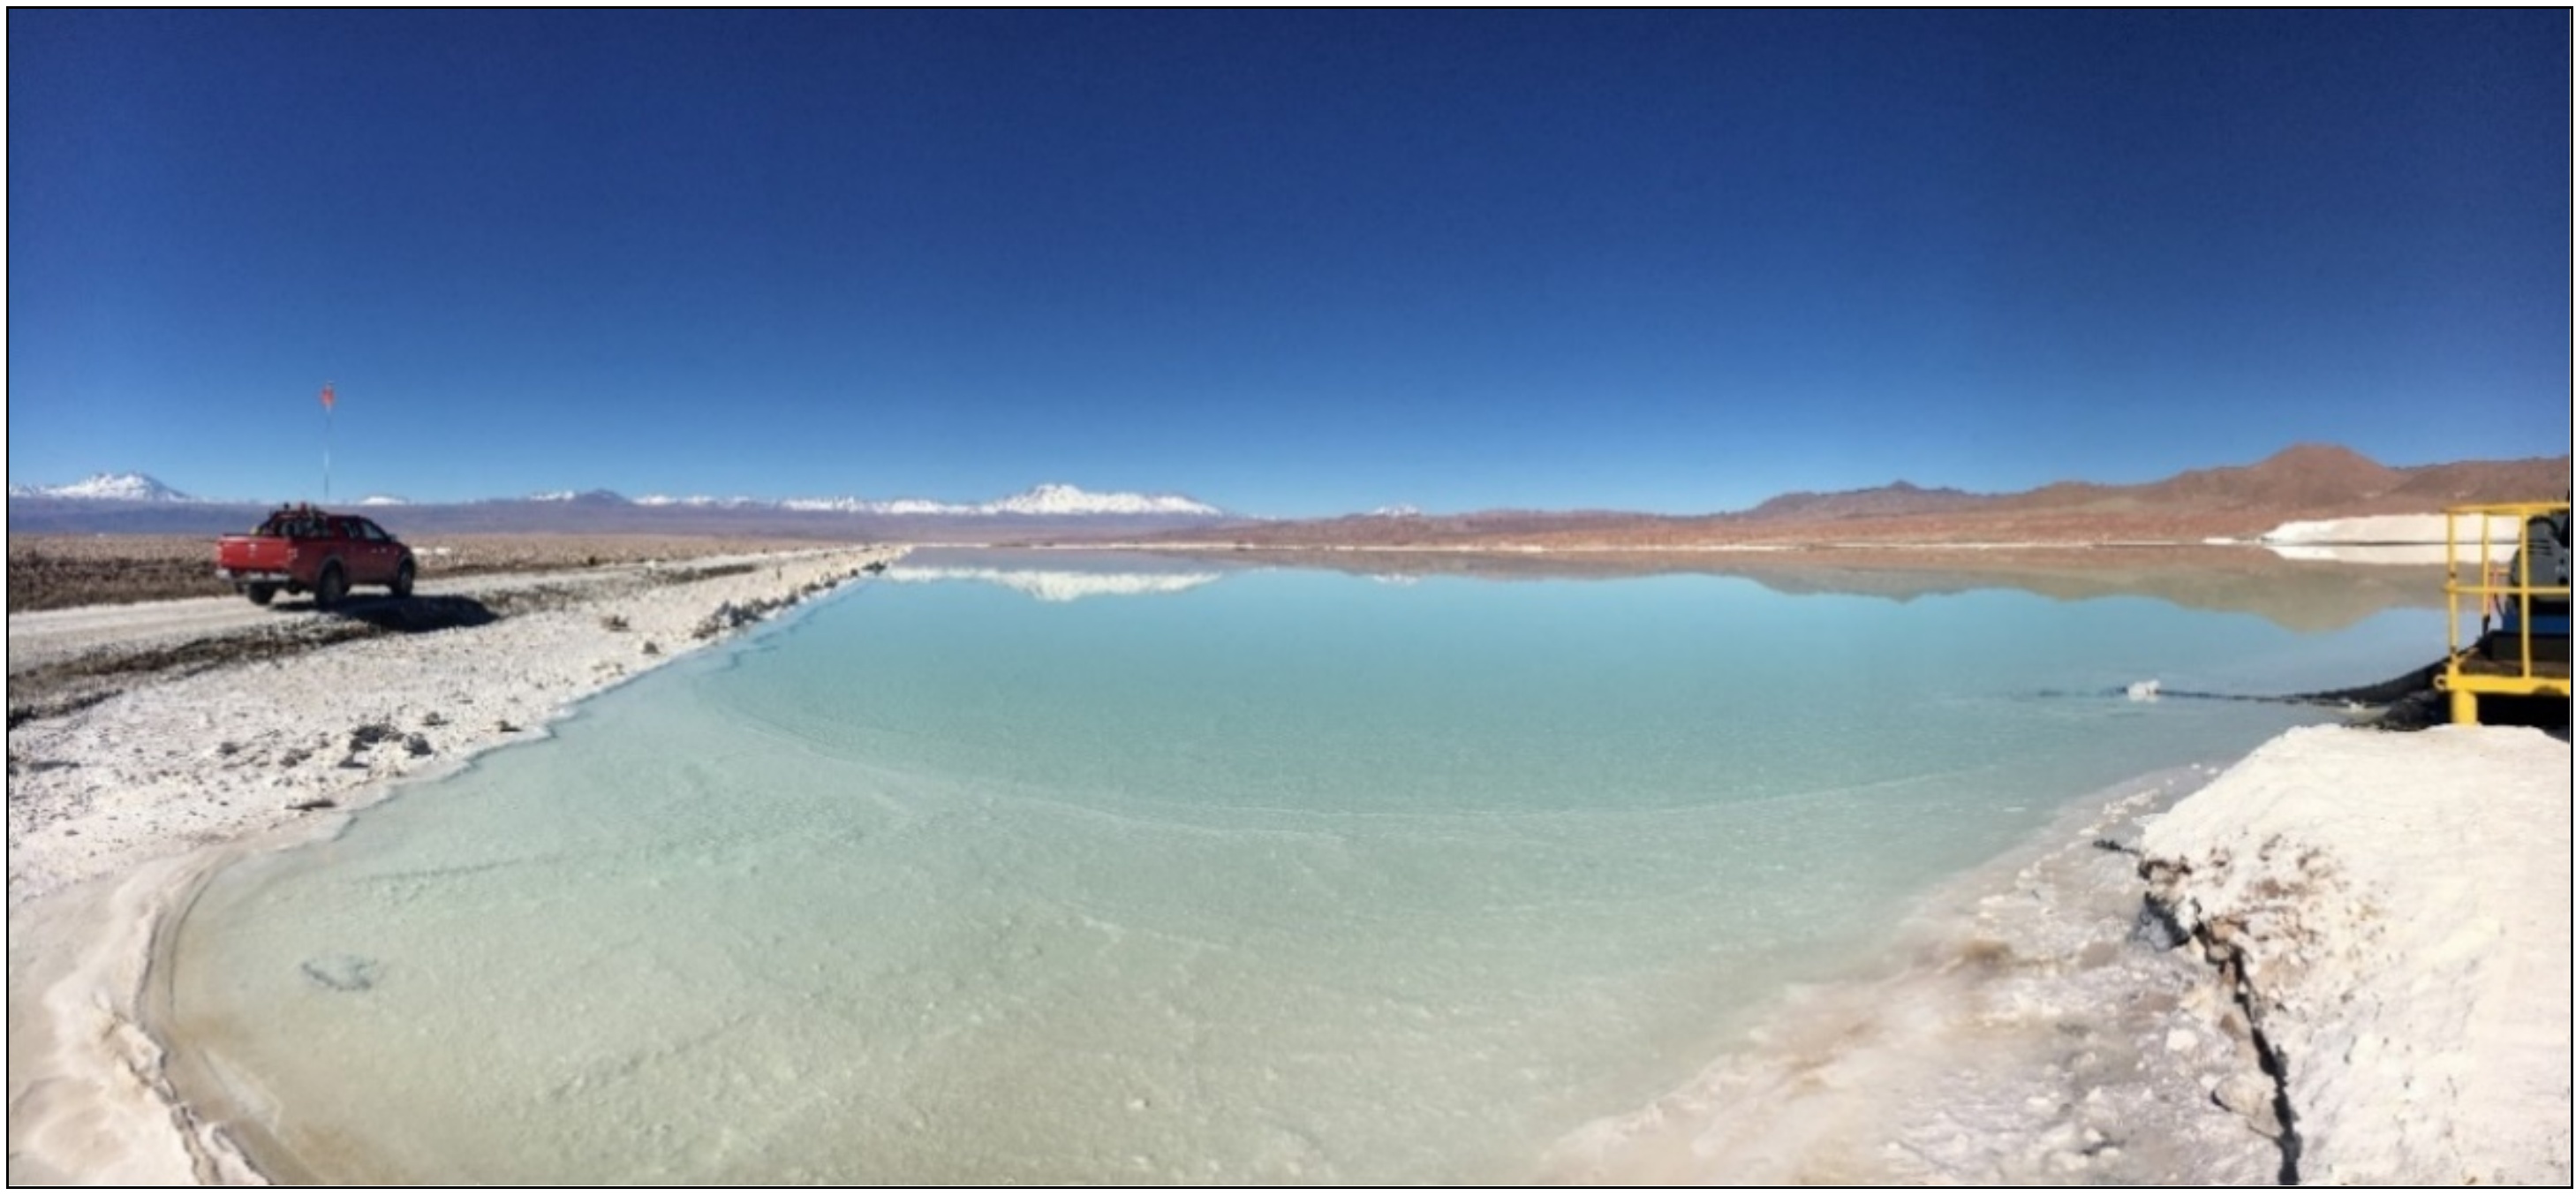
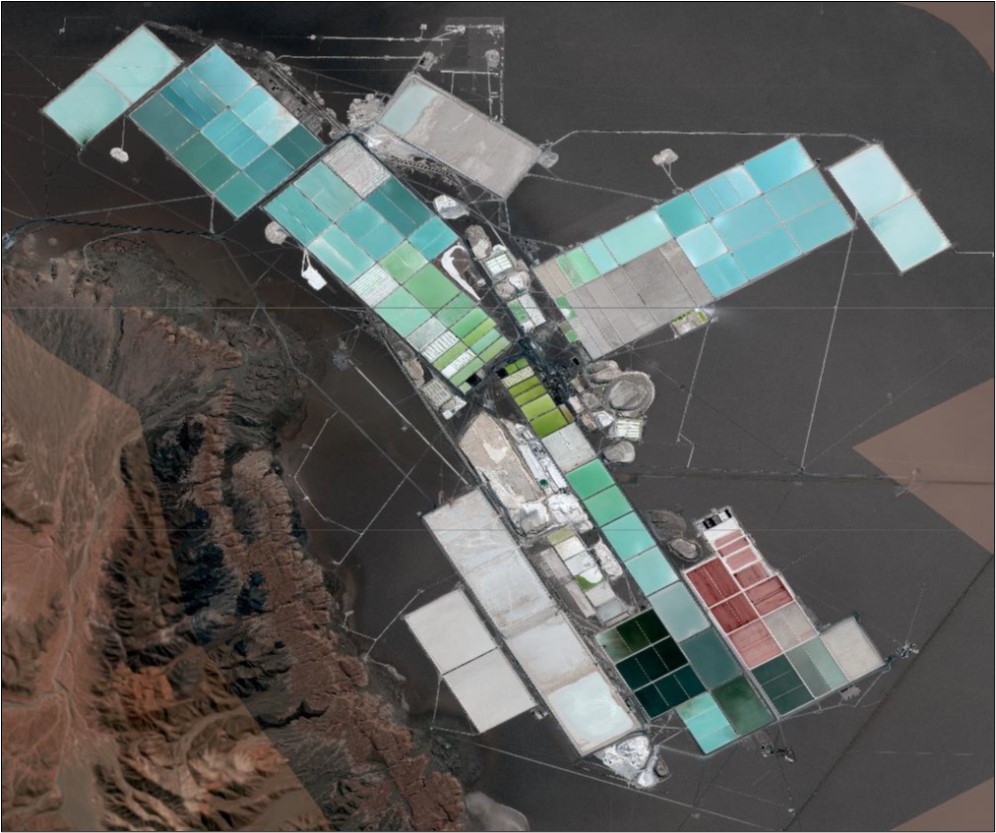
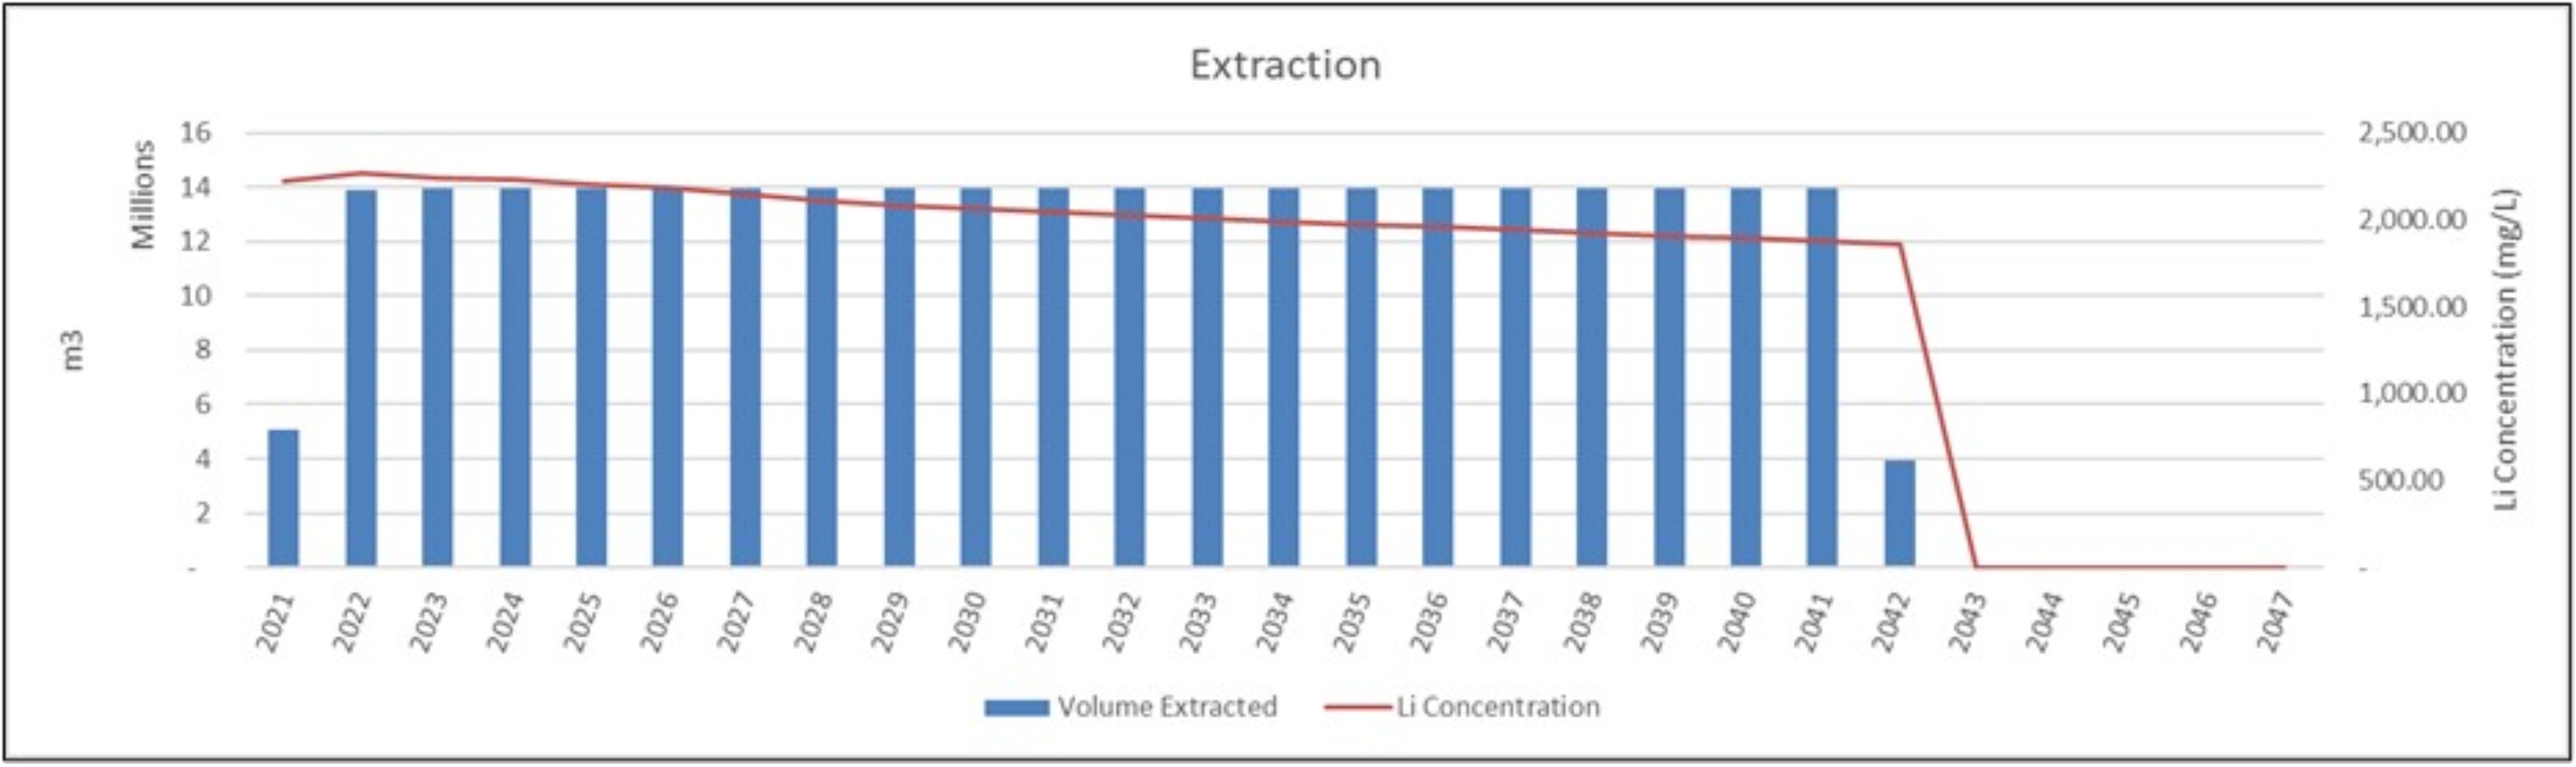
The brine reserve is extracted at the Salar de Atacama by pumping the raw brine from the aquifer utilizing a network of wells and trenches. This method of brine extraction has been used at the operation since 1983. The extracted brine is transferred to a series of evaporation ponds for initial processing (i.e., concentration with solar evaporation).
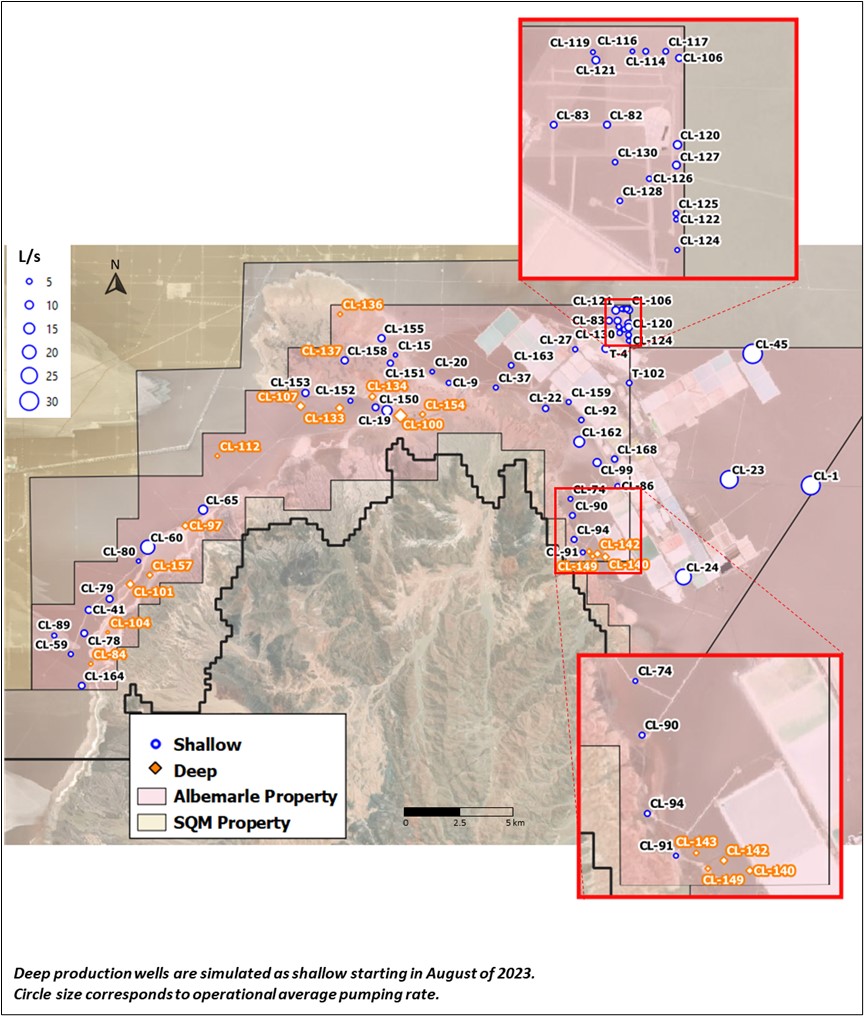
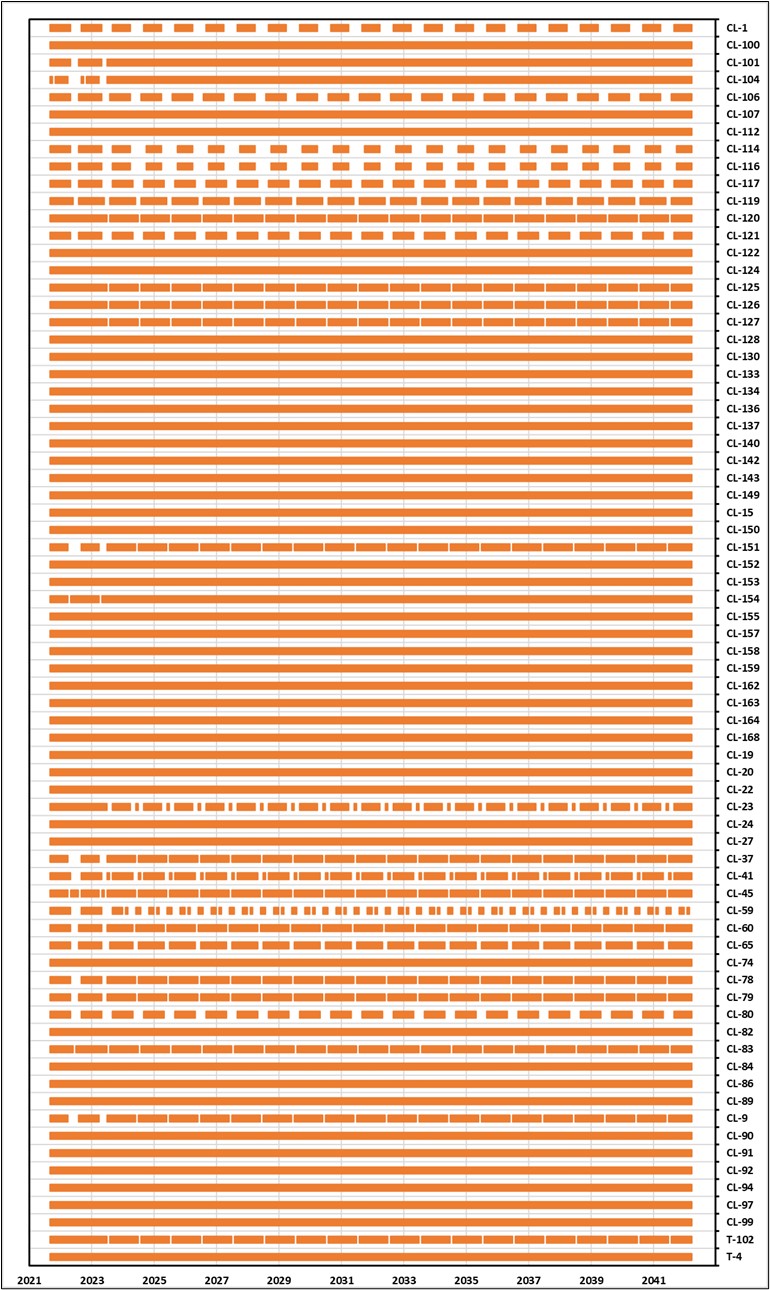
There are currently approximately 75 active brine extraction wells, and, over the life of mine, this number of wells is forecast to gradually reduce to a steady state of 72 extraction wells. There are both shallow and deep wells in place with depths of between 25 meters (m) and 40 m for the shallow wells and 70 m to 90 m for deep wells. Brine extraction rates from the aquifer are restricted by permit conditions to a combined maximum average annual rate of 442 liters per second (l/s). Extraction wells are located to maximize lithium grades as well as balance calcium and sulphate-rich brines to benefit process recovery rates.
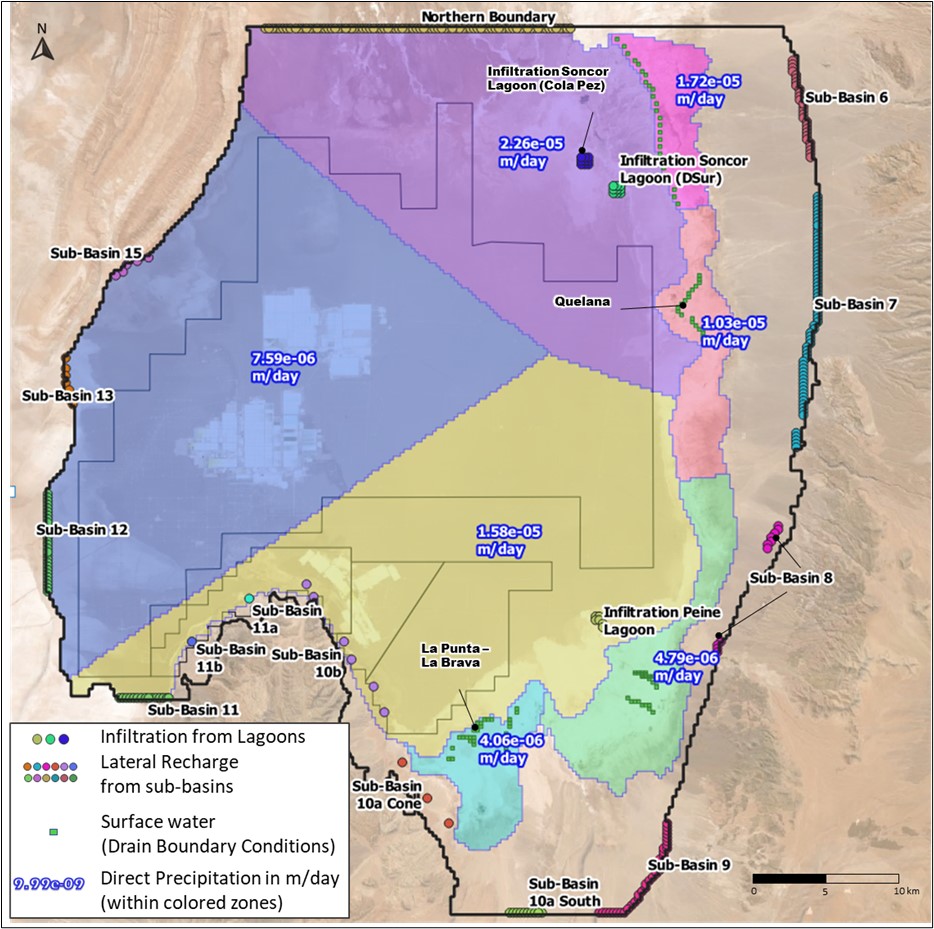
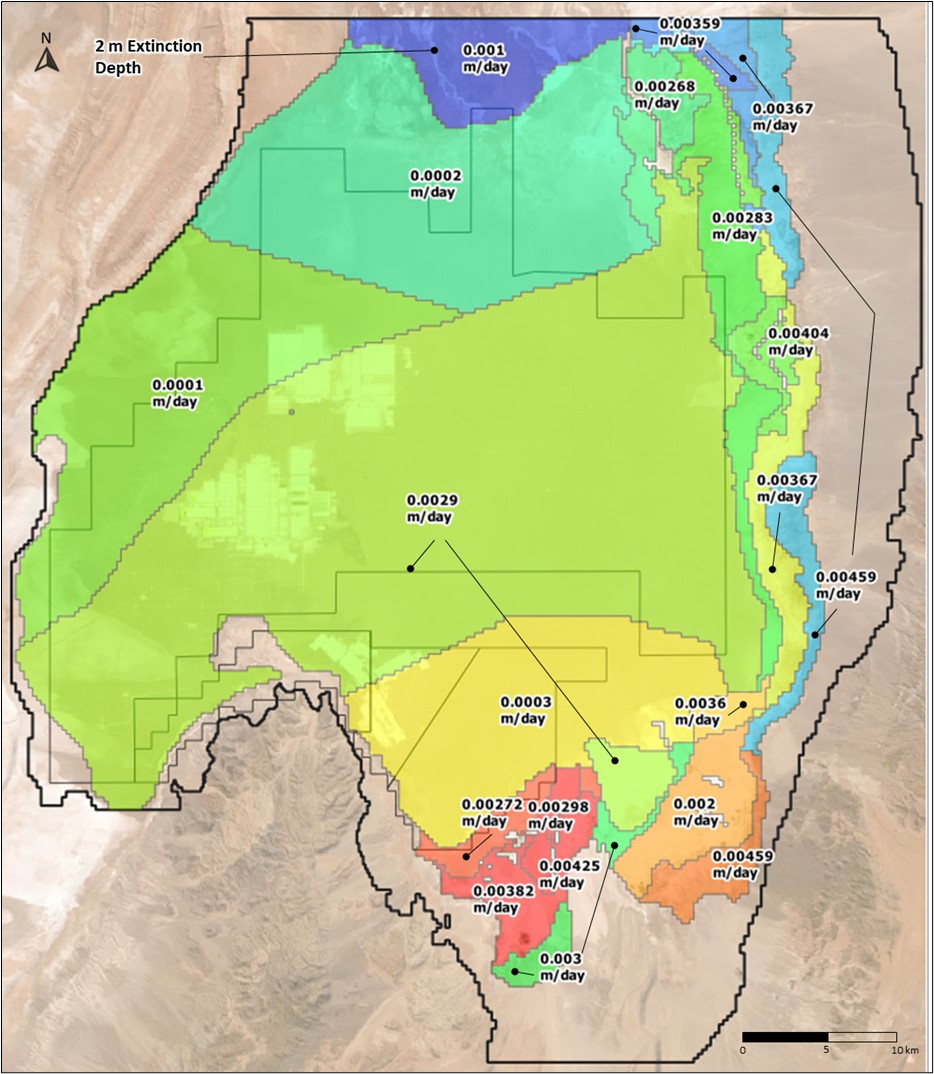
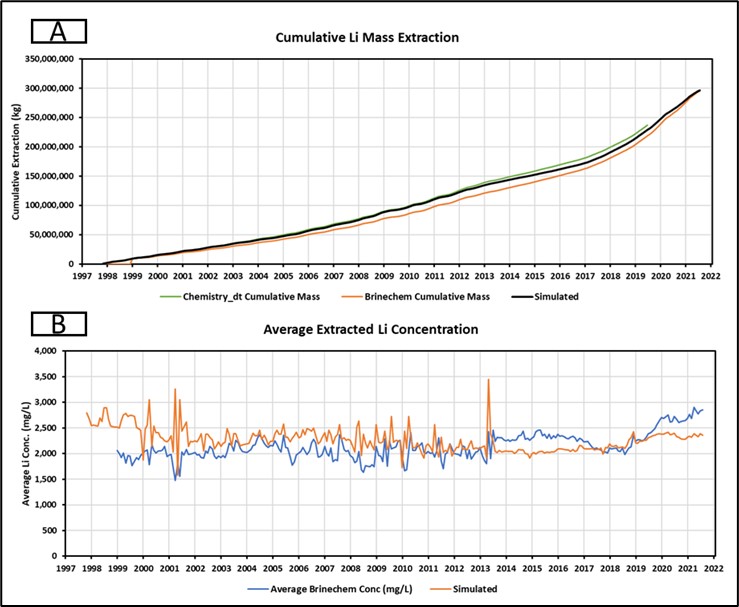
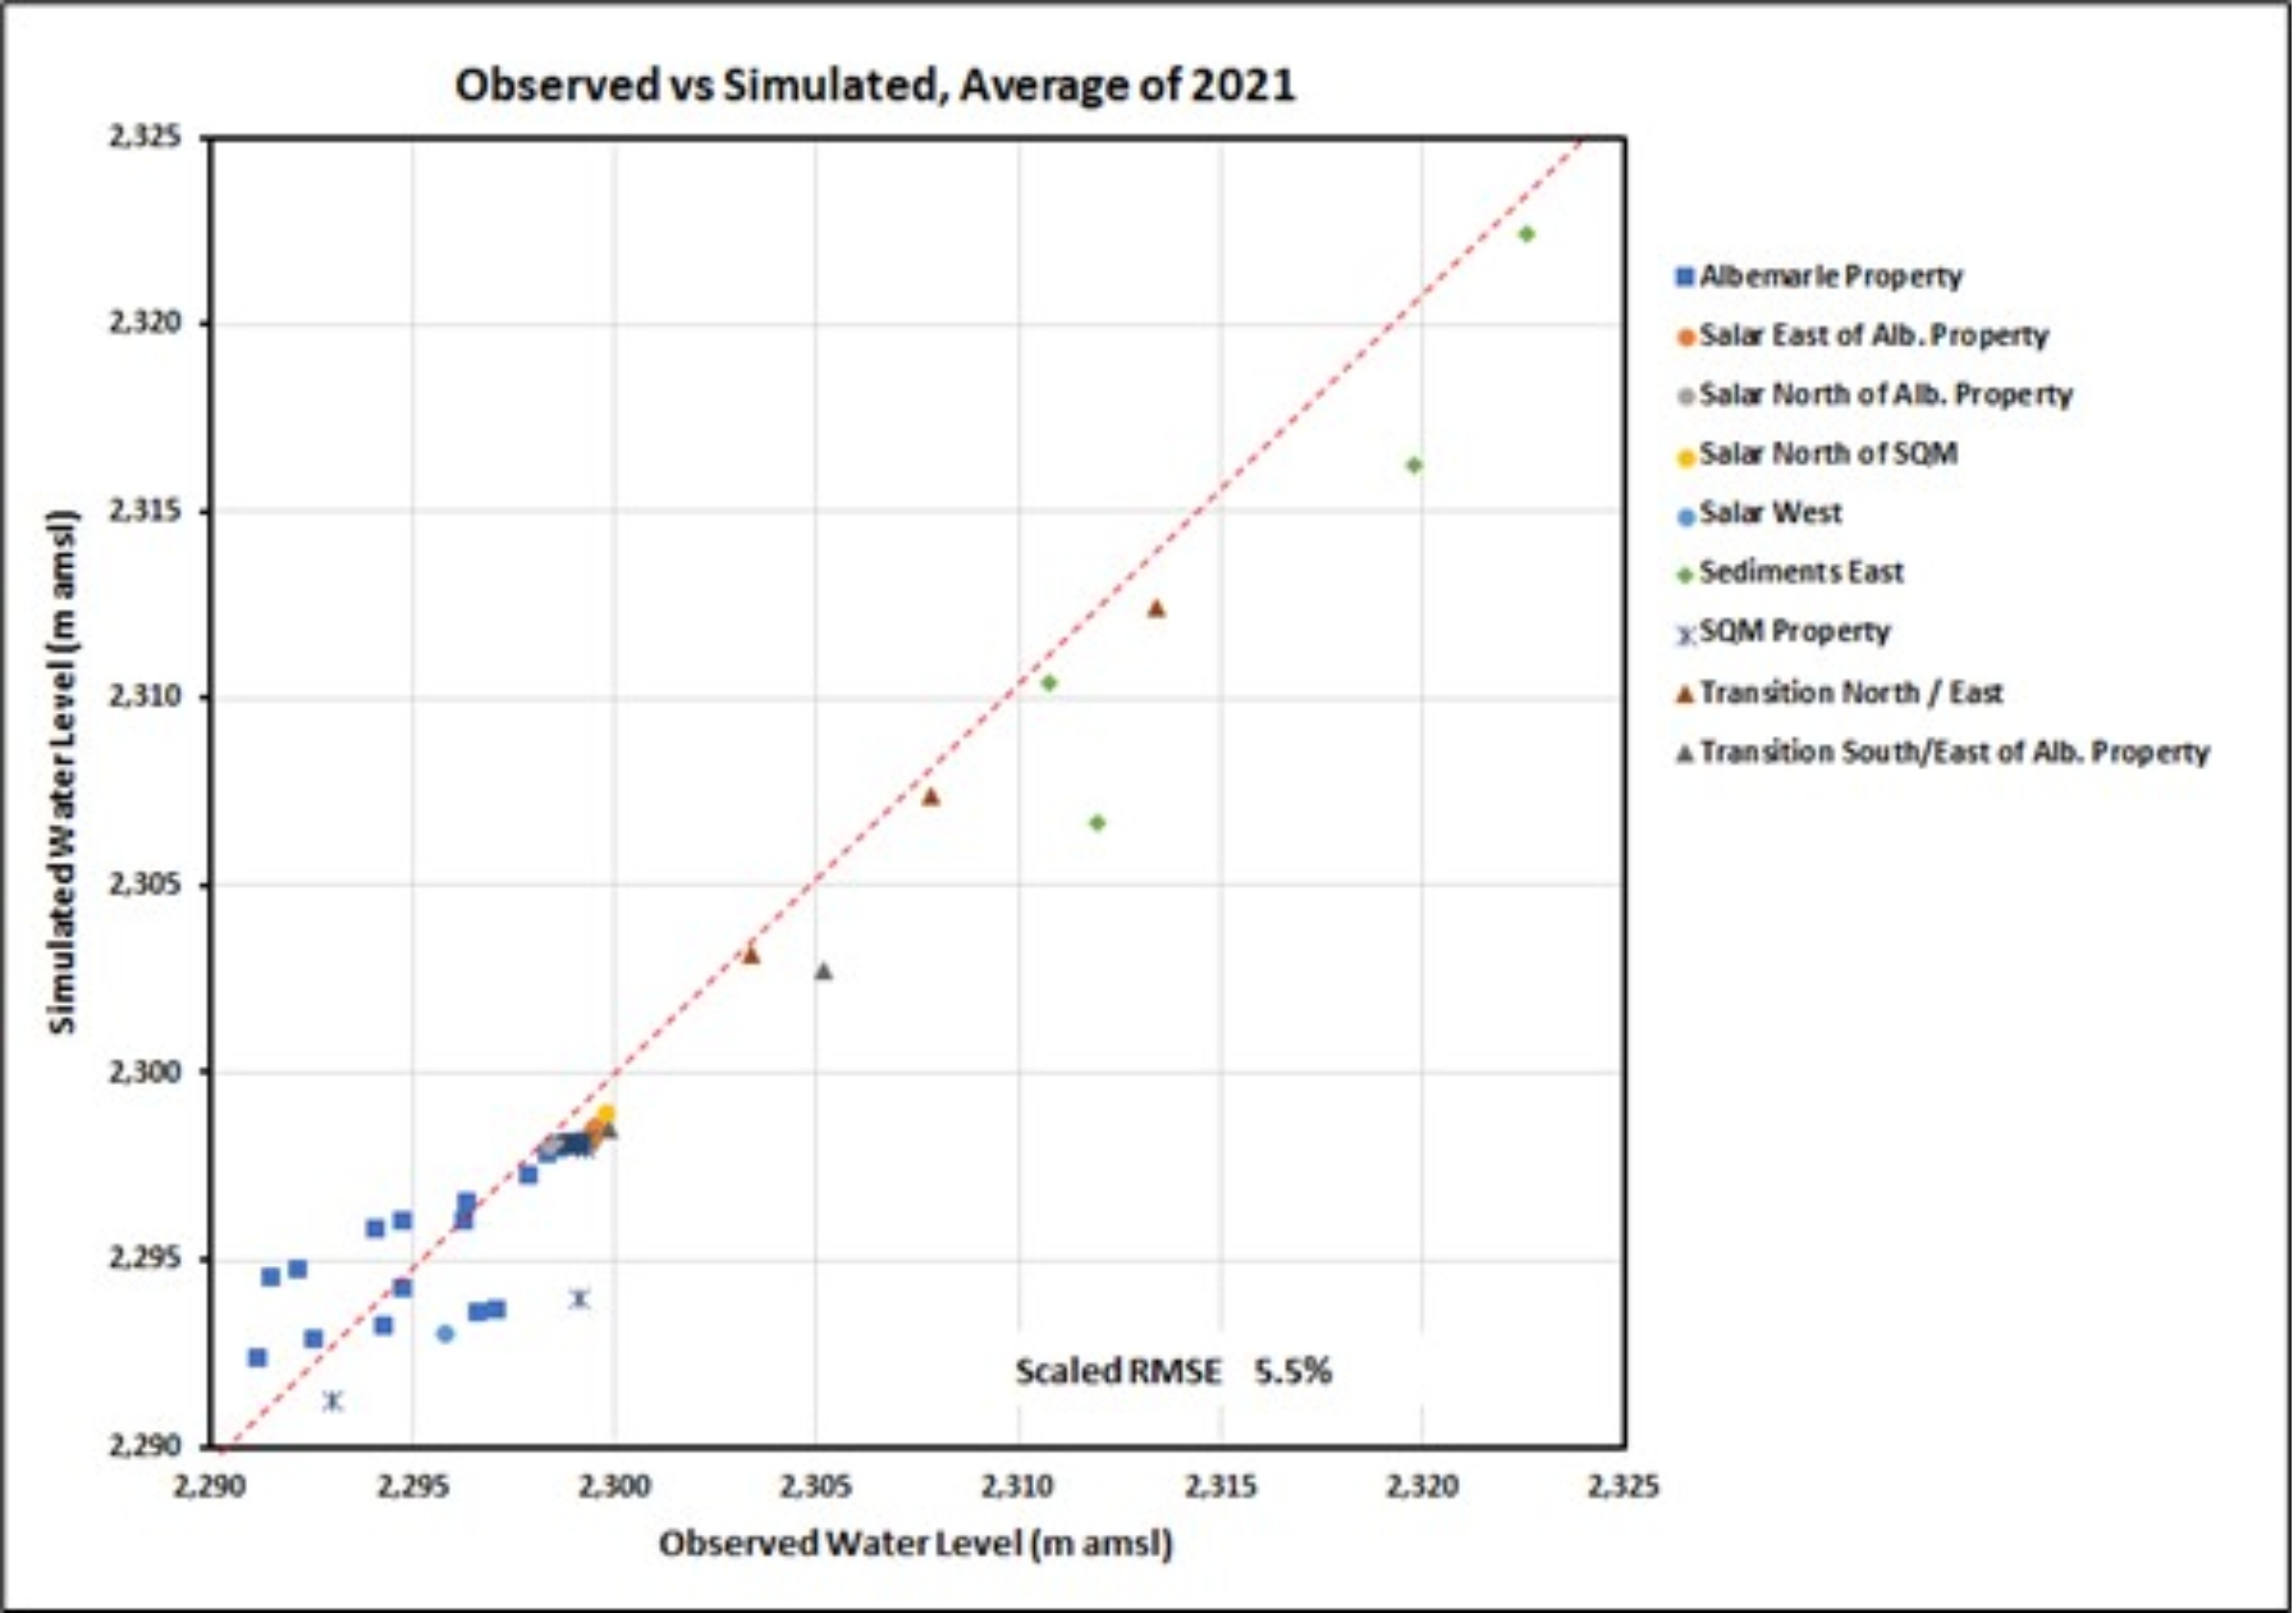
A geologically-based, 3D, numerical groundwater-flow and solute transport model was developed to evaluate the extractability of brine from the salar and develop the life of mine (LoM) pumping plan that underpins the reserve estimate. The model construction is based on an analysis of historical hydrogeologic data conducted by Albemarle and SRK.
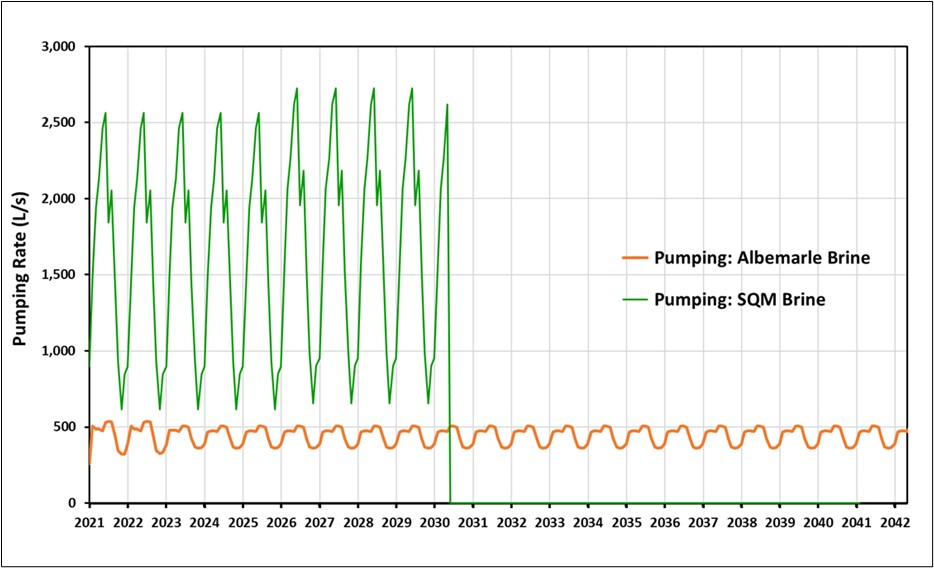
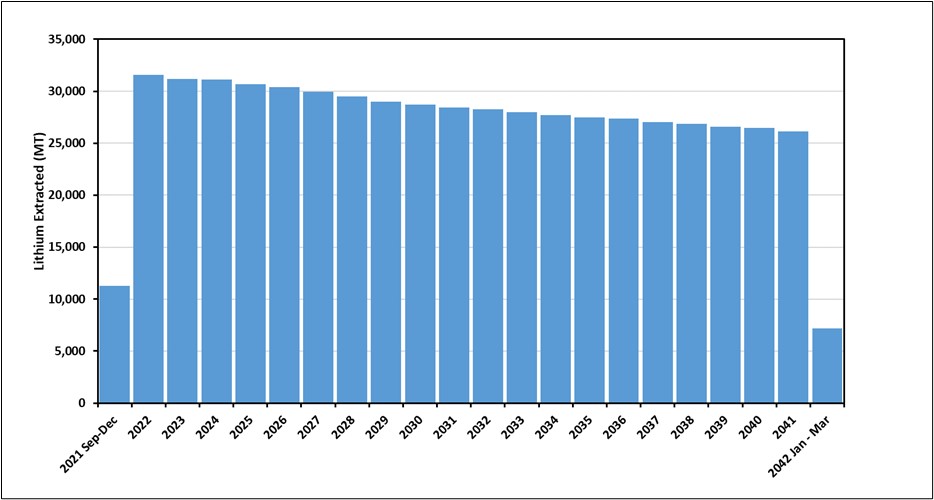
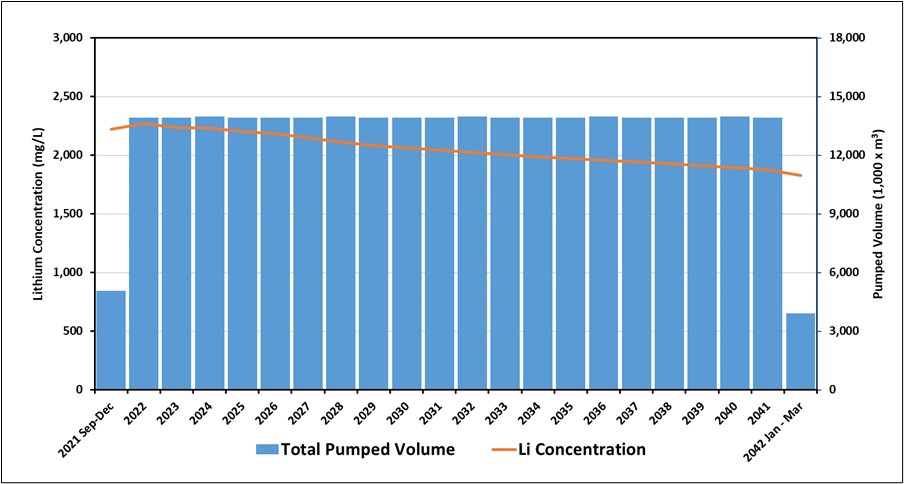
Using these hydrogeologic properties of the salar combined with the wellfield design parameters, the rate and volume of lithium projected as extracted from the Project area was simulated using this predictive model. The predictive model output generated a brine production profile appropriate for the salar based upon the wellfield design assumptions with a maximum pumping rate of 442 L/s (i.e., maximum authorized extraction rate) over a period of 21 years. The use of a 21-year period reflects the timing required to extract the full, authorized quota of lithium production. Given the approximately two year offset in timing from pumping to final production, this also is the last year that extraction from the salar can be reasonably expected to still result in lithium produced by the 2043 expiry of Albemarle’s production quota.
When estimating brine resources and reserves, different models are utilized to define those resources and reserves. The resource model presents a static, in situ measurement of potentially extractable brine volume whereas the reserve model (i.e., the predictive model) presents a dynamic simulation of brine that can potentially be pumped through extraction wells. As such, the predictive model does not discriminate between brine derived from inferred, measured, or indicated resources. Further, a brine resource is dynamic and is constantly influenced by water inflows (e.g., precipitation, groundwater inflows, pond leakage, etc.) and pumping activities which cause varying levels of mixing and dilution. Therefore, direct conversion of measured and indicated classification to proven and probable reserves is not practical. As the direct conversion is not practical, in the QP’s opinion, the most defensible approach to classification of reserves (e.g., proven versus probable) is to utilize a time-dependent approach as the QP has the highest confidence in the early years of the predictive model results, with a steady erosion of that confidence over time.
Therefore, in the context of time-dependent risk, in the QP’s opinion, the production plan through the end of 2031 approximately 10.3 years of pumping) is reasonably classified as a proven reserve with the remainder [10.3 years]) of production classified as probable. Notably, this results in approximately 49% of the reserve being classified as proven and 51% of the reserve being classified as probable. For comparison, the measured resource comprises approximately 52% of the total
| | | | | |
SalardeAtacama_SEC_Report_515800.040 | December 2022 |
SRK Consulting (U.S.), Inc.
| | | | | |
SEC Technical Report Summary – Salar de Atacama | Page 22 |
measured and indicated resource. In the QP’s opinion, this is reasonable as the overall geological and technical uncertainty for the Salar de Atacama resource and reserve are similar.
Table 1-3 presents the Salar de Atacama mineral reserves as of August 31, 2021.
Table 1-3: Salar de Atacama Mineral Reserves, Effective August 31, 2021
| | | | | | | | | | | | | | | | | | | | |
| Proven Reserve | Probable Reserve | Proven and Probable Reserve |
| Contained Li (Metric Tonnes x 1000) | Li Concentration (mg/L) | Contained Li (Metric Tonnes x 1000) | Li Concentration (mg/L) | Contained Li (Metric Tonnes Li x 1000) | Li Concentration (mg/L) |
| In Situ | 312 | 2,162 | 279 | 1,948 | 591 | 2,061 |
| In Process | 24 | 2,685 | 0 | 0 | 24 | 2,685 |
Source: SRK, 2021
•In process reserves quantify the prior 24 months of pumping data and reflect the raw brine, at the time of pumping. These reserves represent the first 24 months of feed to the lithium process plant in the economic model.
•Proven reserves have been estimated as the lithium mass pumped during Years 2020 through 2030 of the proposed Life of Mine plan
•Probable reserves have been estimated as the lithium mass pumped from 2030 until the end of the proposed Life of Mine plan (2041)
•Reserves are reported as lithium metal
•This mineral reserve estimate was derived based on a production pumping plan truncated in March 2042 (i.e., approximately 21 years). This plan was truncated to reflect the projected depletion of Albemarle’s authorized lithium production quota.
•The estimated economic cutoff grade for the Project is 783 mg/l lithium, based on the assumptions discussed below. The truncated production pumping plan remained well above the economic cutoff grade (i.e., the economic cutoff grade did not result in a limiting factor to the estimation of the reserve).
◦A technical grade lithium carbonate price of US$10,000 / metric tonne CIF Asia.
◦Recovery factors for the salar operation increase gradually over the span of 4 years, from the current 40% to the proposed SYIP 65% recovery in 2025. After that point, evaporation pond recovery is assumed constant at 65%, considering the installation of a liming plant is assumed in 2027. An additional recovery factor of 80% lithium recovery is applied to the La Negra lithium carbonate plant.
◦A fixed average annual brine pumping rate of 442 l/s is assumed, consistent with Albemarle’s permit conditions.
◦Operating cost estimates are based on a combination of fixed brine extraction, G&A and plant costs and variable costs associated with raw brine pumping rate or lithium production rate. Average life of mine operating cost is calculated at approximately $3,000/metric tonne CIF Asia.
◦Sustaining capital costs are included in the cutoff grade calculation and post the SYIP installation, average around US$54M per year.
◦Government royalties are excluded from the cutoff grade calculation as these costs are variable, depending upon price. A 3.5% community royalty is included in the cutoff grade as this royalty is fixed.
•Mineral reserve tonnage, grade and mass yield have been rounded to reflect the accuracy of the estimate and numbers may not add due to rounding.
•SRK Consulting (U.S.) Inc. is responsible for the mineral reserves with an effective date: August 31, 2021. The geologic block model is incorporating all relevant exploration data as of June 30, 2020 and there is no additional data since that date. The resource has been depleted to August 31, 2021.
In the QP’s opinion, key points of uncertainty associated with the modifying factors in this reserve estimate that could have a material impact on the reserve include the following:
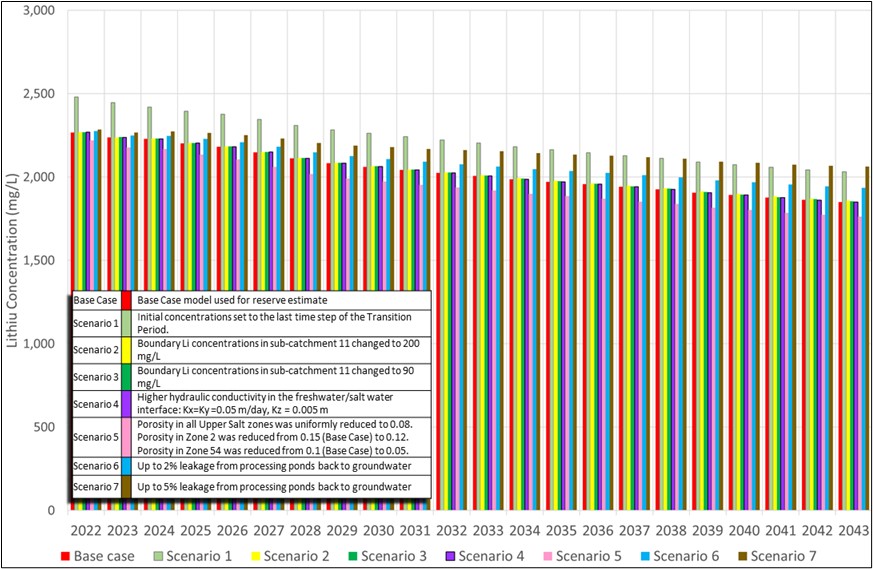
•Resource dilution: the reserve estimate included in this report assumes that the salar brine is replenished at its boundaries at certain rates and with certain chemical composition. Changes in the rate of inflows, versus those assumed, will impact the reserve. For example, an increase in the magnitude of lateral flows into the salar could act to dilute the brine and reduce lithium concentrations in extraction wells, primarily in the southwest area of the Albemarle property.
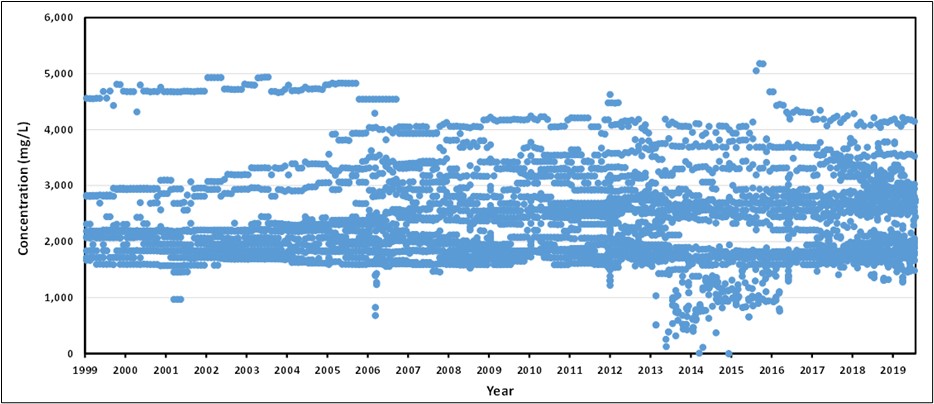
•Initial lithium concentration: The current initial concentration was estimated based on the best data available by space distribution and date (2018 to 2019 sampling campaign), which was assigned to the year 1999 as initial condition for calibration purposes. This assumption underestimates the lithium concentration at the beginning of the production. In order to illustrate this effect of the initial lithium concentration, the lithium distribution mentioned above was set up at the end of the transition model (August 2021). As a result, the average lithium concentrations increase by 9%.
| | | | | |
SalardeAtacama_SEC_Report_515800.040 | December 2022 |
SRK Consulting (U.S.), Inc.
| | | | | |
SEC Technical Report Summary – Salar de Atacama | Page 23 |
•Seepage from processing ponds: the predictive simulations did not consider potential seepage of concentrated brine from the processing pond. Such seepage may have two opposing effects: on one hand, loss of lithium mass between extraction from groundwater and production of lithium carbonate at the end of the concentration process, and on the other hand replenishing groundwater with lithium that could be captured by extraction wells. SRK completed a sensitivity simulation that predicts that pond seepage would result in average lithium concentrations increase of approximately 10% at the end of production as compared to the base case (for the conditions evaluated in the sensitivity analysis).
•Freshwater/brine mixing: the numerical model implicitly simulated the density separation of lateral freshwater recharge and salar brine by imposing a low-conductivity zone at the brine-freshwater interface. It is possible that lateral recharge of freshwater into the salar may increase without this restriction, as the water table declines as a result of pumping and reducing the amount of freshwater lost to evaporation at the periphery of the salar. SRK completed a sensitivity analysis where the hydraulic conductivity at the freshwater/brine interface was increased by half an order of magnitude (dashed green line). This scenario resulted in no material change compared to the base case.
•Hydrogeological assumptions: factors such as specific yield and hydraulic conductivity play a key role in estimating the volume of brine available for extraction in the wellfield and the rate it can be extracted. Actual contacts between hydrogeological units may not be exactly as represented in the numerical model. These factors are variable through the salar and are difficult to directly measure. Hydraulic conductivities and specific yields lower than assumed in the numerical model would result in reduced pumpability and reduced lithium mass extraction. Specific yields and porosities lower than assumed in the model would lead to faster migration of fresh / brackish water from the edges of the salar and dilution of lithium concentrations in extraction wells. SRK completed a sensitivity where effective porosities in the upper part of the salar were reduced by 20%. This scenario resulted in average lithium concentrations reduction of approximately 5% at the end of production as compared to the base case.
•Lithium carbonate price: although the pumping plan remains above the economic cutoff grade, commodity prices, can have significant volatility which could result in a shortened reserve life.
•Change to SQM pumping plan: the numerical model makes certain assumptions regarding the SQM pumping plan (which terminates at the end of 2030). Overall, SQM has extracted – and is expected to extract – brines at greater rates than Albemarle. SQM pumping has resulted in drawdowns at the salar of up to approximately 14 m in the southwest region of the salar. Enhanced pumping by SQM, or lengthening of the pumping period, may have two effects: reduce available resource in the salar, and draw freshwater at greater rate from the periphery of the salar (dilution effect). Conversely, reduced extraction by SQM would increase available resources and reduce dilution.
•Process recovery: the ability to extract the full lithium production quota within the defined production period relies upon the ability to increase recovery rates of lithium in the evaporation ponds from current levels of approximately 40% to a target of approximately 65%. This will require updating the process flow sheet at the salar to reduce lithium losses to precipitated salts. In the QP’s opinion, the assumed recovery rates are reasonable; however, there remains uncertainty in performance of the new process and any material
| | | | | |
SalardeAtacama_SEC_Report_515800.040 | December 2022 |
SRK Consulting (U.S.), Inc.
| | | | | |
SEC Technical Report Summary – Salar de Atacama | Page 24 |
underperformance to these targets could limit Albemarle’s ability to extract its full lithium quota prior to expiry of the quota.
•Lithium production quota: the current production quota acts as a hard stop on the estimated reserve. It is important to note that the expiry date for production of this lithium is 2043. If raw brine grades, pumping rates or process recoveries underperform forecasts and Albemarle cannot produce the full quota by 2043, this potential reserve will be lost (i.e., Albemarle cannot recover lost production in later years and cannot pump faster than the regulatory limit of 442 l/s to offset any underperformance). Conversely, with lithium grades well above economic cutoff and approximately 30% of the estimated mineral resource converting to reserve, the potential to negotiate an additional production quota with the government of Chile presents an opportunity to increase the current reserve, which is artificially constrained by the current quota.
1.5Mineral Processing and Metallurgical Testing
Albemarle's operations in Chile are developed in two areas, the Salar de Atacama and La Negra.
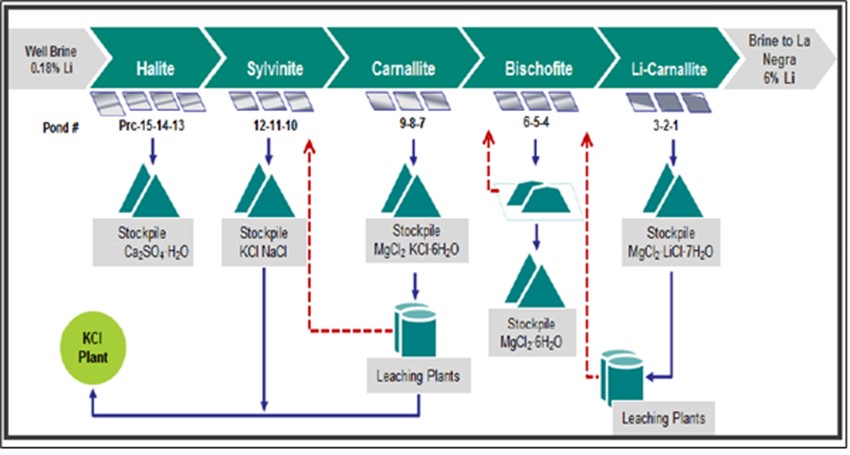
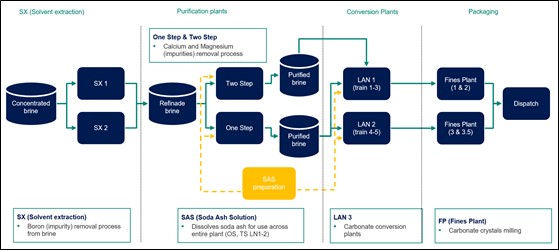
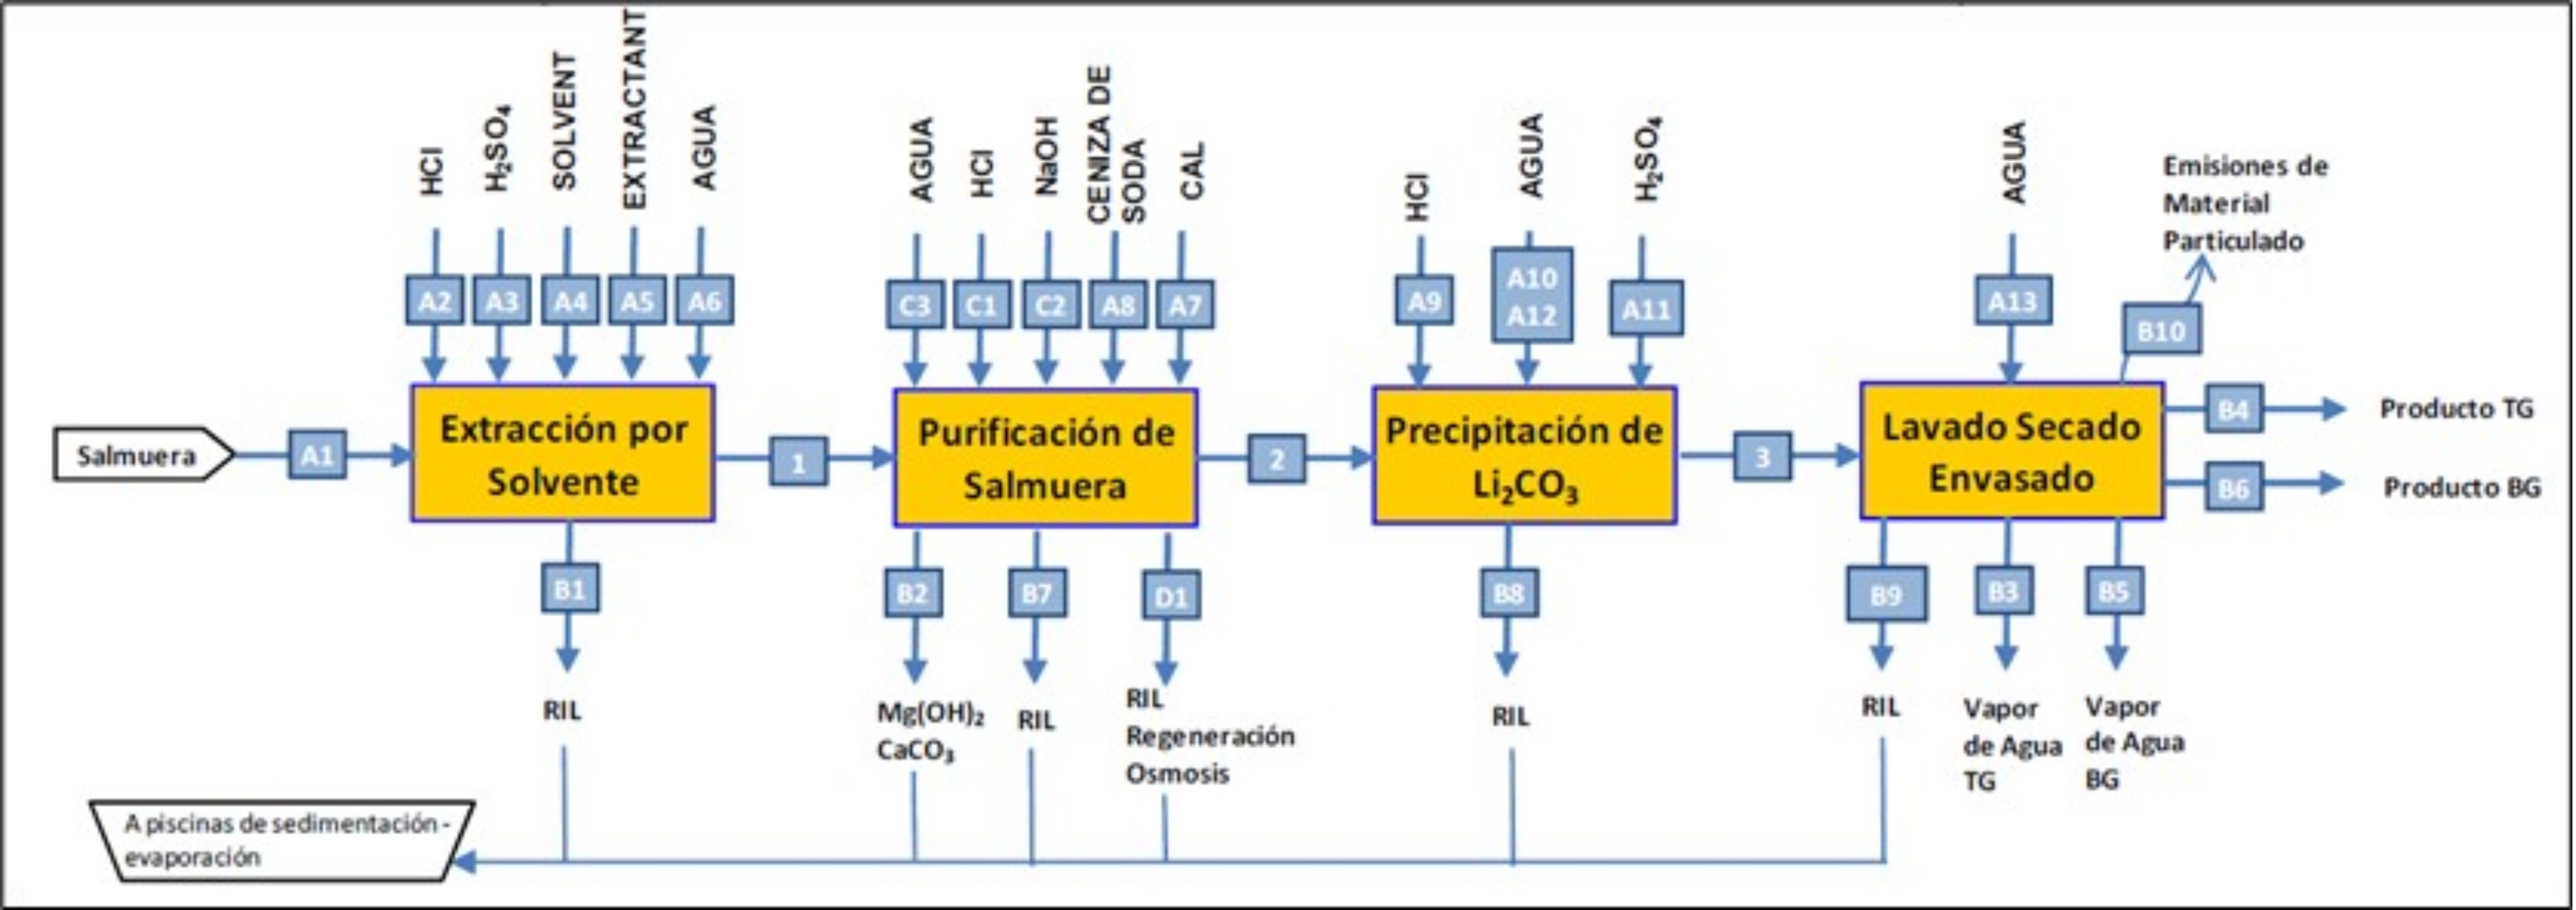
At the salar, a lithium-rich chloride brine is extracted from production wells. This brine is pumped to ponds where it goes through a concentration process utilizing solar evaporation. The objective of the concentration process is to obtain a concentrated lithium chloride brine of around 6% lithium that is largely depleted of impurities such as sulfate, sodium, calcium, potassium and magnesium. This concentrated brine is transported to the La Negra chemical plant for further processing. There is also a potash (KCl) plant for byproduct potash production at the salar. Albemarle also harvests halite and bischofite salts from the evaporation ponds as byproduct production for third party sales.
The La Negra plant receives the concentrated brine from the salar, and the brine is further processed with several purification steps followed by the conversion of the lithium from a chloride to a lithium carbonate. The La Negra plant produces both technical and battery grade lithium carbonate. Albemarle has also historically produced lithium chloride product at La Negra.
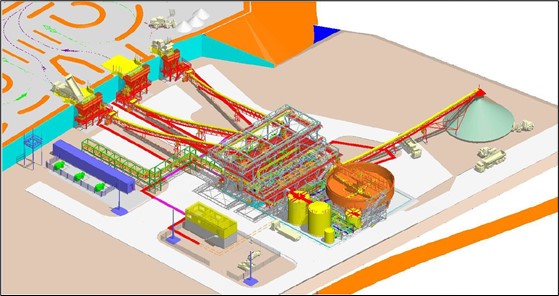
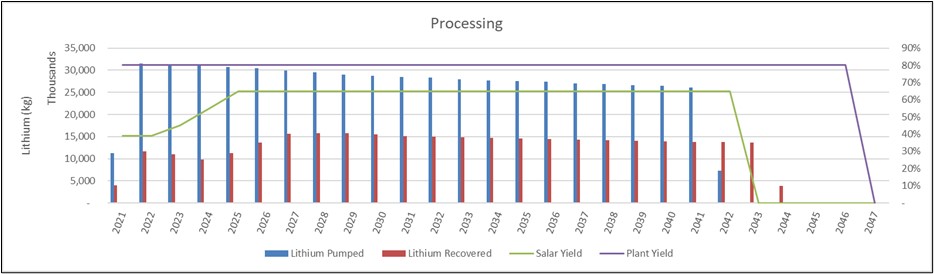
These operations have been in production for approximately 40 years and most of the data relied upon to forecast operational performance relies upon experience with historic production. However, Albemarle is proposing a modification to its flow sheet at the salar to improve lithium process yields in the evaporation ponds. Albemarle refers to this process as the Salar Yield Improvement Program (SYIP). The SYIP aims to improve this process recovery through mechanical grinding and washing of by-product salts in two new plants, the Li-Carnalite Plant and Bischofite Plant.
Based on testwork performed in 2017 by K-UTEC on the proposed SYIP flowsheet, Albemarle has assumed evaporation pond yield improves up to an average of around 65%. Current operations have a 40% recovery and is increasing. SRK has generally accepted this assumption although has modified the yield to be variable based on lithium concentration in the raw brine. Over time, SRK’s pumping plan predicts that the ratio of sulfate to calcium will increase in the raw brine, potentially reducing evaporation pond yields. To offset this potential future imbalance, SRK has assumed addition of a liming plant to increase calcium levels in the ponds and reduce lithium losses which could be solved in the future by optimizing the annual pumping plan. Post the installation of this liming plant, SRK has assumed a fixed 65% evaporation pond yield.
| | | | | |
SalardeAtacama_SEC_Report_515800.040 | December 2022 |
SRK Consulting (U.S.), Inc.
| | | | | |
SEC Technical Report Summary – Salar de Atacama | Page 25 |
1.6Infrastructure
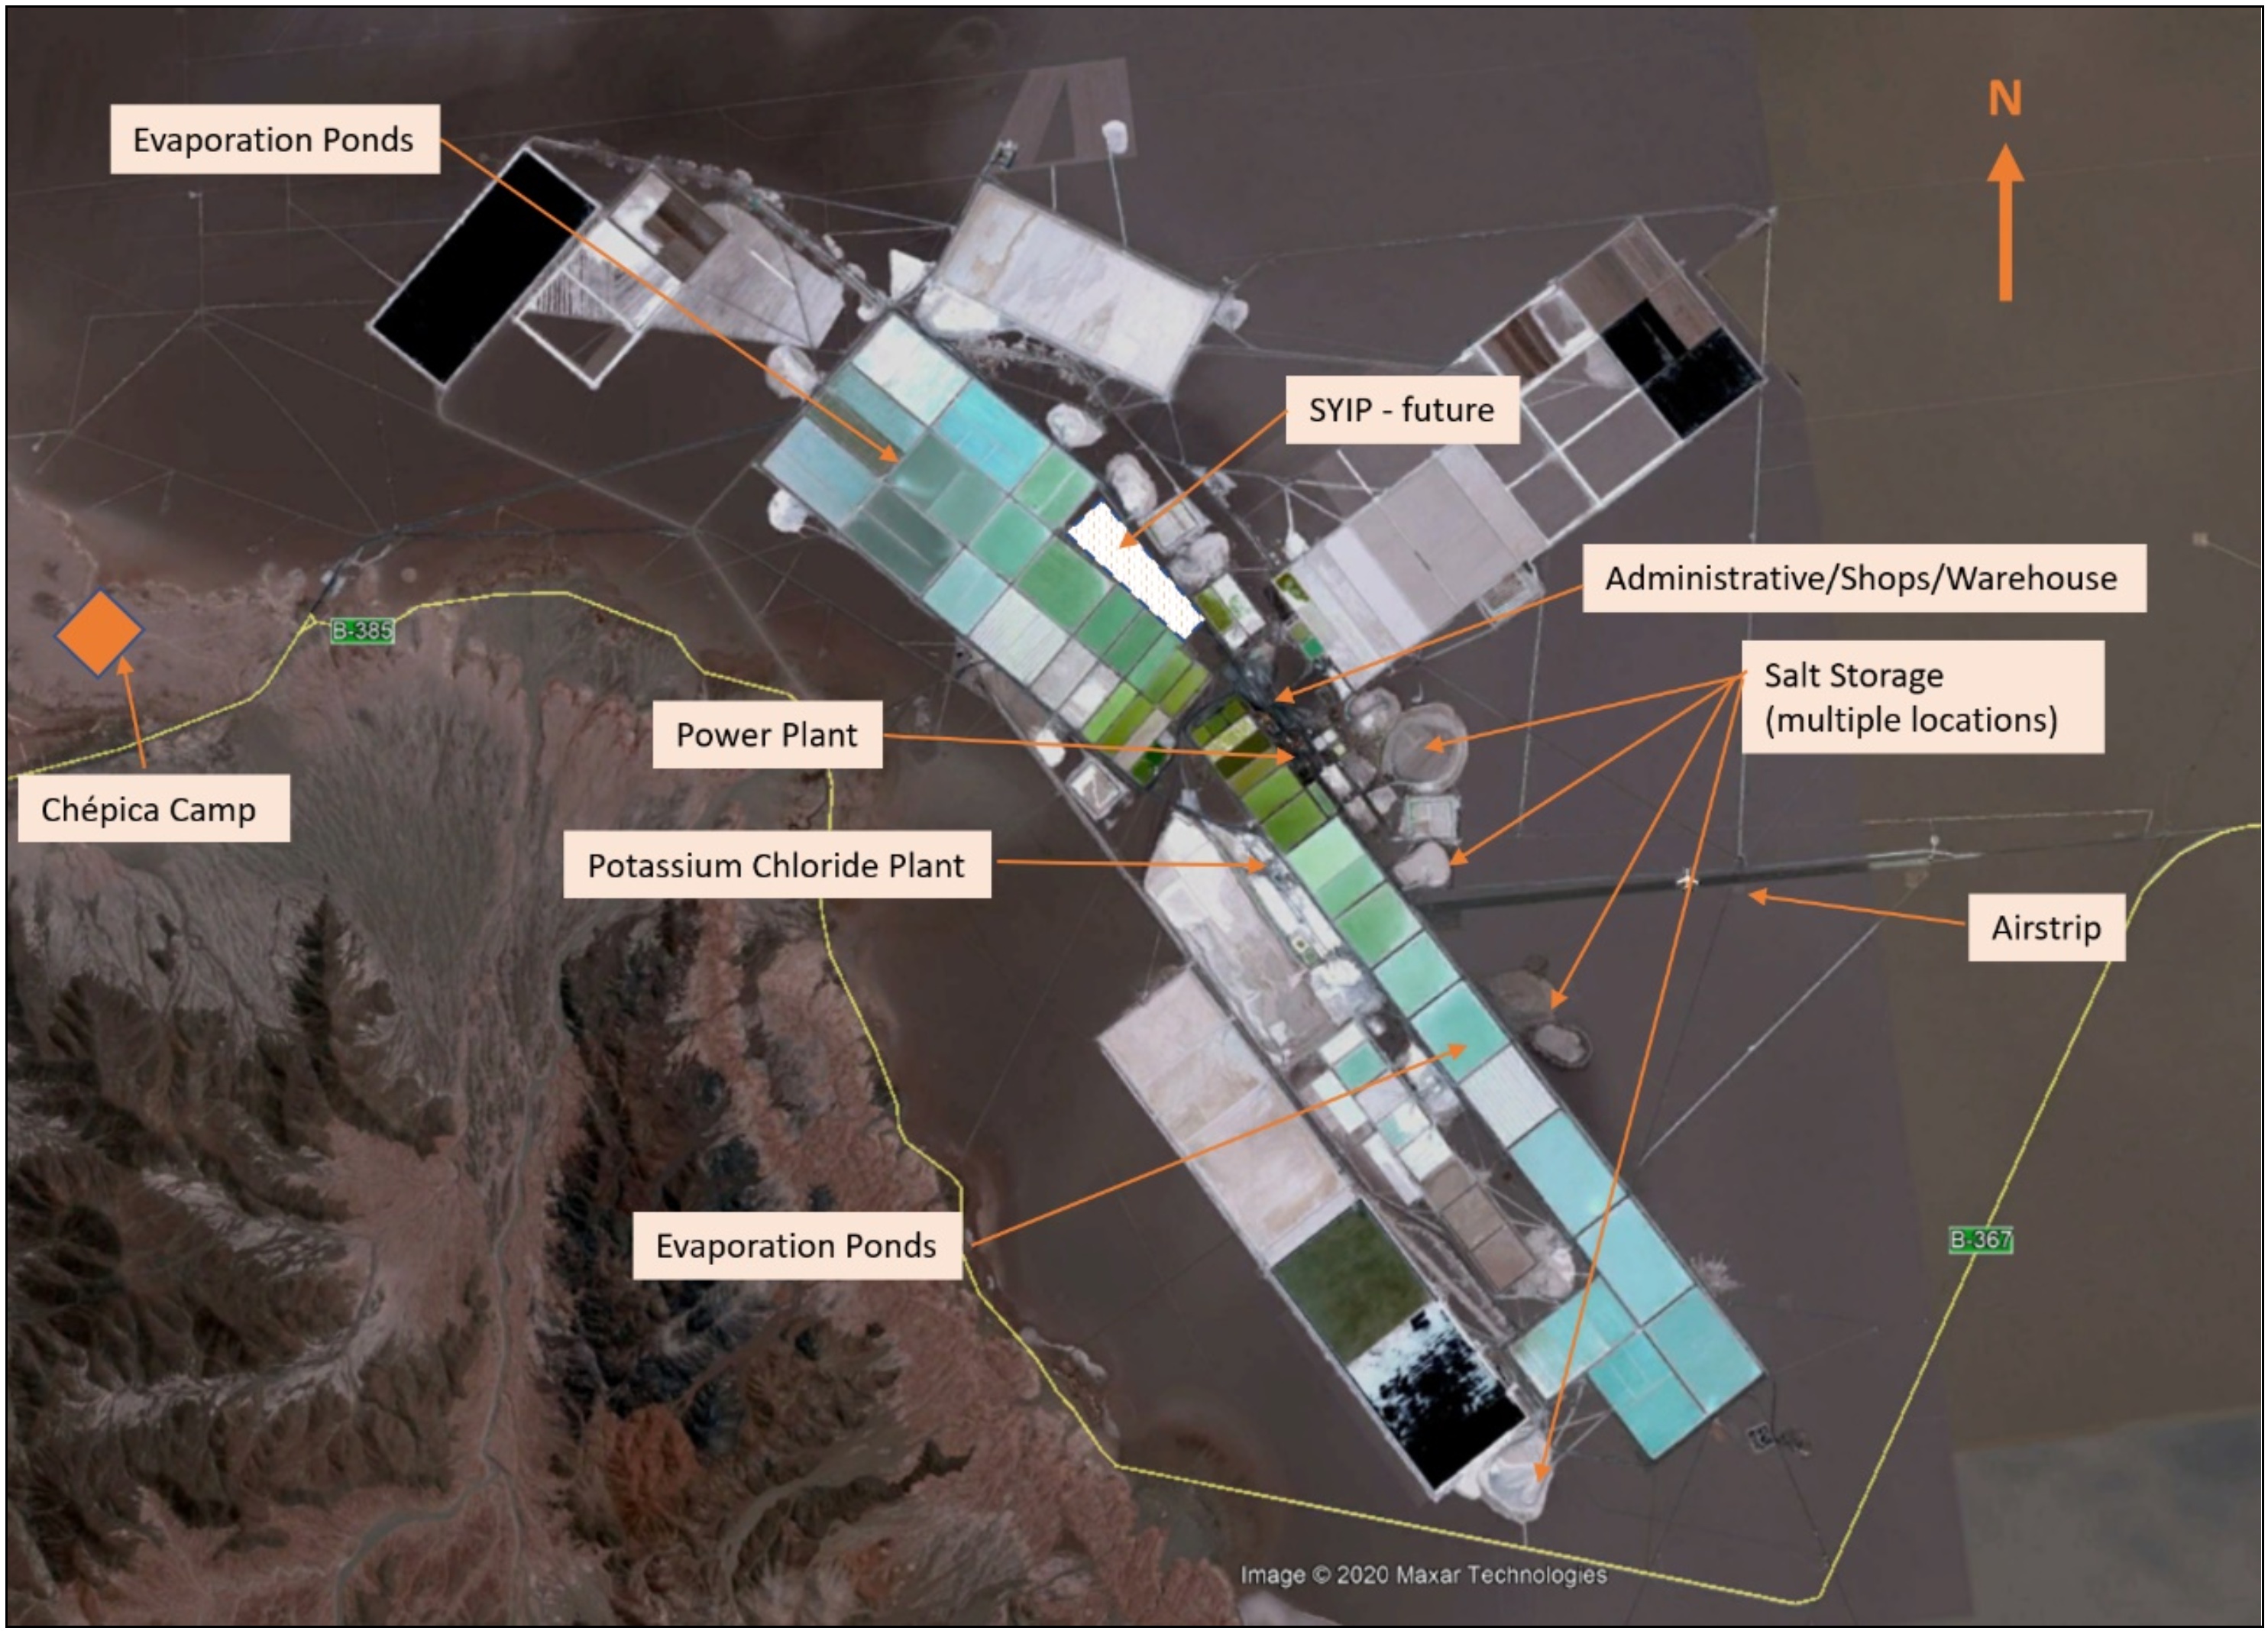
The Project is a mature functioning operation with two separate sites that contain key facilities. Access is fully developed, with the majority accessible by paved major highway and local improved roadways on site. There is an air strip at the salar operations. The Antofagasta airport is the nearest major commercial airport servicing the La Negra operation (the Calama airport is the closet major commercial airport to the salar). The infrastructure is in place, operating and provides all necessary support for ongoing operations as summarized in this report.
The Salar site contains the brine well fields, brine supply water pipelines to evaporation ponds, primary processing facilities to create a concentrated brine, a phosphate plant that creates a potassium chloride product, camps; including a new camp that is partially constructed and functional with a second phase planned, airfield, access and internal roads, diesel power generated supply and distribution, water supply and distribution, shop and warehouse facilities, administrative offices, change houses, waste salt storage areas, fuel storage systems, security and communications systems. The concentrated brine product is trucked approximately 260 km to the La Negra facility. Future additions to the infrastructure include substation and powerline additions to connect to the local Chilean power system in 2021.
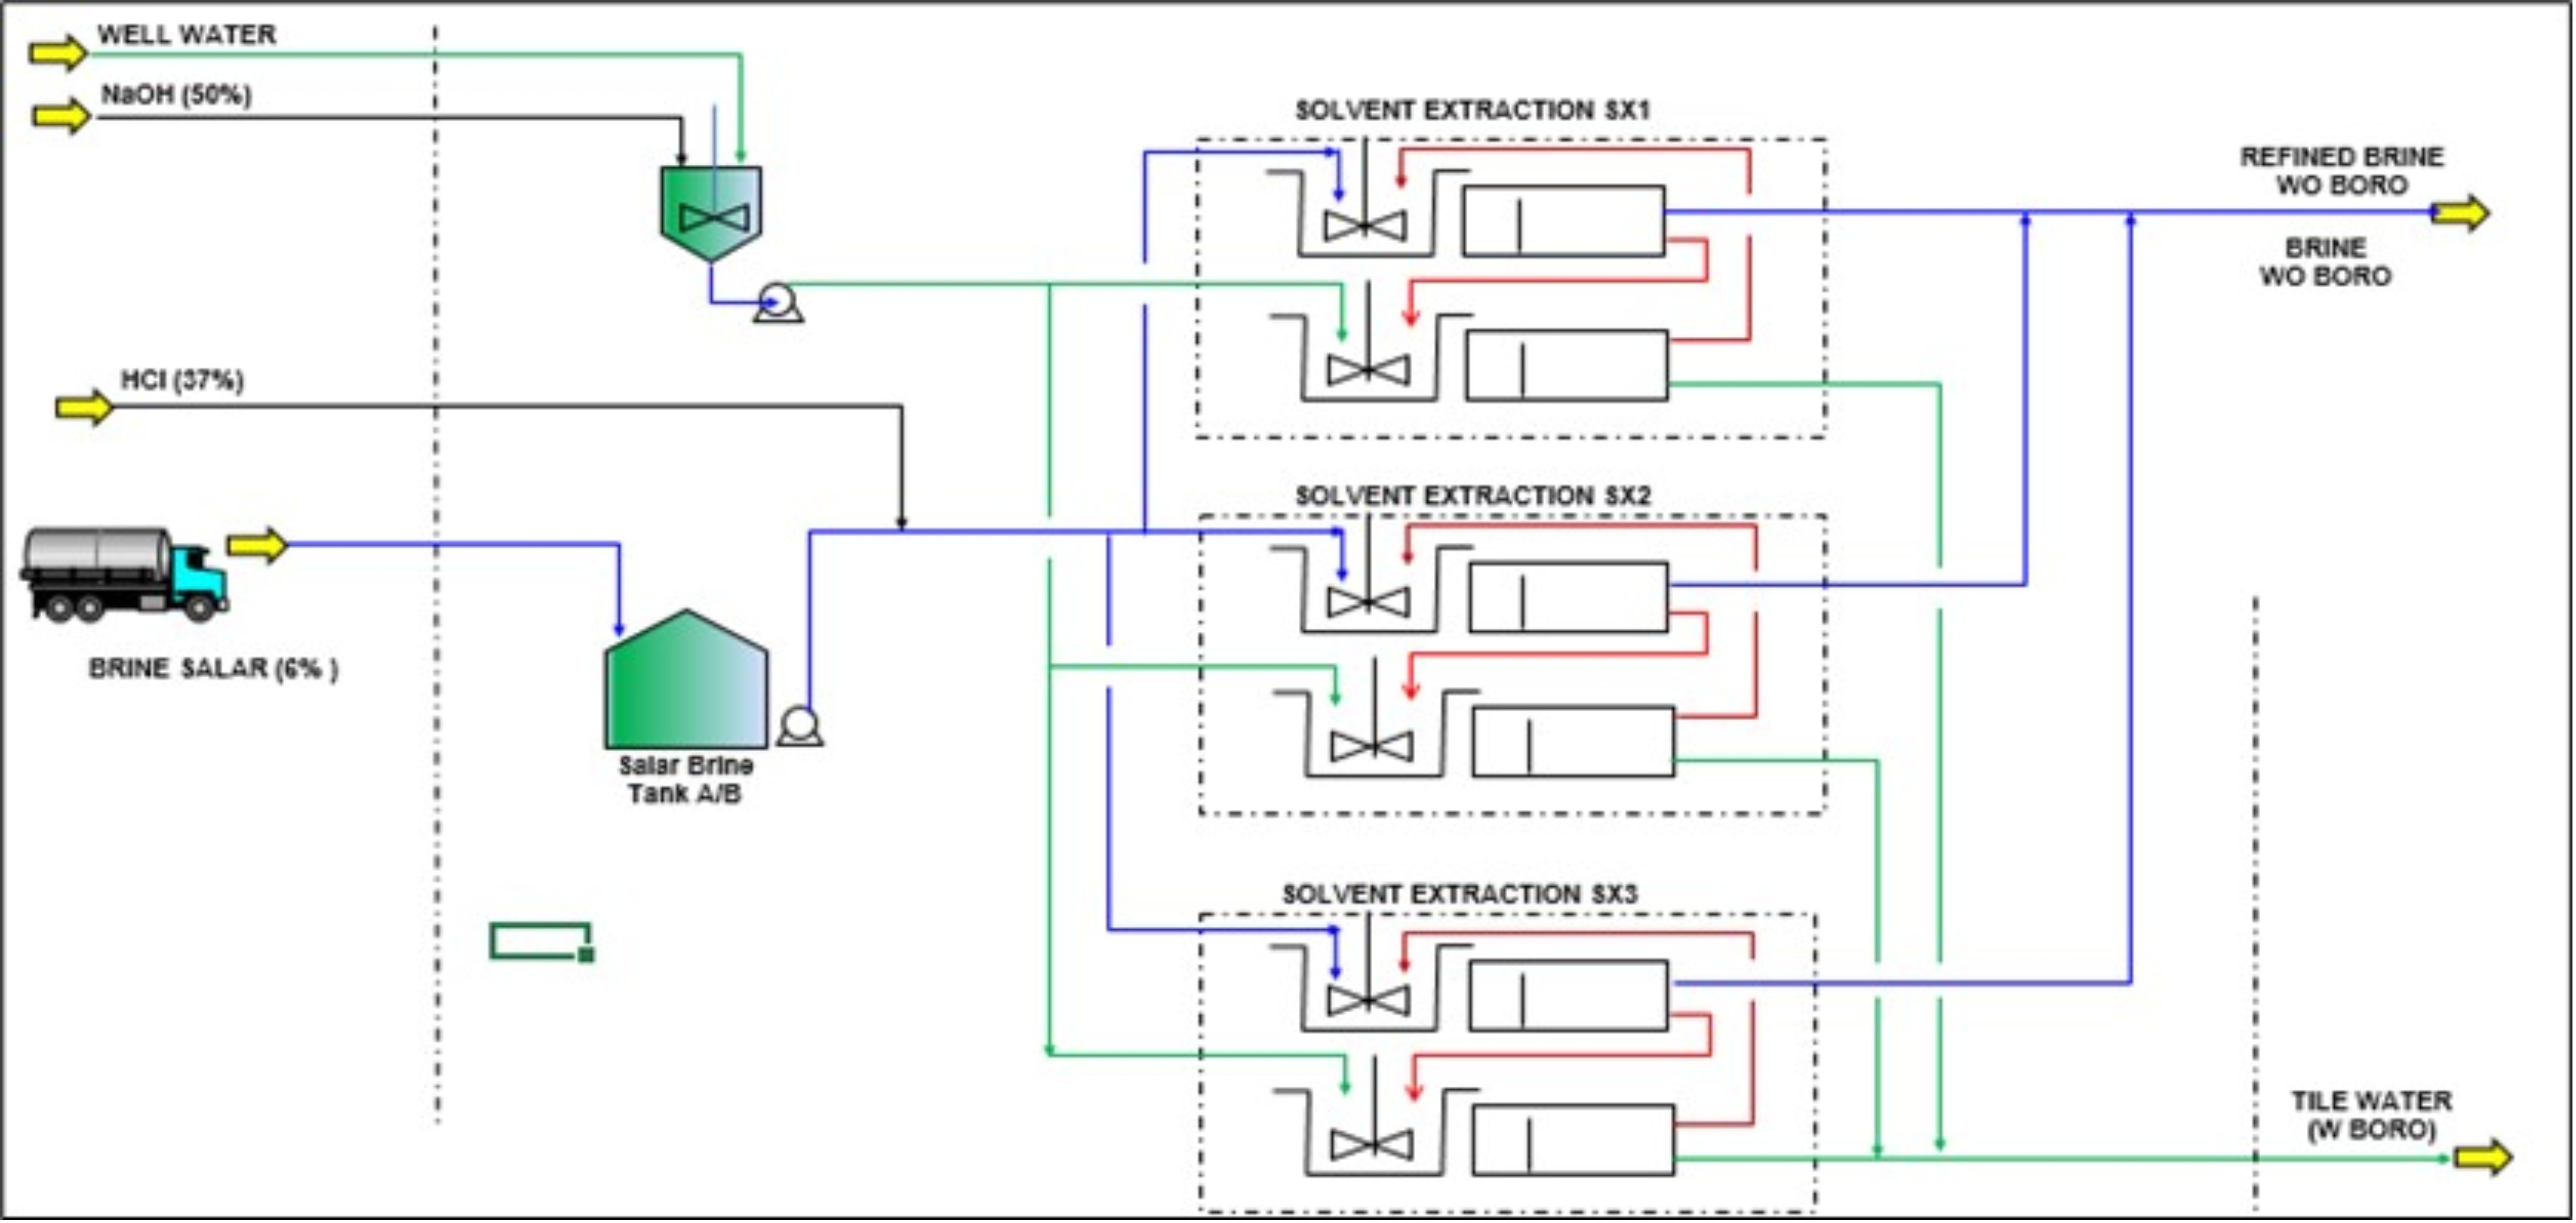
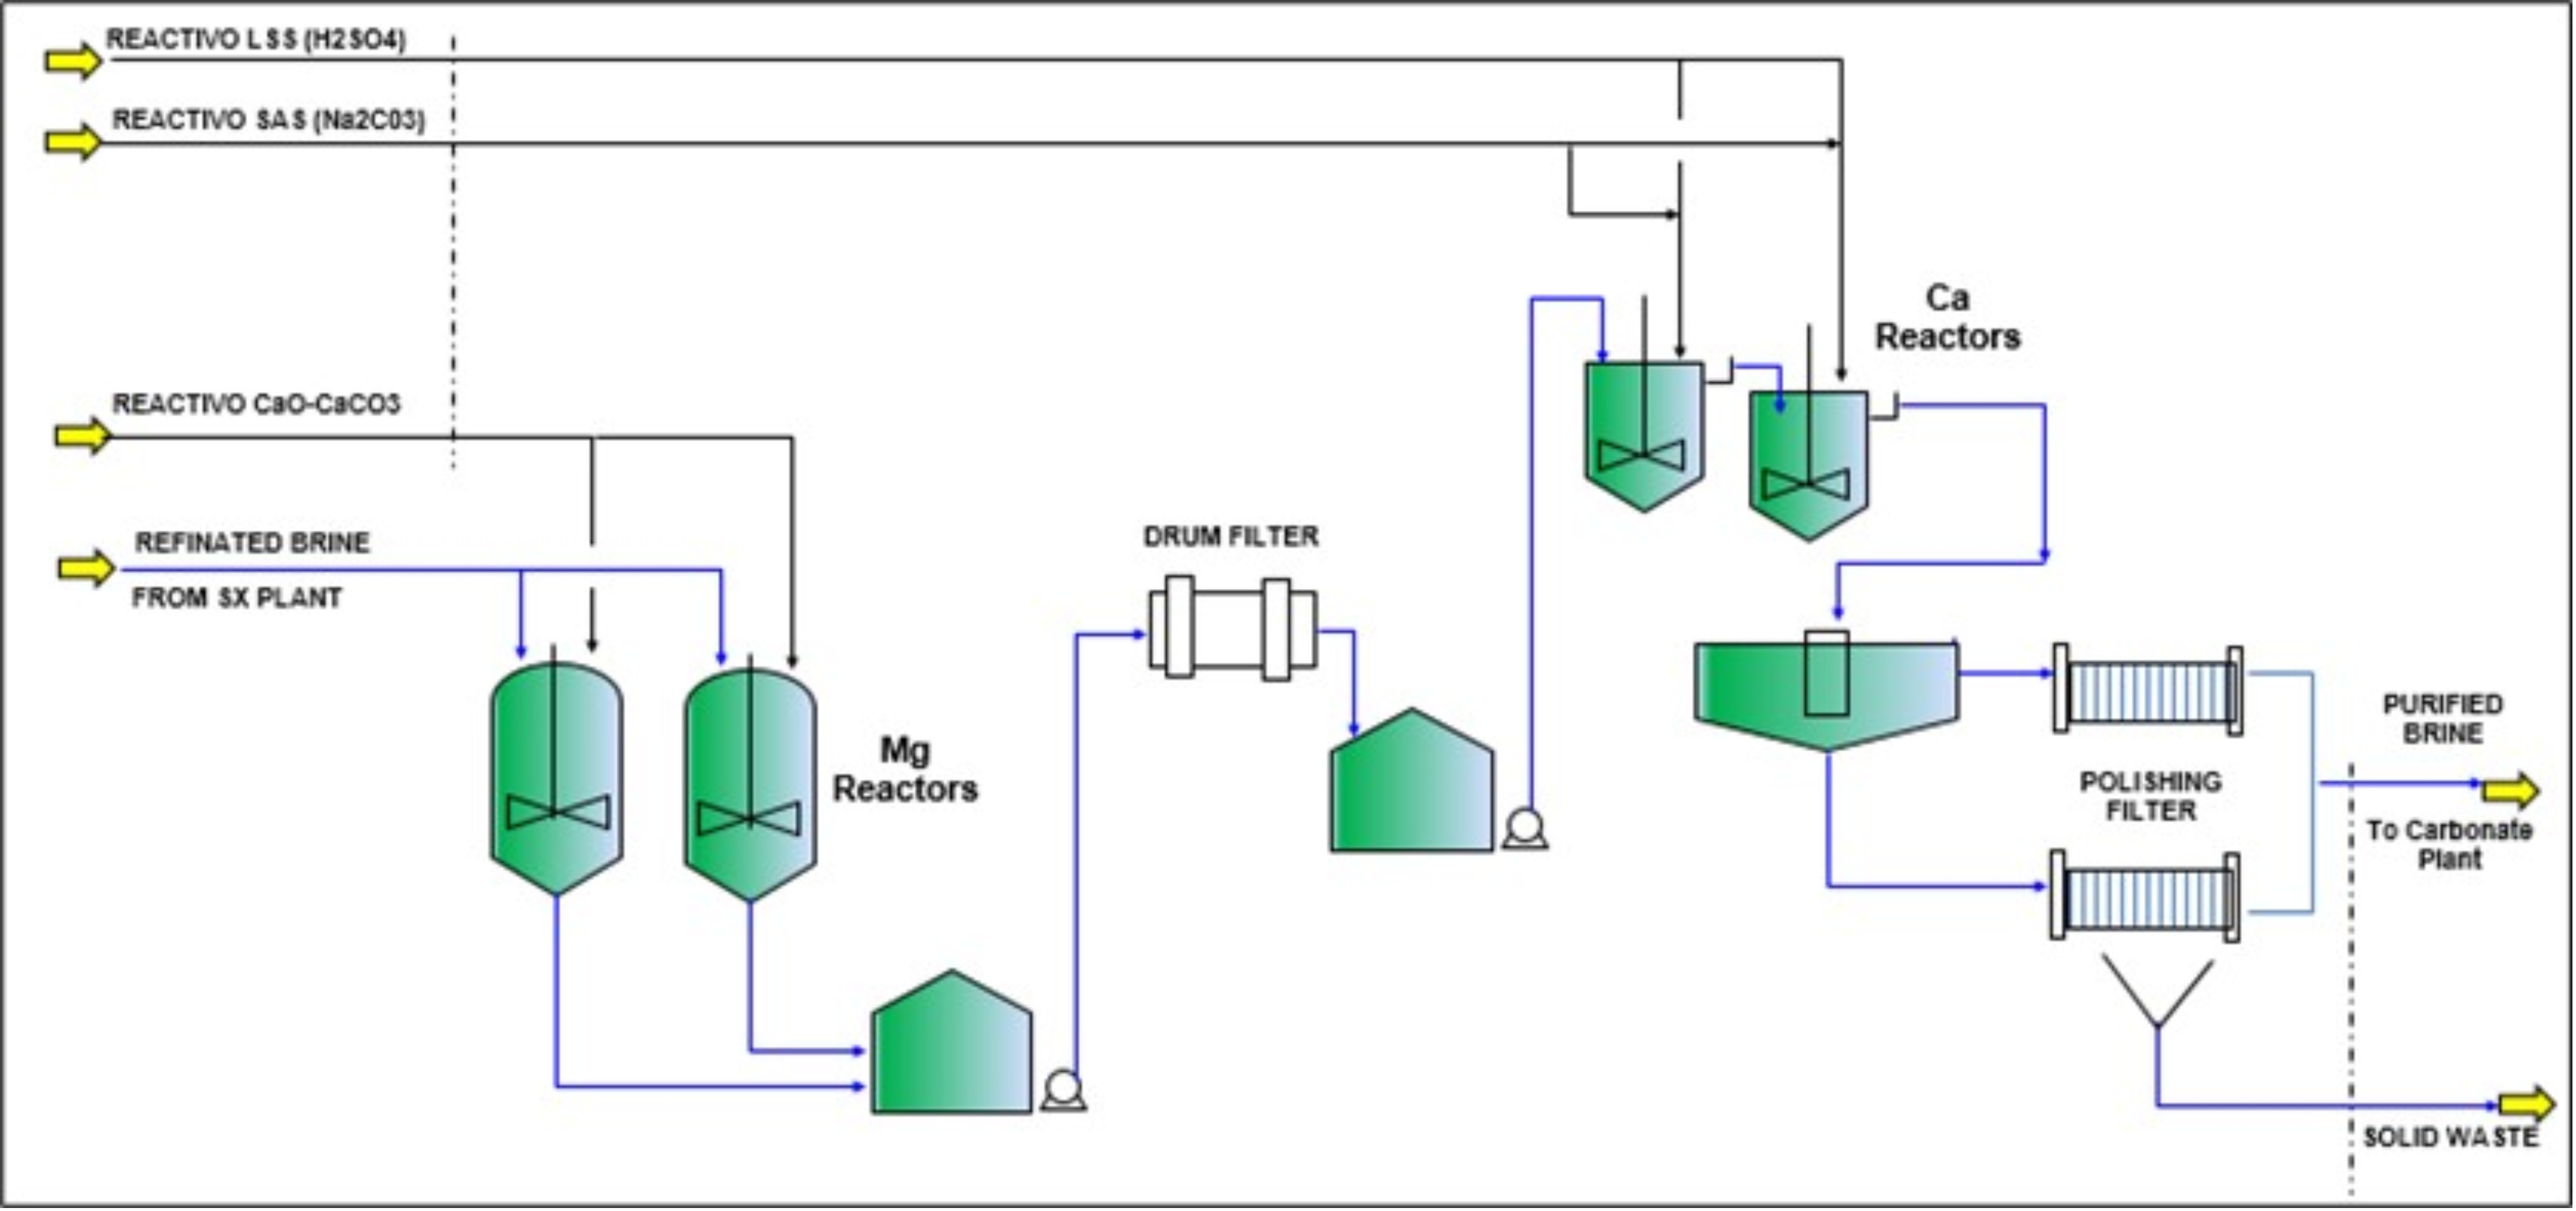
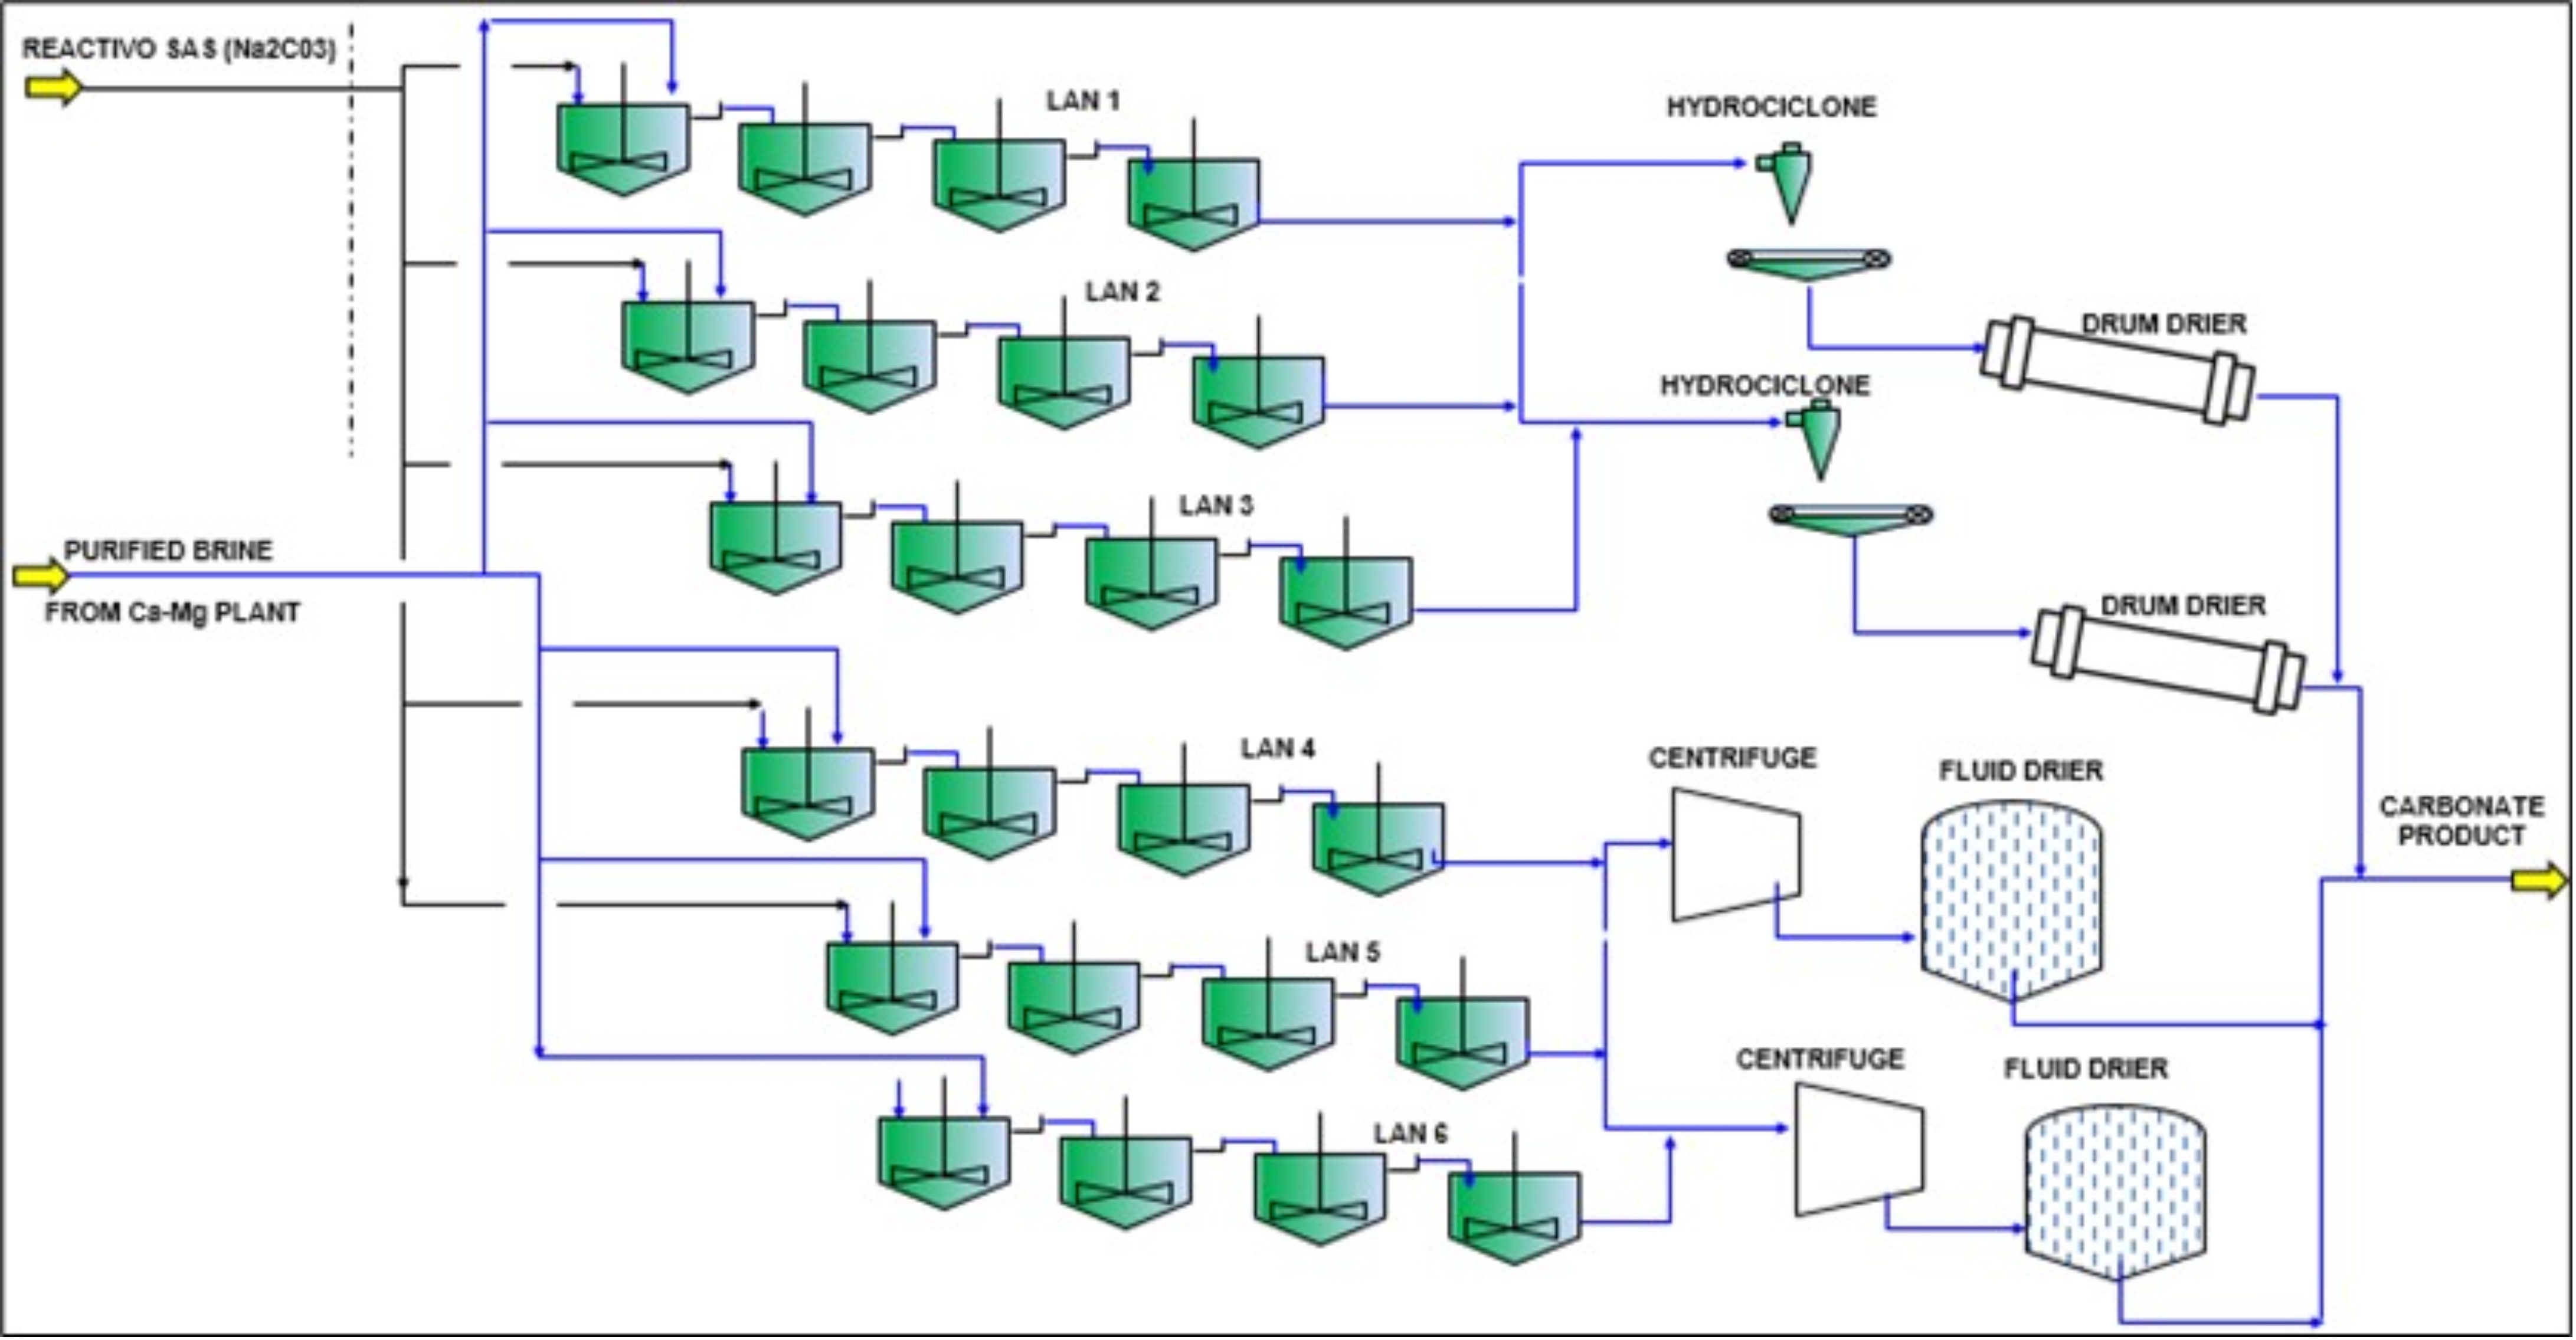
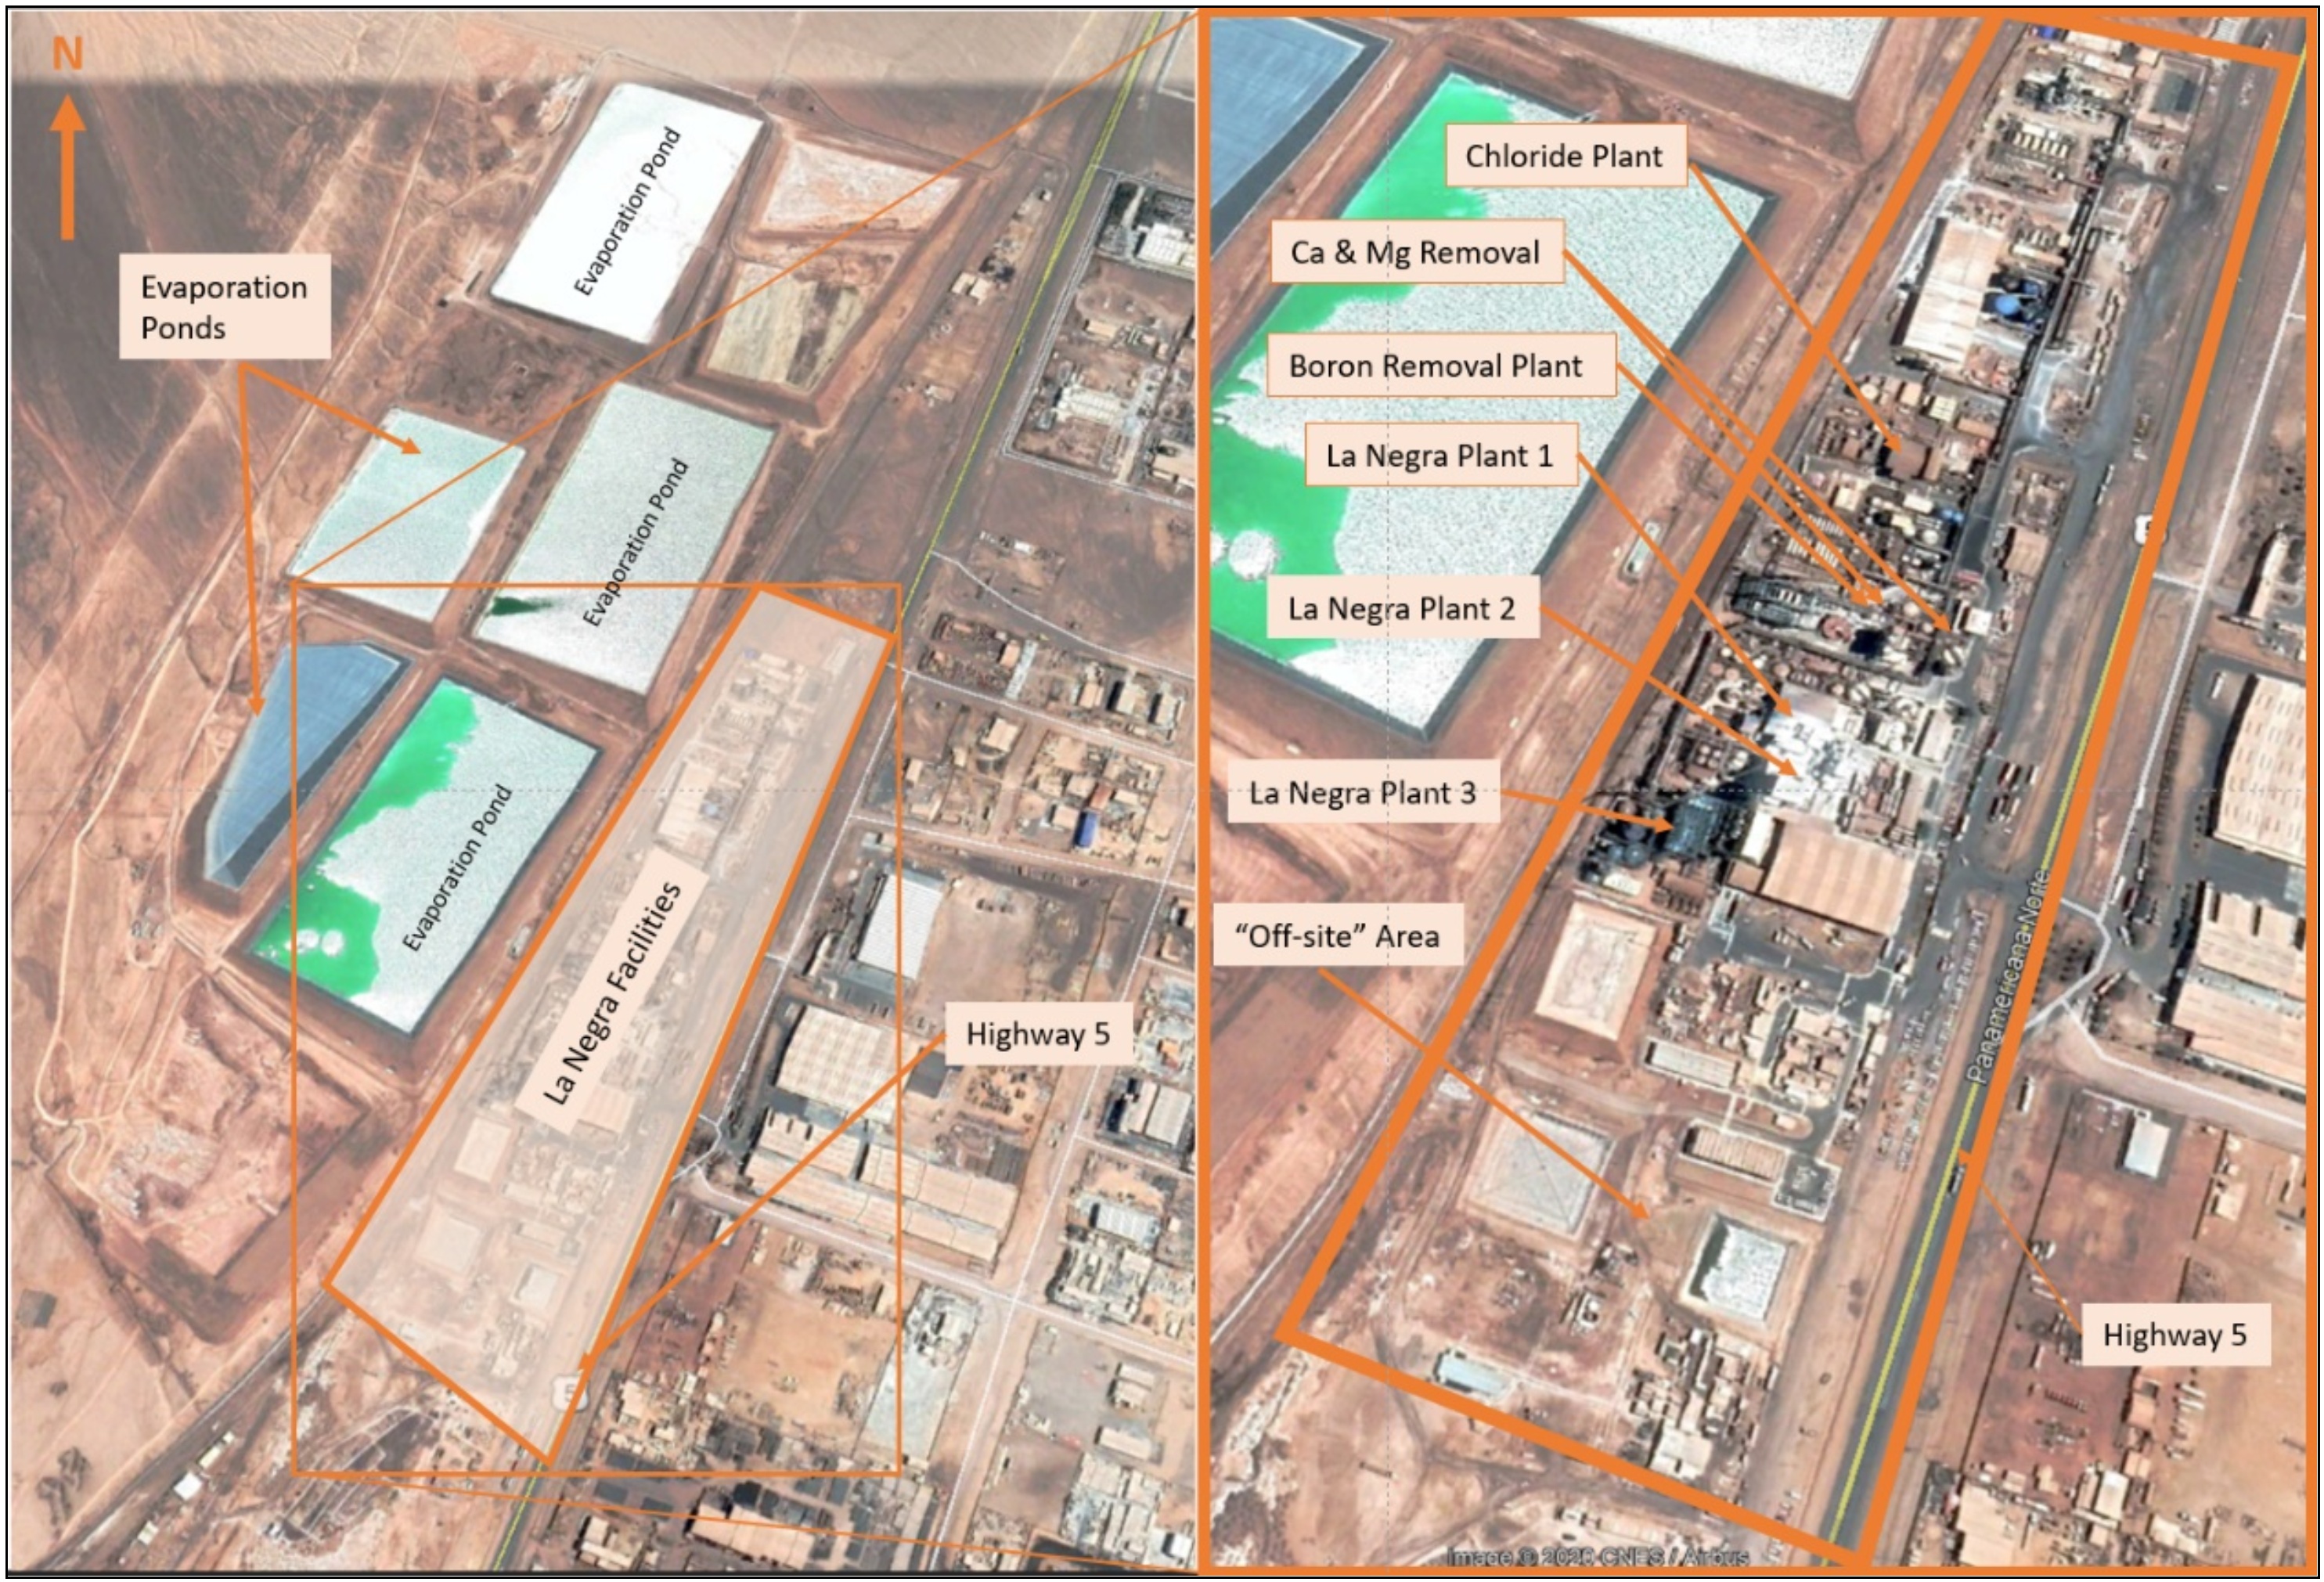
The La Negra plant purifies the lithium brine from the Salar Plant and converts the brine into lithium carbonate and lithium chloride. Facilities at the site include the boron removal plant, calcium and magnesium removal plant, lithium carbonate conversion plants, lithium chloride plant, evaporation sedimentation ponds and an “offsite” area where raw materials are warehoused and combined as needed in the processing facilities. Power to the facility is provided by the regional power company via a 110 kV transmission line and distributed throughout the plant to load centers. Piped natural gas provides the energy for heating and steam needs at the facilities. The project is security protected and has a full communication system installed.
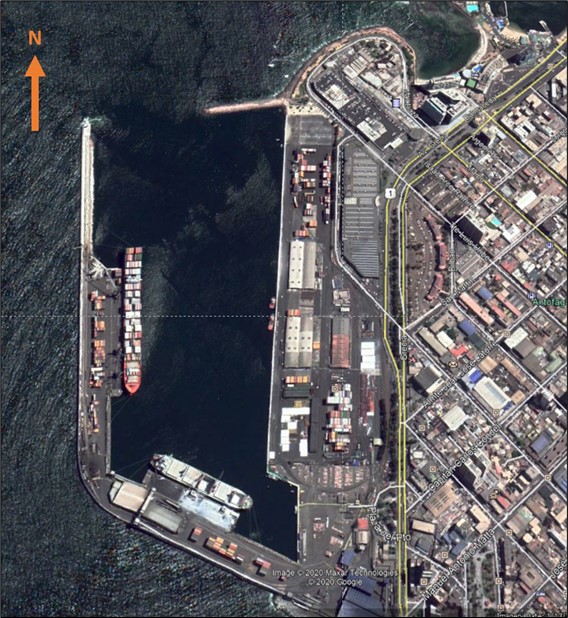
Final products from the La Negra plant are delivered to clients by truck, rail, or through two port facilities near the plant.
1.7Environmental, Social, and Closure
Baseline studies, in both operational areas, have been developed since the first environmental studies for permitting were submitted; 1998 in La Negra, and 2000 at Salar de Atacama. With the ongoing monitoring programs in both locations, environmental studies, such as hydrogeology and biodiversity, are regularly updated.
The Salar de Atacama basin presents a unique system due to the biodiversity associated with lake and wetland systems that depend on the hydrogeological conditions of the area. There are also indigenous areas and communities in the sector. As such, the key environmental issues at Salar de Atacama include biodiversity, hydrogeology, and socioeconomics.
La Negra is located within an industrial area which is in saturation conditions for the daily and annual standard of inhalable particulate matter (PM10). Although there are no surface water courses, there is an aquifer that could be affected by potential infiltrations from the plant facilities. As such, a water quality monitoring program is in place. Air quality, hydrogeology, and water quality have been deemed as key environmental characteristics of the La Negra area.
| | | | | |
SalardeAtacama_SEC_Report_515800.040 | December 2022 |
SRK Consulting (U.S.), Inc.
| | | | | |
SEC Technical Report Summary – Salar de Atacama | Page 26 |
The operations of Albemarle have adequate plans to address and follow-up the most sensitive and relevant environmental issues, such as hydrogeological/biodiversity issues, and those associated with the indigenous communities in the Salar de Atacama area.
Albemarle adequately follows up on issues related to water quality in the Negra and fluctuations in the water table and potential effects on the sensitive ecosystems around the Salar de Atacama, including analysis of possible cumulative effects given the multiplicity of actors that extract brine and freshwater in the area. The aim of the Early Warning Plan is to promptly detect any deviation from what was indicated in the initial environmental assessment, preventing unforeseen impacts from occurring. Notwithstanding the above, the Salar de Atacama is a complex system and requires constant updating of management tools based on the results of the monitoring programs, and also be attentive to requirements or new tools that the authority may incorporate.
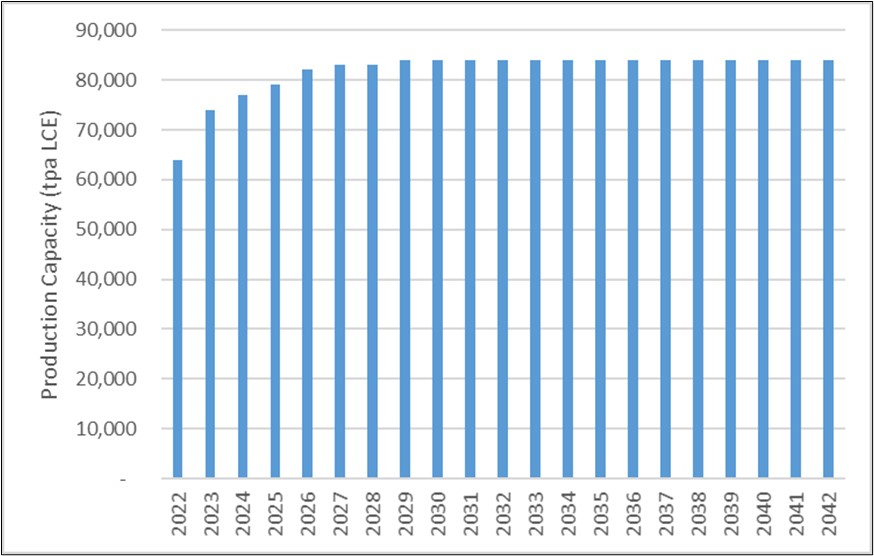
Albemarle has the environmental permits for an operation with an average brine extraction rate of 442 L/s, a production of 250,000 cubic meters per year (m3/y) of brine concentrated in solar evaporation ponds with an approximate surface area of 1,043 ha, for a production of 94,000 t/year of lithium carbonate equivalent (LCE). Brine exploitation is authorized until 2043. Any modification of the production and/or extraction, or to any approved conditions, will require a new environmental permit.
Albemarle has an approved closure plan (Res. Ex. N°287/2019), which includes all environmental projects approved until 2016, including EIA “Modification and improvement solar evaporation system” (RCA N°021/2016).This closure plan considers a life of mine until 2043, estimated by the authority’s methodology, which response to financial assurance purposes and it does not define the definitive closure date.
In terms of closure activities, the approved closure plan considers 17 month period of execution, which includes backfilling of the ponds, and dismantling and demolish of all infrastructure, including final disposal.
Post-closure activities comprise monitoring of 221 monitoring wells for water quality, evaporation and flux monitoring of groundwater and surficial waters on site. This monitoring program will continue for three years after closure, on a quarterly basis.
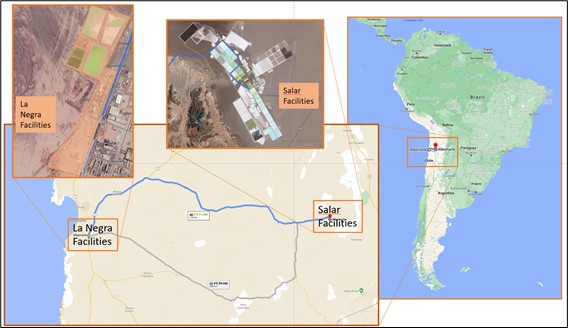
The closure cost has been estimated based on the approved closure plan plus a conceptual estimate of all environmental projects reviewed in this document, and that were not included in the closure plan. The total closure costs of La Negra and Salar de Atacama Plants are US$40.89 million, considering direct and indirect costs, and contingencies.
However, the purpose of this estimate is only to provide the Chilean government an assessment of the closure liabilities at the site and form the basis of financial assurance. This type of estimate typically reflects the cost that the government agency responsible for closing the site in the event that an operator fails to meet their obligation. If Albemarle, rather than the government, closes the site in accordance with their current mine plan and approved closure plan, the cost of closure is likely to be different from the financial assurance cost estimate approved by the government.
Furthermore, because closure of the site is not expected until 2043, the closure cost estimate represents future costs based on current expectations of site conditions at that date. In all probability, site conditions at closure will be different than currently expected and, therefore, the current estimate of closure costs is unlikely to reflect the actual closure cost that will be incurred in the future.
| | | | | |
SalardeAtacama_SEC_Report_515800.040 | December 2022 |
SRK Consulting (U.S.), Inc.
| | | | | |
SEC Technical Report Summary – Salar de Atacama | Page 27 |
1.8Capital and Operating Costs
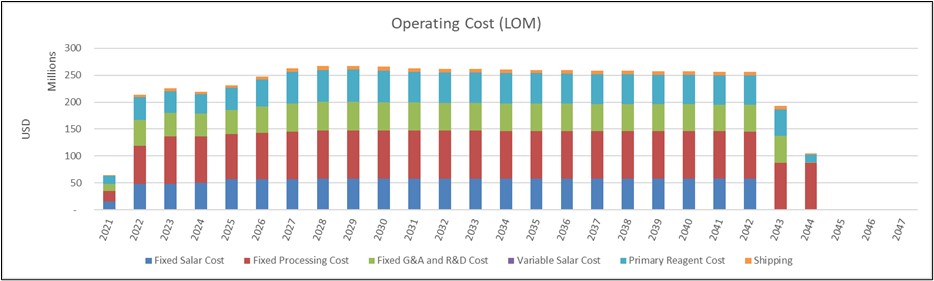
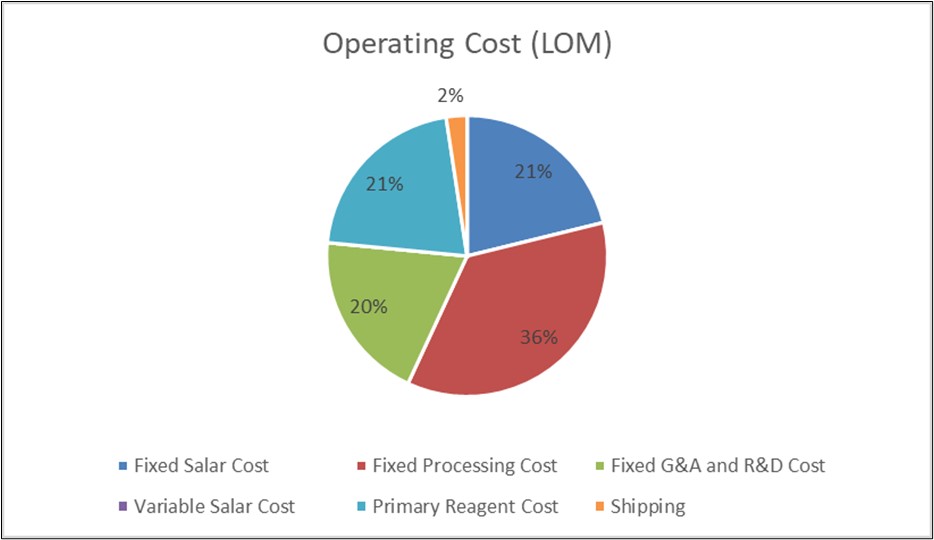
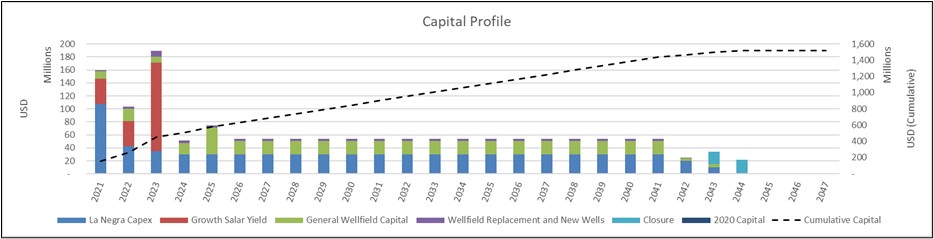
The Salar de Atacama and La Negra facilities are currently operating. Capital and operating costs are forecast as a normal course of operational planning with a primary focus on short term budgets (i.e., subsequent year). The operations currently utilizes mid (e.g., five year plan) and less detailed long-term (i.e., LoM) planning. Given the limited official mid and long-term planning completed at the operation, SRK developed a long-term forecast for the operation based on Albemarle forecasts, combined with historic operating results, adjusted for assumed changes in operating conditions and planned strategic changes to operations (the most significant changes being completion of the La Negra 3 expansion and the installation of the SYIP). SRK’s capital expenditure forecast is provided in Table 1-4 and its operating cost forecast is provided in Figure 1-1.
Table 1-4: Capital Cost Forecast ($M Real 2020)
| | | | | | | | | | | |
| Period | Total Sustaining Capex | Total Expansion Projects | Capital Expenditure (US$M Real 2020) |
| 2020 | 12.9 | 64.8 | 77.7 |
| 2021 | 37.5 | 64.9 | 96.1 |
| 2022 | 43.2 | 88.0 | 125.5 |
| 2023 | 51.0 | 47.0 | 90.2 |
| 2024 | 52.4 | - | 51.0 |
| 2025 | 75.8 | - | 74.4 |
| 2026 | 53.8 | - | 53.8 |
| 2027 | 53.8 | - | 53.8 |
| 2028 | 53.8 | - | 53.8 |
| 2029 | 53.8 | - | 53.8 |
Remaining LOM (2031 – 2043) | 685.6 | -- | 685.6 |
Note: 2020 capex is July – December only, assumed at 50% of total 2020 spend
Source: SRK, 2021
Note 2020 costs reflect a partial year (September – December)
Source: SRK
Figure 1-1: Total Forecast Operating Expenditure (Real 2020 Basis) (Tabular Data shown in Table 19-9)
| | | | | |
SalardeAtacama_SEC_Report_515800.040 | December 2022 |
SRK Consulting (U.S.), Inc.
| | | | | |
SEC Technical Report Summary – Salar de Atacama | Page 28 |
Estimation of capital and operating costs is inherently a forward-looking exercise. These estimates rely upon a range of assumptions and forecasts that are subject to change depending upon macroeconomic conditions, operating strategy and new data collected through future operations. For this report, capital and operating costs are estimated to a PFS-level, as defined by S-K 1300, with a targeted accuracy of +/-25%. However, this accuracy level is only applicable to the base case operating scenario and forward-looking assumptions outlined in this report. Therefore, changes in these forward-looking assumptions can result in capital and operating costs that deviate more than 25% from the costs forecast herein.
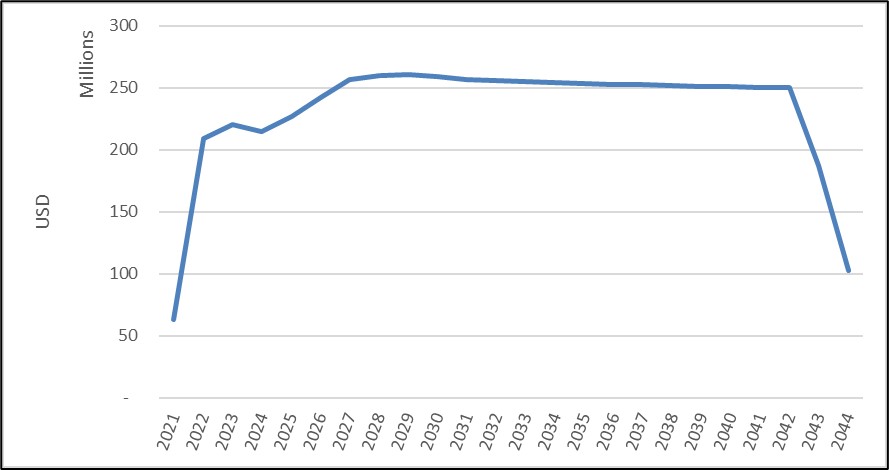
1.9Economics
As with the capital and operating cost forecasts, the economic analysis is inherently a forward-looking exercise. These estimates rely upon a range of assumptions and forecasts that are subject to change depending upon macroeconomic conditions, operating strategy and new data collected through future operations.
The operation is forecast to have a 24-year life with the first modeled year of operation being a partial year to align with the effective date of the reserves.
The economic analysis metrics are prepared on annual after-tax basis in US$. The results of the analysis are presented in Table 1-5. At a technical grade lithium carbonate price of US$10,000/t, the net present value, using an 8% discount rate (NPV 8%), of the modeled after-tax free cash flow is US$1,972 million. Note that because Salar de Atacama is in operation and is modeled on a go-forward basis from the date of the reserve, historic capital expenditures are treated as sunk costs (i.e., not modeled) and therefore, IRR and payback period analysis are not relevant metrics.
Table 1-5: Indicative Economic Results
| | | | | | | | |
| LoM Cash Flow (Unfinanced) | Units | Value |
| Total Revenue | US$ | 16,720,589,734 |
| Total Opex | US$ | (5,534,107,988) |
| Royalties | US$ | (2,294,064,911) |
| Operating Margin | US$ | 8,892,416,835 |
| Operating Margin Ratio | % | 53% |
| Taxes Paid | US$ | (2,394,685,717) |
| Free Cashflow | US$ | 4,977,836,374 |
| Before Tax |
| Free Cash Flow | US$ | 7,372,522,091 |
| NPV @ 8% | US$ | 3,027,458,930 |
| NPV @ 10% | US$ | 2,518,956,354 |
| NPV @ 15% | US$ | 1,679,104,360 |
| After Tax |
| Free Cash Flow | US$ | 4,977,836,374 |
| NPV @ 8% | US$ | 1,972,048,082 |
| NPV @ 10% | US$ | 1,622,066,434 |
| NPV @ 15% | US$ | 1,045,940,855 |
Source: SRK, 2021
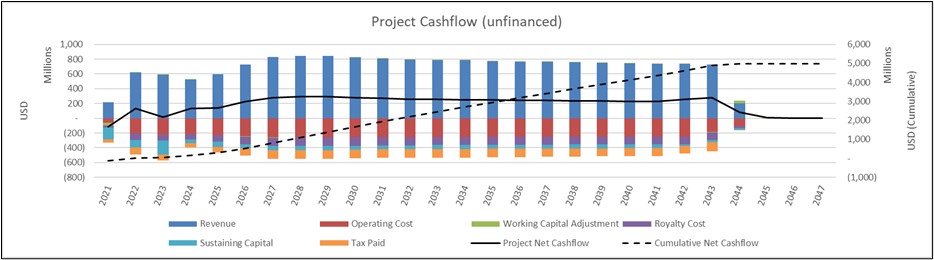
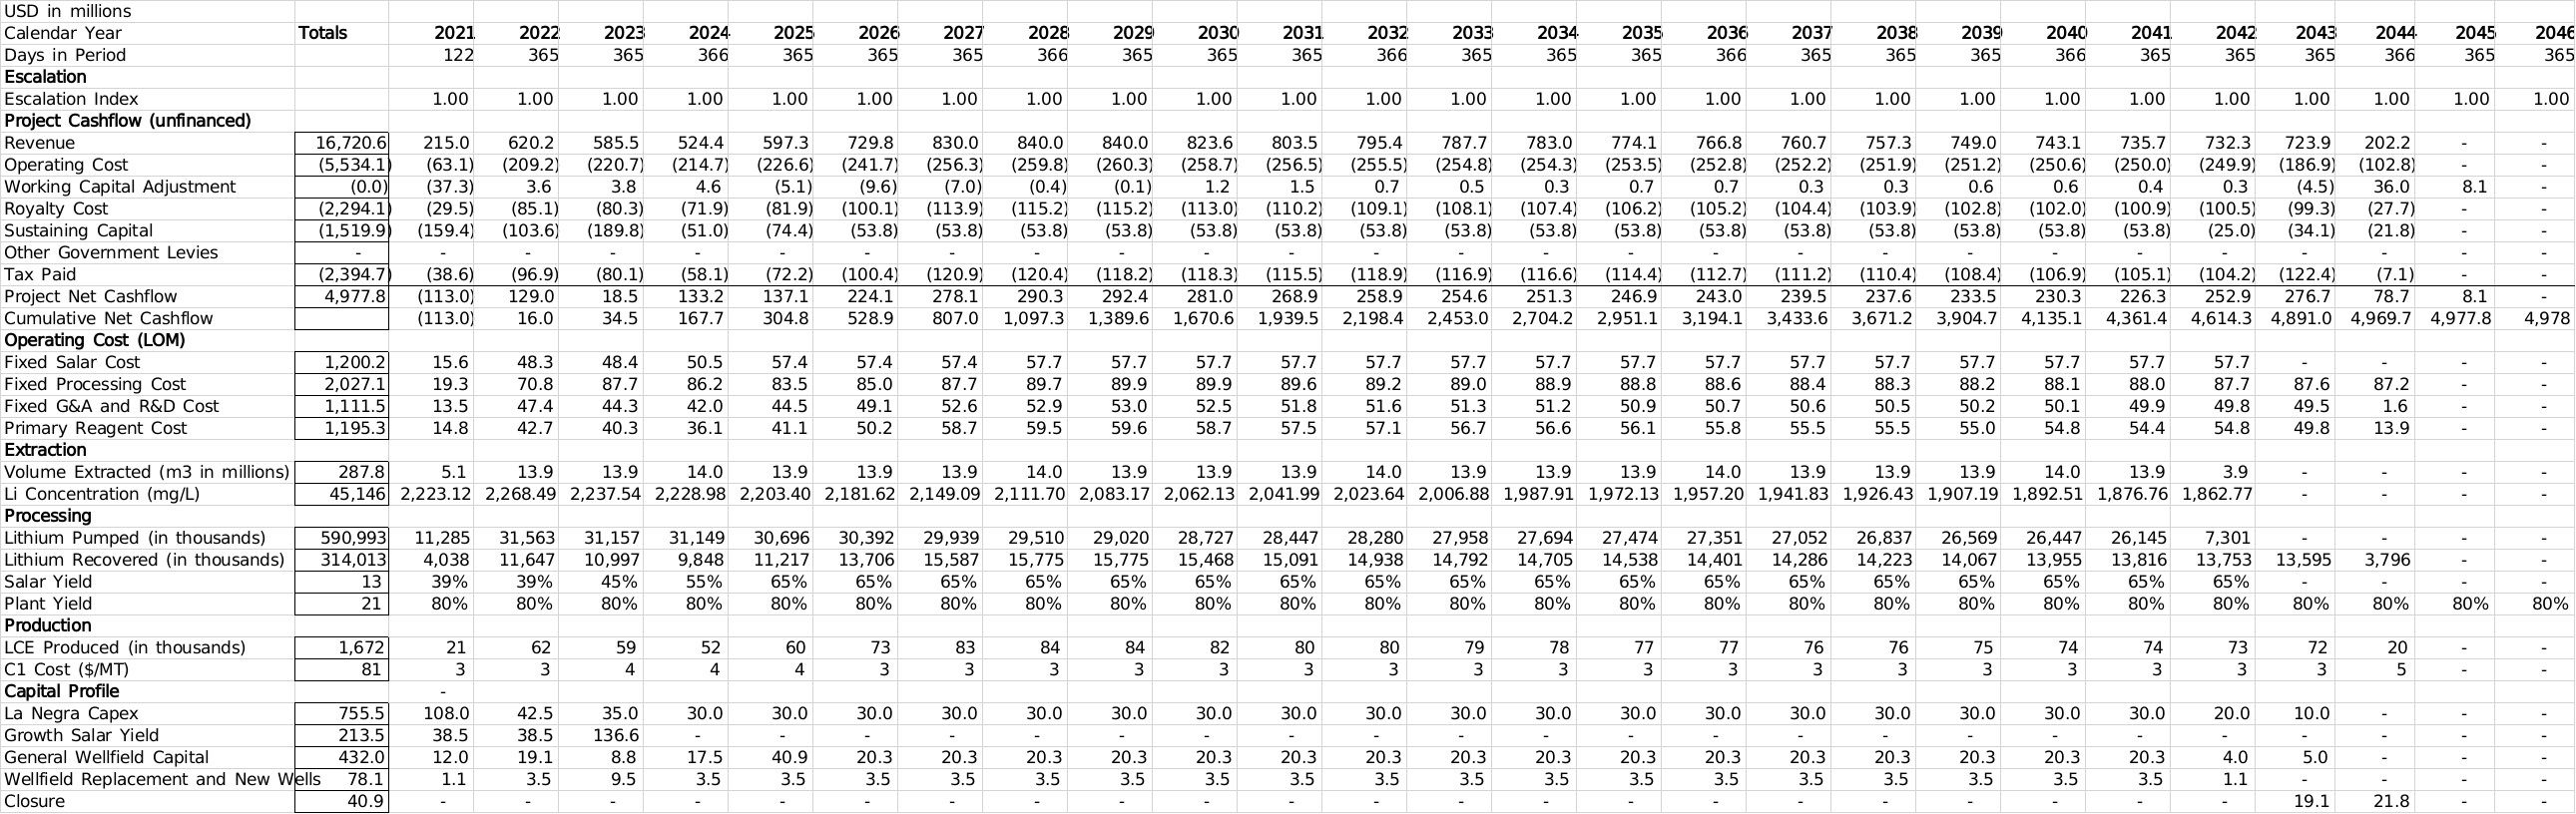
A summary of the cashflow on an annual basis is presented in Figure 1-2.
| | | | | |
SalardeAtacama_SEC_Report_515800.040 | December 2022 |
SRK Consulting (U.S.), Inc.
| | | | | |
SEC Technical Report Summary – Salar de Atacama | Page 29 |
Source: SRK, 2021
Figure 1-2: Annual Cashflow Summary (Tabular Data shown in Table 19-9)
1.10 Recommendations and Conclusions
1.10.1Geology
The property is well known in terms of descriptive factors and ownership. Geology and mineralization are well-understood through decades of active mining. The status of exploration, development, and operations is very advanced and active. Assuming that exploration and mining continue at Salar de Atacama in the way that they are currently being done, there are no additional recommendations at this time.
1.10.2Mineral Resource Estimate
SRK has reported a mineral resource estimation (MRE) which is appropriate for public disclosure and long-term considerations of mining viability. The mineral resource estimation could be improved with additional infill program (drilling and brine sampling).
1.10.3Mineral Reserves
Mining operations have been established at the Salar de Atacama over its more than 35-year history of production. Reserve estimates have been developed based on a predictive hydrogeological model that estimates brine production rates and associated lithium concentrations over time. In the QP’s opinion, the mining methods and predictive approach for reserve development are appropriate for the Salar de Atacama.
However, in the QP’s opinion, there remains opportunity to further refine the production schedule. This optimization should focus on the balance between calcium and sulfate concentration in the production brine. Maintaining an optimum blend of calcium-rich and sulfate-rich brine improves process recovery in the evaporation ponds. SRK’s current assumption is an optimum balance in these contaminants is lost in 2027 and has assumed the additional capital and operating cost expenditure associated with installation and operation of a liming plant is required. However, if additional calcium-rich brine can be sourced in the pumping plan, these assumed expenses could potentially be delayed or avoided altogether.
| | | | | |
SalardeAtacama_SEC_Report_515800.040 | December 2022 |
SRK Consulting (U.S.), Inc.
| | | | | |
SEC Technical Report Summary – Salar de Atacama | Page 30 |
1.10.4Infrastructure
The project is a mature functioning operation with two separate sites that contain key facilities. The infrastructure is in place, operating and provides all necessary support for ongoing operations as summarized in this report. No significant risks associated with the Project are identified in this report.
1.10.5Environmental, Social, and Closure
The operations of Albemarle have adequate plans to address and follow-up the most sensitive and relevant environmental issues, such as hydrogeological/biodiversity issues, and those associated with the indigenous communities in the Salar de Atacama area.
Albemarle adequately follows up on issues related to water quality in the Negra and fluctuations in the water table and potential effects on the sensitive ecosystems around the Salar de Atacama, including analysis of possible cumulative effects given the multiplicity of actors that extract brine and freshwater in the area. Notwithstanding the above, the Salar de Atacama is a complex system and requires constant updating of management tools based on the results of the monitoring programs, and also be attentive to requirements or new tools that the authority may incorporate.
In relation with the indigenous communities, Albemarle maintains relations with all the communities and indigenous groups in the area and has achieved and maintained unprecedented agreements in Chile with these communities. Any future development or modification of the current conditions of the operation will be subject to an Indigenous Consultation Process; therefore, it is of high importance to maintain this adequate management strategy with these communities.
Currently, there are no known environmental issues that could materially affect Albemarle's capacity to extract the resources or reserves of the Salar de Atacama, as long as the brine extraction is kept at the values approved by the environmental authority. Any requirement of a brine extraction greater than the one approved (442 L/s) has an uncertain approval success, considering the multi-user conditions in the Salar de Atacama, the sensitivity of the ecosystem and the synergistic impacts on this ecosystem which concern the environmental and water authorities
There is an operational issue that could generate regulatory risk, related with infrastructure requirements to adequately manage the liquid solutions that are generated in La Negra's process, which is not possible to manage with the current facilities. Any spill or overflow from the ponds can lead to an environmental non-compliance that can be sanctioned by the Superintendence of the Environment. This issue is being addressed as a priority action by the company to seek a definitive solution in the long term, and also one that allows them to solve the issue in the short term.
Albemarle has also an approved closure plan (Res. Ex. N°287/2019), which includes all environmental projects approved until 2016, including EIA “Modification and improvement solar evaporation system” (RCA N°021/2016).This closure plan considers a life of mine until 2043, estimated by the authority’s methodology, which response to financial assurance purposes and it does not define the definitive closure date.
Albemarle does not currently have an internal closure cost estimate other than for financial assurances. Therefore, other costs would likely be incurred by Albemarle during closure of the site. Then, the actual closure cost could be greater or less than the financial assurance estimate.
| | | | | |
SalardeAtacama_SEC_Report_515800.040 | December 2022 |
SRK Consulting (U.S.), Inc.
| | | | | |
SEC Technical Report Summary – Salar de Atacama | Page 31 |
Due to new environmental approvals not included in the approved closure plan, it is required that Albemarle update its closure plan in order to be able to operate some of these projects, as they need the closure plan approval for execution.
Therefore, it is highly recommended to develop an internal closure plan, where other costs could be determined, such as head office costs, human resources costs, taxes, operator-specific-costs, and social costs. Also, closure provision should be determined in this document.
1.10.6Mineral Processing and Metallurgical Testing
In the QP’s opinion, the long operating history and associated knowledge and information provide appropriate support for development of operating predictions for this reserve estimate. The notable deviation from historic practice is the SYIP.
Albemarle is currently planning on developing the SYIP in the next few years. Historic testwork associated with this project has gaps in sample representivity and support for projected mass balances. SRK recommends updating these test results with more representative samples and a more thorough evaluation of associated mass balances with the potential to further optimize the SYIP performance and reduce risk in ramp up and performance. Nonetheless, in the QP’s opinion, the projected performance for the SYIP is reasonable.
SRK has assumed that a liming plant will be required starting in 2027 to offset a reduction in calcium-rich brine available for blending. If further optimization of the life of mine pumping plan is not possible (i.e., the sulfate to calcium ratio cannot be reduced by alternative pumping strategy), Albemarle will need to add calcium to the evaporation pond system to avoid additional lithium losses in the ponds. Albemarle should start conceptual evaluation of this calcium addition (whether through liming as assumed by SRK or alternative options) so that if/when this plant is required, Albemarle will have an appropriate design developed for installation.
1.10.7Capital and Operating Costs
The capital and operating costs for the Salar de Atacama operation have been developed based on actual project costs. In the opinion of the QP, the cost development is acceptable for declaration of mineral reserves. However, the operation itself lacks detailed life of operation planning and costing. As such, the forward looking costs incorporated here are inherently strongly correlated to current market conditions. Due to the ongoing COVID-19 pandemic, the currently global economic environment can charitably be described as ‘somewhat chaotic’, and any forward looking forecast based on such an environment carries increased risk.
The QP strongly recommends continued development and refinement of a robust life of operation cost model. In additional to further refinement of the cost model, the QP also recommends that close watch be kept on the economic environment with an eye toward continuous updates as the market environment continues to evolve.
| | | | | |
SalardeAtacama_SEC_Report_515800.040 | December 2022 |
SRK Consulting (U.S.), Inc.
| | | | | |
SEC Technical Report Summary – Salar de Atacama | Page 32 |
1.10.8Economics
The operation is forecast to generate positive cashflow during every year of the LoM plan in which it is pumping, or processing brine based on the production schedule, costs and process performance outlined in this report.
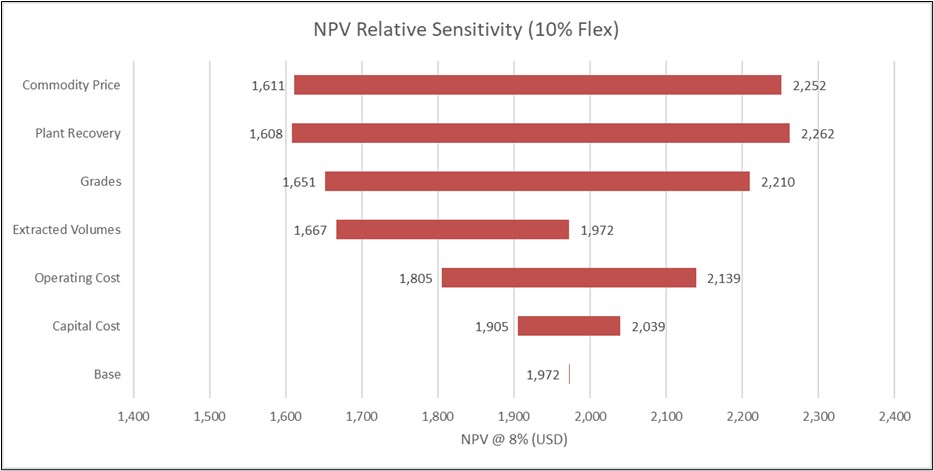
An economic sensitivity analysis indicates that the operation’s NPV is most sensitive to variations in commodity price, plant recovery and lithium grade.
| | | | | |
SalardeAtacama_SEC_Report_515800.040 | December 2022 |
SRK Consulting (U.S.), Inc.
| | | | | |
SEC Technical Report Summary – Salar de Atacama | Page 33 |
2Introduction
This TRS was prepared in accordance with the SEC S-K regulations (Title 17, Part 229, Items 601 and 1300 through 1305) for Albemarle by SRK on the Salar de Atacama. Associated lithium processing facilities at the La Negra operation are included in this report as they are critical to the production of a final, commercially salable product. Albemarle is 100% owner of the Salar de Atacama and La Negra operations.
2.1Terms of Reference and Purpose
The quality of information, conclusions, and estimates contained herein are consistent with the level of effort involved in SRK’s services, based on i) information available at the time of preparation and ii) the assumptions, conditions, and qualifications set forth in this report. This report is intended for use by Albemarle subject to the terms and conditions of its contract with SRK and relevant securities legislation. The contract permits Albemarle to file this report as a TRS pursuant to the SEC S-K regulations, more specifically Title 17, Subpart 229.600, item 601(b)(96) - TRS and Title 17, Subpart 229.1300 - Disclosure by Registrants Engaged in Mining Operations. Any other uses of this report by any third party is at that party’s sole risk. The responsibility for this disclosure remains with Albemarle.
The purpose of this TRS is to report mineral resources and mineral reserves for Salar de Atacama. This report is prepared to a pre-feasibility standard, as defined by S-K 1300.
The effective date of this report is August 31, 2021.
The report was amended to include additional clarifying information in December 2022. The basis of the report is unchanged. The changes and location in document are summarized as follows:
•Amended date added to title page
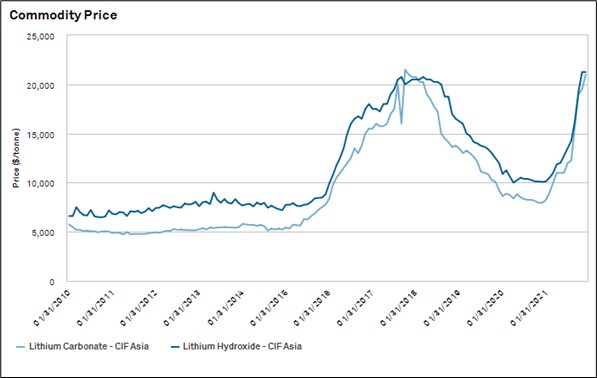
•Addition of historic price curve (16.1.4)
•Addition of notes on figures referencing tabular source data (Chapter 1.8, 1.9, 19.1.3, 19.1.4)
•Modified Summary Table for clarity (Chapter 19.2)
2.2Sources of Information
This report is based in part on internal Company technical reports, previous feasibility studies, maps, published government reports, Company letters and memoranda, and public information as cited throughout this report and listed in Section 24.
Reliance upon information provided by the registrant is listed in Section 25 where applicable.
2.3Details of Inspection
Table 2-1 summarizes the details of the personal inspections on the property by each qualified person or, if applicable, the reason why a personal inspection has not been completed.
| | | | | |
SalardeAtacama_SEC_Report_515800.040 | December 2022 |
SRK Consulting (U.S.), Inc.
| | | | | |
SEC Technical Report Summary – Salar de Atacama | Page 34 |
Table 2-1: Site Visits
| | | | | | | | | | | |
| Expertise | Date(s) of Visit | Details of Inspection | Reason Why a Personal Inspection Has Not Been Completed |
| Process | Several, most recent March 2017 | Site visit with inspection of evaporation ponds, and La Negra plant and packaging area. | |
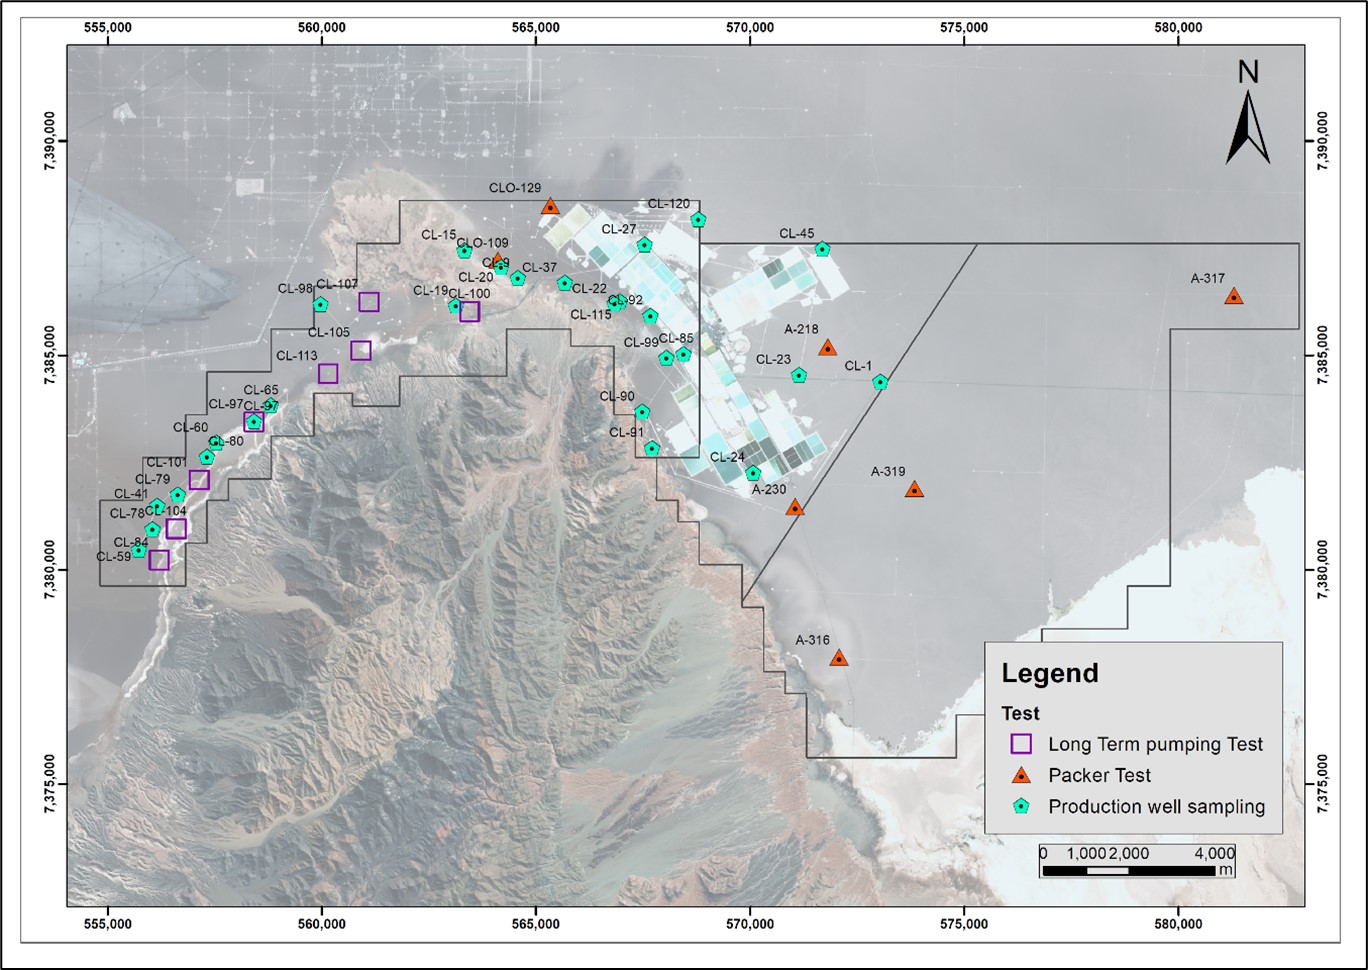
| Resource and Mining | November 12&13 2021 | Site visit with inspection of drillholes, production wells, packer testing, evaporation ponds, site facilities, laboratory, trucking facilities at the salar. | |
Source: SRK, 2021
2.4Report Version Update
The user of this document should ensure that this is the most recent TRS for the property.
This TRS is not an update of a previously filed TRS.
2.5Qualified Person
This report was prepared by SRK Consulting (U.S.), Inc., a third-party firm comprising mining experts in accordance with § 229.1302(b)(1). Albemarle has determined that SRK meets the qualifications specified under the definition of qualified person in § 229.1300. References to the Qualified Person or QP in this report are references to SRK Consulting (U.S.), Inc. and not to any individual employed at SRK.
| | | | | |
SalardeAtacama_SEC_Report_515800.040 | December 2022 |
SRK Consulting (U.S.), Inc.
| | | | | |
SEC Technical Report Summary – Salar de Atacama | Page 35 |
3Property Description
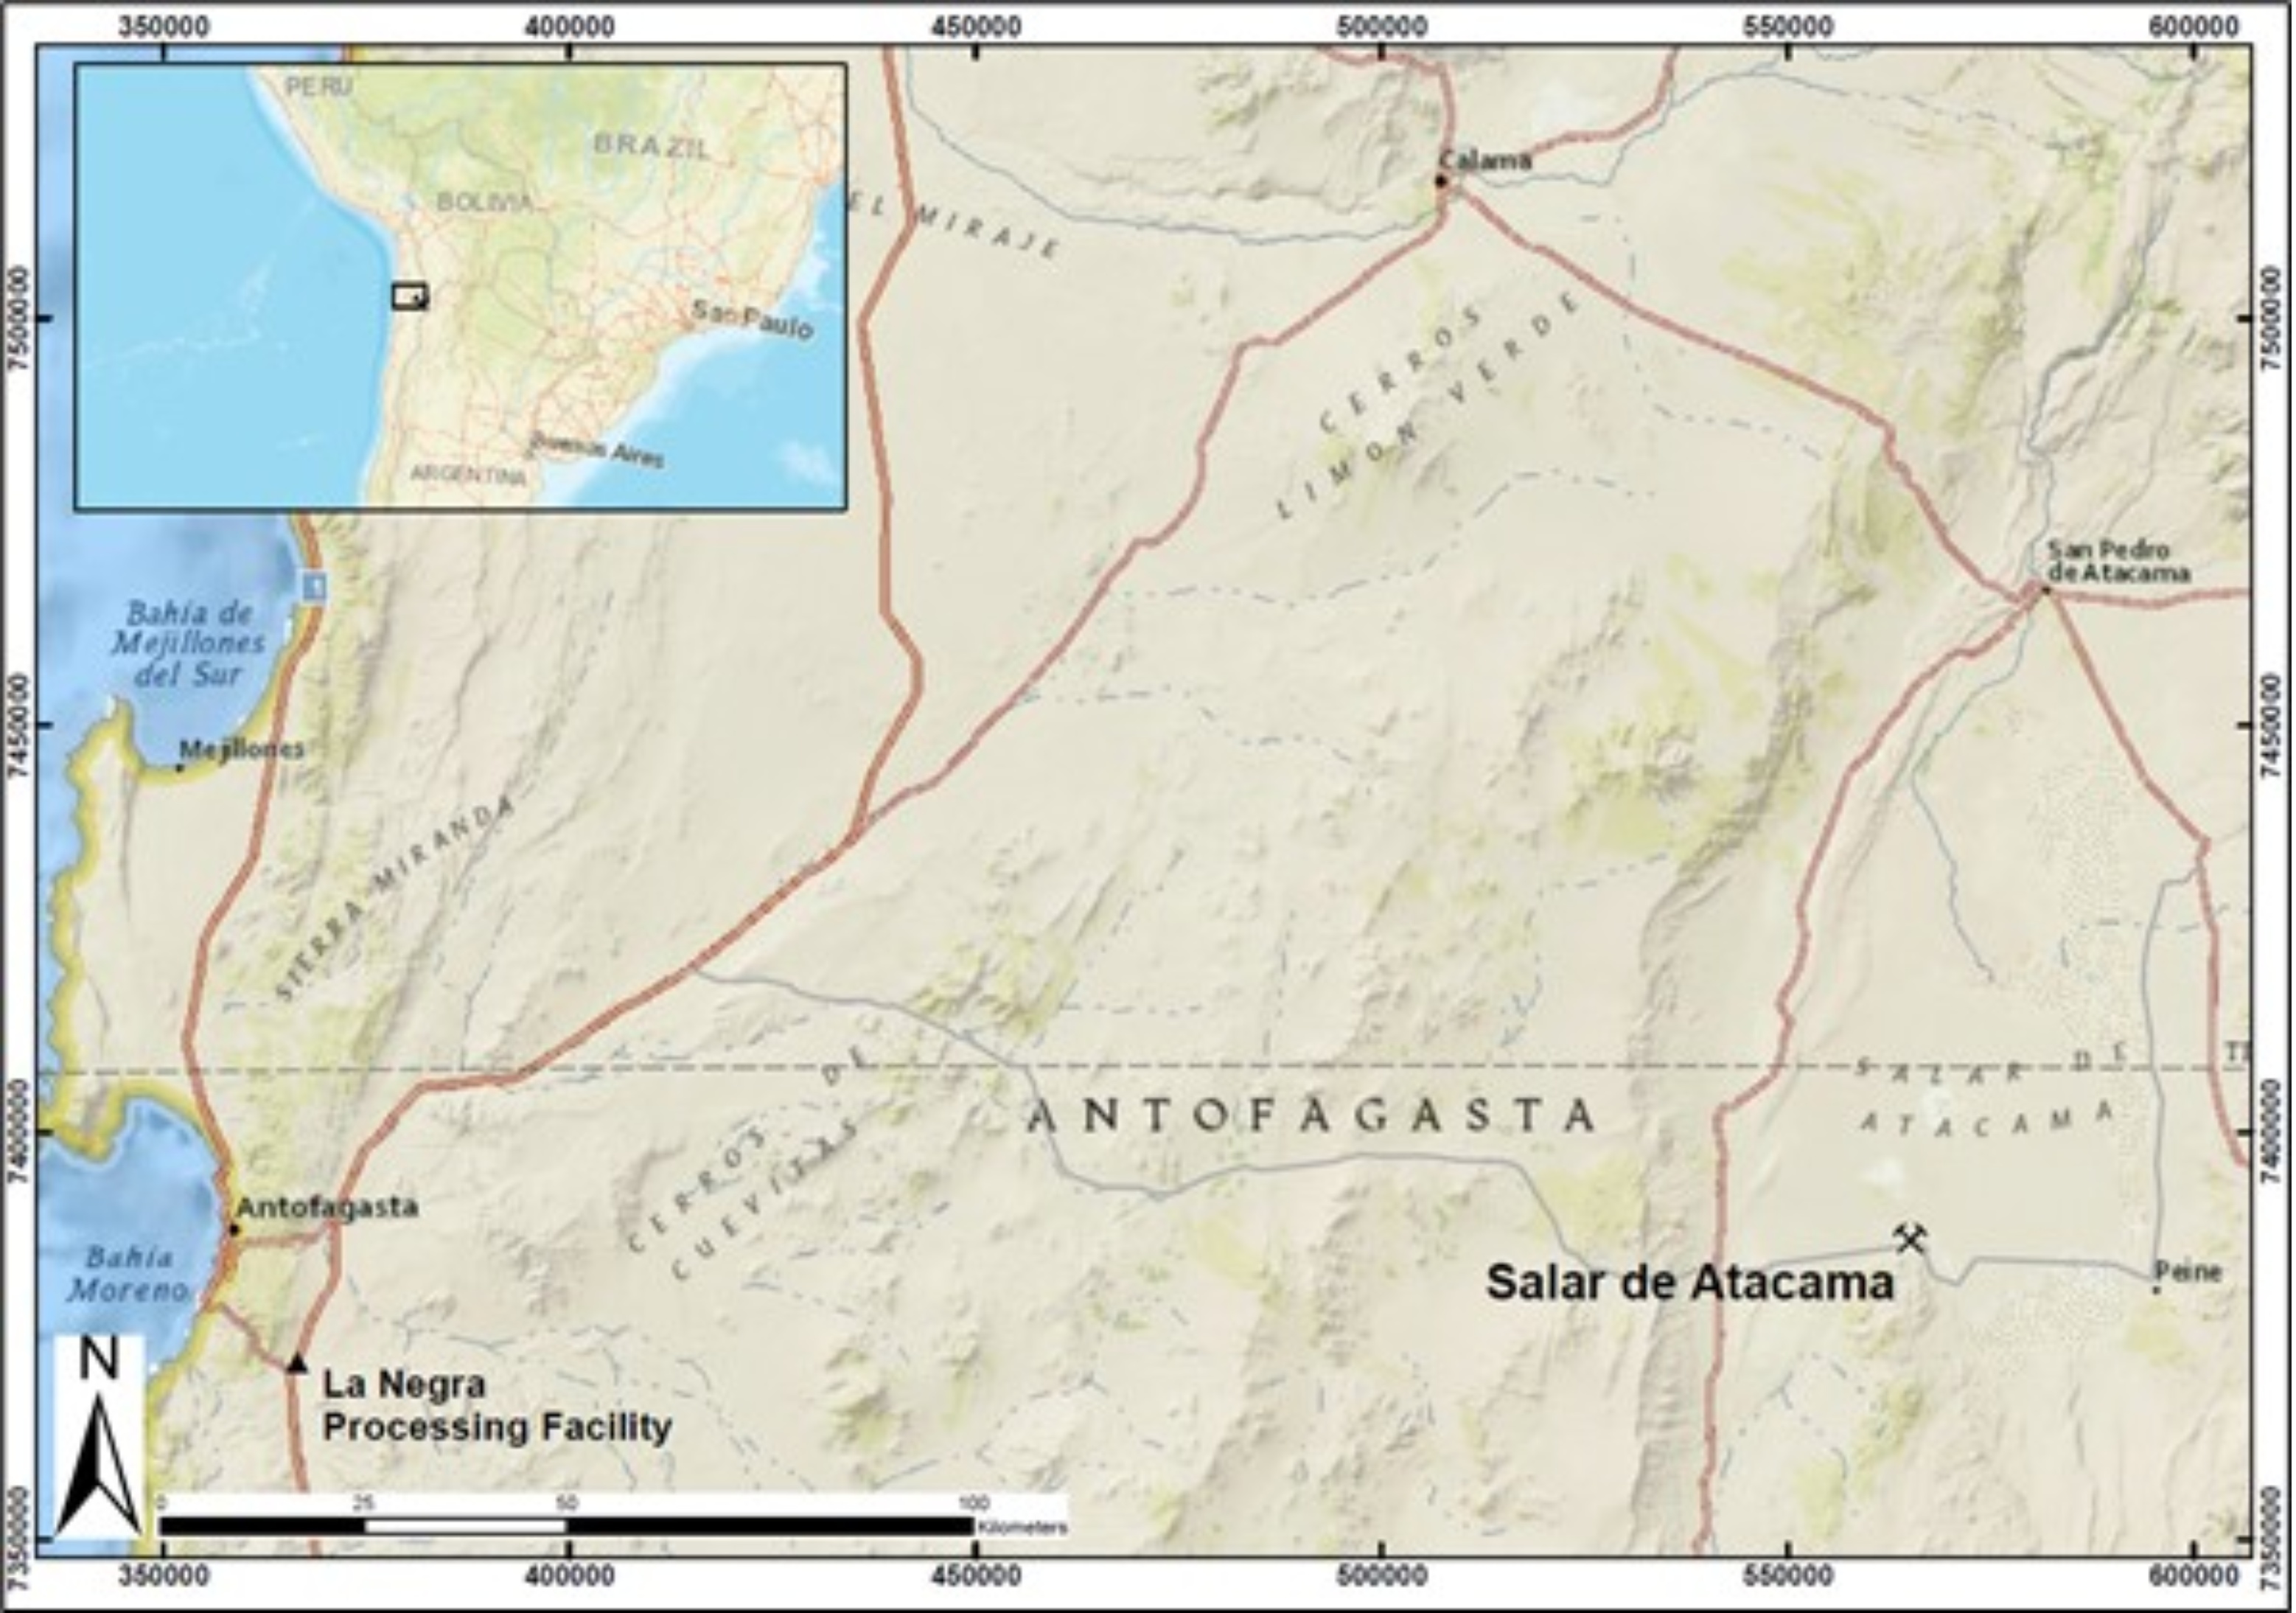
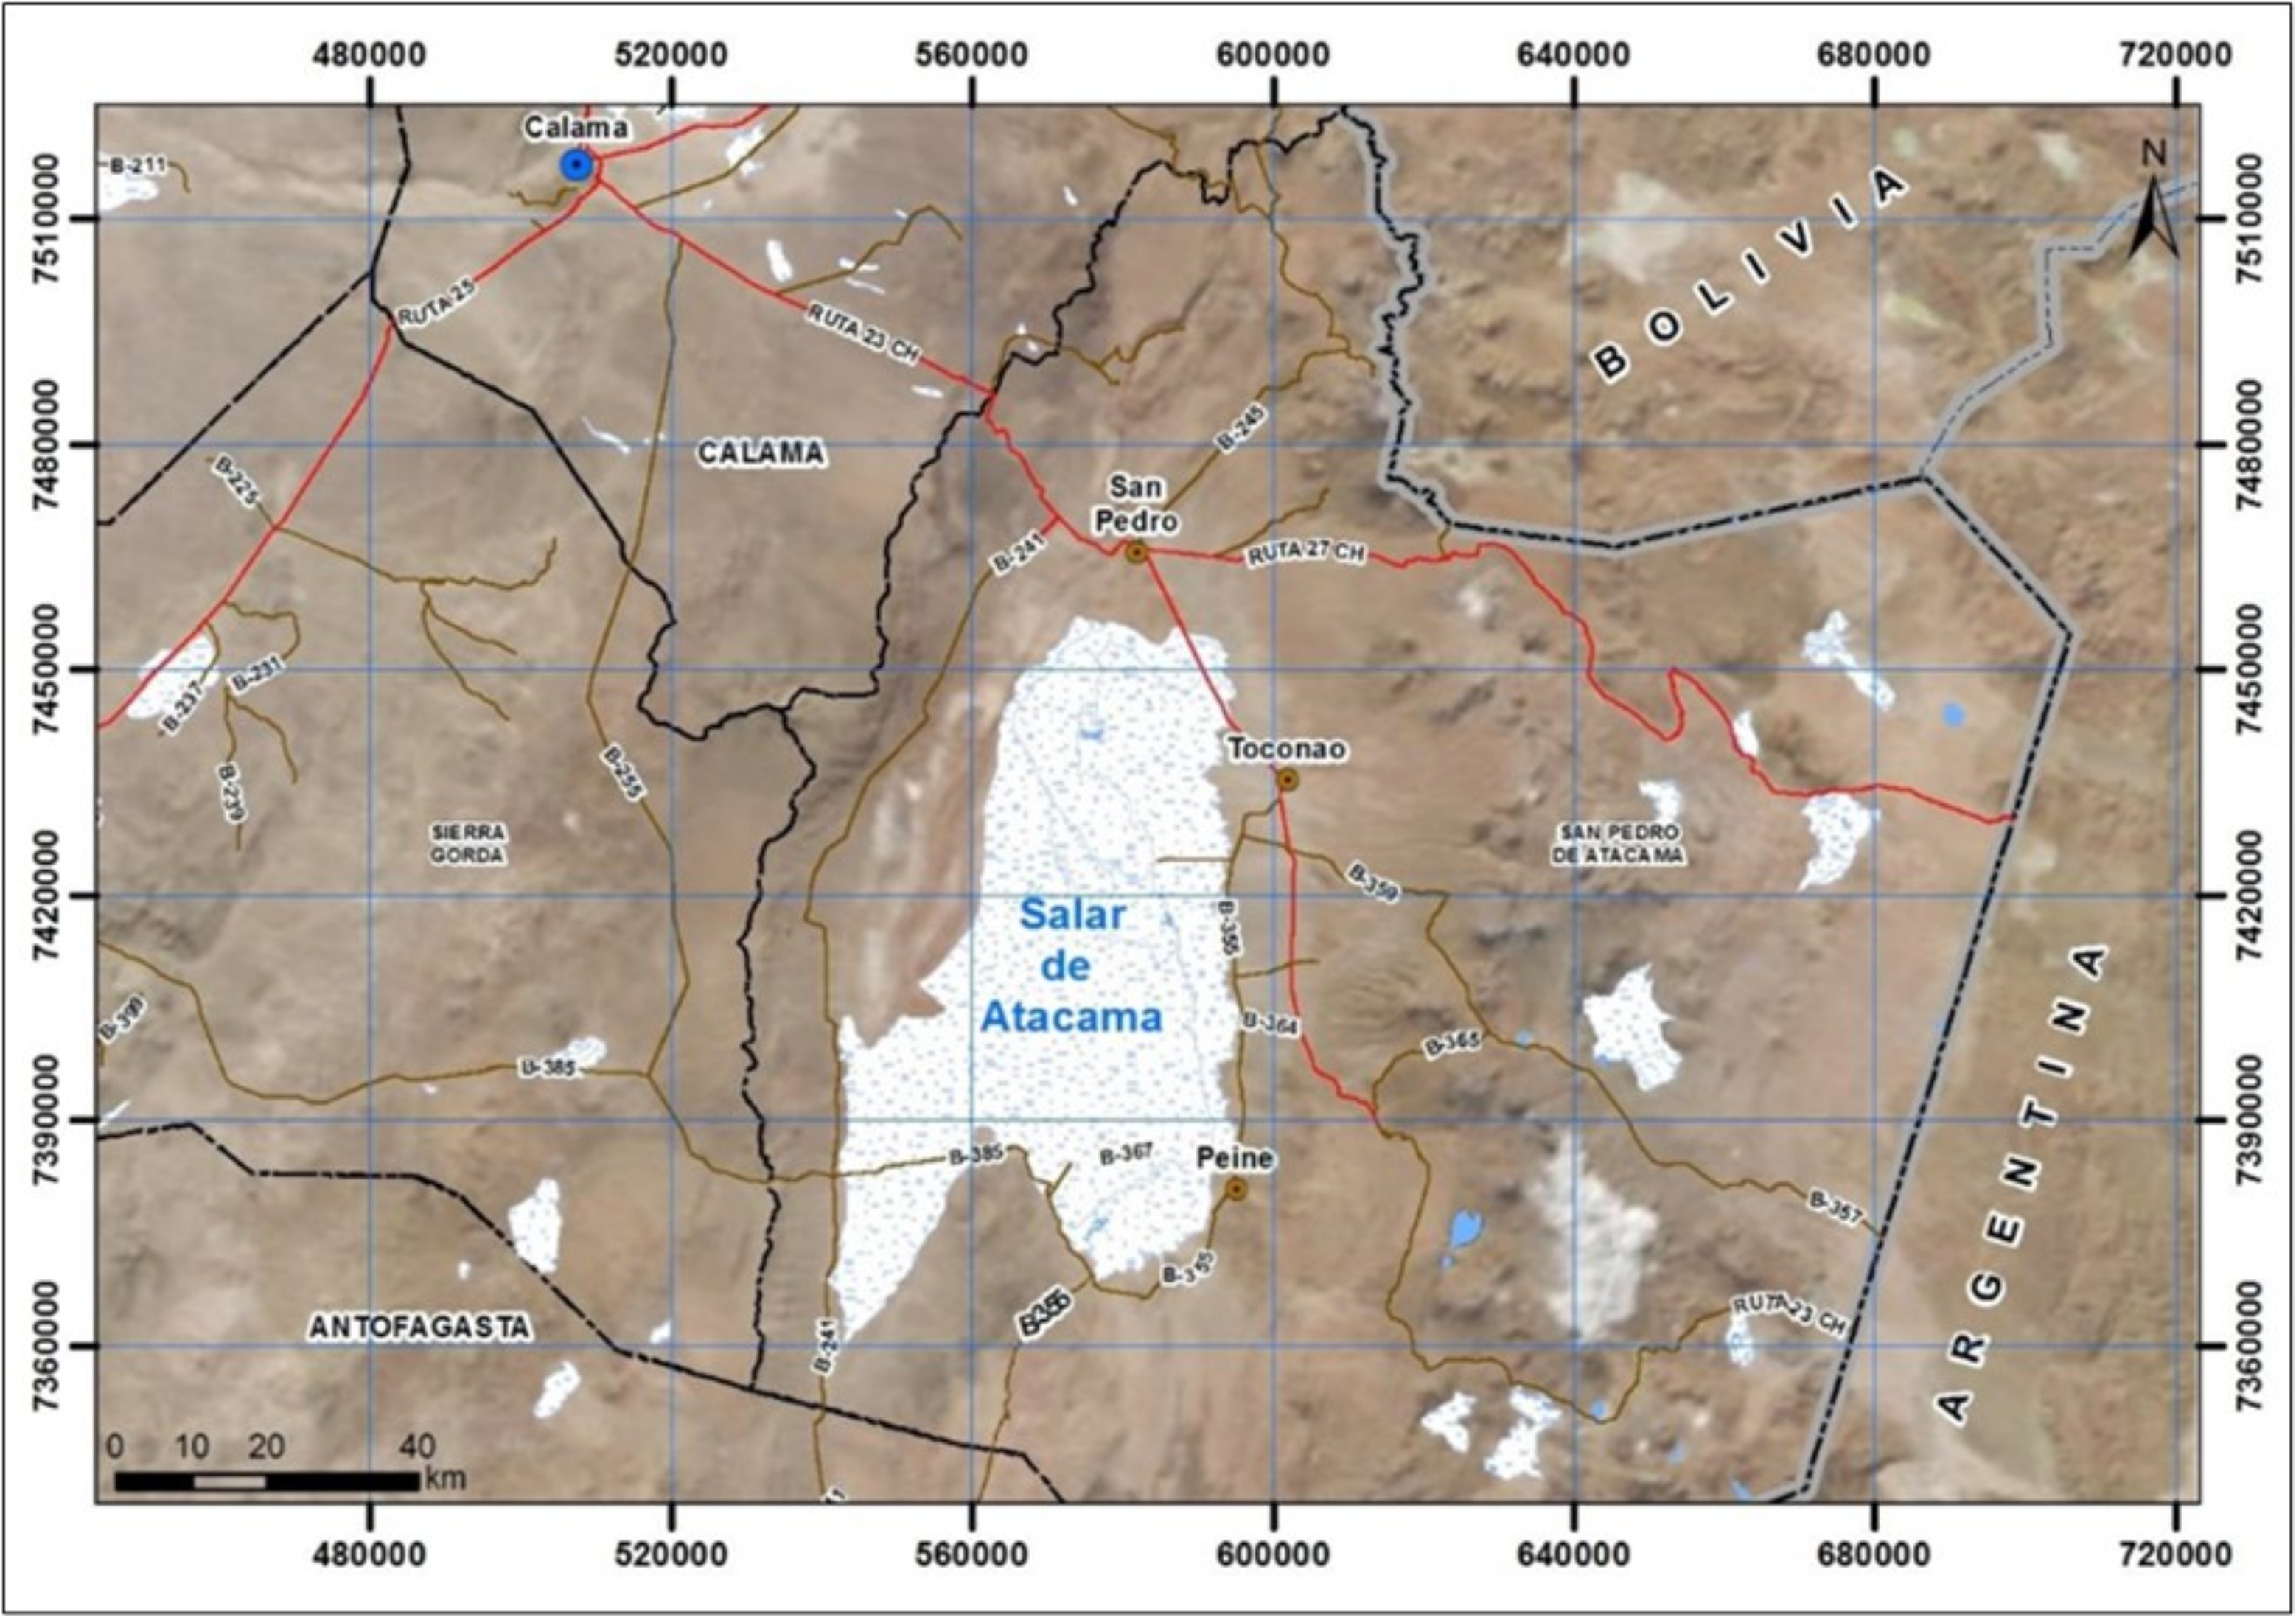
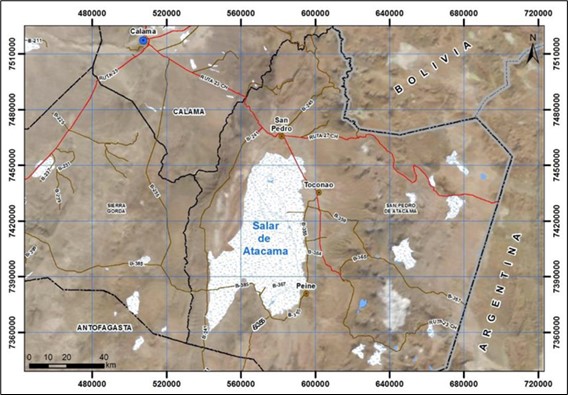
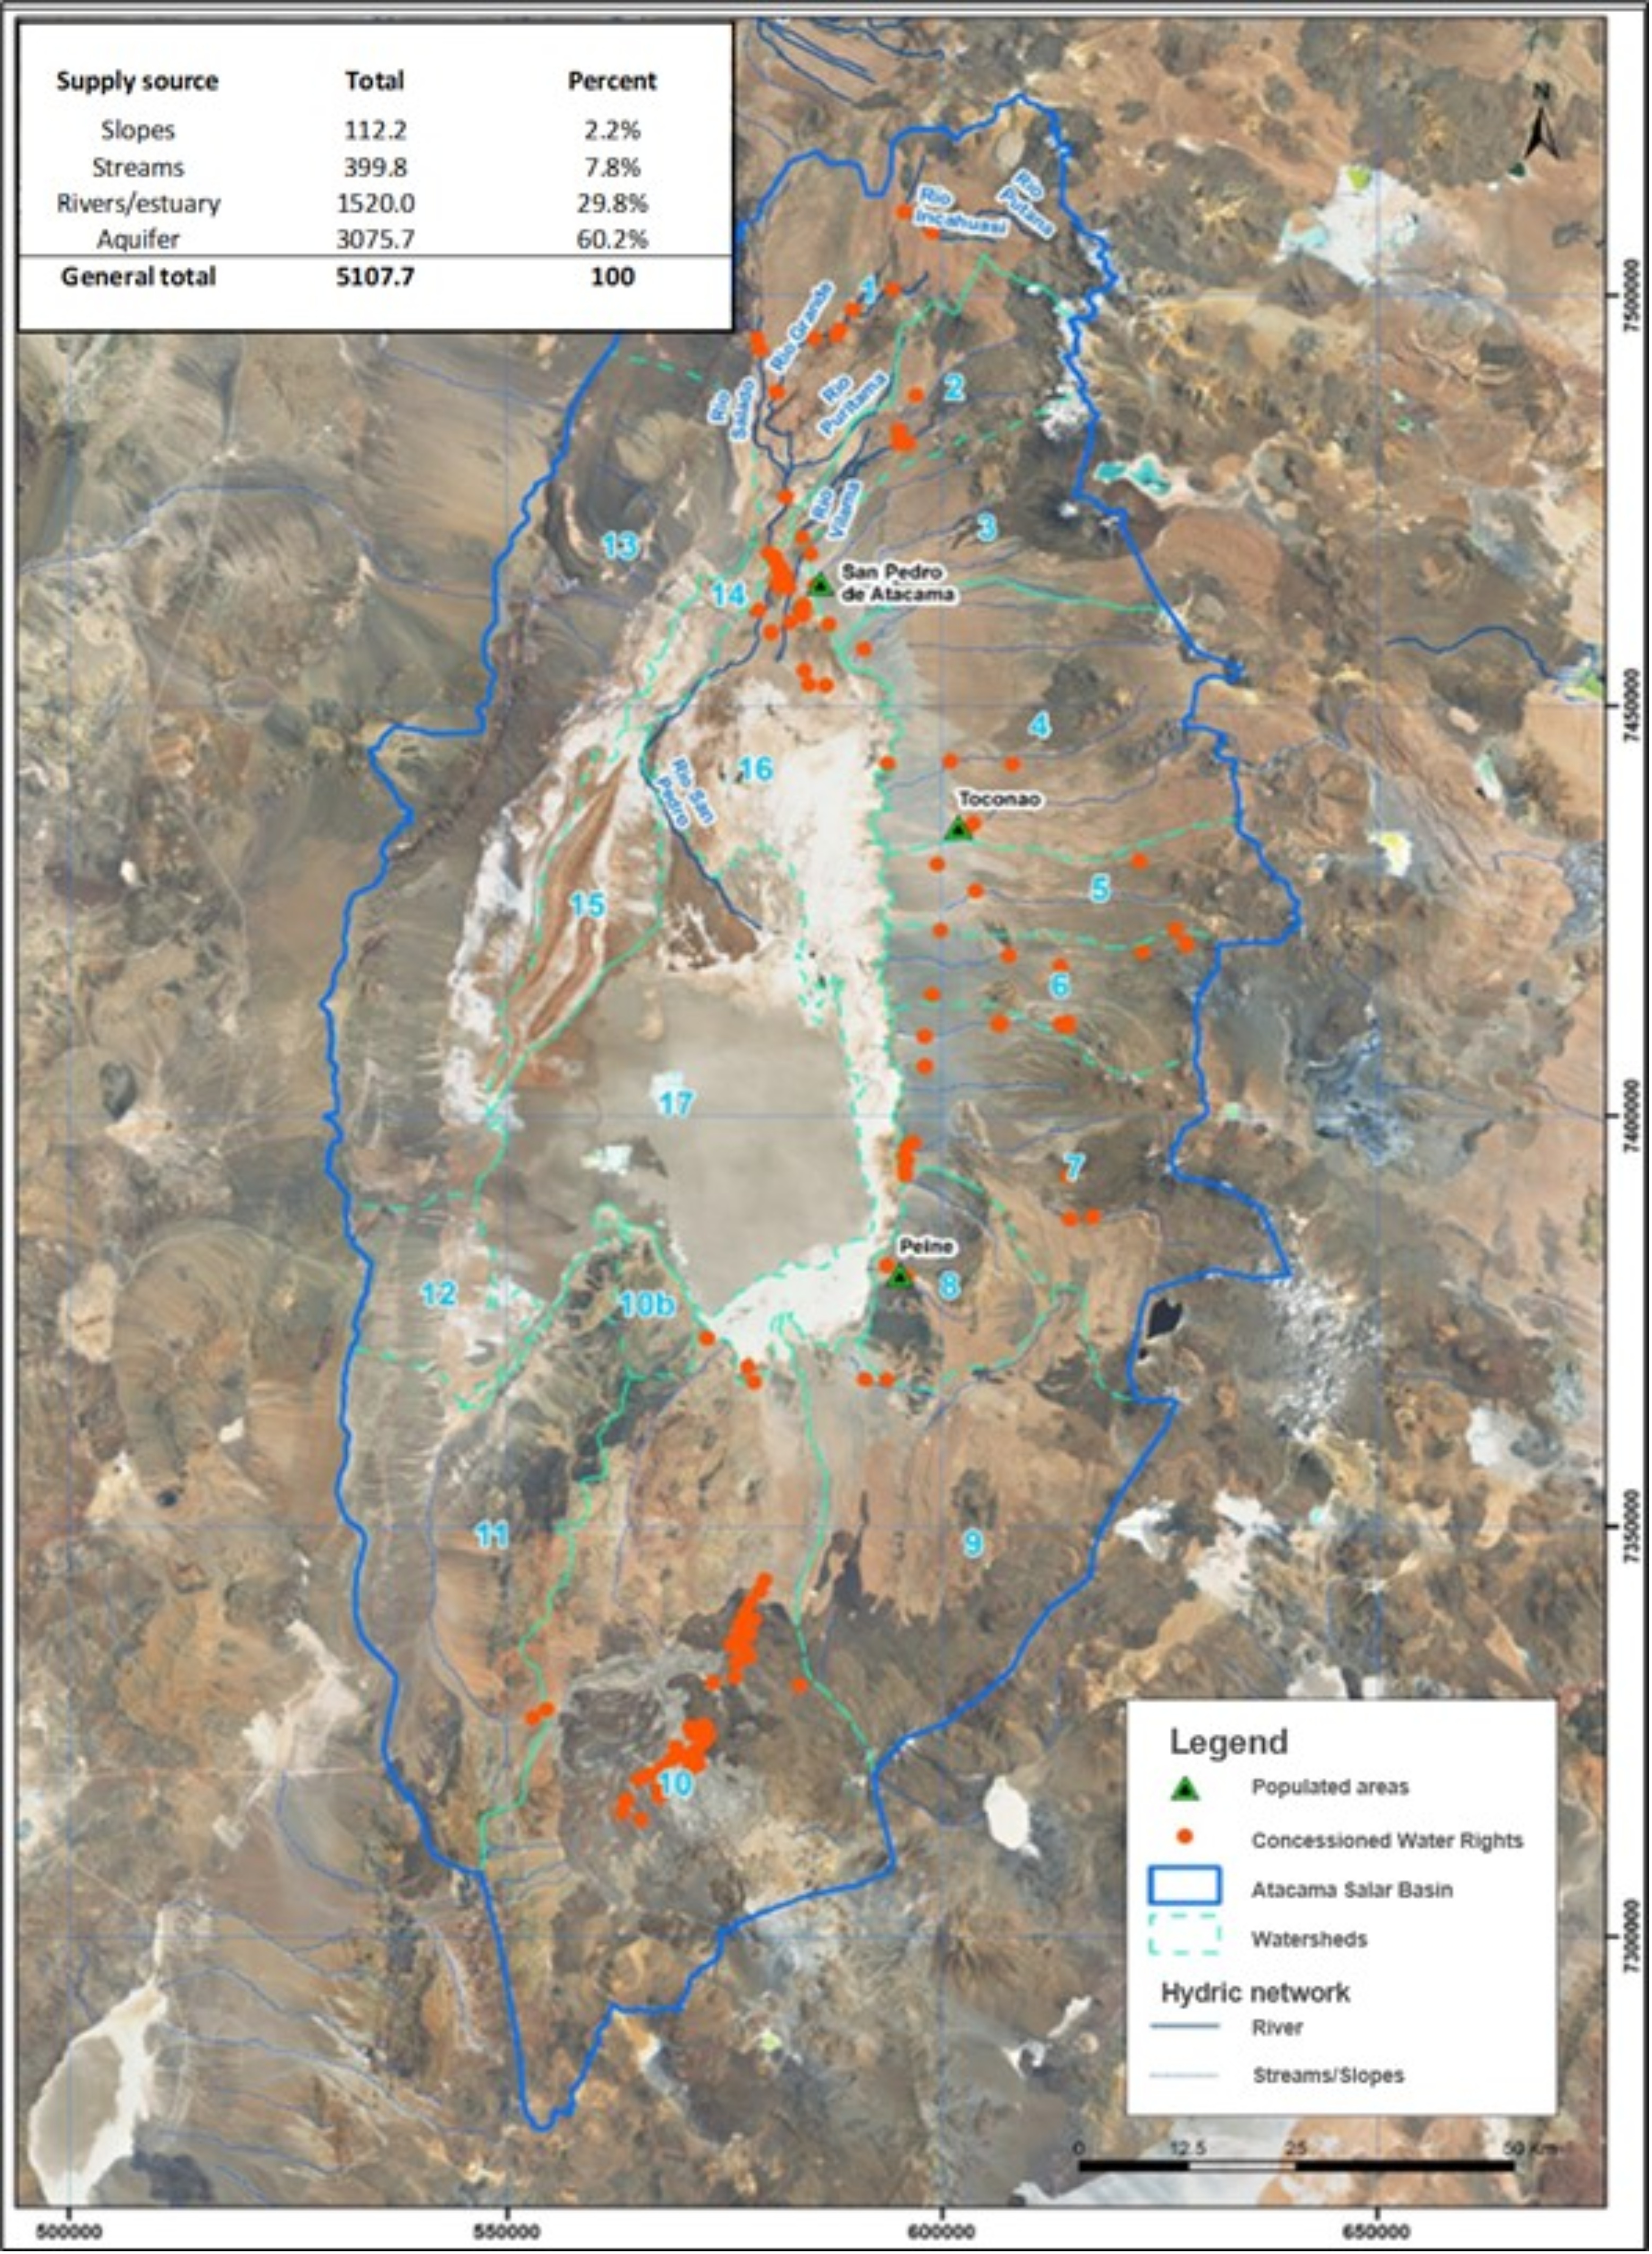
The Salar de Atacama Basin is located in the commune of San Pedro de Atacama, with the Albemarle operations approximately 100 km to the south of this commune, in the extreme east of the Antofagasta Region and close to the border with the republics of Argentina and Bolivia, as shown in Figure 3-1. The communal area is 23,439 square kilometers (km2) and has an approximate population of 10,000 inhabitants, which are mainly distributed in the populated areas of San Pedro de Atacama, Toconao, Socaire and Peine.
Source: SRK, 2021
Figure 3-1: Location Map
In a regional context, the salar is located in a remote area with the nearest city, Calama, approximately 190 km by road to the northwest. The regional capital, Antofagasta, which also is located near the La Negra processing facilities, is located approximately 250 km, by road to the west.
3.1Property Area
Albemarle's mining properties within the Salar de Atacama include two groups of exploitation concessions, CASEME (Carlos Sáez – Eduardo Morales Echeverría) and OMA, which cover a total of 5,227 mining properties. They comprise of approximately 25 km at the widest zone in the East-West direction and 12 km in the widest North-South zone. For the purpose of the reserve estimate, the OMA concessions are those that are relevant.
| | | | | |
SalardeAtacama_SEC_Report_515800.040 | December 2022 |
SRK Consulting (U.S.), Inc.
| | | | | |
SEC Technical Report Summary – Salar de Atacama | Page 36 |
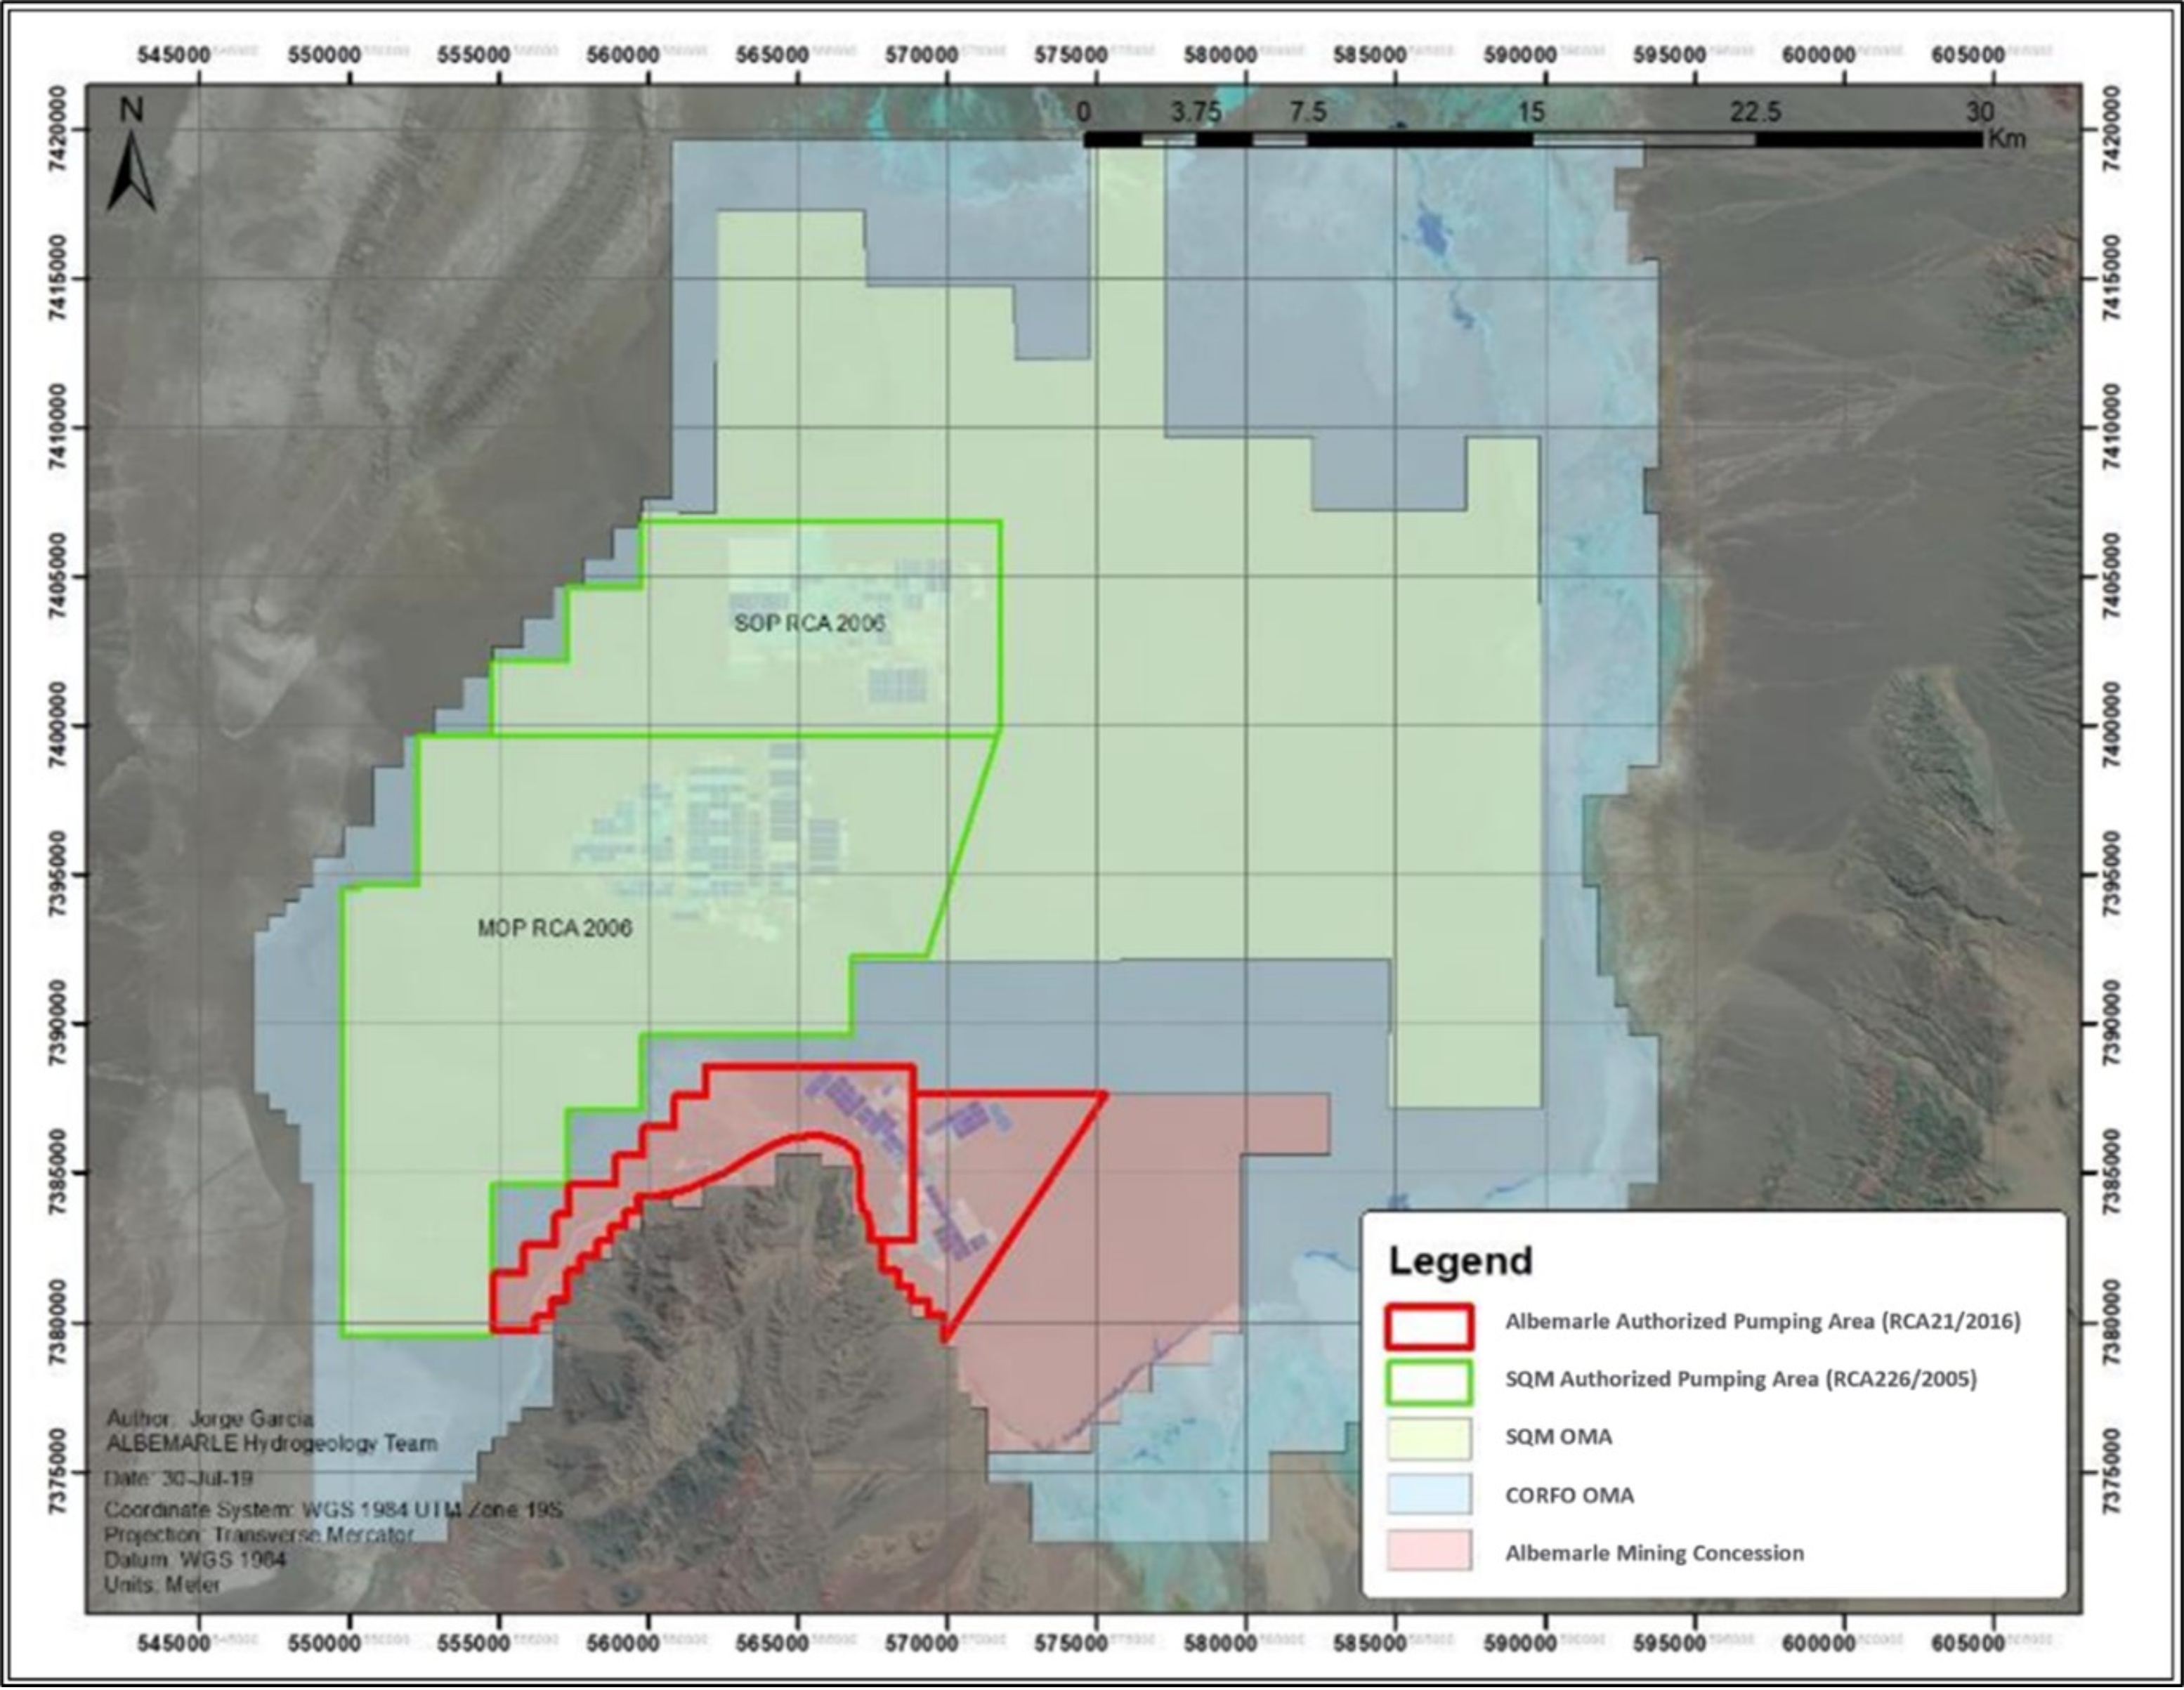
The CASEME concessions include 1,883 properties and the same number of hectares. The OMA concessions include 3,344 mining properties of 5 ha each, which corresponds to 16,720 ha. Figure 3-2 shows the location of the Albemarle concessions at the southern end of the Salar de Atacama (in pink), the rest of the OMA properties belonging to CORFO (in light blue) and the location of SQM's properties (in green) in the Salar.
Source: GWI, 2019
Figure 3-2: Albemarle Mining Claims in the Salar de Atacama
3.2Mineral Title
Albemarle’s mineral rights at the Salar de Atacama in Chile consist of the right to extract lithium brine, pursuant to a long-term contract with the Chilean government, originally entered into in 1980 by Foote Minerals, a predecessor of Albemarle. This contract has been subsequently amended and restated. This agreement is discussed in more detail in Section 16.3.1 although key details follow.
Albemarle’s predecessor’s initial contract with the Chilean government will remain in effect until the date on which it has produced and sold 200,000 t of LME, although the lithium can be produced in any of its forms, from the Salar de Atacama. As of August 31, 2021, the remaining amount of lithium from the initial contract equals approximately 78,038 t of LME. On November 25, 2016, CORFO and Albemarle entered into an annex to the initial agreement adding an additional 262,132 t LME to the total quota and setting an expiry for production of the quota of January 1, 2044 (i.e., any remaining
| | | | | |
SalardeAtacama_SEC_Report_515800.040 | December 2022 |
SRK Consulting (U.S.), Inc.
| | | | | |
SEC Technical Report Summary – Salar de Atacama | Page 37 |
quota after this date will be forfeited). As of August 31, 2021, the remaining amount of lithium from the second quota equals 262,132 t. Combined, as of the effective date of this TRS, August 31, 2021, Albemarle has a remaining quota of 340,170 t of LME, expiring January 1, 2044.
The size of the area at the Salar de Atacama covered by Albemarle’s OMA mining concessions (those relevant to the current reserve estimate) is approximately 16,700 ha. Table 3-1 describes these OMA concessions. Albemarle also currently owns the land on which the extraction facility at the Salar de Atacama and the processing facility at La Negra operate. However, the ownership of the land at the Salar de Atacama will revert to the Chilean government once all amounts of lithium remaining under Albemarle’s contract with the Chilean government are sold (the ownership of the land and fixed assets at La Negra will remain unchanged).
Section 17 of this report provides a summary of the existing environmental permits and under which Albemarle operates. The rights to use existing water and the agreements with the communities are also summarized.
Table 3-1: OMA Mining Concessions
| | | | | | | | | | | | | | | | | |
| Property of SCL |
| Page Number 07 | Concession Name | National Role | Number | Properties | Hectares |
| 230300007-3 | Oma 1 Al 59820 | 2303-0007-0 | 11 | 3,344 | 16,720 |
| Property of CORFO |
| Page Number 07 | Concession Name | Pages | Number | Properties | Hectares |
| 023011965-1 | Oma 1 Al 59820 | 408 | 11 | 1,370 | 6,850 |
Source: GWI, 2019
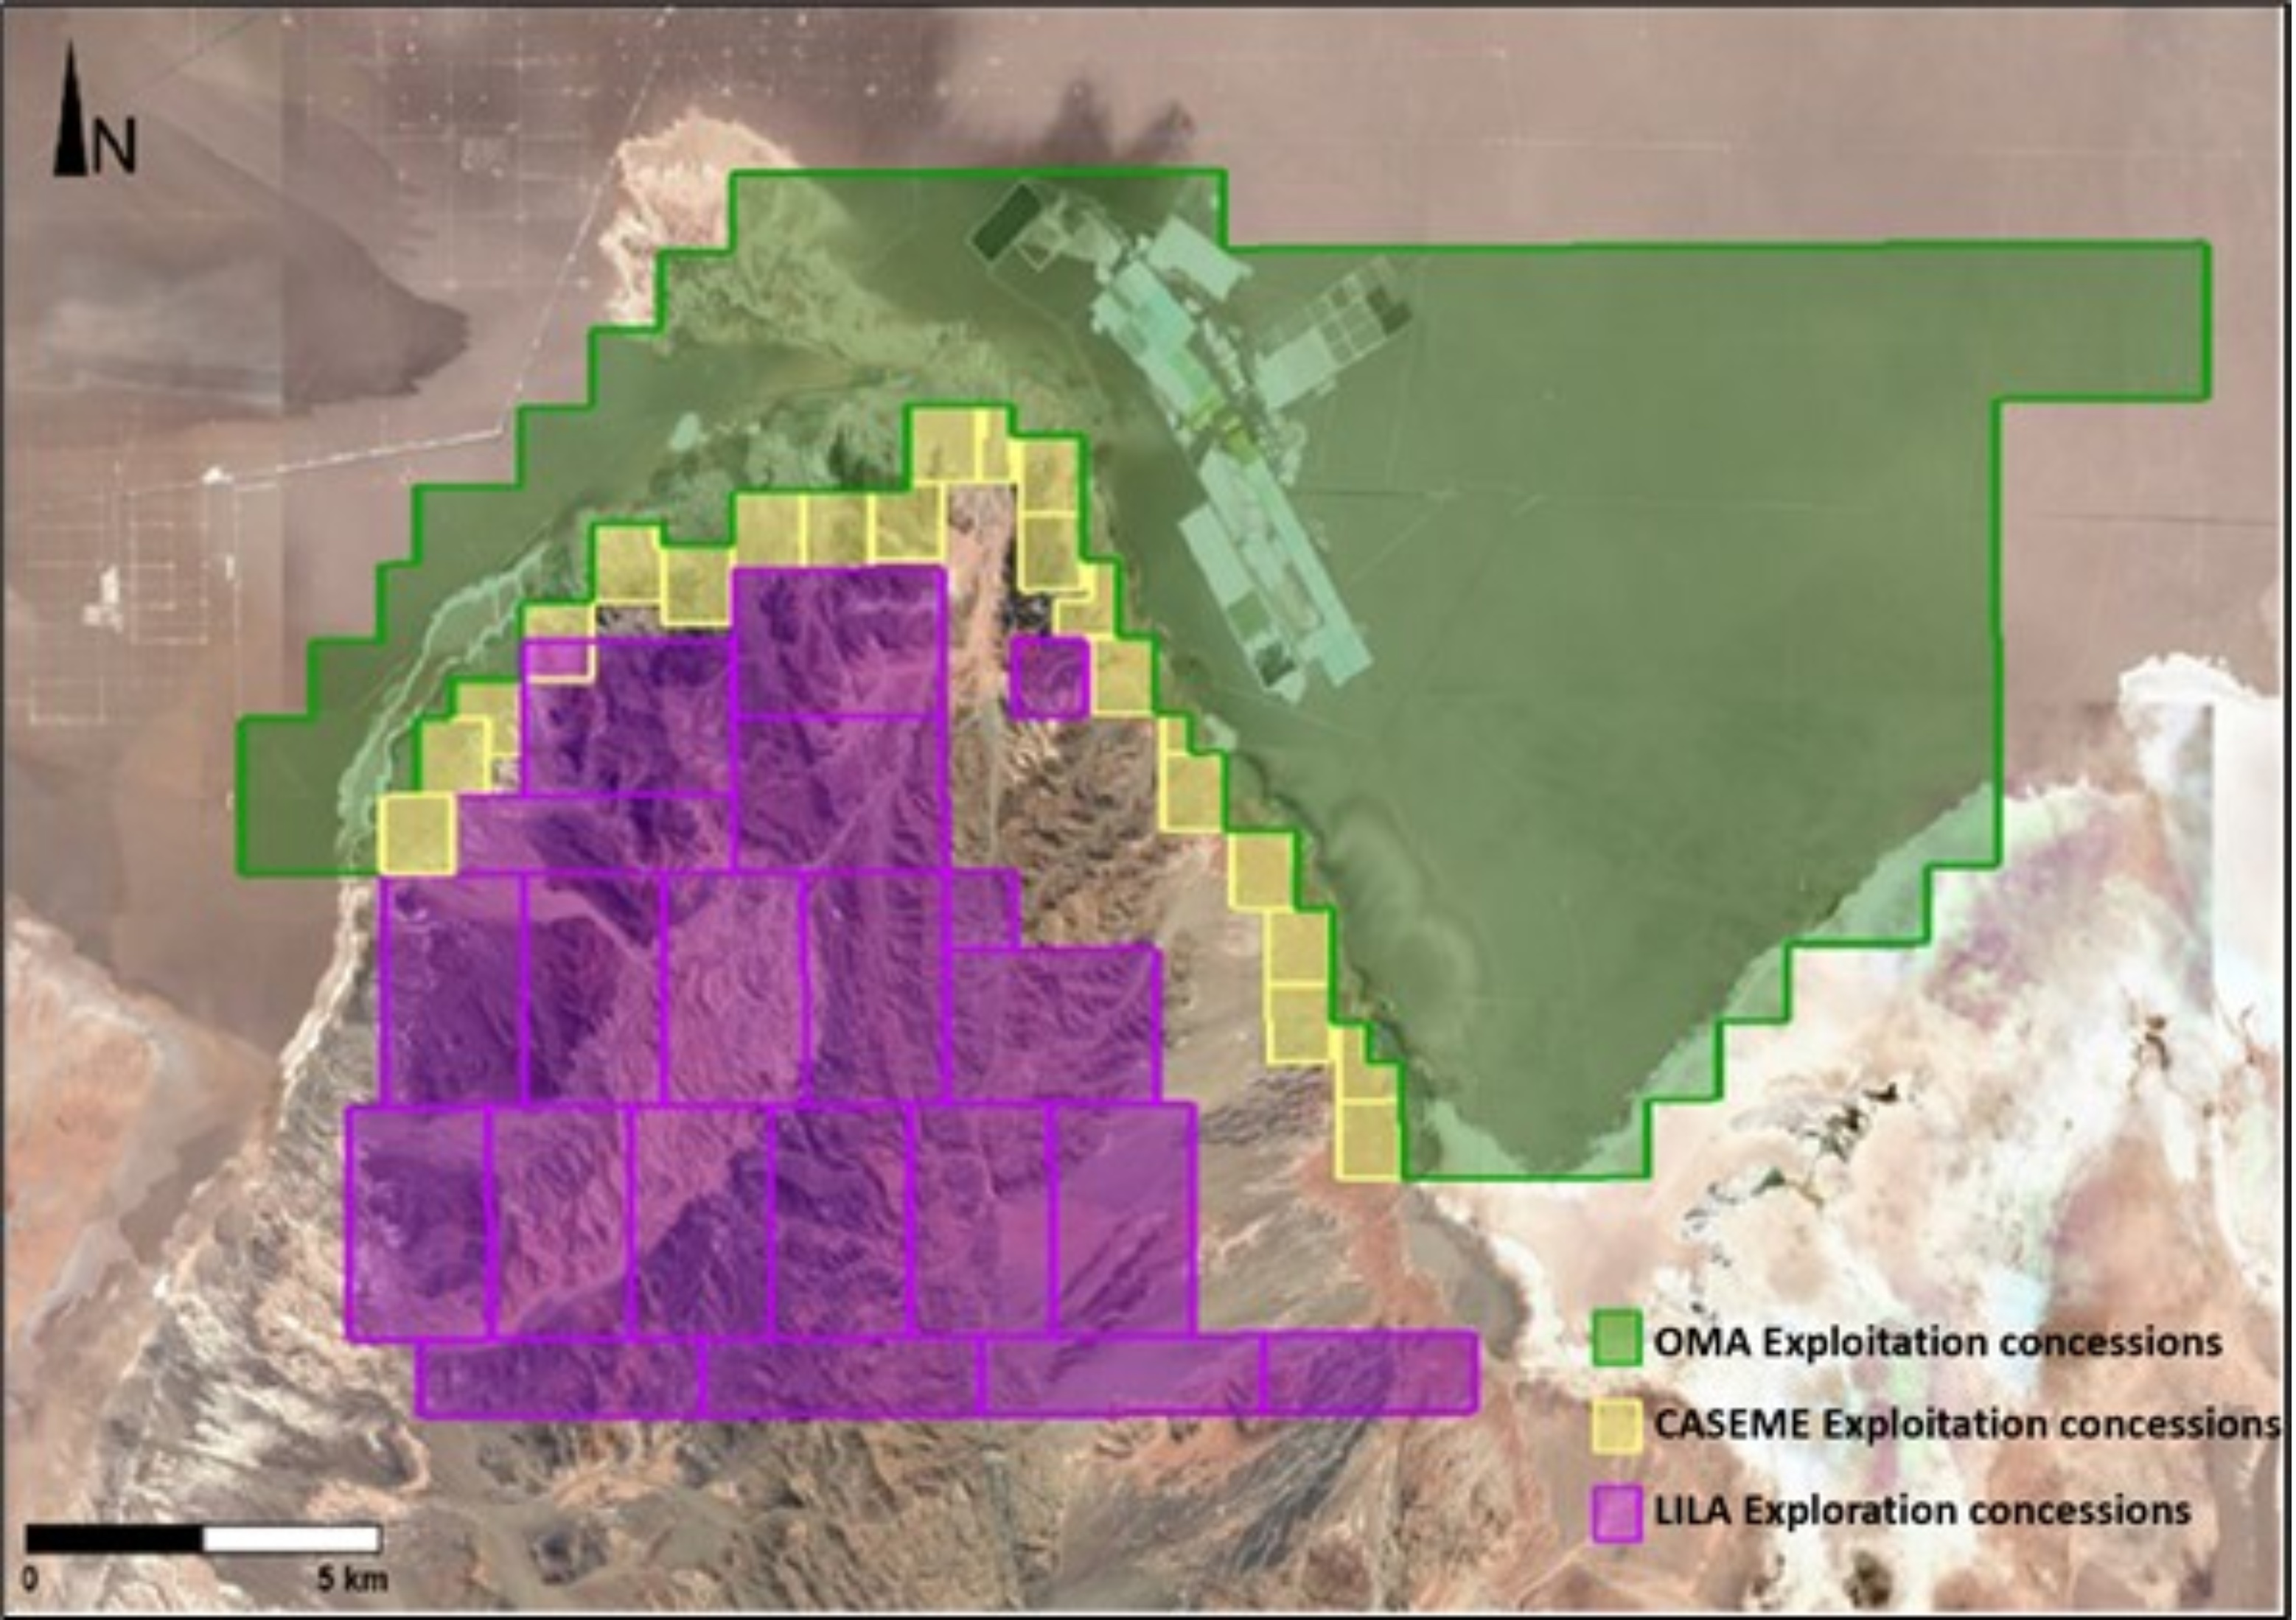
In addition, to the mining properties located in the core of the Salar de Atacama, although not covering the area relevant to the resource and reserve reported herein, Albemarle has mining properties located in the extreme north of the Cordón de Lila called CASEME and LILA as shown in Table 3-2 and Figure 3-3.
| | | | | |
SalardeAtacama_SEC_Report_515800.040 | December 2022 |
SRK Consulting (U.S.), Inc.
| | | | | |
SEC Technical Report Summary – Salar de Atacama | Page 38 |
Table 3-2: Albemarle Mining Concessions
| | | | | | | | | | | | | | | | | | | | |
| CASEME Mining Concessions |
| Property of SCL |
| Role Number | Concession name | Pages | Number | Properties | Hectares |
| 023030381-9 | Caseme uno 1 to 100 | 1464 | 1212 | 100 | 100 |
| 023030382-7 | Caseme dos 1 al 100 | 1466 | 1213 | 100 | 100 |
| 023030383-5 | Caseme tres 1 al 75 | 1468 | 1214 | 75 | 75 |
| 023030384-3 | Caseme cuatro 1 al 100 | 1470 | 1215 | 100 | 100 |
| 023030385-1 | Caseme cinco 1 al 97 | 1472 | 1216 | 97 | 97 |
| 023030386-K | Caseme seis 1 al 100 | 1474 | 1217 | 100 | 100 |
| 023030401-7 | Caseme siete 1 al 100 | 1476 | 1218 | 100 | 100 |
| 023030402-5 | Caseme ocho 1 al 100 | 1478 | 1219 | 100 | 100 |
| 023030388-6 | Caseme nueve 1 al 95 | 1480 | 1220 | 95 | 95 |
| 023030389-4 | Caseme diez 1 al 100 | 1482 | 1221 | 100 | 100 |
| 023030387-8 | Caseme once 1 al 46 | 1484 | 1222 | 46 | 46 |
| 023030390-8 | Caseme doce 1 al 90 | 1486 | 1223 | 90 | 90 |
| 023030391-6 | Caseme trece 1 al 90 | 1488 | 1224 | 90 | 90 |
| 023030392-4 | Caseme catorce 1 al 65 | 1490 | 1225 | 65 | 65 |
| 023030393-2 | Caseme quince 1 al 90 | 1492 | 1226 | 90 | 90 |
| 023030394-0 | Caseme dieciseis 1 al 20 | 1494 | 1227 | 20 | 20 |
| 023030395-9 | Caseme diecisiete 1 al 90 | 1496 | 1228 | 90 | 90 |
| 023030396-7 | Caseme dieciocho 1 al 90 | 1498 | 1229 | 90 | 90 |
| 023030397-5 | Caseme diecinueve 1 al 90 | 1500 | 1230 | 90 | 90 |
| 023030398-3 | Caseme veinte 1 al 90 | 1502 | 1231 | 90 | 90 |
| 023030399-1 | Caseme veintiuno 1 al 65 | 1504 | 1232 | 65 | 65 |
| 023030400-9 | Caseme veintidos 1 al 90 | 1506 | 1233 | 90 | 90 |
| Totals | 1,883 | 1,883 |
| LILA Mining Concessions |
| Property of Albemarle LTDA |
| Role Number | Concession name | Pages | Number | Hectares |
| 02303-B222-7 | Lila 1 | 3146 | 2236 | 400 |
| 02303-B247-2 | Lila 2 | 3148 | 2237 | 400 |
| 02303-B4998 | Lila 3 | 3718 | 2579 | 400 |
| 02303-B241-3 | Lila 4 | 3150 | 2238 | 300 |
| 02303-B5005 | Lila 5 | 3720 | 2580 | 600 |
| 02303-B5013 | Lila 6 | 3722 | 2581 | 600 |
| 02303-B243k | Lila 7 | 3152 | 2239 | 600 |
| 02303-B503k | Lila 8 | 3724 | 2582 | 600 |
| 02303-B225-1 | Lila 9 | 3154 | 2240 | 600 |
| 02303-B245-6 | Lila 10 | 3156 | 2241 | 600 |
| 02303-B5021 | Lila 11 | 3726 | 2583 | 600 |
| 02303-B220-0 | Lila 12 | 3158 | 2242 | 600 |
| 02303-B246-4 | Lila 13 | 3160 | 2243 | 600 |
| 02303-B505-6 | Lila 14 | 3728 | 2584 | 600 |
| 02303-B224-3 | Lila 15 | 3162 | 2244 | 600 |
| 02303-B244-8 | Lila 16 | 3164 | 2245 | 100 |
| 02303-B5048 | Lila 17 | 3730 | 2585 | 400 |
| 02303-B221-9 | Lila 18 | 3166 | 2246 | 600 |
| 02303-B248-0 | Lila 19 | 3168 | 2247 | 600 |
| 02303-B5072 | Lila 20 | 5311 | 3566 | 600 |
| 02303-B223-5 | Lila 21 | 3170 | 2248 | 100 |
Source: GWI, 2019
| | | | | |
SalardeAtacama_SEC_Report_515800.040 | December 2022 |
SRK Consulting (U.S.), Inc.
| | | | | |
SEC Technical Report Summary – Salar de Atacama | Page 39 |
Source: Albemarle, 2019
Figure 3-3: Albemarle Mining Concessions
Section 17 of this report provides a summary of the existing environmental permits and under which Albemarle operates. The rights to use existing water and the agreements with the communities are also summarized.
Since 2000 to date, numerous Environmental Impact Declarations and Environmental Impact Studies have been approved by the Environmental Assessment Service (SEA) for both the La Negra Plant and the El Salar Plant. In addition, 10 Pertinence Queries to the SEA have been entered. Albemarle has two wells located in the Tilopozo and Tucúcaro areas, both of which have groundwater rights.
3.3Royalties
As described above, CORFO owned the concessions in the Salar de Atacama prior to 1979, which are currently operated by Albemarle and SQM, under specific contracts with limits to lithium extraction in time and/or quantity. The role of the corporation in is to safeguard its rights in contracts and collect agreed payments, which it exercises through the Sistema de Empresas (SEP). In the case of ALB, only one royalty payment for potassium is contemplated since the usage of the concessions granted by CORFO was recognized as a contribution to the constitution of the initial company.
| | | | | |
SalardeAtacama_SEC_Report_515800.040 | December 2022 |
SRK Consulting (U.S.), Inc.
| | | | | |
SEC Technical Report Summary – Salar de Atacama | Page 40 |
The new agreement of Albemarle with CORFO adds an additional royalty payment to the state development agency, according to the sales price for both carbonate and lithium hydroxide. Table 3-3 presents this royalty schedule.
Table 3-3: CORFO Royalty Scheme for Albemarle in Atacama
| | | | | | | | | | | |
| Lithium Carbonate | Lithium Hydroxide |
| Price Range (USD/ton) | Progressive Commission Rate (%) | Price Range (USD/ton) | Progressive Commission Rate (%) |
| 0-4,000 | 6.8% | 0-4,000 | 6.8% |
| 4,000-5,000 | 8% | 4,000-5,000 | 8% |
| 5,000-6,000 | 10% | 5,000-6,000 | 10% |
| 6,000-7,000 | 17% | 6,000-9,000 | 17% |
| 7,000-10,000 | 25% | 9,000-11,000 | 25% |
| Over 10,000 | 40% | Over 11,000 | 40% |
Source: CORFO, 2019
Albemarle also contributes 3.5% of its annual sales to the communities (Council of Atacameños Peoples -CPA) , which contributes to their development.
| | | | | |
SalardeAtacama_SEC_Report_515800.040 | December 2022 |
SRK Consulting (U.S.), Inc.
| | | | | |
SEC Technical Report Summary – Salar de Atacama | Page 41 |
4Accessibility, Climate and Infrastructure
The Salar del Atacama basin is located within the Pre-Andean Depression, limited to the east by the Andes Mountains and to the west by the Domeyko Mountains. While located within the Andes, the salar itself is completely flat over an extensive area. The elevation of the salar is approximately 2,300 meters above mean seal level (mamsl) and an area of approximately 3,500 km2. It has an elliptical surface with orientation from North to South and a slight slope towards the South. It is made up of 75% saline deposits that give it a rough surface.
The main climatic feature of the region is its great aridity. The most extreme aridity (in fact the driest location on earth) is located to the west of the salar, between the coastal range and the Andes, where there is no maritime influence. The extreme aridity in this intermediate zone and the scarce existing vegetation define a natural landscape known as the Atacama Desert.
The Salar de Atacama is located at an elevation of 2,000 and 3,500 mamsl. The climate is high altitude marginal desert, which presents a greater quantity and volume of rainfall in the summer months, between 20 and 60 millimeters per year (mm/y). The desert environment (low rainfall and high evaporation rates), combined with limited natural water courses, has resulted in the formation of numerous salars, among which the Salar de Atacama stands out for its extension.
Rainfall occurs mainly from January to March, as a result of the humidity transported from the Amazon basin (Bolivian winter) and to a lesser extent between April and August due to the displacement of cold fronts from Antarctica. The rainfall decreases from 300 mm/y in the Andes Mountains to about 10 to 20 mm/y in the Domeyko mountain range and on the Salar itself, with a statistical average of about 12 mm/y for the salar.
Maximum temperatures occur during the months of December to March, coinciding with the summer season and the minimum temperatures are seen in winter, between the months of June and August. The highest temperatures reach values close to 35 degrees Celsius (°C), while the minimum temperatures reach values close to -5°C in some cases. The average difference between the minimum and maximum temperatures is observed constant throughout the historical temperature series, having a value of approximately 20°C between day and night.
Evaporation also shows a seasonal variation, where the highest evaporation rates were measured in the months from December to February (summer) and the minimum values, between the months of June and August (winter). These results are consistent with the temperature variations between the different seasons of the year.
4.1Infrastructure
As a mature operation, adequate infrastructure is in place to support operations at both the Salar de Atacama and La Negra processing facilities. Infrastructure is described in detail in Section 14.
The La Negra facilities are located 20 km south-east of the city of Antofagasta, the regional capital, which has power, water, highway, airport and port facilities as well as adequate local population to support operations.
At the La Negra Plant, the purification of lithium brine, coming from the Salar Plant, is carried out for its subsequent conversion into Lithium Carbonate and Lithium Chloride. The following facilities are operating at the plant: boron removal plant, calcium and magnesium removal plant, lithium carbonate
| | | | | |
SalardeAtacama_SEC_Report_515800.040 | December 2022 |
SRK Consulting (U.S.), Inc.
| | | | | |
SEC Technical Report Summary – Salar de Atacama | Page 42 |
conversion plants, lithium chloride plant, evaporation-sedimentation pools, an off-site area where the raw materials are housed and the inputs used in the process are prepared, and a dry area where the different products are prepared.
The salar is located in a much more remote location, although existing road infrastructure is in place, as described in more detail below. The salar relies upon a camp to support workers, which are sourced regionally. In general, the Antofagasta/Calama region is a major mining hub with adequate support systems for both La Negra and the salar.
The infrastructure facilities at the salar are extraction wells, evaporation and concentration ponds, leaching plant 1 and 2, potash plant, drying plant, service area and general areas, including waste salts stockpiles. The service sector is made up of various buildings, such as: change room, dining room, administrative office building, operations building, and laboratory.
Road transport to/from the salar is important for the movement of supplies, personnel and consumables (e.g., reagents). In addition, the salar produces a concentrated brine (approximately 6% lithium) which must be transported to the La Negra facilities. This access is discussed in more detail below.
From Antofagasta, with the La Negra facilities located in this area, access to the Salar de Atacama basin is possible along the regional highway Route 5 North, which connects with the local B-385 route, which enters the basin from the west and the south of the salar, where the Albemarle operations are located. This is the primary transport route for concentrated brine from the salar to La Negra and is approximately 250 km by road. From Calama, access is via the regional highway 23-CH, which connects the city of Calama with the international Sico pass, on the border with Argentina. This route passes on the northern margin of the salar with access to the site again on the local B-385 route, passing along the eastern margin of the salar and entering to the south. The distance from the operation on the salar to Calama is around 190 km (Figure 4-1).
At the local level, the entrance to Albemarle's properties is located south of the communal territory of San Pedro de Atacama and is approximately 100 km, by road, away from this commune.
| | | | | |
SalardeAtacama_SEC_Report_515800.040 | December 2022 |
SRK Consulting (U.S.), Inc.
| | | | | |
SEC Technical Report Summary – Salar de Atacama | Page 43 |
Source: GWI, 2019
Figure 4-1: Property Access
| | | | | |
SalardeAtacama_SEC_Report_515800.040 | December 2022 |
SRK Consulting (U.S.), Inc.
| | | | | |
SEC Technical Report Summary – Salar de Atacama | Page 44 |
5History
In the early 1960s, William E. Rudolph, a geologist at Anaconda Company, conducted surveys in northern Chile for new water sources for the Chuquicamata operation and found water with high concentrations of salts in the Salar de Atacama Basin. In the mid-1960s, the report on the results of the brine obtained in the Salar de Atacama reached the hands of Foote Mineral Company. Later in 1970, these reports were also published in The Mining Journal of London and The Christian Science Monitor.
On August 13, 1980, CORFO signed an agreement with Foote Mineral Company (currently Albemarle US Inc) to develop a lithium project in the Salar de Atacama, on the OMA mining leases incorporated by CORFO in 1977.
In this context, Foote Mineral Company and CORFO created the Chilean Society of Limited Lithium (SCL) with a 55% and 45% stake in the share capital, respectively. The duration of the company was agreed in a term equal to that necessary to exploit, produce and sell the indicated amount of LME approved for extraction, i.e., 30 years, automatically renewable for successive terms of five years each. CORFO contributed to the company the OMA mining leases. This contribution was subject to the condition that such leases are returned free of charge and in full right to CORFO upon the fulfillment of the agreement.
Between 1988 and 1989, CORFO sold its 45% stake in SCL to Foote Mineral Company. In 1998 Chemetall purchased Foote Mineral Company, creating Chemetall-Foote Corporation. Subsequently, in 2004, Chemetall-Foote was acquired by Rockwood Lithium Inc., and in 2016, the latter was acquired by Albemarle US Inc, changing ownership of the Salar and La Negra Plants to Albemarle Ltda.
On November 25, 2016, CORFO and Albemarle US Inc. modified the original lithium production agreement through which its duration was modified, extending it and adding an additional 262,132 metric tons of production rights. This extension is valid until the original and expanded production rights have been exploited, processed, and sold, or January 1, 2044, whichever comes first.
In 1981, the first construction of evaporation ponds in the Salar de Atacama began. The following year, the construction of the Lithium Carbonate Plant in La Negra sector in Antofagasta began, which treats and transforms the concentrated brines, coming from the Salar Plant, into lithium carbonate and lithium chloride. A photograph of the first installations is provided in Figure 5-1.
| | | | | |
SalardeAtacama_SEC_Report_515800.040 | December 2022 |
SRK Consulting (U.S.), Inc.
| | | | | |
SEC Technical Report Summary – Salar de Atacama | Page 45 |
Source: GWI, 2019
Figure 5-1: Year 1980, First Installations
Initially, SCL constructed a solar pond system at the salar and a lithium carbonate plant with 6,350 million tonnes per year (Mt/y) of lithium carbonate capacity was constructed at La Negra. Production started in 1984. In 1990, the salar operations were expanded with a new well system and the capacity of the lithium carbonate plant at La Negra was expanded to approximately 11,000 t of lithium carbonate per year. In 1998, the lithium chloride plant started operating at La Negra. In the early 1990s potash also began to be recovered as a by-product from the sylvinite harvested from their solar ponds. Operations at the salar and La Negra have subsequently been expanded again and currently production rates are around 45,000 t per year of LCE (combined lithium carbonate and chloride). Further expansion work is currently in process (e.g., La Negra 3) to be able to achieve the increased production rate of 84,000 tonnes per year (t/y) LCE contemplated by the revised 2016 agreement between Albemarle and CORFO.
| | | | | |
SalardeAtacama_SEC_Report_515800.040 | December 2022 |
SRK Consulting (U.S.), Inc.
| | | | | |
SEC Technical Report Summary – Salar de Atacama | Page 46 |
6Geological Setting, Mineralization, and Deposit
6.1Regional, Local and Property Geology
6.1.1Regional Geology
As described in GWI, 2019:
The geological history of the Salar de Atacama basin is summarized in Munk et al. (2016) and references within the regional geological map (i.e., Niemeyer, 2013) (Figure 6-1). Sedimentary, volcanic and plutonic rocks indicate the basin was positioned along the western margin of Gondwana during the Paleozoic. During the Jurassic and early Cretaceous this region was an extensional backarc basin, with inversion and basin scale tectonic subsidence initiating in the late Cretaceous. This continental backarc setting persisted through the Paleogene, transitioning to a forearc basin in the Neogene. Uplift and predominantly clastic deposition have been ongoing since the Cretaceous, and during the Plio-Pleistocene thick halite deposits accumulated in the center of the basin.
Details of the Cenozoic geologic history highlight several relevant observations in the Salar. A foreland basin originated in the mid-Cretaceous, with thrusting and coeval sedimentation occurring during the Cretaceous and Paleogene (Arriagada et al., 2006). During the Oligocene-early Miocene, normal faulting controlled the western margin of the basin, accommodating thousands of m of strata (Jordan et al., 2007). Most of this sedimentation was accommodated by a normal fault along the western basin margin that generated as much as 6 km of vertical displacement (Pananont et al., 2004).
From approximately 12 Ma onward the volcanic arc was established east of the Salar and shortening resumed, uplifting the intrabasinal Cordillera de la Sal and later resulting in development of blind thrust faults within the basin (Jordan et al., 2007). A number of late Miocene and Pliocene ignimbrites derived from calderas on the plateau can be traced westward into the subsurface of the Atacama basin. These ignimbrites interfinger with Plio-Pleistocene evaporite deposits that are typically 1 km thick and establish the age of these strata as Plio-Pleistocene. In the southern portion of the salar these deposits are offset by the Salar Fault System (SFS), which exhibits close to one km of down-to-the-east offset on a reverse fault (Jordan et al., 2002b).
Several aspects of the geological history are relevant to the generation of lithium rich brine in the Salar. For example, there are a number of fault systems with km scale offsets that may be preferential flow paths for fluids. During the Miocene and Pliocene, several voluminous ignimbrite pulses related to development of the large Altiplano-Puna volcanic complex (APVC) indicate major magmatic activity to the east on the plateau (Salisbury et al., 2011). It is possible that this volcanism is intimately related to late Miocene uplift of the plateau via lower crustal delamination (cf. Hoke and Garzione, 2008).
If large scale tectonic factors play a role in the generation of lithium brines these processes might be relevant to generation of the lithium enriched brine in the Salar, particularly if the mantle is considered the ultimate source of lithium to brines. Crustal scale faults within the Atacama basin itself are not necessarily good candidates for communication between the mantle and brine aquifers in light of the fact that the lithosphere below the Atacama basin is widely believed to be a cold, rigid block on the basis of seismological data (Schurr and Rietbrock, 2004).
| | | | | |
SalardeAtacama_SEC_Report_515800.040 | December 2022 |
SRK Consulting (U.S.), Inc.
| | | | | |
SEC Technical Report Summary – Salar de Atacama | Page 47 |
Source: Carta Geologica de Chile No 54. Hoja Toconao (1:250.000), Hoja Cordon de Lila- Peine (1:100.000). Modified from IIG 1982 by Vai 2021. (UTM WGS84 HUSO 19S)
Figure 6-1: Regional Geology Map
| | | | | |
SalardeAtacama_SEC_Report_515800.040 | December 2022 |
SRK Consulting (U.S.), Inc.
| | | | | |
SEC Technical Report Summary – Salar de Atacama | Page 48 |
6.1.2Local Geology
As described in GWI, 2019
The salar basin is divided into two distinct morphological zones. In the north, the eastern slope is characterized by monoclinal folding blanketed by thick ignimbrite deposits and alluvial fans (e.g., Reutter et al., 2006; Jordan et al., 2010). To the south, a series of large fold and thrust belts form a series of ridges and troughs that delineate sedimentary deposition and groundwater flow (Ramirez and Gardeweg, 1982; Aron et al., 2008). Alluvial fans around the salar are important for transporting fluid to the marginal zones (Mather and Hartley, 2005), but large aquifer systems are not well defined. The largest aquifer is the Monturaqui-Negrillar-Tilopozo (MNT) system in the south. Unwelded to moderately welded ignimbrites in the basin have high infiltration capacity and permeability, while welded ignimbrites may act as confining units (Lameli, 2011; Houston, 2009).
Recent and ongoing work on a set of sediment cores from the south part of the basin and the halite nucleus indicate a complex hydrostratigraphy of sand and gravel, ash and ignimbrite and evaporites (Munk et al., 2014). The low permeability Peine block (Lameli, 2011) diverts groundwater flow to the north and south, while the zone of monoclinal folding is expected to be more conducive to regional groundwater flow based on laterally extensive strata dipping towards the salar (Jordan et al., 2002a, 2002b). The blind, high-angle, down-to-the-east north-south trending reverse SFS, which cuts across the salar, accommodates over 1 km of offset basin fill strata (Jordan et al., 2007; Lowenstein et al., 2003).
The southeastern slope of the Salar, south of the Tumisa volcano and east of the Cordon de Lila, is bounded to the southwest by the MNT trough, a 60 km long N–S oriented depression bounded to the east by the Toloncha fault (Aron et al., 2008). This trough contains several folds and thrust belts including the prominent Tilocalar ridge. The Miscanti fault and fold to the east separates the basin from the Andes and controls the development of the intra-arc Miñiques and Miscanti lakes (Rissmann et al., 2015; Aron et al., 2008). A large lithospheric block of Paleozoic rock, bounded by the N-S trending Toloncha Fault System and Peine fault is interposed in the center of the southeastern slope forming a major hydrogeologic feature that likely diverts groundwater as well as generally restricting groundwater flow through this zone (Breitkreuz, 1995; Jordan et al., 2002a; Ruetter et al., 2006; Gonzalez et al., 2009; Boutt et al., 2018).
The fold and thrust belt architecture of the basin slope is responsible for the development of several other thrust fault systems of varying depths and length but which generally trend N-S, parallel to the salt pan margin. These faults are thought to be major conduits for groundwater flow to the surface as evidenced by the spring complexes emerging along or in the immediate vicinity of these fault zones (Aron et al., 2008; Jordan et al., 2002b).
6.1.3Property Geology
As described in GWI, 2019
Salar basin fill materials are dominated by the Vilama Formation and modern evaporite and clastic materials currently being deposited in the basin. A detailed stratigraphy of the Salar basin is published in Lin et al. (2016). In the Albemarle operation area, the Vilama Formation is up to approximately 1 km thick and is host to the production aquifer system. The formation is composed of evaporite chemical sedimentary rocks including intervals of carbonate, gypsum and halite
| | | | | |
SalardeAtacama_SEC_Report_515800.040 | December 2022 |
SRK Consulting (U.S.), Inc.
| | | | | |
SEC Technical Report Summary – Salar de Atacama | Page 49 |
punctuated by sedimentary volcanic deposits of large ignimbrite sheets, volcanic ashes and minor clastic deposits. These deposits are best observed in outcrop along the salar margin and in drill cores from the Albemarle project site.
In the Tilocalar Peninsula region, younger lacustrine carbonates (approximately 435 ka from Lin et al., 2016) of the El Tambo formation unconformably overlie the Tucucaro ignimbrite. These two geologic units are folded and faulted along north-south trending fault-cored reverse faults. The youngest geologic deposits in the project area are the modern evaporite (halite) and clastic sediments (primarily clay and windblown silt) being deposited today through processes of evaporation and physical sedimentation. In the southern part of the project area these deposits are dominated by carbonate and gypsum, which are deposited as solute-rich inflow waters are evaporated in the transition zone.
The salar margin on the east side of the Cordon de Lila is characterized by the 3.1 Ma Tucucaro ignimbrite. The ignimbrite unconformably overlies either the bedrock of the Cordon de Lila or older salar lacustrine sediments, as seen along the margins of the Cordon de Lila and of the Chepica Peninsula.
The Chepica Peninsula is another prominent geologic feature within the Albemarle concessions. It consists of the Tucucaro ignimbrite overlying gypsum and carbonate lacustrine sediments.
Similar geologic features and exposures occur to the south of the Chepica Peninsula on the north part of the Cordon de Lila.
SRK and Albemarle defined lithostratigraphic units for the salar deposits based on numerous diamond drill holes and outcrop observations. These are classified in terms of their general rock type (clastic, evaporite, volcanic) as well as textures.
Generalized geologic cross sections were developed across the Albemarle concessions with the locations shown in plan view on Figure 6-3. Section A-A’ (Figure 6-3) is oriented north south on the east side of the Cordon de Lila and extends through the transition zone and the nucleus. Section B-B’ (Figure 6-3) is orientated east west though the nucleus, transition zone, and eastern sedimentary units. Confirmation in drill holes is limited to the upper 150 m, and in many cases to 30 to 50 m. Consequently, interpretations and interpolations were made with high resolution seismic, general geology, and structures observed in outcrop. These cross sections were used in addition to several other sections to build the geologic and hydrostratigraphic models discussed in Sections 11.1.4.
| | | | | |
SalardeAtacama_SEC_Report_515800.040 | December 2022 |
SRK Consulting (U.S.), Inc.
| | | | | |
SEC Technical Report Summary – Salar de Atacama | Page 50 |
Source: SRK, 2021
Figure 6-2: Generalized Conceptual Geologic Plan View Along a N-S Transect
| | | | | |
SalardeAtacama_SEC_Report_515800.040 | December 2022 |
SRK Consulting (U.S.), Inc.
| | | | | |
SEC Technical Report Summary – Salar de Atacama | Page 51 |
Note: VGC. Volcanic, Gypsum and Clastic sequences
Source: SRK, 2021
Figure 6-3: Generalized Conceptual Geologic Cross Sections Along a N-S Transect
6.2Mineral Deposit
The Salar is located in the Central Andes of Chile, a region which is host to some of the most prolific Li brine deposits in the world. The Central Andean Plateau and the Atacama Desert are two important physiographic features that contribute to the generation of Li brines in the Central Andes. In these environments, the combination of hyper-arid climate, closed basins, volcanism, and hydrothermal activity has led to extensive deposition of evaporite deposits since approximately 15 Ma (Alonso et al., 1991). The extreme size and longevity of these closed basins is favorable for Li brines generation, particularly where thick evaporite deposits (halite, gypsum and less commonly borates) have removed ions from solution and further concentrated Li. A general overview of the geology and mineral resources of Central Andean salars can be found in Ericksen et al. (1990).
The Salar occurs in the plateau margin basin of a volcanic arc setting and active subsidence in the basin is driven by transtenion and orogenic loading. The Li-rich brine at Salar contains on average 1,400 mg/L Li with a minimum of 900 mg/L and a maximum of nearly 7,000 mg/L. Li appears to be sourced from weathering of the basin geology, the Andean arc and the Altiplano-Puna plateau, which is transported into the closed basin where it is concentrated by evapotranspiration (Munk et al., 2018).
Li-rich brines are produced from a halite aquifer within the Salar nucleus. Carbonate and sulfate flank the basin and indicate that carbonate and sulfate mineral precipitation may have played a role in producing the brine. In addition to the evaporative concentration processes, the distillation of Li from geothermal heating of fluids may further concentrate Li in these brines and provide prolonged replenishment of brines that are in production. Since many Li-rich brines exist over, or in close proximity to, relatively shallow magma chambers, the late-stage magmatic fluids and vapors may have pathways through faults and fractures to migrate into the closed basin.
Waters in the Salar basin and the adjacent Andean arc vary in Li concentration from approximately 0.05 to 5 mg/L in the Andean inflow waters, 5 to 100 mg/L Li in shallow groundwaters in the south and east flanks of the basin and in excess of 5,000 mg/L in brines (Munk et al., 2018). This indicates
| | | | | |
SalardeAtacama_SEC_Report_515800.040 | December 2022 |
SRK Consulting (U.S.), Inc.
| | | | | |
SEC Technical Report Summary – Salar de Atacama | Page 52 |
that the Li-rich brine in the basin is concentrated by up to five orders of magnitude compared to water entering the basin. This is a unique hydrogeochemical circumstance to the Salar compared to other Li brine systems. Ultimately, it is the combination of Li concentrations, the overall geochemical character of the brine and the accessibility of the brine for production that have led to the optimal conditions for producing Li-enriched brine in the Salar.
6.3Stratigraphic Column and Local Geology Cross-Section
Geological Units Definitions
Upper Halite (H1 and H2)
This unit is dominated by halite sequences and represents the main upper aquifer in the salar. The deposit environment in the eastern side of the nucleus is dominated by evaporite systems with an inflow component, which in turn enhances dissolution. Conversely, in the western side show a more evaporitic system, where the inflow factor is less significant. The fine clastic component of this unit increases towards the west. Generally, the upper halite unit is permeable to depths of up to 50 m, however, in the southeastern part of the Salar, this unit can reach depths of over 100 m.
Lower Halite
This unit is located below the Upper Halite in almost the entire salar. It corresponds to compacted sequences of halite, gypsum, and fine clastic materials. This unit likely extends to depths greater than 1,000 m in the halite nucleus and exhibits a significantly lower permeability and porosity than the Upper Halite.
Ignimbrite
This unit comprises the extensive volcanic ignimbrite deposits found at the surface and subsurface throughout the region. It was formed through multiple eruptive events and may be locally welded, unwelded, fractured, with its thickness and presence varying from a few centimeters to 10’s of meters throughout the region. Data suggests this fracturing (permeability and porosity) is a key factor in the Li brine system. The main outcrops can be found in Chepica and Tilcolar peninsulas with depth varying from surface to 250m. The ignimbrite footprint is well understood in the vicinity of the mine operations and exploration areas however, drill data observations indicated the presence of various ash sequences with similar properties throughout the salar.
VGC (Volcanic Gypsum and Clastic)
This unit consists of sequences of weathered Ignimbrite, Gypsum, Ash layers, various clastic units and clays layers. It is well recognized in the southern portion of the of Salar with porosity and permeability decreasing with depth related to compaction and chemical alteration.
Marginal Cordon de Lila Clastic Aquifer
This unit is composed of interbedded sands, gravels, and local carbonates generally occurring along the margin of the of the Cordon de Lila. This unit is limited to a maximum depth of 100 m which can vary in depth and thickness related to faulting and/or alluvial fan geometry. Permeability is primarily controlled by porosity associated with bedding plane fractures and vuggy carbonate layers. This unit was subdivided into the Upper and Lower Clastic based on material composition.
| | | | | |
SalardeAtacama_SEC_Report_515800.040 | December 2022 |
SRK Consulting (U.S.), Inc.
| | | | | |
SEC Technical Report Summary – Salar de Atacama | Page 53 |
The Upper Clastic consists of gravel, sand, and clays sequences with some halite lenses. The Lower Clastic consist of clay, sand, halite, and gypsum with the occurrence of anhydrite in some areas
Transition Zone
This unit occurs along the eastern northern, and southern border of the nucleus, east of the Tilocalar ridge. It is composed of laminated, vuggy freshwater carbonates from spring discharge, and localized precipitation in lagoons. The primary lithology is gypsum, clays, and carbonates with the highest permeability encountered within 10 m of the surface. Permeability heavily impacted by the presence of the freshwater-brine transition zone and secondary porosity enhancement. Deeper sequences have lower permeability and porosity due to compaction and chemical alteration. This is an important aquitard in the deeper transition zone with thicknesses up to 200m in the southern portion of the salar.
Marginal Clastic Aquifer
This unit represents the alluvial and fluvial deposits of varying ages surrounding the salar. These deposits are undifferentiated in the model, however, can be divided into eastern and western units (East Sediments and West Sediments). Permeability is dominated by primary porosity and depositional processes.
A stratigraphic column of the in Albemarle claim area is shown in Figure 6-4 representing the southwest, adjacent to the chepica Peninsula, and eastern portions of the local geologic model. The local geology is shown in plan view and cross sections in Figure 6-5 and Figure 6-6 respectively.
Source: Albemarle 2020
Notes:
Southwest stratigraphic column represents the southwestern side of the area A1.
Peninsula Chepica stratigraphic column represent the area A1 in the north of Peninsula Chepica
East (A3) stratigraphic column represent the area A3
Figure 6-4: Stratigraphic Column in Albemarle Property
| | | | | |
SalardeAtacama_SEC_Report_515800.040 | December 2022 |
SRK Consulting (U.S.), Inc.
| | | | | |
SEC Technical Report Summary – Salar de Atacama | Page 54 |
Source: SRK 2021
Figure 6-5: Local Geology Plan View
| | | | | |
SalardeAtacama_SEC_Report_515800.040 | December 2022 |
SRK Consulting (U.S.), Inc.
| | | | | |
SEC Technical Report Summary – Salar de Atacama | Page 55 |
Source: SRK 2021
Note: VGC (Volcanic Gypsum and Clastic)
Figure 6-6: Local Geology Cross Sections
| | | | | |
SalardeAtacama_SEC_Report_515800.040 | December 2022 |
SRK Consulting (U.S.), Inc.
| | | | | |
SEC Technical Report Summary – Salar de Atacama | Page 56 |
7Exploration
7.1Exploration Work (Other Than Drilling)
A number of geophysical surveys have been conducted within the claims areas as well as within the salar to evaluate continuity of lithologic units and changes in brine salinity. Downhole geophysical surveys have been conducted in various boreholes to evaluate the permeability of sediments and evaporites in addition to Nuclear Magnetic Resonance (NMR) surveys to evaluate the porosity of the sediments. Figure 7-1 shows the locations of the various geophysical surveys that have been conducted for the site with a summary of the work outlined in Table 7-1.
Source: GWI, 2019
Figure 7-1: Location of Exploration at the Albemarle Atacama
Table 7-1: Summary of Exploration Work
| | | | | | | | |
| Exploration Technique | Number | Meters |
| TEM and Nanotem Lines | 15 | 93,500 |
| Seismic Reflection Lines | 7 | 39,870 |
| Well Geophysical Records | 25 | 2,000 |
| NMR Records | 36 | 4,348 |
| Deep Pumping Tests | 10 | - |
Source: Albemarle, 2019
| | | | | |
SalardeAtacama_SEC_Report_515800.040 | December 2022 |
SRK Consulting (U.S.), Inc.
| | | | | |
SEC Technical Report Summary – Salar de Atacama | Page 57 |
7.1.1Transient Electromagnetic Survey (TEM)
In 2017, Albemarle commissioned Geodatos (Geodatos, 2017) to determine the geoelectric characteristics of the subsurface by acquiring additional knowledge of the stratigraphic variations, both laterally and vertically, of the different lithologies present. Furthermore, the study was intended to determine the relative variations in porosity of the saturated strata, these being directly related to the variations in electrical resistivity.
The acquisition of TEM data was performed for 19 days in the period from November 24, 2016 to January 12, 2017 and NanoTEM for 26 days in the period from November 24, 2016 to January 12, 2017. The location of the measurement lines of both methodologies is shown in Figure 7-1.
The number of stations and lines, the spacing and the type of loop used are detailed below:
•Electromagnetic Transient, 234 stations were measured on 15 lines, the spacing between stations being approximately 400 m. TEM soundings were measured with Coincident Loop Tx = Rx of 100x100 m2.
•Electromagnetic Nano Transient, 467 stations were measured on 15 lines, the spacing between stations being approximately 200 m. The NanoTEM soundings were measured with a Central Loop of Tx = 50x50 m2 and Rx = 10x10 m2.
Figure 7-2 shows an example of the result of a TEM profile, the trace of which is shown in red on the lower map, made in the North of the study area.
Source: GWI, 2019
Figure 7-2: Example of Results from the Geophysical Profile TEM
| | | | | |
SalardeAtacama_SEC_Report_515800.040 | December 2022 |
SRK Consulting (U.S.), Inc.
| | | | | |
SEC Technical Report Summary – Salar de Atacama | Page 58 |
The interpretation of the results, as well as the assignment of hydrogeological units to each of the identified geoelectric units is discussed in more detail in Chapter 6.
7.1.2Seismic Reflection
In 2018, Albemarle commissioned Wellfield Services Ltda. to carry out a seismic study in the southern portion of Salar de Atacama, specifically on the Albemarle mining concession in this area, in order to characterize the geology. This study includes the application of the Seismic Reflection technique, with a vibratory energy source for accessible areas of relatively flat terrain (Wellfield Services, 2019).
The topography work began on October 11, 2018 and ended on February 13, 2019. The seismic record begins on November 18, 2018 and ends on February 14, 2019. The seismic survey considered seven seismic lines whose locations are shown in Figure 7-2.
The horizons generated in the sequence present a good intensity and resolution, being able to distinguish horizontal and vertical events both at the level of the stack in the two dimensional (2D) lines.
Reflection Seismic results were used to define the limits several hydrogeological units. In particular, the bottom of the upper halite, which represents the main aquifer in Albemarle property.
7.1.3Borehole Geophysics
During the 2017 and 2018 drilling campaign, downhole geophysical logging was carried out in 26 boreholes over a total lithological column recorded of approximately 2,000 m.
Geophysical logging was carried out using the following probes:
•Caliper (one probe)
•Natural Gamma, SP, SPR, Resistivity 16/64 (one probe)
•Temperature, Fluid conductivity (one probe)
Use of several of these probes require that the holes should not be lined with pipes. Because the surveys were made during drilling, a complete record is not always found because it was necessary to leave certain footage with casing as protection against possible instabilities of the borehole walls.
An example is shown in Figure 7-3 of the measurement results of a well with the different parameters measured in the field.
| | | | | |
SalardeAtacama_SEC_Report_515800.040 | December 2022 |
SRK Consulting (U.S.), Inc.
| | | | | |
SEC Technical Report Summary – Salar de Atacama | Page 59 |
Source: GWI, 2019
Figure 7-3: Example of Geophysical Log in Well CLO-100
| | | | | |
SalardeAtacama_SEC_Report_515800.040 | December 2022 |
SRK Consulting (U.S.), Inc.
| | | | | |
SEC Technical Report Summary – Salar de Atacama | Page 60 |
The results of the well geophysical logging were considered in the interpretation of the lithological column along with the mapping of the lithology. The combination of these inputs served as the criteria for definition of hydrostratigraphic units represented in the three-dimensional model described in Chapter 6.
7.1.4Nuclear Magnetic Resistance (NMR)
In 2018, Albemarle entrusted the acquisition of geophysical records with nuclear magnetic resonance and gamma rays to the company Zelandez (2019) in conjunction with the company Suez Medioambiente Chile SA. Suez staff operated the equipment in the field while Zelandez supplied the equipment and guidance. In total, NMR surveys were conducted in 36 wells over 26 days, with a total length of 4,348 m tested
The processing and interpretation of the data was carried out remotely within 24 h after acquisition. In all wells, the acquisition of magnetic resonance data of the well was performed satisfactorily, obtaining high quality data. The only drawback found was the influence of the well fluid signal in various wells, it affected the data in these intervals and could not be corrected.
The interpretation of the data has made it possible to group the records by type of well, assigning common characteristics to each group related to the hydrogeological environment in which they are found. In summary, the interpretation of these data has served to identify lithological changes and lithologies, and also to determine the porosity of the terrain.
7.1.5Significant Results and Interpretation
SRK notes that this property is not at an early stage of exploration and is well-understood from previous exploration and current production. The results and interpretation from exploration data is supported in more detail by extensive drilling and active pumping from production wells over the course of more than 35 years of production. The aforementioned data have been interpreted together with the data from the core logging to develop the 3D hydrostratigraphic model described in Chapter 6.
7.2Exploration Drilling
Drilling at Salar de Atacama has been ongoing since 1974. Drilling has been primarily for production wells with limited drilling dedicated to exploration of other areas within the claims.
7.2.1Drilling Type and Extent
In the process of drilling wells to study resources and reserves, three different methods have been used in order to obtain information for the study. The types of equipment used, and their characteristics of use are indicated below:
•Cable Tool Drilling: Used to define the geology, obtain brine samples and perform pumping tests. Wells were used as monitoring points of water levels and for brine sampling.
•Diamond Drilling: Used to define the geology in depth and obtain drill cores, establish fracture zones in the vertical, perform packer tests, well geophysics measurements and finally they are enabled as hydrogeological control wells for level measurement.
•Rotary Drilling: Used to carry out pile driving of hydraulic tests in depth (airlift) establishing an indicative flow value for exploration and research and also to obtain brine samples in
| | | | | |
SalardeAtacama_SEC_Report_515800.040 | December 2022 |
SRK Consulting (U.S.), Inc.
| | | | | |
SEC Technical Report Summary – Salar de Atacama | Page 61 |
depth evaluating the chemical changes of each well. In stable drilling areas, it was used to widen test wells for pumping and hydraulic evaluation of each sector.
•Dual-Rotary Drilling: Used in areas of high geological complexity where the stability of the land did not allow the use of rotary equipment. With this equipment, the expansion was carried out for production wells, isolating areas of different aquifers and different chemists to avoid salting the wells.
7.2.2Historical Drilling
The first exploration campaign was completed from 1974 to 1979 (Foote Mineral Company, 1979). Initially, 50 shallow pits were dug to below the brine level. The first two pumping wells were drilled and tested in 1975 (CL-1 and CL-2).
In June 1977, an exploration program designed to define the distribution of lithium over the entire salar was undertaken. The drilling program can be summarized as follows:
•A total of 32 exploration holes about 2 inches in diameter with depths ranging from 2.6 to 4.6 m
•Four 6-inch exploration holes from 25 m to 185 m depth (CL-3, CL-4, CL-5, and CL-8)
•Four 12-inch diameter wells from 20 to 30 m depth (CL-6, CL-7, CL-9 and CL-10)
Finally, in 1979, 15 6-inch exploration wells were drilled in Chepica Peninsula area (CL-11 to CL-20) and in the south of the southwestern arm of the salar (S1-S5) (Figure 7-4). Upon completion of the drilling program, all the producing wells were subjected to pumping tests.
Few data regarding the drilling campaigns from 1980 to 2016 was available from Rockwood. However, Albemarle informed them that at least 27 wells and 20 piezometers were drilled from 2013 to 2016, no further details were obtained.
The geological information obtained in the historical campaign were not used directly for the resource and reserve model. Drilling campaigns in 2017 to 2019 have significant more coverage of the salar and this data was used for geological log interpretation.
| | | | | |
SalardeAtacama_SEC_Report_515800.040 | December 2022 |
SRK Consulting (U.S.), Inc.
| | | | | |
SEC Technical Report Summary – Salar de Atacama | Page 62 |
Source: SRK 2021 (modified from Foote Mineral Company, 1979)
Figure 7-4: Map of Location of Wells Drilled During 1974 to 1979 Campaigns
2017 and 2018-2019 Drilling Campaigns
Two drilling campaigns were carried out in order to obtain geological and hydrogeological information in the Albemarle mining concession. The following are the campaigns completed:
•The 2017 campaign started in January 2017 and ended in September 2017. This campaign was conducted by Geosud.
•The 2018 to 2019 campaign started in April 2018 and ended in February 2019. This campaign was conducted by Geotec.
Table 7-2 shows the number of wells along with meters drilled by each method for the 2017 and 2019 drilling campaigns.
Table 7-2: 2017 through 2019 Drilling Types and Meters
| | | | | | | | | | | | | | |
| Type of System | Number of Wells (2017) | Number of Meters Drilled (2017) | Number of Wells (2019) | Number of Meters Drilled (2019) |
| Core Drilling | 21 | 3,970.5 | 11 | 1,511 |
| Rotary Drilling | 9 | 1,148 | 15 | 2,638.15 |
| Pumping Test | - | - | 10 | 927 |
Source: GWI, 2019
| | | | | |
SalardeAtacama_SEC_Report_515800.040 | December 2022 |
SRK Consulting (U.S.), Inc.
| | | | | |
SEC Technical Report Summary – Salar de Atacama | Page 63 |
Between 2017 and 2019, two specific drilling campaigns were carried out in order to obtain data on the geology of the terrain and its hydraulic properties in order to improve the existing hydro-stratigraphic model that was used in the Environmental Assessment at the time, which gave rise to the RCA N°021/2016 agreement with the Chilean government .
The drill holes are mainly located in the Albemarle mining concession (Figure 7-5) but some are located in the southeast part of the salar, in the Marginal Zone where the Peine and La Punta Brava lagoon systems are located. In this area, even though it is outside the mining concession, it has been necessary to update the hydrostratigraphic model so that information is consistent with that existing in the Nucleus.
Source: GWI, 2019
Figure 7-5: Location Map of Reverse Circulation and Core Drilling Considered to Update the Hydrostratigraphic Model
7.2.3Drilling Results and Interpretation
The drilling supporting the MRE has been conducted by several contractors, that in SRK’s opinion, utilized industry standard techniques and procedures. The database used for this technical report includes 186 holes drilled directly on the Property, 82 exploration holes and 104 production wells. Drillhole collar locations, downhole surveys, geological logs, and assays have been verified and
| | | | | |
SalardeAtacama_SEC_Report_515800.040 | December 2022 |
SRK Consulting (U.S.), Inc.
| | | | | |
SEC Technical Report Summary – Salar de Atacama | Page 64 |
used to build a 3D geological model and in grade interpolations. Geologic interpretation is based on structure, lithology, and alteration as logged in the drillholes.
In SRK’s opinion, the drilling operations were conducted by professional contractors using industry standard practices to achieve representativity with the sample data. SRK is not aware of any material factors that would affect the accuracy and reliability of the results from drilling and associated sampling and recovery. Therefore, in SRK’s opinion, the drilling is sufficient to support an MRE.
7.3Hydrogeology
Hydraulic tests have been conducted since the very beginning of the Salar de Atacama exploration campaigns. Pumping tests started in the well CL-1 in 1975. However, not all the hydraulic tests have been adequately recorded in terms of methodology and interpretations. The 2016, 2018 and 2019 field test campaigns were conducted in old and new production wells to have a better estimate of the hydraulic properties of the aquifers within Albemarle property.
7.3.12016 Campaign
In the 2016 campaign, 12 brine production wells were installed in A1 (CL-70, CL-71, CL-72, CL-73, CL-74, CL-75, CL-76, CL-77, CL- 78, CL-79, CL-80 and CL-81) along with six shallow observation wells distributed throughout the same area (CLO-73.1, CLO-74.1, CLO-75.1 and CLO-76.1), all of them drilled to a depth of 30 m and two 101 m deep observation wells (PE-01 and PE-02).
Pumping tests were carried out in the 12 production wells and Lefranc-type permeability tests were conducted every 10 m in the two deep observation wells (PE-01 and PE-02).
The 2016 drilling campaign report (Aquist, 2016) presents the hydraulic parameters obtained from the interpretation of the aforementioned hydraulic tests, as well as a compilation of background information from previous campaigns. Figure 7-6 and Figure 7-7 show the locations of the production and observation wells, respectively.
| | | | | |
SalardeAtacama_SEC_Report_515800.040 | December 2022 |
SRK Consulting (U.S.), Inc.
| | | | | |
SEC Technical Report Summary – Salar de Atacama | Page 65 |
Source: Aquist, 2016
Figure 7-6: Location of the Production Wells Drilled, 2013 Through 2016 Campaigns
| | | | | |
SalardeAtacama_SEC_Report_515800.040 | December 2022 |
SRK Consulting (U.S.), Inc.
| | | | | |
SEC Technical Report Summary – Salar de Atacama | Page 66 |
Source: Aquist, 2016
Figure 7-7: Location of Observation Wells or Piezometers Drilled in the 2013 through 2016 Campaigns
| | | | | |
SalardeAtacama_SEC_Report_515800.040 | December 2022 |
SRK Consulting (U.S.), Inc.
| | | | | |
SEC Technical Report Summary – Salar de Atacama | Page 67 |
7.3.22018 - 2019 Testing Campaign
Between October 2018 and June 2019, long-term pumping tests were carried out in 10 deep wells (deeper than 50 m) that had been drilled in 2008 and distributed in the A1, A2, and A3 claim areas: eight tests were carried out in the Chépica Oeste sector of A1, one test north of A2 and one south of A3, near the Salar de Atacama Marginal Zone (Figure 7-8).
The main objectives of the long-term pumping tests were the following:
•Evaluate if there is a differentiated deep aquifer and if it is connected to the surface aquifer
•Evaluate the type of aquifer and characterize the hydraulic parameters of the deep aquifer
A shallow well that is up to 20 m deep and a deep well with characteristics similar to the pumping well, both at a distance of 10 to 30 m from the pumping well, were drilled on the same platform of the pumping well. These were used as observation wells during the pumping tests. The shallow well was used to determine whether the pumping in the deep aquifer produces any effect in the upper part of the aquifer and the deep well was used to calculate hydraulic parameters in the lower part of the aquifer.
Source: GWI, 2019
Figure 7-8: Location Map of the Long-Term Pumping Tests: Deep Pumping Wells
| | | | | |
SalardeAtacama_SEC_Report_515800.040 | December 2022 |
SRK Consulting (U.S.), Inc.
| | | | | |
SEC Technical Report Summary – Salar de Atacama | Page 68 |
Pumping Tests Design
Up to three pumping tests were carried out in each pumping well: a first trial of trial of one-hour duration, a second of staggered flow between three hours and four hours in duration and a third test at constant flow for seven days. Where a flow rate greater than 5 L/s could not be extracted, only trial and error and constant flow tests were conducted. Where a flow rate larger than 5 L/s could be maintained, the three tests were carried out. After each test, recovery was monitored.
During the constant flow pumping tests, four brine samples were collected to determine if there is a chemical evolution during the duration of pumping.
7.3.3Packer Testing Campaign
Albemarle requested that Suez Medio Ambiente Chile SA and Solexperts SA carry out an exploration project using a system of inflatable shutters (packers) in wells in Salar de Atacama (Suez, 2019).
The tests were carried out in seven wells distributed along areas A1, A2 and A3 in 2018 (Figure 7-9).
Source: Suez, 2019
Figure 7-9: Map of the Location of the Wells Tested by the Double Packer System (DPS)
This type of hydraulic test allows for obtaining hydraulic parameters at specific depth intervals, by means of two packers that individualize the section to be tested from the rest of the vertical well column. In this way, the permeability (K) and transmissivity (T) of a given geological formation can be characterized and/or representative brine samples can be extracted from specific depths of the aquifer.
| | | | | |
SalardeAtacama_SEC_Report_515800.040 | December 2022 |
SRK Consulting (U.S.), Inc.
| | | | | |
SEC Technical Report Summary – Salar de Atacama | Page 69 |
The execution of the DPS tests was carried out by the company Suez Medio Ambiente Chile SA and Solexperts SA in two campaigns: July 2018 and October-November 2018.
The hydraulic parameters from the packer tests were obtained using the AquiferTest software (Waterloo Hydrogeologic, 2016).
Each of the companies that acquired the exploration data generated a report describing the details of the work carried out, the methods used for processing the data, and the conclusions.
The data were reviewed by the Albemarle hydrogeology team and subsequently provided to SRK.
7.3.4Pumping Test Re-Analysis by SRK in 2020
The long-term constant rate pumping tests were initially analyzed to evaluate the aquifer properties specified in the objectives above, but test results were deemed inadequate due to the analysis assumptions and the aquifer conditions provided. The tests were then re-analyzed by SRK in the summer of 2020 using the analytical software AQTESOLV™ (HydroSOLVE, 2008).
Results varied by analysis since each method makes different assumptions and is subject to interpretation. Some challenges were encountered when analyzing the pumping tests and resulted in a lower level of confidence of the estimated hydraulic parameters. For example, discrete hydraulic parameters from the upper observational wells could not be calculated due to the nature of the analysis methods and the largely heterogeneous aquifer conditions. Instead, only general conditions could be implied, such as the propensity for a vertical hydraulic connection between two aquifers separated by a semi-confining unit.
A conceptual hydrogeologic setting of the test sites were developed with the analysis and diagnosis of the data provided. These include the following assumptions or characteristics of the aquifers:
•Most tests probably took place in partially confined conditions.
•Derivative analysis indicates possible leaky, locally confining aquitards and/or constant head boundary conditions (facies changes, cordillera) in some cases.
•Aquifer was not stressed long enough to transition to delayed yield.
•Leaky confined conditions observe storage influence from connected systems, inflecting storage parameters. Reliable Sy values from 4.9% to 13.0%.
•Leaky confined systems do calculate vertical hydraulic conductivity of the aquitard (K’), but it is often unconfirmed by upper well response.
•Deep aquifer shows small variation in the transmissivity values calculated by Albemarle in 2019.
•Reliable calculated hydraulic conductivity values range from 1.1 to 4.6 meters per day (m/d) in sequences of gravel, ignimbrite, and sands; average 0.26 m/d in sequences of gypsum and ash; and range from 2.9 to 3.4 m/d in layers of ash, evaporites, and gypsum.
7.3.5Data Summary
The hydrogeological data described in the previous chapters are summarized in Table 7-3, as measured values within Albemarle property.
| | | | | |
SalardeAtacama_SEC_Report_515800.040 | December 2022 |
SRK Consulting (U.S.), Inc.
| | | | | |
SEC Technical Report Summary – Salar de Atacama | Page 70 |
Table 7-3: Summary of Measured Hydraulic Parameters within the Albemarle Property
| | | | | | | | | | | | | | | | | | | | | | | | | | | | | |
| Hydrogeologic Unit | Hydraulic Conductivity (K) in m/d | Specific Yield (Sy) |
| # | Average | Maximum | Minimum | GeoMean | # | Average | Maximum | Minimum |
| Upper Halite and Others | 18 | 56.9 | 380 | 0.30 | 16.6 | 9 | 1.1E-01 | 2.0E-01 | 1.0E-02 |
| Upper Halite | 55 | 324 | 5633 | 2.8E-05 | 0.83 | 6 | 1.7E-01 | 5.5E-01 | 2.9E-02 |
| Lower Halite | 4 | 4.9E-03 | 9.2E-03 | 5.9E-05 | 1.9E-03 | 0 | - | - | - |
| Upper Clastic | 9 | 54 | 188 | 0.37 | 7.4 | 5 | 1.0E-01 | 1.0E-01 | 1.5E-03 |
| Lower Clastic | 1 | 4.6 | 4.6 | 4.6 | 4.6 | 1 | 5.0E-01 | 5.0E-01 | 5.0E-01 |
| Volcanic/Gypsum/Clastic | 15 | 13.1 | 86.4 | 5.2E-03 | 1.1 | 9 | 1.3E-01 | 1.3E-01 | 3.7E-03 |
Source: SRK 2021
Additional information on hydraulic properties outside of the Albemarle property is available from the governmental agency CORFO (SGA, 2015 and Amphos21, 2018) and the SQM environmental report (SQM, 2020). This data was used as a reference to construct the dynamic groundwater model as described in Section 12. Table 7-4 shows a summary of the measured hydraulic properties outside of the Albemarle property.
Table 7-4: Summary of Hydraulic Properties Outside of the Albemarle Property
| | | | | | | | | | | | | | | | | | | | | | | | | | | | | |
| Hydraulic Conductivity (K) in m/d | Specific Yield (Sy) |
| Hydrogeologic Unit | # | Average | Maximum | Minimum | GeoMean | # | Average | Maximum | Minimum |
| Upper Halite and Others | 10 | 14.2 | 111 | 6.0E-03 | 0.9 | 2 | 6.6E-02 | 9.1E-02 | 4.0E-02 |
| Upper Halite and Others (Regional) | 54 | 11 | 200 | 9.0E-03 | 1.55 | 4 | 1.1E-01 | 3.4E-01 | 4.0E-03 |
| Upper Halite | 85 | 23.7 | 500 | 5.0E-03 | 1.07 | 12 | 1.0E-01 | 2.4E-01 | 1.4E-02 |
| Upper Halite (Regional) | 400 | 168 | 6000 | 6.0E-04 | 3.59 | 43 | 8.7E-02 | 5.5E-01 | 6.4E-03 |
| Lower Halite | 4 | 0.23 | 0.7 | 3.0E-02 | 0.11 | 1 | 3.2E-01 | 3.2E-01 | 3.2E-01 |
| Lower Halite (Regional) | 24 | 10.9 | 111 | 3.2E-03 | 1.96 | 1 | 4.1E-01 | 4.1E-01 | 4.1E-01 |
| Upper Clastic | 1 | 5 | 5 | 5 | 5 | 0 | - | - | - |
| Lower Clastic | 3 | 4.3 | 8 | 0.90 | 3.07 | 0 | - | - | - |
| Volcanic/Gypsum/Clastic | 7 | 0.75 | 4 | 2.0E-02 | 0.23 | 4 | 2.9E-01 | 5.6E-01 | 9.8E-03 |
| Volcanic/Gypsum/Clastic (Regional) | 32 | 0.49 | 5.18 | 4.0E-03 | 0.15 | 17 | 1.7E-01 | 5.2E-01 | 2.6E-03 |
| Ignimbrite | 6 | 25.6 | 71.9 | 0.32 | 5.92 | 0 | - | - | - |
| Sediment East | 17 | 15.1 | 30 | 1 | 11.68 | 3 | 3.2E-03 | 6.0E-03 | 1.4E-03 |
| Sediment West | 3 | 0.36 | 0.75 | 2.1E-02 | 0.17 | 0 | - | - | - |
| Transition | 51 | 125 | 3000 | 9.9E-04 | 3.10 | 0 | - | - | - |
Source: SRK 2021
7.4Brine Sampling
In the early stages of drilling campaign brine samples have been collected from trenches, monitoring wells and pumping wells drilled from 1974 to 1979 (section 7.2.2). However, no further details were available for SRK to review.
Historical samples have been collected from production and monitoring wells and analyzed in the on-site salar laboratory (Albemarle). The samples were collected systematically on a monthly basis
| | | | | |
SalardeAtacama_SEC_Report_515800.040 | December 2022 |
SRK Consulting (U.S.), Inc.
| | | | | |
SEC Technical Report Summary – Salar de Atacama | Page 71 |
since January 1999. The hydrochemistry Albemarle database, used in the groundwater model to support the reserve estimate, has records until July 2019.
Albemarle also provided a secondary hydrochemistry database with records from January 1999 to August 2020; it has similar values with the database mentioned above. Albemarle do not use these records for any evaluation or future planning, and SRK used this alternative database for comparison purposes only. Figure 7-10 and Figure 7-11 show the distribution of the sampling point and the lithium concentration recorded from 1999 to 2019.
Source: SRK 2021
Figure 7-10: Historical Sampling Points Location (1999 -2019)
Source: SRK 2021
Figure 7-11: Measured Lithium Concentration from Historical Database (1999 - 2019)
| | | | | |
SalardeAtacama_SEC_Report_515800.040 | December 2022 |
SRK Consulting (U.S.), Inc.
| | | | | |
SEC Technical Report Summary – Salar de Atacama | Page 72 |
In years 2018 and 2019, 77 samples were collected: 12 samples from exploration wells using a packer, 32 samples during long-term pumping tests, seven samples in short-term pumping tests and 26 samples from the production wells, extracted at 48 different points. This sampling campaign was designed to support the resource model estimate and is described in detail in Section 8.
| | | | | |
SalardeAtacama_SEC_Report_515800.040 | December 2022 |
SRK Consulting (U.S.), Inc.
| | | | | |
SEC Technical Report Summary – Salar de Atacama | Page 73 |
8Sample Preparation, Analysis, and Security
Samples of the host rocks and the brines themselves have been collected and analyzed from the active production wells as part of operations at Atacama since 1999. Additionally, during the exploration campaign carried out between 2018 and 2019, a total of 77 brine samples were extracted at 48 different points. Samples from existing production wells, pumping tests, and from packer tests were sent to the different laboratories as outlined below as part of the Quality Assurance/Quality Control (QA/QC) process.
Only the samples from 2018 to 2019 drilling campaign were considered for the resource estimate (as they are reflective of current salar conditions) and analyses for these samples were conducted by Albemarle’s internal laboratory in La Negra. Historical samples measured since 1999 were used for development and calibration of the numerical groundwater model to support the reserve estimate.
8.1Sampling Events
8.1.12018 and 2019 Campaign
Considering the brine is a dynamic resource, the samples to support the resource estimate need to be collected in a recent time period. The 2018 to 2019 sampling campaign was developed with that purpose in mind.
The 77 samples obtained during the 2018 to 2019 campaign have been collected from 12 exploration wells using a packer, 32 during long-term pumping test, 7 in short-term pumping tests and 26 from the production wells, extracted at 48 different points (Table 8-1). Details on each of the different sampling rounds and how each dataset were used in the resource and reserve estimation process are described below.
Packer Sampling
The samples extracted with the double packer system were obtained after pumping the tested interval at a time equal to at least three times the volume of brine storage in the well plus the existing volume in the pipes that carry the brine to the surface. In this way, the extracted sample is representative of the conditions of the brine entering the well and not of the brine previously stored in it, which may have its origin in other layers of the aquifer.
Therefore, the duration of each test is determined as the time necessary for the volume of brine contained in the tested interval (plus accumulated water column in the PVC pipes) to be renewed ideally more than three times. This has not been possible in all cases due to the low flow that some intervals present. In some tests, the evolution of the physical-chemical parameters of the brine has been recorded during the pumping test with a HANNA HI 98194 multiparameter through the use of a flow cell. The flow cell makes it possible to measure parameters before the brine comes into contact with the atmosphere. Multi-parameter gear was only available during the first DPS field campaign.
Sampling from Pumping Test and Production Wells
The sampling of the production wells has been carried out in different campaigns, between the months of December 2018 and April 2019. A brine sample has been extracted from 27 production wells distributed throughout claim areas A1 and A2, where 23 and 4 wells have been sampled, respectively (Table 8-1).
| | | | | |
SalardeAtacama_SEC_Report_515800.040 | December 2022 |
SRK Consulting (U.S.), Inc.
| | | | | |
SEC Technical Report Summary – Salar de Atacama | Page 74 |
Table 8-1: List and Coordinates of Production Wells Sampled for the Study
| | | | | | | | |
| Well | X_UTM WGS84 | Y_UTM WGS84 |
| CL-120 | 568791 | 7388180 |
| CL-85 | 568447 | 7385037 |
| CL-92 | 567679 | 7385928 |
| CL-41 | 556151 | 7381491 |
| CL-59 | 555731 | 7380459 |
| CL-98 | 559973 | 7386200 |
| CL-99 | 568048 | 7384939 |
| CL-78 | 556046 | 7380948 |
| CL-80 | 557315 | 7382635 |
| CL-91 | 567715 | 7382838 |
| CL-90 | 567488 | 7383686 |
| CL-1 | 573041 | 7384392 |
| CL-115 | 566959 | 7386256 |
| CL-15 | 563329 | 7387453 |
| CL-19 | 563132 | 7386157 |
| CL-20 | 564190 | 7387063 |
| CL-22 | 566843 | 7386203 |
| CL-23 | 571141 | 7384543 |
| CL-24 | 570070 | 7382264 |
| CL-27 | 567535 | 7387586 |
| CL-37 | 565679 | 7386693 |
| CL-45 | 571689 | 7387482 |
| CL-60 | 557531 | 7382960 |
| CL-65 | 558805 | 7383832 |
| CL-79 | 556639 | 7381750 |
| CL-9 | 564577 | 7386801 |
| CL-97 | 558413 | 7383460 |
Source: GWI, 2019
The brine samples have been taken from the pipeline of each of the production wells or from a sampling valve on the pumping well pipe during the pumping test (Figure 8-1). The bottles have been rinsed three times with the brine from the well and then completely filled without leaving air bubbles, to avoid precipitation processes and physical-chemical changes within the container. In addition, during the sampling, physicochemical parameters of the brine (specifically pH, EC, TDS, and T) have been measured using the Hanna HI98196, HI98192, and HI98128 multiparameter meter. A multiparameter data verification procedure has been followed and the meter was calibrated, if necessary.
The bottles were labeled with the name of the well, the type of well (e.g., “Production Well") and the date and time of sampling. The sampling information was recorded in project records.
From each well, five 1-liter bottles were collected. During the transport and storage of the samples, exposure to environmental conditions was prevented to avoid sudden changes in temperature that might alter the chemical composition of the sample. It was not necessary to use preservatives.
Notably, the extraction flow rate and the depth of the brine level in Albemarle's production wells are monitored online by a telemetry system.
| | | | | |
SalardeAtacama_SEC_Report_515800.040 | December 2022 |
SRK Consulting (U.S.), Inc.
| | | | | |
SEC Technical Report Summary – Salar de Atacama | Page 75 |
Source: GWI, 2019
Figure 8-1: Production Wells Sampled
8.1.2Historical Sampling
Lithium concentrations from historical sampling were available for 86 monitoring locations, with a total number of 5,282 samples from 1999 to 2018 within Albemarle properties and transition zone to the southeast.
Since the beginning of the extraction of brine at the Salar Plant, samples from the pumping wells have been periodically analyzed. Since 1999, brine chemistry data has been collected on a monthly basis.
These samplings are carried out in order to control the chemical evolution of the brine that will be pumped to the evaporation ponds. The sampling method is by means of plastic bottles of 1 L or 0.5 L capacity, one sample is taken per month from each well. Until 2018, this sampling was carried out at the outlet of each HDPE line, when the brine was discharged into the pond. During 2018, wastewater valves began to be installed after the flowmeter, which reduces risks and improves the representativeness of the sample, as they are taken right at the wellhead.
The analyses are carried out in the Salar Plant laboratory and the following determinations are usually made density, Li+(%), SO4-2 (%), Ca+2(%), Mg+2(%), K+(%), Na+(%), Cl-(%), B+(%), Temperature (°C) and pH.
Figure 8-2 shows the box-and-whisker diagram of the historical variability (since 1999) of lithium concentrations, in the samplings from production wells and expressed as an annual average per well.
| | | | | |
SalardeAtacama_SEC_Report_515800.040 | December 2022 |
SRK Consulting (U.S.), Inc.
| | | | | |
SEC Technical Report Summary – Salar de Atacama | Page 76 |
Note: Each data point (circle) represents an average concentration at a specific location at the year shown. “x” symbols connected by a line represent the multi-well average of that year.
Source: SRK 2021
Figure 8-2: Historical Lithium (%) Variability (1999-2019)
As can be seen in Figure 8-2, the minimum values, established by the lower whisker, do not materially change with time, so it is interpreted by SRK that the brine has a minimum lithium concentration that remains unchanged. It can also be seen that the median in the last 10 years remains relatively steady.
The historical brine samples collected at pumping wells were used for a qualitative indication of brine grade persistence over the prolonged pumping periods. They were also used quantitatively in developing the grade interpolations as input to the numerical groundwater model. Historical brine samples were not used for developing the resource estimate.
8.2Sample Preparation, Assaying, and Analytical Procedures
8.2.1Historical Sampling
Historical samples from the production wells and observation points have been collected on a monthly basis by the operators of the Salar de Atacama Plant Hydrogeology Department. The samples were analyzed in the plant laboratory located on site. No duplicates were collected in this process.
SRK notes that while comprehensive QA/QC or independent verification of sampling has not been a continuous part of the plant lab, Albemarle operations in Salar de Atacama have been producing lithium from brines for 24 plus years. Production has been consistent with reserve planning from the brine reservoir.
8.2.22018-2019 Campaign
The samples obtained from the 2018 to 2019 campaign were collected during pumping tests at discrete times of 30 min, 24 hr, 72 hr and 7 days; from production wells; and from exploration wells using packers.
| | | | | |
SalardeAtacama_SEC_Report_515800.040 | December 2022 |
SRK Consulting (U.S.), Inc.
| | | | | |
SEC Technical Report Summary – Salar de Atacama | Page 77 |
The brine samples were collected as follows:
•Brine was pumped from inside the well up to three times its volume or the interval to be sampled, thus ensuring that the brine being sampled represented what was flowing into the well screen from the aquifer.
•Each bottle (1 liter [L]) was conditioned with the freshly extracted brine.
•Five increments of 1 L each were extracted directly from the pump flow or from the pipe into the bottles. These were stored and duly labeled in five bottles according to the previously defined chain of custody. The destination of each bottle was:
◦Albemarle Laboratory: La Negra - Antofagasta, Chile - Original Sample A - 100%
◦K-UTEC Laboratory: Germany. Sample B - 100%
◦Alex Stewart Laboratory: Mendoza, Argentina. Control Sample C - 30%
◦CCHEN Laboratory: Control Sample D - 30%
◦Albemarle Laboratory: La Negra - Antofagasta, Chile. Duplícate Sample - 100%
Each bottle was labeled with the following information:
•Sample number
•Sample interval
•Well name
•Depth of sampling
•Type of sampling (pumping tests, production wells or packer)
•Name and company of the sampler
•Date of sampling
The sampling control information was entered into an Excel data sheet for further processing.
All samples were stored in equivalent containers duly sealed in order to protect against contamination during transportation.
The chemical analyzes of Li, Mg, K, Ca, Na, B, and sulfate were carried out by means of ICP, optical, with standards, procedures and protocols consistent between the involved laboratories. Sulfate and chloride were determined with different techniques. Table 8-2 summarizes the methods used for each of the elements analyzed. Figure 8-3 shows the sampling points used.
| | | | | |
SalardeAtacama_SEC_Report_515800.040 | December 2022 |
SRK Consulting (U.S.), Inc.
| | | | | |
SEC Technical Report Summary – Salar de Atacama | Page 78 |
Table 8-2: Analytical Methods by Laboratory
| | | | | | | | | | | |
| Parameter | Investigation Lab Albemarle La Negra | K-Utec Lab Germany | Alex Stewart Lab Argentina |
| B | ICP | ICP | ICP |
SO4 | ICP | Gravimetry | Gravimetry |
| | | (ICP requested) | (ICP requested) |
| Mg | ICP | ICP | ICP |
| Li | ICP | ICP | ICP |
| K | ICP | ICP | ICP |
| Ca | ICP | ICP | ICP |
| Na | ICP | ICP | ICP |
| Density | Gravimetry | No information | Pycnometry |
| Chloride | Titration of precipitation with a silver nitrate solution using potassium dichromate for its detection. | Automatic potentiometric titration with a solution of silver nitrate in solution. | Mohr's Method in Solutions > 5% TDS and Potentiometry (Ion Selective Electrode) in solutions <5% TDS. |
Source: GWI, 2019
Source: GWI, 2019
Figure 8-3: Sampling Points
No sample preparation was necessary, as care was taken to obtain samples of the brine in their native state. The samples were taken by the operators of the salar hydrogeology group, while the water resources area sent them to the corresponding laboratories.
| | | | | |
SalardeAtacama_SEC_Report_515800.040 | December 2022 |
SRK Consulting (U.S.), Inc.
| | | | | |
SEC Technical Report Summary – Salar de Atacama | Page 79 |
During the exploration campaign carried out between 2018 and 2019, a total of 77 samples were extracted from 48 different points, with four sample bottles each. Duplicates of the 77 samples were sent to the La Negra laboratories in Antofagasta and K-Utec in Germany, Alex Stewart laboratory (Mendoza, Argentina), and the CCHEN laboratory.
The analyses carried out consisted of determining the concentration of sulfate, chloride, boron, barium, calcium, iron, potassium, lithium, magnesium, manganese, sodium, strontium and density, according to the methods indicated in the certificates of each laboratory.
Table 8-3 shows the Well ID, type of test in which the samples were drawn, and the laboratories to which they were sent (“All”: includes Alex Stewart and CCHEN). It should be noted that the fourth column indicates the depth to which the sample was extracted or the time, depending on whether it was extracted during a packer test or a pump test, respectively.
A chain of custody was established, which incorporated not only sampling, but also storage and shipment of samples to each laboratory. The samples were labeled immediately after being taken from the wells, then they were stored at the Albemarle storage in Salar Plant. Later, they were transferred in coolers and sent by DHL to the respective laboratories.
Table 8-3: List of Samples Used for this Study
| | | | | | | | | | | | | | | | | |
| Sample No. | Well ID | Type | Depth (m) - Test Time | Label | Laboratory |
| 1 | A218 | Sampling during packer testing | 28-43 | A-218A | All |
| 2 | 86-101 | A-218B | All |
| 3 | A228 | Pumping test | 30 min | A228-T1 | LN & K Utec |
| 4 | 24 h | A228-T2 | All |
| 5 | 72 h | A228-T3 | LN & K Utec |
| 6 | 7 d | A228-T4 | LN & K Utec |
| 7 | A230 | Sampling during packer testing | 129-146 | A-230A | LN & K Utec |
| 8 | A316 | Sampling during packer testing | 25-45 | A-316A | LN & K Utec |
| 9 | 70-85 | A-316B | LN & K Utec |
| 10 | 90-105 | A-316C | LN & K Utec |
| 11 | A317 | Sampling during packer testing | 35-50 | A-317A | LN & K Utec |
| 12 | A319 | Sampling during packer testing | 28-43 | A-319A | LN & K Utec |
| 13 | A320 | Pumping test | 30 min | A320-T1 | LN & K Utec |
| 14 | 24 h | A320-T2 | LN & K Utec |
| 15 | 72 h | A320-T3 | LN & K Utec |
| 16 | 7 d | A320-T4 | LN & K Utec |
| 17 | CL-1 | Production well | - | CL-1 | LN & K Utec |
| 18 | CL-15 | Production well | - | CL-15 | LN & K Utec |
| 19 | CL-19 | Production well | - | CL-19 | LN & K Utec |
| | | | | |
SalardeAtacama_SEC_Report_515800.040 | December 2022 |
SRK Consulting (U.S.), Inc.
| | | | | |
SEC Technical Report Summary – Salar de Atacama | Page 80 |
| | | | | | | | | | | | | | | | | |
| 20 | CL-20 | Production well | - | CL-20 | LN & K Utec |
| 21 | CL-22 | Production well | - | CL-22 | LN & K Utec |
| 22 | CL-23 | Production well | - | CL-23 | LN & K Utec |
| 23 | CL-24 | Production well | - | CL-24 | LN & K Utec |
| 24 | CL-27 | Production well | - | CL-27 | LN & K Utec |
| 25 | CL-37 | Production well | - | CL-37 | LN & K Utec |
| 26 | CL-41 | Production well | - | CL-41 | LN & K Utec |
| 27 | CL-45 | Production well | - | CL-45 | LN & K Utec |
| 28 | CL-59 | Production well | - | CL-59 | LN & K Utec |
| 29 | CL-60 | Production well | - | CL-60 | LN & K Utec |
| 30 | CL-65 | Production well | - | CL-65 | LN & K Utec |
| 31 | CL-78 | Production well | - | CL-78 | LN & K Utec |
| 32 | CL-79 | Production well | - | CL-79 | LN & K Utec |
| 33 | CL-80 | Production well | - | CL-80 | LN & K Utec |
| 34 | CL-84 | Short Pumping test | 30 min | CL84-T1 | LN & K Utec |
| 35 | 24 h | CL84-T2 | LN & K Utec |
| 36 | 72 h | CL84-T3 | LN & K Utec |
| 37 | 7 d | CL84-T4 | LN & K Utec |
| 38 | CL-85 | Production well | - | CL-85 | LN & K Utec |
| 39 | CL-9 | Production well | - | CL-9 | LN & K Utec |
| 40 | CL-90 | Production well | - | CL-90 | LN & K Utec |
| 41 | CL-91 | Production well | - | CL-91 | LN & K Utec |
| 42 | CL-92 | Production well | - | CL-92 | LN & K Utec |
| 43 | CL-97 | Pumping test | 30 min | CL97-T1 | LN & K Utec |
| 44 | 24 h | CL97-T2 | LN & K Utec |
| 45 | 72 h | CL97-T3 | LN & K Utec |
| 46 | 7 d | CL97-T4 | LN & K Utec |
| 47 | CL-98 | Production well | - | CL-98 | LN & K Utec |
| 48 | CL-99 | Production well | - | CL-99 | LN & K Utec |
| | | | | |
SalardeAtacama_SEC_Report_515800.040 | December 2022 |
SRK Consulting (U.S.), Inc.
| | | | | |
SEC Technical Report Summary – Salar de Atacama | Page 81 |
| | | | | | | | | | | | | | | | | |
| 49 | CL-100 | Pumping test | 30 min | CL100-T1 | LN & K Utec |
| 50 | 24 h | CL100-T2 | LN & K Utec |
| 51 | 72 h | CL100-T3 | LN & K Utec |
| 52 | 7 d | CL100-T4 | LN & K Utec |
| 53 | CL-101 | Pumping test | 30 min | CL101-T1 | LN & K Utec |
| 54 | 24 h | CL101-T2 | LN & K Utec |
| 55 | 72 h | CL101-T3 | LN & K Utec |
| 56 | 7 d | CL101-T4 | LN & K Utec |
| 57 | CL-104 | Pumping test | 30 min | CL104-T1 | LN & K Utec |
| 58 | 24 h | CL104-T2 | LN & K Utec |
| 59 | 72 h | CL104-T3 | LN & K Utec |
| 60 | 7 d | CL104-T4 | LN & K Utec |
| 61 | CL-105 | Short Pumping test | 30 min | CL105-T1 | LN & K Utec |
| 62 | 24 h | CL105-T2 | LN & K Utec |
| 63 | 72 h | CL105-T3 | LN & K Utec |
| 64 | CL-107 | Pumping test | 30 min | CL107-T1 | LN & K Utec |
| 65 | 24 h | CL107-T2 | LN & K Utec |
| 66 | 72 h | CL107-T3 | LN & K Utec |
| 67 | 7 d | CL107-T4 | LN & K Utec |
| 68 | CL-113PW | Pumping test | 30 min | CL113PW-T1 | LN & K Utec |
| 69 | 24 h | CL113PW-T2 | LN & K Utec |
| 70 | 72 h | CL113PW-T3 | LN & K Utec |
| 71 | 7 d | CL113PW-T4 | LN & K Utec |
| 72 | CL-115 | Production well | - | CL-115 | LN & K Utec |
| 73 | CL-120 | Production well | - | CL-120 | LN & K Utec |
| 74 | CLO-109 | Sampling during packer testing | 21-71 | CLO-109A | LN & K Utec |
| 75 | 80-107 | CLO-109B | All |
| 76 | CLO-129 | Sampling during packer testing | 71-86 | CLO-129A | All |
| 77 | 115-150 | CLO-129C | All |
Source: GWI, 2019
| | | | | |
SalardeAtacama_SEC_Report_515800.040 | December 2022 |
SRK Consulting (U.S.), Inc.
| | | | | |
SEC Technical Report Summary – Salar de Atacama | Page 82 |
8.3Quality Control/Quality Assurance Procedures
Quality Control/Quality Assurance procedures are generally employed by companies to ensure accuracy and precision of the results obtained from laboratories. Generally, this may include independent checks (duplicates) on samples by third party laboratories, blind blank/standard insertion into sample streams, duplicate sampling, and more. Albemarle has historically only engaged in independent third party laboratory checks (i.e., Control Laboratories) of sampling as described in section 8.2. For transparency, SRK decided to use results from one of the third-party labs, K-Utec, for development of resource estimate.
SRK did not receive any information regarding blank or standard samples being sent to the labs for analysis.
8.3.1Control Laboratories
The procedure to control and ensure the quality of the sampling and chemical analysis performed on the samples in this study has been carried out by extracting five samples from observation points. These samples were sent to La Negra laboratories in Antofagasta, K-Utec laboratory in Germany, and Alex Stewart laboratory in Argentina.
Correlation of duplicate analytical values for the same samples from independent laboratories can identify relative biases between these laboratories. In this case, the objective is not to demonstrate which laboratory is “correct” as all are assumed to be high quality laboratories using consistent analytical procedures and methods. The comparison makes it possible to review both the inherent local variability of the sampling, inconsistencies in preparation of the samples, or biases from the laboratories themselves.
8.3.2Correlation Between Lithium Grades of Different Invariant Laboratories of the Sampling Type
Comparison of the results between Albemarle’s La Negra laboratory and K-Utec’s laboratory in Germany indicates an acceptable correlation, in SRK’s opinion, represented by a value of 0.914 (through Figure 8-6). The K-Utec laboratory generally results in a lower lithium concentration compared to the La Negra laboratory for grades greater than 0.3%. On the other hand, values below 0.3% generally are higher at K-UTEC (Figure 8-4).
| | | | | |
SalardeAtacama_SEC_Report_515800.040 | December 2022 |
SRK Consulting (U.S.), Inc.
| | | | | |
SEC Technical Report Summary – Salar de Atacama | Page 83 |
Source: Albemarle, 2019
Figure 8-4: Scatter Diagram Comparing the Results Obtained for Lithium Between Albemarle's In-House Laboratory and K-Utec's Laboratory
The correlation between the Alex Stewart and La Negra labs is also high (0.968), however, a consistent bias can be observed between both labs. Alex Stewart labs consistently report higher lithium concentrations versus Albemarle in the samples (Figure 8-5).
| | | | | |
SalardeAtacama_SEC_Report_515800.040 | December 2022 |
SRK Consulting (U.S.), Inc.
| | | | | |
SEC Technical Report Summary – Salar de Atacama | Page 84 |
Source: Albemarle, 2019
Figure 8-5: Scatter Diagram Comparing the Results Obtained for Lithium Between Albemarle's In-House Laboratory and Alex Stewart Laboratory
A similar situation occurs in the correlation between Alex Stewart and K-Utec labs. Despite the correlation between both labs being high (0.992), Alex Stewart lab consistently returns a higher concentration than K-Utec when the values are greater than 0.15% lithium (Figure 8-6).
| | | | | |
SalardeAtacama_SEC_Report_515800.040 | December 2022 |
SRK Consulting (U.S.), Inc.
| | | | | |
SEC Technical Report Summary – Salar de Atacama | Page 85 |
Source: Albemarle, 2019
Figure 8-6: Scatter Diagram Comparing the Results Obtained for Lithium Between Alex Stewart Laboratory and K-Utec's Laboratory
8.4Opinion on Adequacy
SRK used the results from the independent K-Utec Laboratory to support the development of the resource estimate. SRK utilized historical results from the Albemarle La Negra laboratory for the numerical groundwater model to support the reserve estimate. SRK has reviewed the sample preparation, analytical, and QA/QC practices employed by consultants for the 2018 through 2019 campaign samples analyzed by the La Negra laboratory in Antofagasta (Albemarle), K-Utec in Germany, Alex Stewart laboratory (Mendoza, Argentina), and the CCHEN laboratory. SRK’s opinion follows:
| | | | | |
SalardeAtacama_SEC_Report_515800.040 | December 2022 |
SRK Consulting (U.S.), Inc.
| | | | | |
SEC Technical Report Summary – Salar de Atacama | Page 86 |
•The QA/QC program for the 2018 through 2019 campaign supports that the extraction of each sample is reproducible and auditable and it is sufficient to support a resource estimate. The correlation between the K-Utec lab and La Negra is high, however SRK acknowledges that there is potential for bias to exist. It is the QP’s opinion that uncertainty associated with this potential for bias is mitigated by the long history of brine extraction at consistent levels supporting historic lithium production.
•The historical data supporting the mineral reserve estimates at Salar de Atacama have not been fully supported by a robust QA/QC program. This potentially introduces uncertainty in the accuracy and precision of the sample data. However, in the QP’s opinion, this uncertainty is mitigated through the consistency of results from the 2018 through 2019 campaign and the historical data. In the QP’s opinion, the risk is also mitigated through the inherent confidence derived from more than 35 years of consistent feed to the processing plant producing lithium at the Salar de Atacama/La Negra.
| | | | | |
SalardeAtacama_SEC_Report_515800.040 | December 2022 |
SRK Consulting (U.S.), Inc.
| | | | | |
SEC Technical Report Summary – Salar de Atacama | Page 87 |
9Data Verification
9.1Data Verification Procedures
SRK conducted the following review and verification procedures during 2020 to support the resource and reserve estimates:
•Pumping test review and reinterpretation of the tests carried out in 2019. New results were incorporated into the hydraulic properties data base.
•Review of the original laboratory analysis certificates.
•Review and analysis of historical lithium concentration data per well. Checking the consistency of data in time, and identification of locations alternated by evaporation (trenches) or leakage from concentration ponds.
•A review and reinterpretation of the geological model developed by Dr. Boutt and Dr. Munk was conducted. SRK worked in collaboration with original authors and the Albemarle geological team (Atacama). The work included:
◦A review of the available literature and third-party studies in Salar de Atacama.
◦Interpretation of applied geophysical studies (HRS, TEM, and NMR), surface geological maps and the consistency with the 3D geological units.
◦Data review from all Albemarle concessions and environmental permit zones.
◦ A detail reinterpretation of the lithologies from boreholes in the Albemarle concession areas.
◦The available data was evaluated to provide cross-confirmation of geological and hydrostratigraphic interpretations
A 3D geological model was built in collaboration with the original authors and Albemarle personnel, including:
•A review and recalculation of the lateral recharge from the surrounding basing to the groundwater system presented in 2019 environmental model report (SGA, 2019).
•A review and adjustment of historical data, including 2019 pumping tests, of specific yield (Sy) was completed.
The consistency of the historical data was verified against the 2018 to 2019 campaign samples (K-Utec lab), described in Section 8. Figure 9-1 shows a high correlation (R2 =0.99) between the average annual values in 2019 analyzed at the on-site plant lab and the results from K-Utec laboratory.
| | | | | |
SalardeAtacama_SEC_Report_515800.040 | December 2022 |
SRK Consulting (U.S.), Inc.
| | | | | |
SEC Technical Report Summary – Salar de Atacama | Page 88 |
Source: SRK 2021
Figure 9-1: Comparison of Historical Lithium Concentrations and 2018-2019 Campaign (K-Utec)
9.2Limitations
All the data collected historically could not be independently verified. However, in the QP’s opinion, verification of the samples collected in 2018 to 2019 campaign and analyzed by independent labs provided confidence in the methods used and results of samples analyzed by the La Negra laboratory.
9.3Opinion on Data Adequacy
The brine data were compiled in a standardized database under the supervision of Albemarle personnel. All data were converted into the same units and the database was checked for discrepancies, errors, and missing data. The data received from multiple sources were cross-referenced by SRK against the Albemarle database and original laboratory certificates; Albemarle reviewed and corrected any discrepancies with respect to sample locations and depths.
| | | | | |
SalardeAtacama_SEC_Report_515800.040 | December 2022 |
SRK Consulting (U.S.), Inc.
| | | | | |
SEC Technical Report Summary – Salar de Atacama | Page 89 |
SRK visited the Salar operation and it’s on site laboratory in November 2021. SRK verified that the stated procedures are being followed. All details and data on QA/QC methodology are as described by Albemarle personnel.
Based on review of the historical database, the consistency of the values during the history of brine extraction, and the high correlation of the historical data and the results from the 2018 to 2019 campaign, in SRK’s opinion, the data used for the resource and reserve estimates is acceptable and appropriate. Historical sampling at production wellheads and at ponds supports that there has been a consistent feed to the processing plant and the lithium produced provides additional verification of the historical data used for calibration of the numerical model.
| | | | | |
SalardeAtacama_SEC_Report_515800.040 | December 2022 |
SRK Consulting (U.S.), Inc.
| | | | | |
SEC Technical Report Summary – Salar de Atacama | Page 90 |
10Mineral Processing and Metallurgical Testing
Albemarle's operations in Chile are developed in two areas, the Salar de Atacama and La Negra. The Salar de Atacama operation extracts lithium brines from deep and shallow groundwater wells. These brines are then discharged to solar evaporation ponds to concentrate the lithium brine, which is then transferred to the La Negra plant for processing. The La Negra plant refines and purifies the lithium brines, producing a technical and battery-grade lithium carbonate (and historically lithium chloride although this is not forecast for future production).
These operations have been in production for approximately 40 years and most of the data relied upon to forecast operational performance relies upon experience with historic production. However, Albemarle is proposing a modification to its flow sheet at the salar to improve lithium process yields in the evaporation ponds. Albemarle refers to this process as the SYIP. The SYIP aims to improve this process recovery through mechanical grinding and washing of by-product salts in two new plants, the Li-Carnalite Plant and Bischofite Plant and testing associated with the SYIP is discussed below.
10.1Salar Yield Improvement Program Testing
Historic process yield for lithium in the evaporation ponds at the Salar de Atacama have been around 50% (ranging from less than 40% up to the mid-50%). In 2017, Albemarle commissioned K-UTEC to evaluate opportunities to improve on this historic performance. K-UTEC proposed and evaluated six options for improvement, including performing laboratory and pilot scale testing on each. Based on this testwork, Albemarle decided to proceed with two of the six options evaluated. The two selected opportunities for improvement follow:
•Bischofite Treatment Plant: Implementation of a continuously driven washing and comminution/vat leaching operation for bischofite in order to recover the adhering brine and lithium contained in the bischofite salts.
•Li-Carnallite Treatment Plant: Implementation of a continuous Li-Carnallite decomposition by comminution and reactive step using brine.
10.1.1Bischofite Treatment Testing
Albemarle recently started to place harvested bischofite salts in drainage fields to recover entrained lithium-rich brine. While this recovers a portion of the lithium that would otherwise be lost in this stage of processing/evaporation, there is still significant brine adhered to the bischofite salts post-drainage. The intent of the bischofite treatment process is to further wash this concentrated brine from the bischofite salt using a dilute, natural brine, as well as further dissolution of lithium precipitated in these salts.
K-UTEC completed several tests related to this proposed process upgrade at their laboratory in Sondershausen, Germany. These include an evaluation of drainage performance of the bischofite salt as well as laboratory-level tests and pilot-scale tests on the washing/leaching of the bischofite using an agitated reactor. To complete these tests, Albemarle collected precipitated bischofite salts from the salar operations and transported these salts to K-UTEC’s laboratory for evaluation. From a scale perspective, the bischofite drainage test utilized 100 kilograms (kg) of bischofite salt, the pilot scale tests utilized 260 kg of bischofite salt, and the laboratory scale testing utilized 1 kg of bischofite salt. These salts come from the bischofite stockpile, but due to drainage storage before arriving to
| | | | | |
SalardeAtacama_SEC_Report_515800.040 | December 2022 |
SRK Consulting (U.S.), Inc.
| | | | | |
SEC Technical Report Summary – Salar de Atacama | Page 91 |
Sounderhausen the LiCl was lower than data collected in the field. Therefore, test work of drainage was carried out in order to emulate the conditions on site. SRK is of the opinion that the bischofite tested is generally representative of bischofite from Albemarle’s Salar de Atacama operations.
The bischofite treatment testing utilized brine from extraction well as the wash solution. This brine is characterized as calcium-rich, but no additional information on the wash solution (e.g., lithium, calcium, sulfate, magnesium concentrations) is presented. Therefore, this solution is likely representative of the brine that is sourced from CL-9. The bischofite drainage testing utilized concentrated brine between pond 4A and 3A. This solution is viewed as likely representative of the brine that would typically be entrained in the bischofite salt.
The results of the laboratory and pilot scale Bischofite washing/dissolution testing included 57% lithium recovery at the pilot scale and 79% lithium recovery at the laboratory scale. Lithium/magnesium selectivity (i.e., preference for lithium dissolution) is reported at 85% at pilot scale and 89% at laboratory scale. K-UTEC also evaluated alternatives other than the agitated reactor such as screw dissolution although these tests were inconclusive due to poor test implementation.
Notably, the pilot-scale study results include significantly lower lithium recovery in comparison to the laboratory-scale testwork. K-UTEC believes that this was due to a combination of lower performance of the centrifuge in the pilot scale work and a lower content of lithium in the bischofite salt in the pilot testwork.
The final piece of the testwork is the evaluation of drainage performance on the bischofite salt. This testwork showed a lithium content in adhered brine of around 21% by weight in comparison to around 7% of lithium by weight in the sample received for the testwork.
10.1.2Lithium-Carnallite Treatment Testing
Albemarle already harvests lithium carnallite salts and washes/leaches them. The key differentiator in the newly proposed lithium-carnallite plant will be the addition of comminution of the salts to increase the efficiency of the leaching. Unlike the bischofite washing, which utilizes a raw brine, the lithium carnallite washing utilizes recycled brine from the bischofite plant increasing the synergy of both new processes. This proposed process leaves a residual bischofite which is then proposed for processing in the proposed new bischofite plant to recover any residual lithium.
As with the bischofite testing, the lithium carnallite testing was completed at laboratory and pilot scale and also went through drainage testing. K-UTEC notes that as with the bischofite testing, it is believed that the lithium carnallite utilized in the testing was collected from disposal dumps which had been subject to washing with rainwater and the sample had limited actual lithium-carnallite (19% with predominant bischofite). Wash solution was concentrated brine sourced from the carnallite pond discharge, which should be representative of the targeted wash solution at an operational level. The pilot testing utilized 240 kg of salt, the laboratory sample sizes were around 0.4 to 0.8 kg and the drainage testing utilized 100 kg.
Results from the lithium-carnallite lab testing were similar to the bischofite recovery in that the pilot scale test reported lithium recovery of around 60% and the laboratory test reported recovery of around 76% with lithium/magnesium selectivity of 97% for both types of tests. Drainage testing suggested adhering brine of around 16% lithium versus 9% lithium on the samples received. Similar
| | | | | |
SalardeAtacama_SEC_Report_515800.040 | December 2022 |
SRK Consulting (U.S.), Inc.
| | | | | |
SEC Technical Report Summary – Salar de Atacama | Page 92 |
comments apply in that the lower yield was attributed by K-UTEC to lower centrifuge performance and different lithium content in salt.
10.1.3Salar Yield Improvement Program Test Commentary
Based on the results of the laboratory testwork, K-UTEC estimates that the implementation of the SYIP will increase lithium recovery in the salar from current levels to around 65%. Albemarle has adopted this estimate for its assumed performance with the SYIP.
In SRK’s opinion, based on the K-UTEC test data, an overall recovery in the 80% range is possible under a best-case scenario for both lithium carnallite and bischofite. However, this is ideal performance and not likely in an operating scenario and therefore a downgrade to the assumption of K-UTEC of 65% is more realistic and a reasonable assumption to use in production forecasts.
Although the improvement to 65% lithium recovery assumed by K-UTEC and Albemarle is reasonable, in SRK’s opinion, the current test data has gaps and does not provide a direct correlation to this result. Therefore, in SRK’s opinion, Albemarle would benefit from updating its test data to better define the current mass balance, current lithium losses and estimates of potential improvement for the SYIP. This will help refine the design of the SYIP and presents an opportunity to improve the performance of the operation if the maximum recovery potential can be realized.
| | | | | |
SalardeAtacama_SEC_Report_515800.040 | December 2022 |
SRK Consulting (U.S.), Inc.
| | | | | |
SEC Technical Report Summary – Salar de Atacama | Page 93 |
11Mineral Resource Estimates
The Mineral Resource estimate presented herein represents the latest resource evaluation prepared for the Project in accordance with the disclosure standards for mineral resources under §§229.1300 through 229.1305 (subpart 229.1300 of Regulation S-K). Although Albemarle produces byproducts from the Salar de Atacama, including potash, SRK has limited its resource estimate to the dominant economic product of lithium.
11.1Key Assumptions, Parameters, and Methods Used
This section describes the key assumptions, parameters, and methods used to estimate the mineral resources. The technical report summary includes mineral resource estimates, effective August 31, 2021. The geologic block model is incorporating all relevant exploration data as of June 30, 2020 and there is no additional data since that date. The resource has been depleted to August 31, 2021.
The coordinate system used on this property and for this MRE is WGS 1984 UTM Zone 19S. All coordinates and units described herein are done in meters and metric tons, unless otherwise noted. This is consistent with the coordinate systems for the project and all descriptions or measurements taken on the project. The database used for interpolation of brine characteristics has been compiled by Albemarle from analytical information generated by third party laboratory K-Utec.
The Mineral Resource stated in this report are entirely located on mineral title, surface leases, and accessible locations currently held by Albemarle as of the effective date of this report. All predictive production wells used to estimate brine reserves have been limited to within these boundaries. Detail related to the access agreements or ownership of these titles and rights are described in Section 3 of this report.
11.1.1Geological Model
To constrain and control the MRE, a geological model was required to approximate the geological features relevant to the estimation of mineral resources, to the degree possible, given the data and information generated at the current level of study. SRK developed two models (regional and local) in relation to the deposit, in collaboration with Albemarle personnel and its consultants (Dr. David Boutt and Dr. LeeAnn Munk). Figure 11-1 shows the geological model’s extents. This was done to leverage the site-based expertise and improve the overall model consistency. Geological information supporting the development of the models was incorporated from multiple sources including:
•CORFO
•SQM
•Albemarle
The geological models are comprised of multiple features which have been modeled to either be independent of each other or, in some cases, may depend on the results from another modeling process. An example of this, is the way in which a structural model may influence the results of the lithology model or the final resource boundaries.
| | | | | |
SalardeAtacama_SEC_Report_515800.040 | December 2022 |
SRK Consulting (U.S.), Inc.
| | | | | |
SEC Technical Report Summary – Salar de Atacama | Page 94 |
The combined 3D geological models were developed in Leapfrog Geo software (v6.0.2). In general, model development is based on the following
•Interpreted Geophysical Data (historic and modern)
◦TEM
◦CSAMT
◦Seismic
◦Downhole
•Drill Hole Logging
•Surface Geologic Mapping (historical and modern)
•Interpreted cross sections (historical and modern)
•Surface/downhole structural observations
•Interpreted polylines (surface and sub-surface 3D)
| | | | | |
SalardeAtacama_SEC_Report_515800.040 | December 2022 |
SRK Consulting (U.S.), Inc.
| | | | | |
SEC Technical Report Summary – Salar de Atacama | Page 95 |
Figure 11-1: Regional Geological Model Extent - Plan View
Lithology
The geological models were developed by first grouping lithology into different hydrogeologic units within Leapfrog Geo. For the regional model, groups consisted of Ignimbrite and volcanic units, Sediment (east and west), Transition, Undifferentiated, and Basement. For the local model, groups consisted of Upper Clastic, Lower Clastic, Upper Halite, Lower Halite, VGC (Volcanic/Ignimbrite, Gypsum, Clastic), and Basement. Geophysical data was digitized to refine upper halite in the eastern zone, ignimbrite, and basement profile contacts. Publicly available cross-sections prepared by SQM were used to digitize the upper surface of the VGC within the regional model. The undifferentiated
| | | | | |
SalardeAtacama_SEC_Report_515800.040 | December 2022 |
SRK Consulting (U.S.), Inc.
| | | | | |
SEC Technical Report Summary – Salar de Atacama | Page 96 |
unit was developed by making a surface constrained by the bottom of all coreholes with geologic data.
The local geological model is shown in plan view and cross section view in Figure 11-2 and Figure 11-3 respectively.
Source: SRK 2021
Figure 11-2: Geological Model - Plan View
| | | | | |
SalardeAtacama_SEC_Report_515800.040 | December 2022 |
SRK Consulting (U.S.), Inc.
| | | | | |
SEC Technical Report Summary – Salar de Atacama | Page 97 |
Source: SRK, 2021
Note: VGC. Volcanic, Gypsum and Clastic sequences
Figure 11-3: Geological Model - Cross Sections
Resource Domain Model
The resource was calculated used the current Albemarle claim area shown in Figure 11-2 (A1, A2, and A3). The total surface area is 167,255,755.6 m2, including the aquifers and aquitards present in the subsurface and excluding the bedrock. The bedrock units were used as hard boundaries in the
| | | | | |
SalardeAtacama_SEC_Report_515800.040 | December 2022 |
SRK Consulting (U.S.), Inc.
| | | | | |
SEC Technical Report Summary – Salar de Atacama | Page 98 |
resource estimate process. SRK infers in the estimation that the other units described in the geological model, with the exception of the basement rock, are all permeable and do not constitute constraints or controls on the estimation of Li concentration.
11.1.2Exploratory Data Analysis
The raw dataset of lithium concentration consists of sampling at certain intervals along the drill hole. Figure 11-4 shows plan and section views of the raw lithium data (mg/l). The distribution of the information is heterogeneous across the property and is mainly concentrated on the western and central part (claim area A1). The vertical section view of Figure 11-4 shows the differences in length of the hydraulic tests (sample lengths) and the distribution of them in elevation. Figure 11-5 presents the log probability plot, histogram and the table of statistics of the raw data of lithium.
| | | | | |
SalardeAtacama_SEC_Report_515800.040 | December 2022 |
SRK Consulting (U.S.), Inc.
| | | | | |
SEC Technical Report Summary – Salar de Atacama | Page 99 |
Note: Scales in meters
Source: SRK, 2021
Figure 11-4: Distribution of Lithium Samples in Plan View (top) and Section View A-A’ (bottom, Looking to N-NW) – Drill Hole Lithium Data Projected to Section A-A' - 30x Vertical Exaggeration
| | | | | |
SalardeAtacama_SEC_Report_515800.040 | December 2022 |
SRK Consulting (U.S.), Inc.
| | | | | |
SEC Technical Report Summary – Salar de Atacama | Page 100 |
| | | | | | | | | | | | | | | | | | | | | | | |
| Column | Count | Minimum | Maximum | Mean | Variance | StDev | CV |
| Li (mg/l) | 48 | 579 | 4,570 | 2,222.8 | 598,075 | 773.4 | 0.35 |
Source: SRK, 2021
Figure 11-5: Summary of Raw Sample Statistics of Lithium Concentration – mg/l, Log Probability and Histogram
| | | | | |
SalardeAtacama_SEC_Report_515800.040 | December 2022 |
SRK Consulting (U.S.), Inc.
| | | | | |
SEC Technical Report Summary – Salar de Atacama | Page 101 |
Similar irregular distribution and variable lengths of the lithium data are observed in the specific yield raw data (from hydraulic tests). A different set of data from the lithium data set was used, which includes some drillholes with lithium samples. Figure 11-6 shows the location of the tests of specific yield values in the Salar of Atacama. Section 7-3 present more details of Sy by hydrogeological unit.
Source: SRK, 2021
Figure 11-6: Specific Yield Samples in Plan View
11.1.3Drainable Porosity
The drainable porosity or Sy in Atacama was estimated from measured values in upper halite and VGC units and literature values based on the lithology, studies in Salar de Atacama outside of Albemarle’s claim, and QP’s experience in similar deposits. The Chapter 7 summarize the Sy values measured in Salar de Atacama. Measured Sy data were interpolated with ID2 method and applied to the block model as explained in the following section. The Sy data used in the resource model are shown in Table 11-1, which includes the raw data used to interpolate Sy in the Upper Halite and VGC units. Table 11-2 presents the Sy values assigned to the rest of the lithological units.
| | | | | |
SalardeAtacama_SEC_Report_515800.040 | December 2022 |
SRK Consulting (U.S.), Inc.
| | | | | |
SEC Technical Report Summary – Salar de Atacama | Page 102 |
Table 11-1: Drainable Porosity (Sy) Raw Data - Upper Halite and Volcanic Units
| | | | | | | | | | | | | | | | | | | | | | | |
| Column | Count | Minimum | Maximum | Mean | Variance | StDev | CV |
| Upper Halite (UH) |
| Sy | 71 | 0.04 | 0.554 | 0.102 | 0.01 | 0.115 | 1.14 |
| Volcanic, Gypsum and Clastic (VGC) |
| Sy | 30 | 0.002 | 0.558 | 0.158 | 0.02 | 0.158 | 1.0 |
Source: SRK, 2021
Table 11-2: Drainable Porosity (Sy) Values Used for Other Lithological Units
| | | | | |
| Unit | Sy |
| UC (Upper Clastic) | 0.06 |
| LC (Lower Clastic) | 0.03 |
| LH (Lower Halite) | 0.02 |
Note: Values estimated based on available measured data outside of mining claim (if available), literature, comparative values with the other units and QP’s experience in similar deposits.
Source: SRK, 2021
11.2Mineral Resources Estimates
The primary factors utilized in developing a brine resource estimate include the following:
•Aquifer geometry and limits (volume)
•Drainable porosity or Sy of the hydrogeological units in the salar
•Lithium concentration
Lithium concentration samples description and analysis are shown as part of the interpolation methodology used. Block model details and validation process are also described.
11.2.1Compositing and Capping
Capping of high-grade outlier data is normally performed where these data points are interpreted to be part of a different population. In SRK’s opinion, capping is appropriate at the Salar de Atacama for dealing with high grade outlier values, in this case the lithium concentration. The data was reviewed and verified, as described in sections 8 and 9. This included the review of high-yield outlier data to determine whether top cutting or capping was required that may bias or skew data for statistical and geostatistical analyses. A log-probability plot (Figure 11-7) was assessed and a capping at 3,990 mg/l Li was applied to the dataset. The table in Figure 11-7 presents the impact of the capping on the statistics of Lithium, resulting in one outlier value capped and a reduction of 0.5% of the mean of lithium for the input data. The impact to the coefficient of variation is limited to a slight reduction.
| | | | | |
SalardeAtacama_SEC_Report_515800.040 | December 2022 |
SRK Consulting (U.S.), Inc.
| | | | | |
SEC Technical Report Summary – Salar de Atacama | Page 103 |
| | | | | | | | | | | | | | | | | | | | | | | | | | | | | | | | |
| Data | Element | Count | Capped | Cap (Li – mg/l) | Percentile | Lost (Li mean) | Mean (mg/l) | Max (mg/l) | Variance | CV |
| Raw | Lithium | 48 | | | | | 2,223 | 4,570 | 598,075 | 0.35 |
| Capped | Lithium | 48 | 1 | 3,990 | 97.91% | 0.5% | 2,211 | 3,990 | 547,152 | 0.33 |
Source: SRK, 2021
Figure 11-7: Capping Analysis (Probability Plot of Lithium) and Table of Impact of Capping (Statistics)
To avoid the smearing of lithium concentrations greater than 2,500 mg/l, which are not outliers, towards zones with lower limited quantity of data and characterized by lower concentrations, the Vulcan software tool to exclude distant high yield samples was used during the second pass of the interpolation procedure. Samples with concentrations higher than 2,500 mg/l li were limited to a radius of 3,500 m by 3,500 m by 50 m. The lithium threshold (2,500 mg/l) was defined from the analysis of the probability plot (Figure 11-8) selecting a concentration approximately where the values start to be discontinuous (75th percentile). The radius used was defined based on the visual inspection of the distribution of grades in the space. In addition to that, the range of the variogram is approximately the radius selected.
Previous to the grade interpolation, samples need to be regularized to equal lengths for constant sample volume (compositing). The raw sampling data for lithium is characterized by variable lengths and discontinuous sampling along the drill holes. Figure 11-8 presents the histogram of the raw sample lengths. Given the nature of the hydraulic sampling and the differences in lengths, SRK carried out a number of tests using different lengths of compositing and determined that 25 m composites are appropriate although the raw data lengths are very variable. This is based on the nature of sampling in brine projects, which is effectively still sampling a single horizon in which the brine concentrations are assumed to not vary within the sample interval. As a result, an increasing number of composites compared with the number of raw intervals was obtained. The compositing
| | | | | |
SalardeAtacama_SEC_Report_515800.040 | December 2022 |
SRK Consulting (U.S.), Inc.
| | | | | |
SEC Technical Report Summary – Salar de Atacama | Page 104 |
was performed using the compositing tool in Maptek Vulcan software. Table 11-3 shows the comparative statistics for the raw samples and the composites. In general, SRK aims to limit the impact of the compositing to less than 5% change in the mean value after compositing. A change of 3.6% in the mean value is observed.
Source: SRK, 2021
Figure 11-8: Histogram of Length of Samples of Lithium (mg/l)
Table 11-3: Comparison Raw vs Composite Statistics
| | | | | | | | | | | | | | | | | | | | | | | | | | |
| Data | Element | Count | Minimum (mg/l) | Maximum (mg/l) | Mean (mg/l) | Variance | StDev | CV |
| Samples | Lithium | 48 | 579 | 3,990 | 2,211 | 598,075 | 773.4 | 0.33 |
| Composites | Lithium | 63 | 579 | 3,990 | 2,132 | 557,608 | 746.7 | 0.35 |
Source: SRK, 2021
The samples cross geological boundaries but considering that there are not impermeable barriers to limit the groundwater flow, QP considers it unnecessary to break down by geology.
Specific Yield (Sy)
The Sy test samples were not capped according to a hydrogeological evaluation of the information. Composites of 25 m were used for the data to estimate Sy into blocks for the Upper Halite and VGC units with enough data to support the estimation.
| | | | | |
SalardeAtacama_SEC_Report_515800.040 | December 2022 |
SRK Consulting (U.S.), Inc.
| | | | | |
SEC Technical Report Summary – Salar de Atacama | Page 105 |
11.2.2Spatial Continuity Analysis
The spatial continuity of lithium at the Atacama property was assessed through the calculation and interpretation of variography. The variogram analysis was performed in Datamine Studio RM Software (version 1.6.87.0) using the capped and composited data.
The following aspects were considered as part of the variography analysis:
•Analysis of the distribution of data via histograms
•Down-hole semi-variogram was calculated and modeled to characterize the nugget effect
•Experimental semi-variograms were calculated to define directional variograms for the main directions defined from the fan variograms analysis. Results were inconclusive to define anisotropy
•Omnidirectional variogram was modeled using the nugget and sill previously defined in the downhole/directional variography
•The total sill was normalized to 1.0
•The variogram analysis was performed using for various composite lengths (25 m, 30 m and 40 m)
The dominant anisotropy of lithium cannot be appropriately assessed due to the data distribution across the property. The omnidirectional variogram model was preferred for the neighborhood analysis and estimation. The graphical (Figure 11-9) and tabulated (Table 11-4) semi-variogram for lithium is provided below.
Source: SRK, 2021
Figure 11-9: Experimental and Modeled Omnidirectional Semi-Variogram for Lithium
| | | | | |
SalardeAtacama_SEC_Report_515800.040 | December 2022 |
SRK Consulting (U.S.), Inc.
| | | | | |
SEC Technical Report Summary – Salar de Atacama | Page 106 |
Table 11-4: Modeled Omnidirectional Semi-Variogram for Lithium
| | | | | | | | | | | | | | | | | | | | |
| Variable | Rotation | Type | Variance | Range X (m) | Range Y (m) | Range Z (m) |
| Lithium | NA | Nugget | 0.05 | |
| Spherical | 0.294 | 204.6 | 204.6 | 204.6 |
| Spherical | 0.160 | 1,323.3 | 1,323.3 | 1,323.3 |
| Spherical | 0.496 | 3,710.8 | 3,710.8 | 3,710.8 |
Source: SRK, 2021
The nugget effect is 5% with maximum range at 3,710.8 m.
Specific Yield
The distribution and quantity of Sy tests samples per lithology are not sufficient to support an appropriate spatial analysis per lithology in the same manner as the Li concentration.
11.3Neighborhood Analysis
Based on the results of the variography analysis, a neighborhood analysis was completed on the lithium data. This analysis provides a quantitative method of testing different estimation parameters and, by accessing their impact on the quality of the resultant estimate, select the appropriate value of each parameter. The slope or regression value (SOR) and kriging efficiency (KE) were used as the determining factors to optimize the kriging search neighborhood. Factors used in the neighborhood analysis included number of samples (Figure 11-10) and search (Figure 11-11).
Source: SRK, 2021
Figure 11-10: Neighborhood Analysis on Number of Samples for Lithium
| | | | | |
SalardeAtacama_SEC_Report_515800.040 | December 2022 |
SRK Consulting (U.S.), Inc.
| | | | | |
SEC Technical Report Summary – Salar de Atacama | Page 107 |
Source: SRK, 2021
Figure 11-11: Outputs from the Search Ranges Optimization Analysis
Based on the results of the optimizations and other factors like the spatial distribution of samples and the characteristics of the hydraulic tests, the neighborhood parameters were defined for estimation of lithium at the Atacama property and are summarized in Table 11-5.
| | | | | |
SalardeAtacama_SEC_Report_515800.040 | December 2022 |
SRK Consulting (U.S.), Inc.
| | | | | |
SEC Technical Report Summary – Salar de Atacama | Page 108 |
Table 11-5: Summary Search Neighborhood Parameters for Lithium
| | | | | | | | | | | | | | | | | | | | | | | | | | |
| Variable | Pass | SDIST X (m) | SDIST Y (m) | SDIST Z (m) | Rotation | Min # Composites | Max # Composites | Max # Composites per Drillhole |
| Lithium | 1 | 4,000 | 4,000 | 50 | NA | 4 | 8 | 2 |
| 2 | 10,000 | 10,000 | 100 | NA | 1 | 8 | 2 |
Source: SRK, 2021
A block size analysis was performed (Figure 11-12). The optimization results with a final block size of 500 m by 500 m by 25 m (X, Y, Z coordinates) used. Besides of this, the analysis considered the distribution and spacing of the data. The compositing length of 25 m was an aspect considered to define the extension of the parent cells in elevation, maintaining consistency with it. The block size selected shows reasonable values of slope of regression and kriging efficiency and is appropriate according to the distribution and spacing of the data.
Source: SRK, 2021
Figure 11-12: Outputs from the Block Size Optimization Analysis
11.3.1Block Model
A block model was constructed using Maptek’s Vulcan™ software (version X11.0.4; Maptek Pty Ltd, 2019) for the purposes of interpolating grade and tonnage. The block model was sub-blocked along geological and mineral claim boundaries. The dimensions of the parent cell size used are 500 m in X, 500 m in Y, and 25 m in Z. The minimum sub-blocks sizes used are 10 by 10 by 1 m. Grade interpolation was performed on parent cells. The block model limits were defined by the mineral claim polygons with the extents of the block model shown in Figure 11-4. Blocks were visually
| | | | | |
SalardeAtacama_SEC_Report_515800.040 | December 2022 |
SRK Consulting (U.S.), Inc.
| | | | | |
SEC Technical Report Summary – Salar de Atacama | Page 109 |
validated against the 3D geological model and the mineral claim boundaries. Table 11-6 contains the block model parameters.
Table 11-6: Summary Atacama Block Model Parameters
| | | | | | | | | | | | | | |
| Dimension | Origin (m) | Parent Block Size (m) | Number of Blocks | Min Sub Blocking (m) |
| X | 547,500 | 500 | 100 | 10 |
| Y | 7,360,000 | 500 | 100 | 10 |
| Z | 2,100 | 25 | 24 | 1 |
Source: SRK, 2021
The blocks were flagged with the geological units and mineral claims identifiers. Figure 11-13 presents the lithology color coded block model. The values of Sy were assigned into the blocks according to the hydrogeological units. For upper halite and the VGC units, the Sy values were interpolated into the blocks.
Source: SRK, 2021
Figure 11-13: Plan View of the Atacama Block Model Colored by Lithology (2,260 mamsl, or 40 m bgs)
11.3.2Estimation Methodology
Interpolation of Lithium
SRK used the composited data to interpolate the lithium grades into the block model using OK for the first pass and Inverse Distance Squared (ID2) for the second pass.
A sensitivity analysis was performed by varying the estimation method (OK, ID2) and search pass strategy (single and multiple) to compare the resultant data for validation purposes, where the expert hydrogeological criteria was considered, including the historical information of the behavior of the concentration of Lithium in production drillholes. The grade estimations were completed in Maptek’s Vulcan™ software (version X11.0.4; Maptek Pty Ltd, 2019) using OK, ID2 and nearest neighbor (NN) estimation. SRK completed the following scenarios:
| | | | | |
SalardeAtacama_SEC_Report_515800.040 | December 2022 |
SRK Consulting (U.S.), Inc.
| | | | | |
SEC Technical Report Summary – Salar de Atacama | Page 110 |
•Three-pass nested search varying the size of the ellipsoid in the Z dimension (50 and 100 m) using OK and ID2
•Two-pass nested search varying the size of the ellipsoid in the Z dimension (50 and 100 m) using OK and ID2
•One-pass search 10,000 by 10,000 by 100 m.
SRK completed visual and basic statistical tests and elected to use the OK estimates using the 4,000 by 4,000 by 50 m ellipsoid for the first pass and use ID2 estimates for the second pass using 10,000 by 10,000 by 100 m ellipsoid as being most representative of the underlying data and the type of lithium deposit (Table 11 4).
The images in Figure 11-14 through Figure 11-16 show the results of the estimation in terms of number of drill holes, number of composites and the distances from the blocks to the composites used during the estimation. The majority of the blocks were estimated with three or more drill holes and with eight composites. The distance between the blocks and the composites used during the estimation has an average of 2,986 m and in most cases with distances less than 5,000 m. In SRK’s opinion, this provides confidence that the estimation methods are appropriate and force interpolation of the concentrations rather than extrapolation from single points.
Source: SRK, 2021
| | | | | |
SalardeAtacama_SEC_Report_515800.040 | December 2022 |
SRK Consulting (U.S.), Inc.
| | | | | |
SEC Technical Report Summary – Salar de Atacama | Page 111 |
Figure 11-14: Histogram of Number of Drill Holes Used to Estimate the Block Model
Source: SRK, 2021
Figure 11-15: Histogram of Number of Composites Used to Estimate the Block Model
| | | | | |
SalardeAtacama_SEC_Report_515800.040 | December 2022 |
SRK Consulting (U.S.), Inc.
| | | | | |
SEC Technical Report Summary – Salar de Atacama | Page 112 |
Source: SRK, 2021
Figure 11-16: Histogram of Average Distance from Blocks to Composites Used in Estimation
It is the QP’s opinion that the methodology used in the lithium OK and ID2 estimate is appropriate for resource model calculations.
Interpolation of Specific Yield (Sy)
SRK used the 25 m composited data to interpolate the Sy values into the block model using ID2 and a single search pass with the ellipsoid 8,000 m by 8,000 m by 8,000 m. the Sy values were interpolated using the data of the lithological units VGC (Volcanic, Gypsum and clastic) and Upper Halite (UH1) into the blocks flagged accordingly. Sy values where assigned into the blocks of the lithologies that were not interpolated according to the values presented in Table 11-2. The Sy mean grade of the interpolated blocks in the volcanic units (Volcanic and Ignimbrite) was assigned to the blocks not interpolated in those units.
| | | | | |
SalardeAtacama_SEC_Report_515800.040 | December 2022 |
SRK Consulting (U.S.), Inc.
| | | | | |
SEC Technical Report Summary – Salar de Atacama | Page 113 |
11.3.3De-Clustering
A de-clustering cell analysis of the composites was completed to obtain de-clustered statistics for model validation purposes for lithium and Sy. Additionally, the NN estimation of lithium and Sy was used as a spatially de-clustering method for comparative validation.
Declustering of the data results in a reduction in the mean of lithium and an increase in the mean of Sy (Upper Halite unit), which reflects the nature of more sampling of higher concentrations of Li in brines compared to less sampling of lower concentrations. This declustered mean is considered more appropriate for validation comparisons for the data against the estimate.
Figure 11-17 presents the scatter plot (Li average vs Cell Size) obtained for the de-clustering analysis of the lithium composites. Ultimately, a 2,500 m cell size was selected to calculate de-clustered statistics.
Source: SRK, 2021
Figure 11-17: De-Clustering Analysis Showing Scatter Plot of Cell Size versus Lithium Mean
Figure 11-18 and Figure 11-19 present the scatter plot (Sy average vs Cell Size) obtained for the de-clustering analysis of the Sy composites. Ultimately, 4,000 m and 2,750 m cell sizes were selected to calculate de-clustered statistics for Upper Halite and Volcanic (Volcanic and Ignimbrite) lithologies respectively.
| | | | | |
SalardeAtacama_SEC_Report_515800.040 | December 2022 |
SRK Consulting (U.S.), Inc.
| | | | | |
SEC Technical Report Summary – Salar de Atacama | Page 114 |
Source: SRK, 2021
Figure 11-18: De-Clustering Analysis Showing Scatter Plot of Cell Size Versus Sy Mean – Upper Halite Lithology
| | | | | |
SalardeAtacama_SEC_Report_515800.040 | December 2022 |
SRK Consulting (U.S.), Inc.
| | | | | |
SEC Technical Report Summary – Salar de Atacama | Page 115 |
Source: SRK, 2021
Figure 11-19: De-Clustering Analysis Showing Scatter Plot of Cell Size versus Sy Mean – Volcanic (Volcanic and Ignimbrite) Lithologies
11.3.4Estimate Validation
SRK undertook a validation of the interpolated model to check that the model represents the input data, the estimation parameters and that the estimate is not biased. Different validation techniques were used, including:
•Visual comparison of lithium grades between block volumes and drillhole samples
•Comparative lithium statistics of de-clustered composites and the alternative estimation methods (OK, ID2 and NN)
•Swath plots for lithium mean block and composite sample comparisons
•Visual comparison and swath plots comparison for Sy in blocks estimated using ID2 and NN in the lithologies Volcanics (Volcanic and Ignimbrite) and Upper Halite
Visual Comparison
Visual validation of drilling data to estimated block grades was completed in 3D. In general, estimated block grades compared well with acceptable correlation from drilling data. Figure 11-20 shows examples of the visual validations in plan view at 2,250 mamsl.
| | | | | |
SalardeAtacama_SEC_Report_515800.040 | December 2022 |
SRK Consulting (U.S.), Inc.
| | | | | |
SEC Technical Report Summary – Salar de Atacama | Page 116 |
Source: SRK, 2021
Figure 11-20: Example of Visual Validation of Lithium Grades in Composites Versus Block Model Horizontal Section - Plan View (2,250 mamsl Elevation)
Comparative Statistics
SRK performed a statistical comparison of the de-clustered composites to the estimated blocks to assess the potential for bias in the estimated lithium grades. The comparison included the review of the histograms for lithium and the mean analysis between the blocks and composites from aquifers (Table 11-7).
The mean interpolated lithium values by OK, ID2 and NN are similar and are slightly lower grade than the de-clustered lithium grade. The comparison between data and the blocks is better in the areas with higher density of data, as shown in swath plots comparing the means by area. The interpolated lithium concentrations using the combined OK and ID2 has a better correlation with the data and provides information of the interpolation error and quality.
Table 11-7: Summary of Validation Statistics Composites Versus Estimation Methods (Lithium - Aquifer Data)
| | | | | | | | | | | | | | | | | |
| Statistic | Declustered Sample Data Li (mg/l) | Block Model (OK-1st pass, ID2-2nd pass) | Ordinary Kriging - Block Data (Volume Weighted) Li (mg/l) | Inverse Distance - Block Data (Volume Weighted) Li (mg/l) | Near Neighbor - Block Data (Volume Weighted) Li (mg/l) |
| Mean | 2,132 | 1,811 | 1,791 | 1,810 | 1,760 |
| Std Dev | 747 | 449 | 425 | 473 | 597 |
| Variance | 557,608 | 201,274 | 180,902 | 223,958 | 355,988 |
| CV | 0.35 | 0.25 | 0.24 | 0.26 | 0.34 |
Source: SRK, 2021
| | | | | |
SalardeAtacama_SEC_Report_515800.040 | December 2022 |
SRK Consulting (U.S.), Inc.
| | | | | |
SEC Technical Report Summary – Salar de Atacama | Page 117 |
Swath Plots
The swath plots of lithium in X and Z coordinates shown in Figure 11-21 represent a spatial comparison between the mean block grades interpolated using alternative methods and the de-clustered composites. The areas of higher variability between the composites and estimates at Atacama occur in the areas of the deposit with lower quantity of data and where lower lithium grades are observed.
Source: SRK, 2021
Figure 11-21: Lithium (mg/l) - Swath Analysis at Atacama (X and Z Coordinates)
| | | | | |
SalardeAtacama_SEC_Report_515800.040 | December 2022 |
SRK Consulting (U.S.), Inc.
| | | | | |
SEC Technical Report Summary – Salar de Atacama | Page 118 |
Figure 11-22 presents the swath plots of Sy in X coordinates. The mean grades of Sy in blocks follow the general behavior of Sy in the composites and Sy estimated by NN method.
Source: SRK, 2021
Figure 11-22: Sy (Fraction) - Swath Analysis at Atacama – Upper Halite Lithology
The QP’s opinion is that the validation through the use of visual comparison, comparative statistics, and swath plots provide a sufficient level of confidence to confirm that the model accurately represents the input data, the estimation parameters are reasonable, and that the estimate is not biased.
11.4Cut-Off Grade Estimates
The CoG calculations are based on assumptions and actual performance of the Salar de Atacama operation. Pricing was selected based on a strategy of utilizing a higher resource price than is used for the reserve estimate. For the purpose of this estimate, the resource price is 10% higher than the reserve price of $10,000/t technical grade lithium carbonate, the basis for which is presented in Section 16.1.3. This results in the use of a resource price of $11,000/t of technical grade lithium carbonate.
| | | | | |
SalardeAtacama_SEC_Report_515800.040 | December 2022 |
SRK Consulting (U.S.), Inc.
| | | | | |
SEC Technical Report Summary – Salar de Atacama | Page 119 |
SRK utilized the economic model to estimate the break-even cut-off grade, as discussed in Section 12.3. Applying the $11,000/t lithium price to this methodology resulted in a break-even CoG of approximately 670 mg/L lithium, applicable to the resource estimate.
11.5Resource Classification and Criteria
Resources have been categorized subject to the opinion of the QP based on the amount/robustness of informing data for the estimate, consistency of geological/concentration distribution, survey information, and have been validated against long term production information. Other criteria to support the categories of the resource model were based on the normalized variance, sample distribution, lithology (boreholes), and radius of influence from the pumping wells.
•Measured resources were assigned to areas with high confidence in the aquifer and aquitard geometry and with high density of the lithium samples. From the kriging distribution quality point of view, the blocks with normalized variance under 0.25 were interpreted as measured. Samples collected in a pumping well also represent the brine surrounding at an extent proportional to the hydraulic radius of influence Considering than several of the production wells have been in operation over 20 years, generating a large radius of influence, the measured resource areas were adjusted to include those zones. Blocks within 25% of the radius of influence are classified as measured. Finally, using the QP’s criteria, the distribution of the measured resource was slightly adjusted considering the coverage of boreholes, distribution of lithium samples and the continuity of measured blocks in 3D (Figure 11 20).
•Classification of Indicated resources is done only for those domains with sufficient confidence in the aquifer and aquitard geometry, and sufficient density of the lithium samples. These volumes are very well correlated with the blocks with normalized variance between 0.25 and 0.5. Local inherent variability in the geometry of the aquifers has been considered in this classification and has been manually limited in areas of greater concern.
•Brine hosted aquifers with no or low drill density, and no or low lithium samples, have been classified as Inferred. Inferred also corresponds to the blocks with normalized variance over 0.5. Areas close to the border between the salar nucleus (halite) and transition zones present less confidence in the lithium concentration's continuity, consequently, were also classified as inferred.
| | | | | |
SalardeAtacama_SEC_Report_515800.040 | December 2022 |
SRK Consulting (U.S.), Inc.
| | | | | |
SEC Technical Report Summary – Salar de Atacama | Page 120 |
Source: SRK, 2021
Figure 11-23: Model Horizontal Section - Plan View – Blocks Colored by Classification (2,260 masl Elevation)
11.6Uncertainty
SRK considered a number of factors of uncertainty in the classification of the mineral resource estimation:
•The lack of availability of site-specific data for Sy values in some units results in uncertainty associated with estimates of brine volume potentially available for extraction. To mitigate this uncertainty, the values were based on literature data of similar lithology units, studies in Salar de Atacama outside of Albemarle claim areas, and considering the QP’s experience in similar deposits. Additionally, the resource area has a high density of boreholes a good interpretation of the geology, which drives Sy estimates.
•The southeastern zone of the Albemarle claim area is close to the transition zone, which partially covers the upper halite. The presence of undetected lower lithium concentration brines is a potential risk. To mitigate this uncertainty, part of the resources calculated in this zone were classified as inferred.
11.7Summary Mineral Resources
SRK has reported the mineral resources for Salar de Atacama as mineral resource exclusive of reserves as well as inclusive of reserves. The resources are reported between the elevations of 2,299 mamsl, and 2,200 mamsl, which corresponds to the zone of brine with better coverage of sampling.
Mineral Resources Exclusive of Reserves. Table 11-8 presents the mineral resource exclusive of reserves. Resource from brine is contained within the resource aquifers with the estimated reserve deducted from the overall resource. This calculation was completed by calculating total lithium (as lithium metal) projected as being pumped from the aquifer in the reserve production forecast. This
| | | | | |
SalardeAtacama_SEC_Report_515800.040 | December 2022 |
SRK Consulting (U.S.), Inc.
| | | | | |
SEC Technical Report Summary – Salar de Atacama | Page 121 |
quantity of lithium (as metal) was directly subtracted from the overall mineral resource estimate. Notably, the resource grade was not changed as part of this exercise. This is because the resource, exclusive of reserve, and reserve do not represent discrete areas of the resource due to the brine aquifer (i.e., the resource) being a dynamic system that moves, mixes and recharges. Therefore, the resource, after extraction of the reserve, in reality would be an entirely new resource, requiring new data and a new estimate. As this is not practical with current data, in the QP’s opinion, it is more appropriate to keep the calculation simple and transparent and utilize this approach. Further, as the dynamic resource precludes direct conversion of measured / indicated resources to proven / probable reserves, in the QP’s opinion, the most reasonable and defensible approach to allocating depletion of the reserve from the resource is to deplete measured and indicated resource proportionate to their contribution to the combined measured and indicated resource. As measured resources comprise 52% of the combined measured an indicated resource, 52% of the reserve depletion was allocated to measured, with the remainder subtracted from indicated. For comparison, proven reserves comprise approximately 52% of the overall reserve (i.e., measured resource is deducted proportionate to the proven reserve).
Mineral Resources Inclusive of Reserves. Table 11-9 presents the brine resources inclusive of the mineral reserve. This includes all unmined/unpumped brine. Further, given the delay in the time of pumping brine to actual production of lithium being approximately two years due to the extended evaporation period, the first two years of lithium production in the economic model are sourced from brine that is in process (i.e., in the evaporation ponds). These first two years of production are included in the reserve as they are in the economic model. Therefore, SRK has also included this brine in the resource, inclusive of reserve. Albemarle tracks the volume and concentration of brine pumped at the salar for production purposes on an ongoing basis. Therefore, to quantify this in process component of the resource, SRK summarized the prior 24 months of pumping data as the in process resource. This component of the resource is reported at the concentration of brine pumped as this is the most reliable point of measurement. SRK classified this component of the resource as measured, given the actual quantity of brine produced was directly measured and therefore has relatively low uncertainty.
| | | | | |
SalardeAtacama_SEC_Report_515800.040 | December 2022 |
SRK Consulting (U.S.), Inc.
| | | | | |
SEC Technical Report Summary – Salar de Atacama | Page 122 |
Table 11-8: Salar de Atacama Mineral Resource Estimate, Exclusive of Mineral Reserves (Effective August 31, 2021)
| | | | | | | | | | | | | | | | | | | | | | | | | | |
| Measured Resource | Indicated Resource | Measured + Indicated Resource | Inferred Resource |
| Contained Li (Tonnes x 1000) | Brine Concentration (mg/L Li) | Contained Li (Tonnes x 1000) | Brine Concentration (mg/L Li) | Contained Li (Tonnes x 1000) | Brine Concentration (mg/L Li) | Contained Li (Tonnes x 1000) | Brine Concentration (mg/L Li) |
| Total | 717 | 2,211 | 687 | 1,747 | 1,404 | 1,959 | 131 | 1,593 |
Source: SRK, 2021
•Mineral resources are reported exclusive of mineral reserves. Mineral resources are not mineral reserves and do not have demonstrated economic viability.
•Given the dynamic reserve versus the static resource, a direct measurement of resources post-reserve extraction is not practical. Therefore, as a simplification, to calculate mineral resources, exclusive of reserves, the quantity of lithium pumped in the life of mine plan was subtracted from the overall resource without modification to lithium concentration. Measured and indicated resource were deducted proportionate to their contribution to the overall mineral resource.
•Resources are reported on an in-situ basis.
•Resources are reported between the elevations of 2,299 masl and 2,200 masl. Resources are reported as lithium metal
•Resources have been categorized subject to the opinion of a QP based on the amount/robustness of informing data for the estimate, consistency of geological/grade distribution, survey information.
•Resources have been calculated using drainable porosity estimated from measured values in Upper Halite and VGC units, and bibliographical values based on the lithology and QP’s experience in similar deposits
•The estimated economic cutoff grade utilized for resource reporting purposes is 670 mg/l lithium, based on the following assumptions:
◦A technical grade lithium carbonate price of US$11,000 / metric tonne CIF La Negra. This is a 10% premium to the price utilized for reserve reporting purposes. The 10% premium applied to the resource versus the reserve was selected to generate a resource larger than the reserve, ensuring the resource fully encompassed the reserve while still maintaining reasonable prospect for eventual economic extraction.
◦ Recovery factors for the salar operation increase gradually over the span of 4 years, from the current 40% to the proposed SYIP 65% recovery in 2025. After that point, evaporation pond recovery is assumed constant at 65%, considering the installation of a liming plant is assumed in 2027. An additional recovery factor of 80% lithium recovery is applied to the La Negra lithium carbonate plant.
◦A fixed annual average brine pumping rate of 442 liters per second is assumed, consistent with Albemarle’s permit conditions.
◦Operating cost estimates are based on a combination of fixed brine extraction, G&A and plant costs and variable costs associated with raw brine pumping rate or lithium production rate. Average life of mine operating cost is calculated at approximately $3,000/metric tonne CIF Asia.
◦Sustaining capital costs are included in the cutoff grade calculation and post the SYIP installation, average around US$54M per year.
◦Government royalties are excluded from the cutoff grade calculation as these costs are variable, depending upon price. A 3.5% community royalty is included in the cutoff grade as this royalty is fixed.
•Mineral Resources tonnage and contained metal have been rounded to reflect the accuracy of the estimate, and numbers may not add due to rounding.
•SRK Consulting (U.S.) Inc. is responsible for the Mineral Resources with an effective date: August 31, 2021. The geologic block model is incorporating all relevant exploration data as of June 30, 2020 and there is no additional data since that date. The resource has been depleted to August 31, 2021.
| | | | | |
SalardeAtacama_SEC_Report_515800.040 | December 2022 |
SRK Consulting (U.S.), Inc.
| | | | | |
SEC Technical Report Summary – Salar de Atacama | Page 123 |
Table 11-9: Salar de Atacama Mineral Resource Estimate, Inclusive of Mineral Reserves (Effective June 30, 2020)
| | | | | | | | | | | | | | | | | | | | | | | | | | |
| Measured Resource | Indicated Resource | Measured + Indicated Resource | Inferred Resource |
| Contained Li (Tonnes x 1000) | Brine Concentration (mg/L Li) | Contained Li (Tonnes x 1000) | Brine Concentration (mg/L Li) | Contained Li (Tonnes x 1000) | Brine Concentration (mg/L Li) | Contained Li (Tonnes x 1000) | Brine Concentration (mg/L Li) |
| In Situ | 1,029 | 2,211 | 966 | 1,747 | 1,995 | 1,959 | 131 | 1,593 |
| In Process | 24 | 2,685 | - | - | 24 | 2,685 | - | - |
Source: SRK, 2021
•Mineral resources are reported inclusive of mineral reserves. Mineral resources are not mineral reserves and do not have demonstrated economic viability.
•Resources are reported as in situ and in process. In process resources quantify the prior 24 months of pumping data and reflect the raw brine, at the time of pumping.
•In situ resources are reported between the elevations of 2,299 masl and 2,200 masl.
•Resources are reported as lithium metal
•Resources have been categorized subject to the opinion of a QP based on the amount/robustness of informing data for the estimate, consistency of geological/grade distribution, survey information.
•Resources have been calculated using drainable porosity estimated from measured values in Upper Halite and VGC units, and bibliographical values based on the lithology and QP’s experience in similar deposits
•The estimated economic cutoff grade utilized for resource reporting purposes is 670 mg/l lithium, based on the following assumptions:
◦A technical grade lithium carbonate price of US$11,000 / metric tonne CIF La Negra. This is a 10% premium to the price utilized for reserve reporting purposes. The 10% premium applied to the resource versus the reserve was selected to generate a resource larger than the reserve, ensuring the resource fully encompassed the reserve while still maintaining reasonable prospect for eventual economic extraction.
◦ Recovery factors for the salar operation increase gradually over the span of 4 years, from the current 40% to the proposed SYIP 65% recovery in 2025. After that point, evaporation pond recovery is assumed constant at 65%, considering the installation of a liming plant is assumed in 2027. An additional recovery factor of 80% lithium recovery is applied to the La Negra lithium carbonate plant.
◦A fixed average annual brine pumping rate of 442 l/s is assumed, consistent with Albemarle’s permit conditions.
◦Operating cost estimates are based on a combination of fixed brine extraction, G&A and plant costs and variable costs associated with raw brine pumping rate or lithium production rate. Average life of mine operating cost is calculated at approximately $3,000/metric tonne CIF Asia.
◦Sustaining capital costs are included in the cutoff grade calculation and post the SYIP installation, average around US$54M per year.
◦Government royalties are excluded from the cutoff grade calculation as these costs are variable, depending upon price. A 3.5% community royalty is included in the cutoff grade as this royalty is fixed.
•Mineral Resources tonnage and contained metal have been rounded to reflect the accuracy of the estimate, and numbers may not add due to rounding.
•SRK Consulting (U.S.) Inc. is responsible for the Mineral Resources with an effective date: August 31, 2021. The geologic block model is incorporating all relevant exploration data as of June 30, 2020 and there is no additional data since that date. The resource has been depleted to August 31, 2021.
| | | | | |
SalardeAtacama_SEC_Report_515800.040 | December 2022 |
SRK Consulting (U.S.), Inc.
| | | | | |
SEC Technical Report Summary – Salar de Atacama | Page 124 |
1.8Recommendations and Opinion
It is the QP’s opinion that the aquifers' geometry, brine chemistry composition, and the Sy of the basin sediments have been adequately characterized to support the resource estimate for Salar de Atacama, as classified.
The mineral resources stated herein are appropriate for public disclosure and meet the definitions of measured, indicated and inferred resources established by SEC guidelines and industry standards. Based on the analysis described in this report, the QP’s understanding of resources that are exclusive of reserves, and the project’s status of operating since 1984, in the QP’s opinion, there is reasonable potential for economic extraction of the resource.
The current lithium concentration data and Sy data is mostly located in claims areas A1 and A2. A3 in the eastern zone has less information. A similar situation occurs below 100 m depth, where few screen intervals exist, therefore few samples were collected.
SRK recommends implementing a field campaign in the aquifers within the claim area A3, focused on collecting Sy values. RBRC samples for porosity test in Lower Halite and Lower clastic (if possible); and pumping tests in Upper clastic. Also it is recommended a sample collection campaign from 100 m to 150 m in all areas (A1, A2, and A3).
| | | | | |
SalardeAtacama_SEC_Report_515800.040 | December 2022 |
SRK Consulting (U.S.), Inc.
| | | | | |
SEC Technical Report Summary – Salar de Atacama | Page 125 |
12Mineral Reserve Estimates
This section describes the key assumptions, parameters, and methods used to simulate the movement of lithium-rich brines in Salar de Atacama in the process of their extraction, which is utilized to develop the reserve estimate.
12.1Numerical Groundwater Model
A geologically-based, 3D, numerical groundwater-flow and solute transport model was developed to evaluate the extractability of lithium-rich brine from Salar de Atacama. The model construction is based on an analysis of historical hydrogeologic data conducted by ALB and SRK. A 3D geologic model developed by SRK (Local and Regional models), described in Section 11.1, provides the framework of hydrogeologic units used in the numerical model.
The sequence of modeling activities consists of Calibration, Transition, and Production simulations. The time period of each model is described below:
•Calibration: October 1997 to September 2018 (data available for model calibration)
•Transition: October 2018 to August 2021 (validation of the model)
•Prediction: September 2021 to March 2042 (reserve estimate period)
The Transition simulation was designed to simulate the period of time between the end of data available for calibration and the beginning of the reserve simulation. The numerical groundwater flow and transport models were developed using the finite-difference code MODFLOW-SURFACT with the transport module (HydroGeoLogic Inc., 2011) via the Groundwater Vistas graphical user interface (ESI, 2017). The model was calibrated to available historical water level and lithium concentration data. The calibrated model was used to evaluate different production wellfield pumping regimes.
12.1.1Model Domain and Grid
The model domain includes the Nucleus and marginal zone of Salar de Atacama, including halite units, volcanic, and clastic deposits in an area of 2,432 km2 with 843,038 active cells and 16 layers. Model cell sizes vary from 125 by 125 to 340 by 340 m. Model layers vary in thickness from 0.7 m near the salar surface to about 144 m for deeper zones. Figure 12-1 shows the simulated hydrogeological units and breakdown of model layer thicknesses. Model layering was developed to ensure proper representation of the aquifer units within the numerical model. Figure 12-1 shows an oblique 3D view of the model.
| | | | | |
SalardeAtacama_SEC_Report_515800.040 | December 2022 |
SRK Consulting (U.S.), Inc.
| | | | | |
SEC Technical Report Summary – Salar de Atacama | Page 126 |
Source: SRK, 2021
Figure 12-1: Oblique 3D View of Numerical Groundwater Model
12.1.2Flow Boundary Conditions
There are three primary natural groundwater inflow processes at Salar de Atacama: recharge by direct precipitation, indirect recharge on catchments surrounding the salar, and infiltration from lagoon/stream systems. There are two primary natural groundwater outflow processes: groundwater discharges from the salar at lower elevations via evapotranspiration and to surface water bodies (lagoons). A schematic of the key boundary condition types is presented in Figure 12-2. Points in this figure represent locations where lateral inflow and lagoon recharge were simulated, the points are labeled according to the recharge source. Color-shaded areas represent the precipitation-derived recharge areas and rates for the steady state simulation.
| | | | | |
SalardeAtacama_SEC_Report_515800.040 | December 2022 |
SRK Consulting (U.S.), Inc.
| | | | | |
SEC Technical Report Summary – Salar de Atacama | Page 127 |
Source: SGA, December 2015; SRK 2021
Note: Lateral inflow locations (simulated by injection wells are shown in different colors per Sub-Basin
Figure 12-2: Zones of Direct Recharge and Lateral Groundwater Inflow
Recharge
Direct recharge and lateral recharge location and rates were assumed from previous hydrogeological studies presented to the environmental agencies of Chile (SGA, 2015; and SGA, 2019) and from second update of the salar de Atacama groundwater model for the RCA 21/2016 (VAI, 2021). Direct recharge was simulated in the uppermost active layer as a transient boundary condition, at a monthly temporal resolution. Lateral groundwater recharge was simulated as a transient boundary condition, as injection wells in layers 1 through 16, depending on the lateral recharge location. Minor adjustments were made in the fluxes reported from sub-basins 10 and 11 to represent in more details the lateral recharge from Cordon de Lila. Figure 12-2 shows the distribution of direct recharge
| | | | | |
SalardeAtacama_SEC_Report_515800.040 | December 2022 |
SRK Consulting (U.S.), Inc.
| | | | | |
SEC Technical Report Summary – Salar de Atacama | Page 128 |
and the injection wells used for the lateral recharge simulation. Table 12-1 presents the infiltration rates and lateral inflows used for natural groundwater flow conditions (no pumping).
Table 12-1: Recharge Rates and Lateral Inflows Under Natural Conditions
| | | | | | | | | | | |
| Recharge Component | # Injection Wells | Total Inflow (L/s ) |
| Sub-Basin 6 | 28 | 200 | |
| Sub-Basin 7 | 67 | 425 |
| Sub-Basin 8 | 13 | 41 |
| Sub-Basin 9 | 34 | 348 |
| Sub-Basin 10a Cone | 3 | 32 | 611 |
| Sub-Basin 10a South | 10 | 579 |
| Sub-Basin 10b | 6 | 5 | |
| Sub-Basin 11 | 15 | 90.8 | 92 |
| Sub-Basin 11a | 1 | 0.4 |
| Sub-Basin 11b | 1 | 0.7 |
| Sub-Basin 12 | 28 | 10 | |
| Sub-Basin 13 | 7 | 92 |
| Sub-Basin 15 | 5 | 7 |
| Northern Boundary | 86 | 684 |
| Infiltration Peine Lagoon | 6 | 11.0 |
| Infiltration Soncor Lagoon (Cola Pez) | 9 | 25.0 | 25.0 |
| Infiltration Soncor Lagoon (DSur) | 9 | 0 |
| Total Recharge from Precipitation | - | 316.6 | |
Source: VAI 2021; SRK 2021
Evapotranspiration
Evapotranspiration (ET) rates and spatial distribution were assumed from the previous environmental model (SGA, 2015). ET rates varied on a monthly basis, and ET was applied from the topographic surface to an extinction depth ranging from 1-2 meters below the ground surface. Conservatively, lithium mass was removed with ET, to avoid artificial accumulation of lithium at the ground surface in the model and over-estimation of lithium availability. The spatial distribution of maximum ET rates in the model is shown in Figure 12-3.
| | | | | |
SalardeAtacama_SEC_Report_515800.040 | December 2022 |
SRK Consulting (U.S.), Inc.
| | | | | |
SEC Technical Report Summary – Salar de Atacama | Page 129 |
Source: SGA, December 2015; SRK 2021
Note: Values represent average evaporation rates for natural conditions (no pumping)
Figure 12-3: Zones of Simulated Maximum Evapotranspiration Rate
Lagoon/Stream Systems
Four lagoon/stream networks are identified in Salar de Atacama: Soncor, Aguas de Queltana, Peine, and La Punta – La Brava as shown in Figure 12-2. Soncor and Peine lagoons include infiltration from the surface water corresponding to 25 L/s and 11 L/s, respectively (SGA, 2015 and SGA, 2019).
| | | | | |
SalardeAtacama_SEC_Report_515800.040 | December 2022 |
SRK Consulting (U.S.), Inc.
| | | | | |
SEC Technical Report Summary – Salar de Atacama | Page 130 |
Surface water is not thought to infiltrate from the Aguas de Queltana and La Punta – La Brava lagoons.
The lagoon/stream networks are simulated as drain cells. Groundwater discharge rates into the lagoon/stream networks were calibrated using the conceptual water balance model for each lagoon/stream zone (Table 12-2).
Table 12-2: Conceptual Rates of Groundwater Discharges into the Lagoon/Stream Systems
| | | | | |
| Lagoon/Stream System | Flow (L/s) |
| Soncor | 76 |
| Aguas de Quelana | 172 |
| Peine | 79 |
| La Punta – La Brava | 113 |
Source: SGA, 2016
Infiltration from the Soncor and Peine lagoons into groundwater were simulated as injection wells in the top layer of the model. Lagoon and stream areas are not assigned as an evaporation zone since water evaporating through those cells is controlled by the drain cells.
Location of groundwater discharge zones to lagoons, and infiltration from the lagoons are shown in Figure 12-2.
Pumping Wells and Artificial Recharge
Simulation of the historical brine extraction and freshwater wells by Albemarle and SQM are based on the construction details and historical flow rates presented in the environmental reports of Albemarle and SQM (SQM, 2019; SQM, 2020 and www.sqmsenlinea.com). Details of the pumping rates in time for calibration and prediction are described in sections 12.1.5 and 12.1.6 below.
SQM brine injection was reported at annual average rates up to 397 L/s (SQM 2020). These values were simulated as injection wells in four locations within the SQM property, in the top layer of the model.
Albemarle estimates that loss from operational ponds and stockpiles is up to 5% of the total brine pumping rate as leakage to the groundwater system (0.7 to 15 L/s). Figure 12-4 shows locations of pumping wells in Salar de Atacama (historical pumping). The location of artificial injection wells used to simulate leakage from the Albemarle ponds is also shown in Figure 12-4.
| | | | | |
SalardeAtacama_SEC_Report_515800.040 | December 2022 |
SRK Consulting (U.S.), Inc.
| | | | | |
SEC Technical Report Summary – Salar de Atacama | Page 131 |
Source: SRK, 2021
Figure 12-4: Location of Simulated Pumping Wells and Artificial Recharge Zones (Historical)
| | | | | |
SalardeAtacama_SEC_Report_515800.040 | December 2022 |
SRK Consulting (U.S.), Inc.
| | | | | |
SEC Technical Report Summary – Salar de Atacama | Page 132 |
Solute -Transport Boundary Conditions
The following lithium concentration values were assumed in the recharge boundary conditions for the solute-transport simulations:
•Lateral recharge from sub-basins (fresh water): 3 to 10 mg/L,
•Flows from the North Boundary: 1,000 mg/L,
•Infiltration from the Soncor and Peine lagoons/stream systems: 700 and 320 mg/L, respectively.
Lithium concentration values mentioned above are constant in time and are based on the hydrochemistry database presented in the environmental reports (SGA, 2019 and SQM, 2020) and in “Hydrogeochemical fluxes and processes contributing to the formation of lithium-enriched brines in a hyper-arid continental basin” (Munk et al., 2018).
Other assumptions for solute transport boundary conditions are as follows:
•Reinjected brines in SQM have concentration 1,000 mg/L of lithium (higher grades are expected in SQM reinjection brines; however, 1,000 mg/L was chosen as a minimum value to limit the “artificial” lithium available for the predicted Albemarle production).
•Seepage from Albemarle operational ponds has lithium concentrations from 1,712 to 78,646 mg/L. These values correspond to the measured concentration operational records provided by Albemarle for this study.
•The effect of the direct recharge on the lithium concentration in the Salar is negligible.
•Evapotranspiration removes lithium form the model (analogous to chemical precipitation).
Figure 12-5 shows the distribution of solute-transport boundary conditions.
| | | | | |
SalardeAtacama_SEC_Report_515800.040 | December 2022 |
SRK Consulting (U.S.), Inc.
| | | | | |
SEC Technical Report Summary – Salar de Atacama | Page 133 |
Source: SRK, 2021
Note: Colors in Albemarle ponds are proportional to the leakage concentration
Figure 12-5: Solute-Transport Boundary Conditions
12.1.3Hydraulic and Solute Transport Properties
The hydrogeologic zones specified in the model were derived from the geologic model developed using the Leapfrog Geo software and described in Section 11.1. Aquifer parameters of hydraulic conductivity, specific yield, and specific storage in addition to the transport parameter of effective porosity are specified by hydrogeologic zone in the model.
| | | | | |
SalardeAtacama_SEC_Report_515800.040 | December 2022 |
SRK Consulting (U.S.), Inc.
| | | | | |
SEC Technical Report Summary – Salar de Atacama | Page 134 |
Horizontal hydraulic conductivity values used in the model were derived from historical information from Albemarle, SQM, and Corfo as described in Section 7.3 and as a result of the calibration processes. A summary of hydraulic conductivity values per aquifer unit is shown in Table 12-3. These values provided the initial values for use in calibration of the numerical groundwater flow model.
Table 12-3: Hydraulic Conductivity Values Used in the Numerical Model Compared with Measured Data
| | | | | | | | | | | | | | | | | | | | | | | |
| Hydrogeologic Unit | K |
| Measured | Simulated |
| # | Average | Maximum | Minimum | Average | Maximum | Minimum |
| Upper Halite and Others | 28 | 41.6 | 380 | 0.0060 | 1666 | 6000 | 0.5 |
| Upper Halite | 140 | 142 | 5633 | 0.00003 |
| Upper Halite and Others (Regional) | 54 | 11 | 200 | 0.0090 | 1797 | 6000 | 5.9 |
| Upper Halite (Regional) | 400 | 168.3 | 6000 | 0.0006 |
| Lower Halite | 8 | 0.1 | 0.7 | 0.0001 | 0.08 | 0.1 | 0.05 |
| Lower Halite (Regional) | 24 | 10.9 | 111 | 0.0032 | 0.1 | 0.1 | 0.1 |
| Upper Clastic | 10 | 49.1 | 188.0 | 0.37 | 3.54 | 10 | 0.03 |
| Lower Clastic | 4 | 4.4 | 8.0 | 0.9 | 0.39 | 1 | 0.08 |
| Volcanic/Gypsum/Clastic | 22 | 9.2 | 86.4 | 0.0052 | 17.96 | 42.37 | 0.30 |
| Volcanic/Gypsum/Clastic (Regional) | 32 | 0.5 | 5.2 | 0.004 | 0.05 | 0.05 | 0.05 |
| Ignimbrite | 6 | 25.6 | 71.9 | 0.32 | 10.17 | 20 | 0.33 |
| Sediment East | 17 | 15.1 | 30.0 | 1.0 | 171.67 | 500 | 0.01 |
| Sediment West | 3 | 0.4 | 0.7 | 0.021 | 75.1 | 150 | 0.2 |
| Transition Zone | 51 | 125 | 3000 | 0.001 | 169.07 | 500 | 0.2 |
Note: # number of tests
Source: SRK 2021
Specific yield (Sy) values were also available in the historical records mentioned in Section 7. Sy values used in the model were derived from those values and adjusted during the calibration process. These values are shown in Table 12-4.
No specific storage (Ss) values were measured in Salar de Atacama. Specific storage values used in the model were derived from the QP’s experience in similar deposits and as a result of the calibration process.
| | | | | |
SalardeAtacama_SEC_Report_515800.040 | December 2022 |
SRK Consulting (U.S.), Inc.
| | | | | |
SEC Technical Report Summary – Salar de Atacama | Page 135 |
Table 12-4: Specific Yield and Effective Porosity Values Used in the Numerical Model Compared with Measured Data
| | | | | | | | | | | | | | | | | | | | | | | | | | | | | | | | | | | | | | | | | |
| Hydrogeologic Unit | Specific Yield | Specific Storage | Porosity |
| Measured | Simulated | Simulated | Simulated |
| # | Avg | Max | Min | Avg | Max | Min | Avg | Max | Min | Avg | Max | Min |
| Upper Halite and Others | 11 | 0.098 | 0.203 | 0.010 | 0.07 | 0.08 | 0.01 | 1.8E-06 | 2.0E-06 | 1.0E-06 | 0.10 | 0.10 | 0.10 |
| Upper Halite | 18 | 0.126 | 0.550 | 0.014 |
| Upper Halite and Others (Regional) | 4 | 0.109 | 0.340 | 0.004 | 0.08 | 0.08 | 0.08 | 2.0E-06 | 2.0E-06 | 2.0E-06 | 0.10 | 0.10 | 0.10 |
| Upper Halite (Regional) | 43 | 0.087 | 0.554 | 0.006 |
| Lower Halite | 1 | 0.320 | 0.320 | 0.320 | 0.05 | 0.05 | 0.05 | 1.0E-06 | 1.0E-06 | 1.0E-06 | 0.05 | 0.05 | 0.05 |
| Lower Halite (Regional) | 1 | 0.406 | 0.406 | 0.406 | 0.05 | 0.05 | 0.05 | 1.0E-06 | 1.0E-06 | 1.0E-06 | 0.05 | 0.05 | 0.05 |
| Upper Clastic | 5 | 0.032 | 0.100 | 0.001 | 0.04 | 0.05 | 0.02 | 1.0E-06 | 1.0E-06 | 1.0E-06 | 0.10 | 0.15 | 0.05 |
| Lower Clastic | 1 | 0.500 | 0.500 | 0.500 | 0.04 | 0.05 | 0.03 | 1.0E-06 | 1.0E-06 | 1.0E-06 | 0.04 | 0.05 | 0.03 |
| Volcanic/Gypsum/Clastic | 13 | 0.145 | 0.558 | 0.004 | 0.05 | 0.05 | 0.05 | 1.0E-06 | 1.0E-06 | 1.0E-06 | 0.09 | 0.10 | 0.05 |
| Volcanic/Gypsum/Clastic (Regional) | 17 | 0.168 | 0.519 | 0.003 | 0.05 | 0.05 | 0.05 | 1.6E-06 | 1.6E-06 | 1.6E-06 | 0.05 | 0.05 | 0.05 |
| Ignimbrite | 0 | | | | 0.13 | 0.20 | 0.05 | 1.0E-06 | 1.0E-06 | 1.0E-06 | 0.13 | 0.20 | 0.05 |
| Sediment East | 3 | 0.003 | 0.006 | 0.001 | 0.13 | 0.20 | 0.05 | 1.0E-06 | 1.0E-06 | 1.0E-06 | 0.14 | 0.20 | 0.05 |
| Sediment West | 0 | | | | 0.08 | 0.10 | 0.05 | 1.0E-06 | 1.0E-06 | 1.0E-06 | 0.08 | 0.10 | 0.05 |
| Transition Zone | 0 | | | | 0.12 | 0.20 | 0.05 | 1.0E-06 | 1.0E-06 | 1.0E-06 | 0.12 | 0.20 | 0.05 |
Note: # number of tests
Source: SRK 2021
In some units, the average simulated hydraulic conductivity significantly exceeds the measured average values. However, simulated K in most cases ranges between measured maximum and minimum. It should be noted that the calibration period represents the largest hydraulic stress in the groundwater system. The numerical model was able to reproduce this stress by using the simulated hydraulic parameters presented in Table 12-3 and Table 12-4. On the other hand, measured values from pumping and packer tests produce a significantly smaller hydraulic stress, and do not necessarily represent the long-term K and Sy values.
The groundwater model did not simulate density-driven groundwater flow. Therefore, a low-K zone was implemented in the model at the known freshwater/saltwater interface at the margin of the salar, to reduce mixing of lateral freshwater inflows with salt water.
Solute transport properties have no measured values in Salar de Atacama. Dispersion (transversal, longitudinal, and vertical), diffusion and effective porosity were assumed based on the QP’s experience in similar deposits and the calibration process. Table 12-5 present a summary of the simulated solute transport properties. Dispersion and diffusion coefficients were uniformly assigned in the groundwater model.
| | | | | |
SalardeAtacama_SEC_Report_515800.040 | December 2022 |
SRK Consulting (U.S.), Inc.
| | | | | |
SEC Technical Report Summary – Salar de Atacama | Page 136 |
Table 12-5: Simulated Other Solute Transport Properties
| | | | | | | | | | | |
| Transport Parameter | Value | Units |
| Dispersion Coefficient | Longitudinal | 20 | (m) |
| Transverse | 2 | (m) |
| Vertical | 0.2 | (m) |
| Molecular Diffusion | 8.64x10⁻⁵ | (m2/day, model units) |
1x10⁻⁹ | (m2/s, standard units) |
Source: SRK 2021
12.1.4Calibration and Predictive Simulations Simulated Pre-Development Conditions
Lithium mining activities occurred before 1997; however, there are no reliable data of pumping rates, water levels, or lithium concentration for that period. The pre-development model simulates equilibrium conditions before 1997 considering natural groundwater flow conditions only (no pumping). Even though this steady-state model represents a starting point for the calibration process and does not represent a target of calibration by itself, the conceptual hydrologic fluxes in Salar de Atacama (VAi, 2021) were used as calibration targets in this model. Table 12-6 shows the conceptual and simulated fluxes for the pre-pumping natural conditions. The intermedial marginal zone has 42.7% of discrepancy, however it represents a small part of the total flux in the nucleus, which has 3.9% of discrepancy.
| | | | | |
SalardeAtacama_SEC_Report_515800.040 | December 2022 |
SRK Consulting (U.S.), Inc.
| | | | | |
SEC Technical Report Summary – Salar de Atacama | Page 137 |
Table 12-6: Simulated Hydrologic Fluxes for Steady-State Conditions
| | | | | | | | | | | | | | | | | | | | | | | | | | |
| Zone | Inflows (L/s) | Outflows (L/s) | Discrepancy (%) |
| Conceptual Hydrologic Balance | Simulated | Conceptual Hydrologic Balance | Simulated |
| Groundwater | Stream/Lagoon | Groundwater | Stream/Lagoon | Total | Total |
| Sub-Basins Reporting to Marginal Zone | SubC 6 | 200 | 14 | 200 | 8.5 | 214 | 177 | -17.1% |
| SubC 7 | 425 | 7 | 425 | 6.9 | 436 | 380 | -12.9% |
| SubC 8 & 9 | 389 | 9 | 389 | 5.5 | 398 | 417 | 4.8% |
| SubC 10a * | 611 | 4 | 611 | 2.2 | 615 | 586 | -4.7% |
| Subtotal | 1,625 | 34 | 1,625 | 23.2 | 1,663 | 1,560 | -6.2% |
| Nucleus | Intermedial Marginal Zone ** | - | 59 | 0 | 59 | 202 | 288 | 42.7% |
| Nucleus *** | 0 | 265 | 0 | 270 | 1,057 | 1,020 | -3.5% |
| Lateral Recharge from West | 207 | 0 | 207 | 0 | - | 0 | 0.0% |
| Lateral Recharge from North | 684 | 0 | 684 | 0 | - | 0 | 0.0% |
| Subtotal | 891 | 324 | 891 | 329.0 | 1,259 | 1,308 | 3.9% |
| Total | 2,516 | 358 | 2,516 | 352.2 | 2,922 | 2,868 | -1.8% |
Source: SRK, 2021
(*) Sub-basin 10b is not included in the original Hydrologic Balance
(**) Infiltration form Soncor Lagoon (25 L/s) is included
(***) Infiltration form Peine Lagoon (11 L/s) is included
| | | | | |
SalardeAtacama_SEC_Report_515800.040 | December 2022 |
SRK Consulting (U.S.), Inc.
| | | | | |
SEC Technical Report Summary – Salar de Atacama | Page 138 |
The 3D distribution of lithium concentrations in the model domain, as initial conditions for the transient calibration simulation, were calculated from interpolation of available concentration data. Geochemical data at the Albemarle property are not available prior to the year 1999. Moreover, most monitoring locations had continuous lithium concentration data from recent years only. Outside the Albemarle claims, a few data points in the shallow subsurface were available from Kunasz and Bell (1979) and several from SQM (SQM, 2020) with data from 2011 and 2017-2018. To achieve a salar-wide distribution of lithium, average concentrations from each location – 431 in total – were interpolated in 3D space using a kriging technique via the Vulcan software (Maptek Pty Ltd, 2019). The kriging parameters and zonation were similar to those used for the resource estimate, as described in Section 11.
12.1.5Simulated Historical Operations
The transient calibration model of historical lithium mining activities was simulated from November 1997 through September 2018. Historical water levels, lithium concentration, and achieved pumping rates served as calibration targets.
Groundwater levels from 182 monitoring wells across the entire Salar de Atacama were used for water level calibration, with a total of 20,786 individual water level measurements during the transient calibration period. These water level measurements were obtained from an Albemarle historical database included in the 2019 environmental report (SGA, 2019) and Albemarle operational database; and from an SQM environmental report (SQM, 2020).
Lithium concentrations in groundwater were available for 86 monitoring locations, with a total number of 5,282 individual concentration measurements during the transient calibration period. The earliest available concentration data were from January of 1999. Lithium concentration data were obtained from the Albemarle historical database (Albemarle, 2021).
Historical brine pumping from 92 wells and 10 trenches on the Albemarle property were available through August 2021, and from 180 wells on the SQM property through July 2021. Albemarle freshwater withdrawal from three wells were available through August 2021 and SQM freshwater withdrawal from six wells through August 2021. A timeline of historical Albemarle and SQM pumping rates is provided in Figure 12-6, along with SQM brine injection rates (four locations). The total simulated Albemarle pond seepage did not surpass 5% of the total brine pumping rate.
| | | | | |
SalardeAtacama_SEC_Report_515800.040 | December 2022 |
SRK Consulting (U.S.), Inc.
| | | | | |
SEC Technical Report Summary – Salar de Atacama | Page 139 |
Note: Graphs include transition period (October 2018 to August 2021)
Source: SRK 2021
Figure 12-6: Pumping Rates used for Transient Calibration
Figure 12-7 presents the comparison between observed and simulated water levels at the year 2018 (average data in form of a quality line), i.e., at the end of the transient calibration period. Table 12-7 lists calibration statistics for this period. A notable statistic is the scaled root mean square error (RMSE) of 4.3. An RMSE statistic below 10% is generally considered as adequate calibration. Several representative hydrographs showing observed and simulated water levels over time are included in Figure 12-8. The top 12 hydrographs are from monitoring locations on the Albemarle property, while the bottom three are from other locations in the salar. Overall, in the QP’s opinion, simulated water levels replicate observed water levels well.
| | | | | |
SalardeAtacama_SEC_Report_515800.040 | December 2022 |
SRK Consulting (U.S.), Inc.
| | | | | |
SEC Technical Report Summary – Salar de Atacama | Page 140 |
Source: SRK 2021
Figure 12-7: Comparison of Simulated and Observed Water Levels in the Year 2018 (Average Data)
| | | | | |
SalardeAtacama_SEC_Report_515800.040 | December 2022 |
SRK Consulting (U.S.), Inc.
| | | | | |
SEC Technical Report Summary – Salar de Atacama | Page 141 |
Table 12-7: Statistics of Transient Model Calibration to Observed Water Levels, 2018 Average
Source: SRK, 2021
(1) Where R is the residual (observed minus simulated)
| | | | | |
SalardeAtacama_SEC_Report_515800.040 | December 2022 |
SRK Consulting (U.S.), Inc.
| | | | | |
SEC Technical Report Summary – Salar de Atacama | Page 142 |
Source: SRK 2021
Figure 12-8: Water Level Comparison Hydrographs in Select Wells
The overall groundwater budget for the end of the transient simulation is presented in Table 12-8. The overall water balance error is –1.8% for the transient calibration period, which support a valid solution for the numerical simulation.
| | | | | |
SalardeAtacama_SEC_Report_515800.040 | December 2022 |
SRK Consulting (U.S.), Inc.
| | | | | |
SEC Technical Report Summary – Salar de Atacama | Page 143 |
Table 12-8: Water Balance at End of Transient Calibration (Sep 2018)
| | | | | |
| Flow Component | Flow Rate (L/s) |
| Inputs to Groundwater System |
| Recharge |
| Lateral | 2,407 |
| Direct Precipitation | - |
| Lagunas | 50 |
| Artificial Injection |
| SQM Injection | 315 |
| Albemarle Pond Leakage | 15 |
| Groundwater Storage Release | 611 |
| Total | 3,398 |
| Outputs from Groundwater System |
| Evapotranspiration | 1,409 |
| Surface Water Outflow | 125 |
| Pumping |
| Albemarle Freshwater Extraction | 6 |
| Albemarle Brine Extraction | 321 |
| SQM Freshwater Extraction | 172 |
| SQM Brine Extraction | 1,012 |
| Groundwater Storage Replenishment | 415 |
| Total | 3,459 |
| Percent Difference | -1.8% |
Source: SRK 2021
Figure 12-9 A presents calibration to lithium concentrations for the year 2018, with data points grouped by the monitoring location according to Albemarle claim properties (A1 through A3), and outside the Albemarle property. Figure 12-9 B focuses only on targets at the Albemarle property, with circle sizes corresponding to historical operational pumping rates at each location (smallest circle sizes indicate monitoring wells without pumping). Table 12-9 provides a statistical summary for this calibration. Overall, the model tends to underpredict lithium concentrations on the Albemarle property for 2018, which suggests a conservative starting point for the predictive simulations.
| | | | | |
SalardeAtacama_SEC_Report_515800.040 | December 2022 |
SRK Consulting (U.S.), Inc.
| | | | | |
SEC Technical Report Summary – Salar de Atacama | Page 144 |
Source: SRK 2021
Figure 12-9: Observed vs Simulated Lithium Concentrations,) All Calibration Targets, B) Targets on Albemarle Property, Circle Size 2018 Averages. A Weighted by Historical Operational Pumping Rate.
| | | | | |
SalardeAtacama_SEC_Report_515800.040 | December 2022 |
SRK Consulting (U.S.), Inc.
| | | | | |
SEC Technical Report Summary – Salar de Atacama | Page 145 |
Table 12-9: Statistics of Transient Model Calibration to Lithium Concentrations, 2018 Average
Source: SRK 2021
Figure 12-10 A shows the average lithium concentration in the extracted brine, both historical and simulated. The model tends to overpredict concentrations in the beginning of the simulation, when overall pumping rates are low, and underpredicts average concentrations starting in 2019. This underestimation is interpreted to reflect a conservative starting point for the predictive simulations. Another measure of calibration quality is shown in Figure 12-10 B, where simulated cumulative mass of historically-extracted lithium by Albemarle is compared to known calculated produced mass from two water quality data databases provided to SRK. In SRK’s opinion, the model reasonably reproduces the cumulative extraction of lithium over time.
The average lithium mass transfer rates in the calibration period are shown in the Table 12-10. As expected, pumping wells represent the main loss of lithium mass from groundwater (247,700 kilograms per day [kg/d]), followed by evaporation (88,430 kg/d). The main source of lithium gains in groundwater is groundwater storage, and to a minor degree, the artificial injection and natural lateral recharge.
| | | | | |
SalardeAtacama_SEC_Report_515800.040 | December 2022 |
SRK Consulting (U.S.), Inc.
| | | | | |
SEC Technical Report Summary – Salar de Atacama | Page 146 |
Table 12-10: Average Lithium Mass Transfer Rate for Calibration Period
| | | | | |
| Component | Mass Rate (Kg/day) |
| Lithium Gain in Groundwater |
| Boundary Recharge and artificial recharge (ALB ponds and SQM Injection) | 87,320 |
| Storage Release | 373,150 |
| Total Gain | 460,470 |
| Lithium Loss in Groundwater |
| Pumping wells | 246,700 |
| Surface Water (Drain cells) | 6,320 |
| Plant Uptake and Chemical Precipitation | 88,430 |
| Storage Replenishment | 119,020 |
| Total Loss | 460,470 |
| Percent Difference | 0.00% |
Source: SRK 2021
Source: SRK 2021
Notes: Graphs include transition period (October 2018 to August 2021). Brinechem is the primary hydro-chemical database prepared by Albemarle. Chemistry_dt is the alternative hydro-chemical data base prepared by Albemarle.
Figure 12-10: Comparison of Measured and Simulated Average Lithium Concentration and Cumulative Lithium Mass Extraction
Calibration of the model to mass extracted by the production wellfield annually and comparison of simulated to observed lithium concentration versus cumulative production pumping are both reasonable. Calibration of the model to the mass extraction rate at the end of 2018 also looks reasonable. It is SRK’s opinion that the numerical model adequately represents the historical and
| | | | | |
SalardeAtacama_SEC_Report_515800.040 | December 2022 |
SRK Consulting (U.S.), Inc.
| | | | | |
SEC Technical Report Summary – Salar de Atacama | Page 147 |
current wellfield production of lithium from the basin and can be used for future production plans to support a reserve estimate
Validation period has a reasonable representation of the simulated water levels. The calibration graph shows an average residual mean of 0.88 and scaled RMS of 5.4%. Figure 12-11 present the average calibration during the year 2021.
Figure 12-11: Comparison of Simulated and Observed Water Levels in the Year 2021 (Average Data)
12.1.6Predictive Simulations
Predictive simulations include a transition period from October 2018 to August 2021, and a production plan period from September 2021 to March 2042 (end of pumping).
Historical brine pumping data from the Albemarle property were available through August 2021; in addition, planned production pumping for September 2021 through March 2042 were available (Albemarle pumping plan 2020 was assumed). Projected Albemarle brine pumping includes 72 wells and trenches, with pumping rates up to 30 L/s for a given well location and from 315 to 532 L/s for the entire system (Albemarle, 2020). Details of well location and screen intervals are explained in Section 13.
Projected SQM brine pumping rates were used in the transition and predictive models starting in October 2018 and are scheduled to terminate at the end of December 2030 (SQM, 2020). Projected
| | | | | |
SalardeAtacama_SEC_Report_515800.040 | December 2022 |
SRK Consulting (U.S.), Inc.
| | | | | |
SEC Technical Report Summary – Salar de Atacama | Page 148 |
SQM brine pumping includes 144 wells, with pumping rates up to 112.1 L/s for a given location and from 616 to 2,723 L/s for the entire system.
Brine pumping rates for the Albemarle and SQM properties are shown in Figure 12-12 and well locations are shown in Figure 12-13. Seepage from the Albemarle processing ponds and brine injections at the SQM property were not included in the base case predictive simulation.
Source: SRK 2021
Figure 12-12: Simulated Brine Total Planned Pumping Rates for The Albemarle and SQM Properties
| | | | | |
SalardeAtacama_SEC_Report_515800.040 | December 2022 |
SRK Consulting (U.S.), Inc.
| | | | | |
SEC Technical Report Summary – Salar de Atacama | Page 149 |
Source: SRK 2021
Figure 12-13: Location of the Pumping Wells at Albemarle and SQM Properties Used for Predictive Simulations
| | | | | |
SalardeAtacama_SEC_Report_515800.040 | December 2022 |
SRK Consulting (U.S.), Inc.
| | | | | |
SEC Technical Report Summary – Salar de Atacama | Page 150 |
Projected Albemarle freshwater withdrawals were assumed to be constant throughout the predictive simulations. Projected SQM freshwater withdrawals correspond to maximum legal flowrate (240 L/s). Projected freshwater pumping rates are listed in Table 12-11.
Table 12-11: Simulated Predictive Freshwater Withdrawals
| | | | | |
| Owner | Projected Pumping Rate (L/s) |
| Albemarle | 18.1 |
| SQM | 240.0 |
Source: SRK, 2021
A summary of groundwater inflows and outflows at the end of the transient calibration, the end of SQM brine pumping, and at the end of Albemarle pumping are presented in Table 12-12. Recharge inputs to the groundwater system and evapotranspiration outputs vary among the time snapshots because they represent different months of the year. However, decline in evapotranspiration and surface water outflows from September 2018 to March 2042 can be attributed to the decline in water levels in the salar and along its margins. The water balance error averages 1.2% for the predictive model period. Figure 12-14 shows all the components of the water balance in the calibration and predictive periods.
Table 12-12: Groundwater Balance Summary
| | | | | | | | | | | |
| Flow Component | End of Transient Calibration (Sep 2018) | End of SQM Extraction (Dec 2030) | End of Albemarle Extraction (March 2042) |
| Inflows to Groundwater System |
| Recharge |
| Lateral | 2,407 | 2,374 | 2,312 |
| Direct Precipitation | - | - | 14 |
| Infiltration from Lagunas | 50 | - | 36 |
| Artificial Injection/Infiltration |
| SQM Injection | 315 | - | - |
| Albemarle Pond Leakage | 15 | - | - |
| Groundwater Storage Release | 611 | 2,710 | 179 |
| Total | 3,398 | 5,083 | 2,540 |
| Outflows from Groundwater System |
| Evapotranspiration | 1,409 | 1,711 | 1,571 |
| Surface Water Outflow | 125 | 55 | 56 |
| Pumping |
| Albemarle Freshwater | 6 | 16 | 16 |
| Albemarle Brine | 321 | 469 | 499 |
| SQM Freshwater | 172 | 240 | - |
| SQM Brine | 1,012 | 2,618 | - |
| Groundwater Storage Replenishment | 415 | 16 | 367 |
| Total | 3,459 | 5,126 | 2,509 |
| Percent Difference | -1.8% | -0.85% | 1.22% |
Source: SRK 2021
| | | | | |
SalardeAtacama_SEC_Report_515800.040 | December 2022 |
SRK Consulting (U.S.), Inc.
| | | | | |
SEC Technical Report Summary – Salar de Atacama | Page 151 |
Source: SRK, 2021
Figure 12-14: Components of Water Balance for All Simulated Periods
| | | | | |
SalardeAtacama_SEC_Report_515800.040 | December 2022 |
SRK Consulting (U.S.), Inc.
| | | | | |
SEC Technical Report Summary – Salar de Atacama | Page 152 |
Lithium mass flux components throughout all simulated periods are shown in Figure 12-15 and the distribution of the simulated lithium concentration in Figure 12-16. Solute transport simulation presents a percent difference lower than 0.01% during calibration and predictive model periods.
| | | | | |
SalardeAtacama_SEC_Report_515800.040 | December 2022 |
SRK Consulting (U.S.), Inc.
| | | | | |
SEC Technical Report Summary – Salar de Atacama | Page 153 |
Source: SRK 2021
Figure 12-15: Components of Lithium Mass Transfer Rate for All Simulated Periods
| | | | | |
SalardeAtacama_SEC_Report_515800.040 | December 2022 |
SRK Consulting (U.S.), Inc.
| | | | | |
SEC Technical Report Summary – Salar de Atacama | Page 154 |
Figure 12-16: Distribution of Simulated Lithium Concentration in the beginning and End of the Prediction Period
| | | | | |
SalardeAtacama_SEC_Report_515800.040 | December 2022 |
SRK Consulting (U.S.), Inc.
| | | | | |
SEC Technical Report Summary – Salar de Atacama | Page 155 |
12.2Mineral Reserves Estimates
Using the hydrogeologic properties of the salar combined with the wellfield design parameters, the rate and volume of lithium projected to be extracted from the Project area was simulated using the predictive model. The predictive model output generated a brine production profile appropriate for the salar based upon the wellfield design assumptions with a maximum pumping rate of 442 L/s (i.e., maximum authorized extraction rate) over a period of 21 years (through March 2042). The use of a 21-year period reflects the timing required to extract the full, authorized quota of lithium production. Given the approximately two years delay in timing from pumping to final production, this also is the last year that extraction from the salar can be reasonably expected to still result in lithium produced by the 2043 expiry of Albemarle’s production quota. See Section 16.3.1 for more discussion of the quota and regulatory limits on lithium extraction.
The predicted monthly and annual average extracted lithium concentrations, and the predicted cumulative mass of lithium extracted from groundwater at the Albemarle property are plotted in Figure 12-17. The annual-average lithium concentrations, mass lithium in extracted brine, annual-average pumping rates and annual volumetric brine pumping are summarized in Table 12-13. Additional details on the wellfield design and pumping schedule are discussed in Section 13.
SRK cautions that this prediction is a forward-looking estimate and is subject to change depending upon operating approach (e.g., pumping rate, well location/depth) and inherent geological uncertainty. The schedule includes summaries for observed pumping and lithium from 2018 through the August of 2021 as this production is required to support the first 24 months of production in the economic model. This brine is currently going through the evaporation process, is treated as work in process inventory and is reported separately on the reserve table for clarity.
The seasonal concentration fluctuations in Figure 12-18 correspond to seasonal fluctuations in pumping rates. The predictive model simulates a decline of annual-average lithium concentrations from 2,221 mg/L in last trimester of 2021 to 1,830 mg/L at the end of pumping (March 2042). Annual lithium mass extraction from groundwater is predicted to decline from 31,563 MT in the year 2022 (first full year of pumping) to 26,447 MT in the year 2041, and lastly to 7,171 MT in the year 2042 (note that pumping is scheduled for 3 months in 2042). The predicted cumulative lithium mass extraction, from September 2021 to March 2042, is 590,862. Figure 12-18 shows the projected annual mass of lithium extracted by production wellfield.
| | | | | |
SalardeAtacama_SEC_Report_515800.040 | December 2022 |
SRK Consulting (U.S.), Inc.
| | | | | |
SEC Technical Report Summary – Salar de Atacama | Page 156 |
Source: SRK, 2021
Figure 12-17: Projected Wellfield Average Lithium Concentration
| | | | | |
SalardeAtacama_SEC_Report_515800.040 | December 2022 |
SRK Consulting (U.S.), Inc.
| | | | | |
SEC Technical Report Summary – Salar de Atacama | Page 157 |
Table 12-13: Predicted Lithium and Brine Extractions
| | | | | | | | | | | | | | |
| Period | Li Mass | Pumping | Li Conc. |
| Li Mass (MT) | Rate (L/s) | Vol (m3) | mg/L |
| 2021 Sep-Dec | 11,285 | 482 | 5,076,315 | 2,223 |
| 2022 | 31,563 | 441 | 13,913,454 | 2,268 |
| 2023 | 31,157 | 442 | 13,924,730 | 2,238 |
| 2024 | 31,149 | 442 | 13,974,710 | 2,229 |
| 2025 | 30,696 | 442 | 13,930,955 | 2,203 |
| 2026 | 30,392 | 442 | 13,930,955 | 2,182 |
| 2027 | 29,939 | 442 | 13,930,955 | 2,149 |
| 2028 | 29,510 | 442 | 13,974,710 | 2,112 |
| 2029 | 29,020 | 442 | 13,930,955 | 2,083 |
| 2030 | 28,727 | 442 | 13,930,955 | 2,062 |
| 2031 | 28,447 | 442 | 13,930,955 | 2,042 |
| 2032 | 28,280 | 442 | 13,974,710 | 2,024 |
| 2033 | 27,958 | 442 | 13,930,955 | 2,007 |
| 2034 | 27,694 | 442 | 13,930,955 | 1,988 |
| 2035 | 27,474 | 442 | 13,930,955 | 1,972 |
| 2036 | 27,351 | 442 | 13,974,710 | 1,957 |
| 2037 | 27,052 | 442 | 13,930,955 | 1,942 |
| 2038 | 26,837 | 442 | 13,930,955 | 1,926 |
| 2039 | 26,569 | 442 | 13,930,955 | 1,907 |
| 2040 | 26,447 | 442 | 13,974,710 | 1,893 |
| 2041 | 26,145 | 442 | 13,930,955 | 1,877 |
| 2042 Jan - Mar | 7,171 | 493 | 3,919,362 | 1,830 |
Source: SRK 2021
Source: SRK
Figure 12-18: Projected Annual Mass of Lithium Extracted by Production Wellfield
| | | | | |
SalardeAtacama_SEC_Report_515800.040 | December 2022 |
SRK Consulting (U.S.), Inc.
| | | | | |
SEC Technical Report Summary – Salar de Atacama | Page 158 |
12.3Cut-Off Grades Estimates
Due to the extraction of lithium from the aquifer, combined with mixing of freshwater inflows or low-grade brines, the concentration of lithium in brine pumped from the mineral resource decreases over time. While there is some ability to selectively extract areas of the mineral resource with higher grades by targeting the location of new extraction wells, the impact of dilution cannot be fully avoided. Therefore, as the brine concentration declines over time, the quantity of lithium production, for the same pumping rate, also declines. As lithium brine production operations have relatively high fixed costs, eventually the quantity of lithium contained in the extracted brine is not adequate to cover the cost of operating the business.
As discussed in Section 19, the economic model provides positive operating cash flow for the entire life of the reserve, so it is clear that the entirety of the reserve estimated herein is above the economic cutoff grade, utilizing the assumptions described in that section. This includes the use of a long-term price assumption for technical grade lithium carbonate of $10,000/t (see Section 16 for discussion on the basis of this assumption).
While the pumping plan supporting this reserve estimate is above the economic cutoff grade for the operation, for the purposes of disclosure and resource estimation, SRK calculated an approximate breakeven cutoff grade for the operation. To calculate the breakeven cutoff grade, SRK utilized the economic model and manually adjusted the input brine concentration downward until the after-tax cash flow hit a value of zero. This estimate effectively includes all operating costs in the business as well as sustaining capital with other inputs such as lower process recovery with lower concentration also being accounted for. Note that expansion capital in the model (effectively the cost to complete La Negra III) has been excluded as it is more appropriately viewed as development capital, in the QP’s opinion, and therefore not typically included in a cutoff grade estimate.
Based on this modeling exercise, SRK estimates that the breakeven cutoff grade at the assumptions outlined in Section 19, including the reserve price of $10,000 / metric tonne of technical grade lithium carbonate, is approximately 783 mg/l Li (for comparison, the last year of pumping in the approximately 21-year life of mine plan has a lithium concentration of 1,940 mg/l).
12.4Reserves Classification and Criteria
When estimating brine resources and reserves, different models are utilized to define those resources and reserves. The resource model presents a static, in situ measurement of potentially extractable brine volume whereas the reserve model (i.e., the predictive model) presents a dynamic simulation of brine that can potentially be pumped through extraction wells. As such, the predictive model does not discriminate between brine derived from inferred, measured, or indicated resources. Further, a brine resource is dynamic and is constantly influenced by water inflows (e.g., precipitation, groundwater inflows, pond leakage, etc.) and pumping activities which cause varying levels of mixing and dilution. Therefore, direct conversion of measured and indicated classification to proven and probable reserves is not practical. As the direct conversion is not practical, in the QP’s opinion, the most defensible approach to classification of reserves (e.g., proven versus probable) is to utilize a time-dependent approach as the QP has the highest confidence in the early years of the predictive model results, with a steady erosion of that confidence over time.
Therefore, in the context of time-dependent risk, in the QP’s opinion, the production plan through the end of 2031 approximately 10.3 years of pumping) is reasonably classified as a proven reserve with
| | | | | |
SalardeAtacama_SEC_Report_515800.040 | December 2022 |
SRK Consulting (U.S.), Inc.
| | | | | |
SEC Technical Report Summary – Salar de Atacama | Page 159 |
the remainder (10.3 years) of production classified as probable. Notably, this results in approximately 49% of the reserve being classified as proven and 51% of the reserve being classified as probable. For comparison, the measured resource comprises approximately 52% of the total measured and indicated resource. In the QP’s opinion, this is reasonable as the overall geological and technical uncertainty for the Salar de Atacama resource and reserve are similar.
12.5Summary Mineral Reserves
The estimation of mineral reserves herein has been completed in accordance with CFR 17, Part 229 (S-K 1300). Mineral reserves were estimated utilizing a lithium carbonate price of US$10,000/t of technical grade Li2CO3. Appropriate modifying factors have been applied as discussed through this report. The positive economic profile of the mineral reserve is supported by the economic modeling discussed in Section 19 of this report.
Table 12-14 presents the Salar de Atacama mineral reserves as of August 31, 2021.
| | | | | |
SalardeAtacama_SEC_Report_515800.040 | December 2022 |
SRK Consulting (U.S.), Inc.
| | | | | |
SEC Technical Report Summary – Salar de Atacama | Page 160 |
Table 12-14: Salar de Atacama Mineral Reserves, Effective August 31, 2021
| | | | | | | | | | | | | | | | | | | | |
| Proven Reserve | Probable Reserve | Proven and Probable Reserve |
| Contained Li (Metric Tonnes x 1000) | Li Concentration (mg/L) | Contained Li (Metric Tonnes x 1000) | Li Concentration (mg/L) | Contained Li (Metric Tonnes Li x 1000) | Li Concentration (mg/L) |
| In Situ | 312 | 2,162 | 279 | 1,948 | 591 | 2,061 |
| In Process | 24 | 2,685 | 0 | 0 | 24 | 2,685 |
Source: SRK, 2021
•In process reserves quantify the prior 24 months of pumping data and reflect the raw brine, at the time of pumping. These reserves represent the first 24 months of feed to the lithium process plant in the economic model.
•Proven reserves have been estimated as the lithium mass pumped during Years 2020 through 2030 of the proposed Life of Mine plan
•Probable reserves have been estimated as the lithium mass pumped from 2030 until the end of the proposed Life of Mine plan (2041)
•Reserves are reported as lithium metal
•This mineral reserve estimate was derived based on a production pumping plan truncated in March 2042 (i.e., approximately 21 years). This plan was truncated to reflect the projected depletion of Albemarle’s authorized lithium production quota.
•The estimated economic cutoff grade for the Project is 783 mg/l lithium, based on the assumptions discussed below. The truncated production pumping plan remained well above the economic cutoff grade (i.e., the economic cutoff grade did not result in a limiting factor to the estimation of the reserve).
◦A technical grade lithium carbonate price of US$10,000 / metric tonne CIF Asia.
◦Recovery factors for the salar operation increase gradually over the span of 4 years, from the current 40% to the proposed SYIP 65% recovery in 2025. After that point, evaporation pond recovery is assumed constant at 65%, considering the installation of a liming plant is assumed in 2027. An additional recovery factor of 80% lithium recovery is applied to the La Negra lithium carbonate plant.
◦A fixed average annual brine pumping rate of 442 l/s is assumed, consistent with Albemarle’s permit conditions.
◦Operating cost estimates are based on a combination of fixed brine extraction, G&A and plant costs and variable costs associated with raw brine pumping rate or lithium production rate. Average life of mine operating cost is calculated at approximately $3,000/metric tonne CIF Asia.
◦Sustaining capital costs are included in the cutoff grade calculation and post the SYIP installation, average around US$54M per year.
◦Government royalties are excluded from the cutoff grade calculation as these costs are variable, depending upon price. A 3.5% community royalty is included in the cutoff grade as this royalty is fixed.
•Mineral reserve tonnage, grade and mass yield have been rounded to reflect the accuracy of the estimate and numbers may not add due to rounding.
•SRK Consulting (U.S.) Inc. is responsible for the mineral reserves with an effective date: August 31, 2021. The geologic block model is incorporating all relevant exploration data as of June 30, 2020 and there is no additional data since that date. The resource has been depleted to August 31, 2021.
| | | | | |
SalardeAtacama_SEC_Report_515800.040 | December 2022 |
SRK Consulting (U.S.), Inc.
| | | | | |
SEC Technical Report Summary – Salar de Atacama | Page 161 |
In the QP’s opinion, key points of uncertainty associated with the modifying factors in this reserve estimate that could have a material impact on the reserve include the following:
•Resource dilution: the reserve estimate included in this report assumes that the salar brine is replenished at its boundaries at certain rates and with certain chemical composition. Changes in the rate of inflows, versus those assumed, will impact the reserve. For example, an increase in the magnitude of lateral flows into the salar could act to dilute the brine and reduce lithium concentrations in extraction wells, primarily in the southwest area of the Albemarle property. Figure 12-19 compares simulations with an increasing in the lithium concentration in the inflows from sub-catchment 11 (scenarios 2 and 3). These scenarios show minimum changes in the predicted average lithium concentration.
•Initial lithium concentration: The current initial concentration was estimated based on the best data available by space distribution and date (2018 –2019 sampling campaign), which was assigned to the year 1999 as initial condition for calibration purposes. This assumption underestimates the lithium concentration at the beginning of the production. In order to illustrate this effect of the initial lithium concentration, the lithium distribution mentioned above was set up at the end of the transition model (August 2021). As a result, the average lithium concentrations increase by 9% (Figure 12-19, scenario 1).
•Seepage from processing ponds: the predictive simulations did not consider potential seepage of concentrated brine from the processing pond. Such seepage may have two opposing effects: on one hand loss of lithium mass between extraction from groundwater and production of lithium carbonate at the end of the concentration process, and on the other hand replenishing groundwater with lithium that could be captured by extraction wells. Figure 12-19 compares the annual-averaged lithium concentration in extracted brine, between the base estimate, which does not include pond seepage, and a predictive simulation with pond seepage up to 2% and 5% of extracted brine (scenarios 6 and 7)). This example sensitivity simulation predicts that pond seepage would result in average lithium concentrations increase of approximately 10% at the end of production as compared to the base case.
•Freshwater/brine mixing: the numerical model implicitly simulated the density separation of lateral freshwater recharge and salar brine by imposing a low-conductivity zone at the brine-freshwater interface. It is possible that lateral recharge of freshwater into the salar may increase without this restriction, as the water table declines as a result of pumping and reducing the amount of freshwater lost to evaporation at the periphery of the salar. Figure 12-19 compares the base case annual-averaged lithium in extracted brine with a scenario where the hydraulic conductivity at the freshwater/brine interface was increased by half an order of magnitude (scenario 4). This scenario resulted in no material change compared to the base case.
•Hydrogeological assumptions: factors such as specific yield and hydraulic conductivity play a key role in estimating the volume of brine available for extraction in the wellfield and the rate it can be extracted. Actual contacts between hydrogeological units may not be exactly as represented in the numerical model. These factors are variable through the salar and are difficult to directly measure. Hydraulic conductivities and
| | | | | |
SalardeAtacama_SEC_Report_515800.040 | December 2022 |
SRK Consulting (U.S.), Inc.
| | | | | |
SEC Technical Report Summary – Salar de Atacama | Page 162 |
specific yields lower than assumed in the numerical model would result in reduced pumpability and reduced lithium mass extraction. Specific yields and porosities lower than assumed in the model would lead to faster migration of fresh / brackish water from the edges of the salar and dilution of lithium concentrations in extraction wells. Figure 12-19 is a sensitivity that compares the base case estimate of annual-averaged extracted lithium with a scenario where effective porosities in the upper part of the salar were reduced by 20% (scenario 5). This scenario resulted in average lithium concentrations reduction of approximately 5% at the end of production as compared to the base case.
•Lithium carbonate price: although the pumping plan remains above the economic cutoff grade discussed in Section 12.33, commodity prices, can have significant volatility which could result in a shortened reserve life.
•Change to SQM pumping plan: the numerical model makes certain assumptions regarding the SQM pumping plan (which terminates at the end of 2030). Overall, SQM has extracted – and is expected to extract – brines at greater rates than Albemarle. SQM pumping has resulted in drawdowns at the salar of up to approximately 14 m in the southwest region of the salar. Enhanced pumping by SQM, or lengthening of the pumping period, may have two effects: reduce available resource in the salar, and draw freshwater at greater rate from the periphery of the salar (dilution effect). Conversely, reduced extraction by SQM would keep available the resources, reducing the dilution effect.
•Process recovery: the ability to extract the full lithium production quota within the defined production period relies upon the ability to increase recovery rates of lithium in the evaporation ponds from historic levels of approximately 40% to a target of approximately 65%. This will require updating the process flow sheet at the salar to reduce lithium losses to precipitated salts. In the QP’s opinion, the assumed recovery rates are reasonable; however, there remains uncertainty in performance of the new process and any material underperformance to these targets could limit Albemarle’s ability to extract its full lithium quota prior to expiry of the quota.
•Lithium production quota: the current production quota acts as a hard stop on the estimated reserve both from a total production mass and time standpoint. The expiry date for production of this lithium is 2043. If raw brine grades, pumping rates or process recoveries underperform forecasts and Albemarle cannot produce the full quota by 2043, this potential reserve will be lost (i.e., it cannot recover lost production in later years and cannot pump faster than the regulatory limit of 442 l/s to offset any underperformance). Conversely, with lithium grades well above economic cutoff and approximately 30% of the estimated mineral resource converting to reserve, the potential to negotiate an additional production quota with the government of Chile presents an opportunity to increase the current reserve, which is artificially constrained by the current quota.
| | | | | |
SalardeAtacama_SEC_Report_515800.040 | December 2022 |
SRK Consulting (U.S.), Inc.
| | | | | |
SEC Technical Report Summary – Salar de Atacama | Page 163 |
Source: SRK 2021
Figure 12-19: Comparison of Predicted Extracted Lithium Concentration between Base Case and Sensitivity Scenarios
| | | | | |
SalardeAtacama_SEC_Report_515800.040 | December 2022 |
SRK Consulting (U.S.), Inc.
| | | | | |
SEC Technical Report Summary – Salar de Atacama | Page 164 |
13Mining Methods
The extraction method for the reserve is pumping of the raw brine from the aquifer utilizing a network of wells and trenches. This method of brine extraction has been used at the Salar de Atacama since 1984. As will be discussed in detail in Section 14, the extracted brine is concentrated using solar energy in a series of evaporation ponds prior to final processing in the lithium carbonate production plant at La Negra.
The brine extraction equipment includes a number of submersible pumps installed inside the production wells whose diameter is variable, generally between 10 inches and 14 inches. The pumps extract a brine with at rate between 5 and 30 L/s.
Shallow wells generally have a depth between 25 and 50 m. The wells walls are stable and have low risk of collapse, which facilitates the entry of brine into the well, thus reducing load losses. In deep wells, which typically have a depth of around 90 m, a seal is normally installed in the annular space of the upper part to a depth of about 25 to 40 m. A screen section is typically installed at the bottom well interval from around 50 m to 90 m.
In RCA 21/2016, which authorized the rate of brine extraction to increase to 300 L/s (achieving the combined 442 L/s combined in areas A1 and A2), the position of pumping wells is not set to pre-determined coordinates. Therefore, as wells degrade from flow depletion, excessive dynamic levels or operational problems and are replaced, they may be set at the same location or moved if desired to optimize pumping results.
For the deep wells, the provisional authorization to pump 120 L/s up to 200 m deep ends in August 2023. By that date, Albemarle will need a new authorization, or an extension of the current one to sustain pumping from deep wells. If not, the operational depth of the deep wells (i.e., the screen interval) must be adjusted to a depth of 50 m or less. SRK’s Life of Mine (LoM) production plan assumes the authorization is not received and pumping reverts to only shallow wells.
HDPE lines, typically 8 inches in diameter from the pumping system feed the pre-concentrator ponds, which are large ponds that regulate the brine chemistry (calcium and sulfate). Another set of HDPE lines, generally 8 inches in diameter, move brine by pumping from the pre-concentration ponds to feed the five evaporation pond systems.
The following elements can be found in the typical scheme of a pumping well:
•Pump
•Impulse pipe
•Valve
•Flow meter
•Split valve
•Backflow valve
•8-inch HDPE pipe to the ponds
Additional equipment at the pump site include a diesel generator, a pump control panel that monitors the pump's working frequency, perimeter fencing, and a telemetry system. Figure 13-1 and Figure 13-2 show the detail of the pumping equipment.
| | | | | |
SalardeAtacama_SEC_Report_515800.040 | December 2022 |
SRK Consulting (U.S.), Inc.
| | | | | |
SEC Technical Report Summary – Salar de Atacama | Page 165 |
Source: GWI, 2019
Figure 13-1: Pumping Well Installation
| | | | | |
SalardeAtacama_SEC_Report_515800.040 | December 2022 |
SRK Consulting (U.S.), Inc.
| | | | | |
SEC Technical Report Summary – Salar de Atacama | Page 166 |
Source: GWI, 2019
Figure 13-2: Surface Pumping Equipment
Other equipment utilized at site to support mining operations is drilling and salt harvesting equipment. Drilling and installation of new production wells is completed by contractors and Albemarle does not own this equipment. Approximately 250 people are assigned to the Salar operations, 100 of them directly to the processing operation.
13.1Wellfield Design
A total of 72 to 75 production wells are modeled to support the annual average permitted brine pumping rate of 442 L/s from 2020 to 2041. The permit details extracting an annual average of 360 L/s from extraction area A1 and an annual average of 82 L/s from the extraction area A2. For reference the A1 and A2 areas can be seen in Figure 7-6.
The schedule considers a reduction of number of wells and screen intervals in July 2023, according to the expiration of the provisional authorization to pump from the deep wells (August 2023). This scenario assumes a restriction in the pumping capacity, if the provisional authorization is extended beyond August 2023, the potential pumpability of the production wells will be increased. The schedule of active production wells is shown in Table 13-1.
Based on information provided by Albemarle, existing production wells require periodic replacement of approximately 5 to 10 wells per year, on average, for the current wellfield. For the purposes of this reserve estimate, SRK has assumed replacement of 10 wells for each full
| | | | | |
SalardeAtacama_SEC_Report_515800.040 | December 2022 |
SRK Consulting (U.S.), Inc.
| | | | | |
SEC Technical Report Summary – Salar de Atacama | Page 167 |
year of production (2021 and 2042 as a trimester assumes three wells). A map showing the predicted locations for the LoM production wells is presented in Figure 13-3.
Table 13-1: Wellfield Development Schedule
| | | | | | | | | | | | | | | | | | | | |
| Period | Number Active Wells at Start of Period | Number Replacement Wells | Number Wells Removed | Number New Wells | Total Number Wells Drilled | Number Active Wells at End of Year |
| Sept.2021 | 73 | 3 | 0 | 0 | 3 | 72 |
| 2022 | 72 | 10 | 0 | 0 | 10 | 72 |
| 2023 | 72 | 10 | 17 | 17 | 27 | 72 |
| 2024 | 72 | 10 | 0 | 0 | 10 | 72 |
| 2025 | 72 | 10 | 0 | 0 | 10 | 72 |
| 2026 | 72 | 10 | 0 | 0 | 10 | 72 |
| 2027 | 72 | 10 | 0 | 0 | 10 | 72 |
| 2028 | 72 | 10 | 0 | 0 | 10 | 72 |
| 2029 | 72 | 10 | 0 | 0 | 10 | 72 |
| 2030 | 72 | 10 | 0 | 0 | 10 | 72 |
| 2031 | 72 | 10 | 0 | 0 | 10 | 72 |
| 2032 | 72 | 10 | 0 | 0 | 10 | 72 |
| 2033 | 72 | 10 | 0 | 0 | 10 | 72 |
| 2034 | 72 | 10 | 0 | 0 | 10 | 72 |
| 2035 | 72 | 10 | 0 | 0 | 10 | 72 |
| 2036 | 72 | 10 | 0 | 0 | 10 | 72 |
| 2037 | 72 | 10 | 0 | 0 | 10 | 72 |
| 2038 | 72 | 10 | 0 | 0 | 10 | 72 |
| 2039 | 72 | 10 | 0 | 0 | 10 | 72 |
| 2040 | 72 | 10 | 0 | 0 | 10 | 72 |
| 2041 | 72 | 10 | 0 | 0 | 10 | 72 |
| March 2042 | 72 | 3 | 0 | 0 | 3 | 72 |
Source: SRK 2021
| | | | | |
SalardeAtacama_SEC_Report_515800.040 | December 2022 |
SRK Consulting (U.S.), Inc.
| | | | | |
SEC Technical Report Summary – Salar de Atacama | Page 168 |
Note: Wells with screen interval below 50 m depth are considered deep wells.
Source: SRK 2021
Figure 13-3: Predicted Life of Mine Well Location Map and Average pumping Rate
13.2Production Schedule
A total of 75 wells locations were used to simulate brine production at the Salar de Atacama. The pumping schedule for the simulation is shown on Figure 13-4. Production was maintained at 72 of the wells from year 2024 to 2042.
| | | | | |
SalardeAtacama_SEC_Report_515800.040 | December 2022 |
SRK Consulting (U.S.), Inc.
| | | | | |
SEC Technical Report Summary – Salar de Atacama | Page 169 |
Source: SRK 2021
Figure 13-4: Operational Schedule of Production Wells
| | | | | |
SalardeAtacama_SEC_Report_515800.040 | December 2022 |
SRK Consulting (U.S.), Inc.
| | | | | |
SEC Technical Report Summary – Salar de Atacama | Page 170 |
Pumping rates per well range from being turned off with no flow up to 28.25 L/s: only 10 wells pump above 10 L/s. The yearly average total pumping rate for the combined wellfield is 442 L/s. Maximum pumping occurs in January (up to 540 L/s) and minimum pumping in June (300 L/s). Figure 13-5 shows the pumped volume per year.
Source: SRK 2021
Figure 13-5: Pumped Volume and Predicted Lithium Concentration
Factors such as mining dilution and recovery are implicitly captured by the predictive numerical model. Reporting of these factors is not practical due to the disconnect between the static resource model and the dynamic predictive model utilized for reserve estimation as well as other factors such as mixing of brine during production.
Simulated pumped volume generates a drawdown up to 25 m in the pumping wells, it includes simulated drawdown in the model cells, and accounts for corrections due to cell-size and estimated well efficiency. Considering the max depth of production wells is 50 m the saturated thickness in the well is sufficient to support the planned pumping rate.
| | | | | |
SalardeAtacama_SEC_Report_515800.040 | December 2022 |
SRK Consulting (U.S.), Inc.
| | | | | |
SEC Technical Report Summary – Salar de Atacama | Page 171 |
14Processing and Recovery Methods
Albemarle's operations in Chile are in two separate areas, the Salar de Atacama and La Negra. The Salar de Atacama operation extracts lithium brines from groundwater wells. These brines are discharged to solar evaporation ponds to concentrate the lithium brine, which is then transferred to the La Negra plant by tanker truck for processing. The La Negra plant refines and purifies the lithium brines, producing both technical and battery grade lithium carbonate. Albemarle has also historically produced lithium chloride product although it does not forecast this production in the future.
At the salar, the lithium chloride brine concentration process is carried out by solar evaporation in concentration ponds. The objective of the process is to obtain a concentrated lithium chloride brine of around 6% lithium, which is transported to the La Negra chemical plant for further processing. A basic flowsheet for the salar is presented in Figure 14-1. As seen in this figure, beyond the concentration of lithium, there is also a potash (KCl) plant for byproduct potash production. Albemarle also harvests halite and bischofite salts as byproduct production for third party sales.
Source: Albemarle, 2019
Figure 14-1: Salar Process Flow Sheet
The La Negra plant receives the concentrated brine from the salar, and the brine is further processed with several purification steps followed by the conversion of the lithium from a chloride to a lithium carbonate. A basic flow sheet for the La Negra process is presented in Figure 14-2.
| | | | | |
SalardeAtacama_SEC_Report_515800.040 | December 2022 |
SRK Consulting (U.S.), Inc.
| | | | | |
SEC Technical Report Summary – Salar de Atacama | Page 172 |
Source: Albemarle, 2021
Figure 14-2: La Negra Process Flow Sheet
14.1Salar de Atacama Processing
The process of concentrating the raw brine pumped from the aquifer to the concentrated brine shipped to La Negra is made possible by the favorable weather conditions of the Salar de Atacama (the area’s evaporation rate is 1,270 to 1,780 millimeters (mm) (50 to 70 inches per year) with very little rainfall most years (10 to 30 mm), but on rare occasions there are heavy storms. The solar radiation in the area is high, the relative humidity as low as 5% and moderately intense winds rise in the afternoons) and the high solubility of the lithium in this type of brine. The process consists of evaporating water from the brine utilizing solar energy, resulting in a fractional crystallization of salts and the progressive increase in the lithium concentration in the brine until reaching the final stage.
Source: GWI, 2019
Figure 14-3: Evaporation Ponds
| | | | | |
SalardeAtacama_SEC_Report_515800.040 | December 2022 |
SRK Consulting (U.S.), Inc.
| | | | | |
SEC Technical Report Summary – Salar de Atacama | Page 173 |
14.1.1Solar Evaporation
Evaporation ponds are arranged in “systems” of 15 ponds, with five total systems at the operation, for a total of 75 ponds. As the brine progresses through the pond system, sequential evaporation and precipitation removes unwanted deleterious elements and by products through five stages of fractional precipitation (Figure 14-4). The evaporation sequence essentially follows a process of increasing brine concentration from approximately 0.2% Li in the raw brine to 4.3% Li in a series of solar ponds with only limited formation of complex lithium-bearing salts (i.e., limited loss of lithium with most of the losses to bischofite) through precipitation, as shown in Stages 1 through 4 in Figure 14-4. During concentration from 4.3% Li to the final target of around 6% Li (Stage 5), a lithium carnallite salt forms and precipitates. Lithium-rich brines entrained in the bischofite harvest (Stage 4) are drained and recovered and a portion of the entrained lithium-rich brine as well as lithium sulfate precipitate from Stage 5 (lithium carnallite precipitation) is recovered through washing and dissolution with a natural brine.
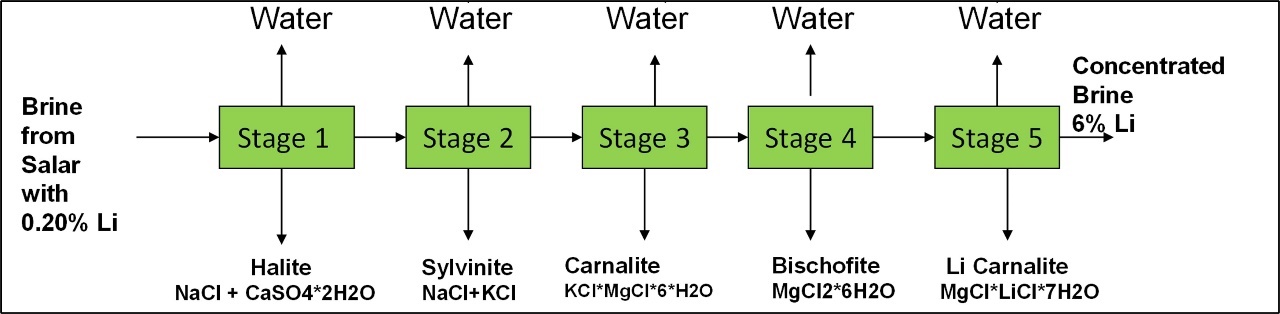
Source: Albemarle, 2019
Figure 14-4: Lithium Brine Evaporation Stages
During the course of solar evaporation, almost all of the sodium and potassium are precipitated and about 95% of the magnesium. By concentrating up to 6% of lithium, saturation of all salts is achieved, and the brine behaves like molten salt of lithium carnallite and bischofite. The 6% Li brine is loaded into trucks and transported to La Negra.
Four km2 of solar evaporation ponds are required for the current annual production rate of approximately 45,000 t/y of LCE. Expansions to 8.4 km2 (836 ha) of solar ponds are underway for a brine input flow of 442 L/s with a target of more than 80,000 t/y LCE production, when incorporating the SYIP. The brine concentration process takes 18 to 24 months and is characterized by changing brine colors as the concentration of the desired salts increases and by-products drop out and are harvested (Figure 14-5). Salts that will not be processed for muriate of potash (MOP) are stacked as waste near the ponds.
| | | | | |
SalardeAtacama_SEC_Report_515800.040 | December 2022 |
SRK Consulting (U.S.), Inc.
| | | | | |
SEC Technical Report Summary – Salar de Atacama | Page 174 |
Source: Albemarle, 2018
Figure 14-5: Aerial View of ALB Evaporation Ponds
One of the key features of the concentration strategy at the salar is the ratio of calcium to sulfate in the brine that is processed in the ponds. The Salar de Atacama brine is generally sulfate-rich although it has areas that are calcium-rich. To limit losses of lithium during the concentration process, a blend of these calcium and sulfate-rich brines must be maintained. By blending the calcium-rich brine with the sulfate-rich brine an initial precipitate of gypsum is formed, removing much of the calcium and reducing the sulfate to a level that prevents significant losses of lithium to sylvinite as KLiSO4. Going forward, based on the life of mine pumping plan, SRK predicts this balance of calcium-rich to sulfate-rich brine will not be maintained. This pumping plan shows a lack of calcium-rich brine starting in 2027. Based on this prediction, SRK has assumed a liming plant will be required at the start of 2027 to add calcium to the system to offset this reduction in calcium content in the blended brine feeding the evaporation ponds, however this could be also solved by optimizing the pumping plan for next years instead of keeping it fixed. Given the extended time until this assumed liming plant is required (i.e., five years), Albemarle has yet to complete the metallurgical testwork supporting this addition and the use of lime versus other alternatives (e.g., CaCl2) has not been set as a final decision. However, given the use of lime to reduce sulfate content in lithium brine operations is standard technology (in use at Albemarle’s Silver Peak operation as well as
| | | | | |
SalardeAtacama_SEC_Report_515800.040 | December 2022 |
SRK Consulting (U.S.), Inc.
| | | | | |
SEC Technical Report Summary – Salar de Atacama | Page 175 |
Orocobre’s Olaroz operation), in SRK’s opinion, this approach presents limited risk to future Salar de Atacama operations and this reserve estimate. Further, the current pumping plan has not been optimized to manage the Ca:SO4 ratio and it may be possible to further delay the need to add calcium to the system with further evaluation (to date, this has not been a priority given it is still a longer-term issue).
Potash Production
The potash precipitated as sylvinite and carnallite is harvested from the ponds to produce MOP. The production of KCl from the Potash Plant has historically averaged around 136,000 t/y. The production capacity was authorized environmentally through resolutions issued by the Regional Environment Commission of the Second Region. Potash is not included in this reserve estimate or the project economics and therefore the potash plant is not described herein.
14.1.2Salar Yield Improvement Program
As part of Albemarle’s strategy to expand lithium production rates from the current level of around 45,000 t LCE/yr to the targeted level of more than 80,000 t LCE/yr, Albemarle is targeting reducing lithium losses in evaporation ponds from current recovery. Albemarle refers to this strategy as the salar yield improvement program or SYIP. In support of this effort, in 2017, one of which targets recovering lithium from bischofite salts and the second targets recovering additional lithium from the lithium-carnallite salts. Both options utilize a similar strategy, including crushing/milling of the harvested salts before vat leaching with a dilute brine to recover a portion of the entrained lithium while limiting dissolution of the contained magnesium. Figure 14-6 presents the design layout for this facility. Section 10 presents summary information on the metallurgical testwork completed to support this project, but the expectation is that the SYIP will increase process lithium recovery up to a target of around 65%.
The SYIP was originally intended to enter production in 2021. However, due to recent depressed lithium markets it was delayed. Although a new timeline for development is not yet set, SRK has assumed primary construction activities will occur in 2022 and 2023 and the plant will come online in 2024.
| | | | | |
SalardeAtacama_SEC_Report_515800.040 | December 2022 |
SRK Consulting (U.S.), Inc.
| | | | | |
SEC Technical Report Summary – Salar de Atacama | Page 176 |
Source: Albemarle, 2019
Figure 14-6: SYIP Facility Layout
14.2La Negra Plant
The last stages of brine purification and the conversion stage to lithium carbonate are carried out at the La Negra Plant. Lithium chloride and both battery and technical grade lithium carbonate have been historically produced at La Negra. Going forward, Albemarle does not plan to produce lithium chloride and will limit future production to technical and battery grade lithium carbonate.
There are currently two process trains in production, La Negra 1 and La Negra 2 which have a production capacity of approximately 45,000 t LCE per year. A third production train, La Negra 3, is currently under development and forecast to increase the La Negra production capacity to around 84,000 t LCE per year. All three production trains utilize a similar flow sheet.
The primary process steps that occur at La Negra include boron removal with solvent extraction, impurity removal through chemical precipitation, lithium production utilizing chemical precipitation and final washing/drying/packaging (Figure 14-7).
| | | | | |
SalardeAtacama_SEC_Report_515800.040 | December 2022 |
SRK Consulting (U.S.), Inc.
| | | | | |
SEC Technical Report Summary – Salar de Atacama | Page 177 |
Source: Adenda EIA, SGA, 2015
Figure 14-7: La Negra Flow Sheet
| | | | | |
SalardeAtacama_SEC_Report_515800.040 | December 2022 |
SRK Consulting (U.S.), Inc.
| | | | | |
SEC Technical Report Summary – Salar de Atacama | Page 178 |
The mass balance for La Negra in its current configuration (i.e., La Negra 1 and La Negra 2) and associated with Figure 14-7 is presented in Table 14-1. As the La Negra 3 flow sheet is similar to La Negra 1 and La Negra 2, scaling up to the future targeted 84,000 tonne per year production rate would generally scale these mass flows proportionately.
Table 14-1: La Negra Mass Balance
| | | | | | | | |
| Process | Figure 14-7 Reference | Annual Mass Flow (tonnes) |
| Brine for solvent extraction | A1 | 180,000 |
| Hydrochloric Acid HCl for solvent extraction | A2 | 1,957 |
| H2SO4 Sulfuric Acid for solvent extraction | A3 | 468 |
| Solvent | A4 | 131 |
| Extractant | A5 | 56 |
| Water for solvent extraction | A6 | 156,000 |
| Lime for purification | A7 | 7,322 |
| Soda Ash | A8 | 79,966 |
| HCl Hydrochloric Acid | A9 | 627 |
| Industrial water | A10 | 19,021 |
| Sulfuric Acid H2SO4 | A11 | 264 |
| Water dilution | A12 | 5,430 |
| Water for the treated water system | A13 | 440,235 |
| Flow | 1 | 182,613 |
| Flow | 2 | 169,297 |
| Flow | 3 | 88,925 |
| RIL Water with Boron | B1 | 156,000 |
| RIS Mg (OH) 2 / CaCO3 | B2 | 32,629 |
| Water vapor drying Lithium Carbonate TG | B3 | 16,920 |
| Technical Grade Lithium Carbonate (TG) | B4 | 25,380 |
| Dried Water Steam Lithium Carbonate BG | B5 | 3,526 |
| Battery Grade Lithium Carbonate (BG) | B6 | 19,980 |
| Mother Liquor Purge | B7 | 83,329 |
| Mother Liquor Purge | B8 | 105,713 |
| Purge Liquor Mother of the wash | B9 | 463,356 |
| Emissions of Hydrochloric Acid HCl 32% | B10 | 0.44 |
| Hydrochloric Acid HCl 32% | C1 | 1,024 |
| 50% NaOH Sodium Hydroxide | C2 | 328 |
| Water for dilution of NaOH and HCl | C3 | 27,314 |
| Disposal water from the neutralization pond | D1 | 13,312 |
Source: Adenda EIA, SGA, 2015
14.2.1Boron Removal
The concentrated brine from the Salar is received at La Negra with a nominal concentration of 0.8% by weight of boron. Boron is considered a contaminant and this boron content needs to be reduced to a value less than 10 ppm. This boron removal stage is completed utilizing a solvent extraction (SX) process (Figure 14-8).
| | | | | |
SalardeAtacama_SEC_Report_515800.040 | December 2022 |
SRK Consulting (U.S.), Inc.
| | | | | |
SEC Technical Report Summary – Salar de Atacama | Page 179 |
Source: GWI, 2019
Figure 14-8: Boron Removal Scheme by Solvent Extraction
| | | | | |
SalardeAtacama_SEC_Report_515800.040 | December 2022 |
SRK Consulting (U.S.), Inc.
| | | | | |
SEC Technical Report Summary – Salar de Atacama | Page 180 |
The concentrated brine is acidified using hydrochloric acid. The acidified brine is mixed with an organic solution of an extractant and a solvent in mixing tanks that maximize the contact between the phases, where the boron is selectively extracted from the aqueous phase of the brine. After the stirring time between the aqueous and organic phases, both immiscible with each other, they are separated in a settler tank.
The purified brine obtained from the settlers goes to the next stage of brine purification. The organic is treated with extraction water in a stripping unit to remove the boron. The low boron organic stream is reused in the extraction stage, with a solvent and extractant make up to compensate for the organic and carryover losses. The wastewater is collected in evaporation ponds.
14.2.2Calcium and Magnesium Removal
The refined brine obtained in the SX stage must be processed to eliminate the remaining impurities, which are mainly magnesium and calcium. These impurities are removed from the brine through chemical precipitation, settling, filtration (Figure 14-9).
| | | | | |
SalardeAtacama_SEC_Report_515800.040 | December 2022 |
SRK Consulting (U.S.), Inc.
| | | | | |
SEC Technical Report Summary – Salar de Atacama | Page 181 |
Source: GWI, 2019
Figure 14-9: Scheme Removal of Calcium and Magnesium by Precipitation with CaO and Na2CO3
| | | | | |
SalardeAtacama_SEC_Report_515800.040 | December 2022 |
SRK Consulting (U.S.), Inc.
| | | | | |
SEC Technical Report Summary – Salar de Atacama | Page 182 |
The refined brine from the boron SX enters the magnesium reactor, where it is mixed with lime in a stirred tank to precipitate magnesium as magnesium hydroxide. Then, the suspension is pumped to the calcium reactor, which is also stirred, where it is mixed with a recirculating solution from the carbonation process (mother liquor) and a sodium carbonate solution to precipitate calcium carbonate.
The resulting pulp is sent to a clarifier and the underflow is filtered to recover the lithium chloride solution which feeds the lithium carbonate plant. The overflow goes directly to a finishing filter to remove fine solids. The purified brine is sent to storage tanks for later use. The filtered cake is disposed of as a solid residue.
14.2.3Lithium Carbonate Precipitation and Packaging
With the boron, calcium and magnesium impurities removed, the brine is ready for the carbonation process, which is utilized to produce lithium carbonate.
The purified brine is divided into a series of trains, each having three stirred reactors in series where the purified brine reacts with sodium carbonate in solution. Each reactor train has a fourth tank at the end that serve as homogenizers, from which the slurry is sent to a solid-liquid separation system utilizing hyrdrocyclones / filters or centrifuges before drying (Figure 14-10).
| | | | | |
SalardeAtacama_SEC_Report_515800.040 | December 2022 |
SRK Consulting (U.S.), Inc.
| | | | | |
SEC Technical Report Summary – Salar de Atacama | Page 183 |
Source: GWI, 2019
Figure 14-10: Scheme of Obtaining Lithium Carbonate by Precipitation with Na2CO3
| | | | | |
SalardeAtacama_SEC_Report_515800.040 | December 2022 |
SRK Consulting (U.S.), Inc.
| | | | | |
SEC Technical Report Summary – Salar de Atacama | Page 184 |
Subsequently, the dry product is stored in silos and distributed in the dry area for the manufacture and packaging of the different product formats, both technical grade (TG) and battery grade (BG):
•Li2CO3 TG Compacted
•Li2CO3 TG Compacted Pharmaceutical Grade
•Li2CO3 TG Granule
•Li2CO3 TG Fine-60
•Li2CO3 TG Fine-140
•Li2CO3 BG Fine-40
•Li2CO3 TG 1040 Extra Fine Grade
•Li2CO3 TG 1040 Fine Grade
•Li2CO3 TG Coarse Crystals
14.3Process Design Assumptions
One of the key limiting factors for Albemarle is the permitted brine extraction rate. Historically, the brine extraction permit allowed for an annual average of 142 L/s. In October 2016, a quarterly increase of 60 L/s began until the new annual average of 442 L/s was reached, which corresponds to the current extraction rate. With this flow, for a 365-day year, approximately 14 million m3 are extracted from the aquifer, equivalent to 171 kt LCE with an average lithium concentration of 0.20%.
Historically, the recovery of lithium in the salar has been around 50% although this has ranged from 40% to closer to 55%. For the purposes of this reserve estimate, SRK has assumed the current recovery rate of 40% will be maintained through 2023. In 2024, SRK assumes the two salt treatment plants associated with the SYIP will come into operation and forecasts an increase in the lithium recovery rate to 65%. Notably, Albemarle has already added a process to drain the bischofite salts which should improve short-term recovery beyond historic performance. However, data is not available to quantify the performance increase for this drainage process and SRK has therefore maintained historic recovery levels as a conservative approach.
At La Negra, the current process recovery is approximately 80% and SRK has assumed that La Negra maintains this recovery rate. The production of lithium carbonate at La Negra is driven by the concentrated brine dispatched from the salar. As noted above, the current combined La Negra 1/La Negra 2 production capacity is approximately 45,000 t LCE per year. Construction on La Negra 3 is anticipated to be completed in 2021 with commissioning and ramp-up starting that year. La Negra 3 is forecast by SRK to achieve a full, targeted production capacity of 84,000 t lithium carbonate in 2024 (Figure 14-11). The 84,000 t/y maximum production capacity is held constant for the remainder of the mine life through 2043.
| | | | | |
SalardeAtacama_SEC_Report_515800.040 | December 2022 |
SRK Consulting (U.S.), Inc.
| | | | | |
SEC Technical Report Summary – Salar de Atacama | Page 185 |
Source: SRK, 2021
Figure 14-11: Forecast La Negra Annual Production Capacity
14.3.1Process Consumables
Key reagents and associated forecast consumption rates are provided in Table 14-2. Note that these reagents are all utilized at La Negra and can vary depending upon the final product mix produced. While some reagents are consumed at the salar, these are all currently utilized in potash production (excluded from this reserve estimate). In the future, if lime addition is required at the salar to maintain lithium recovery rates, as assumed by SRK (see Section 14.1.1), additional lime will be required beyond that reported in the table. This assumed future lime consumption is variable and based on the forecast SO4/Ca ratio.
Table 14-2: Current Process Consumables
| | | | | |
| Item | Consumption Rate |
| Soda Ash | 2.27 tonne/tonne LCE sold |
| Lime | 0.21 tonne/tonne LCE sold |
| HCl | 0.11 tonne/tonne LCE sold |
| Water | 14.3 tonne/tonne LCE sold |
Source: SRK, 2021
Other reagents/consumables utilized in the process include the following:
•Caustic soda
•Sulfuric acid
•Solvent
•Extractant
•Flocculants
| | | | | |
SalardeAtacama_SEC_Report_515800.040 | December 2022 |
SRK Consulting (U.S.), Inc.
| | | | | |
SEC Technical Report Summary – Salar de Atacama | Page 186 |
•Diatomaceous earth
•Oxalic acid
•Barium chloride
•Carbon dioxide
•Lithium hydroxide
•Energy consumption is covered in Section
Personnel at the salar currently utilized in the process component of the operation average around 100 and those at La Negra average around 250.
| | | | | |
SalardeAtacama_SEC_Report_515800.040 | December 2022 |
SRK Consulting (U.S.), Inc.
| | | | | |
SEC Technical Report Summary – Salar de Atacama | Page 187 |
15Infrastructure
The project is a mature functioning operation with two separate sites that contain key facilities. Access is fully developed, with the majority accessible by paved major highway and local improved roadways on site. A local air strip services the Salar operations. The Antofagasta airport is the nearest major commercial airport servicing the La Negra operation (the Calama airport is the closet major commercial airport to the salar). The infrastructure is in place, operating and provides all necessary support for ongoing operations as summarized in this report.
The Salar site contains the brine well fields, brine supply water pipelines to evaporation ponds, primary processing facilities to create a concentrated brine, a phosphate plant that creates a potassium chloride product, camps; including a new camp that is partially constructed and functional with a second phase planned, airfield, access and internal roads, diesel power generated supply and distribution, water supply and distribution, shop and warehouse facilities, administrative offices, change houses, waste salt storage areas, fuel storage systems, security and communications systems. The concentrated brine product is trucked approximately 260 km to the La Negra facility. Future additions to the infrastructure include substation and powerline additions to connect to the local Chilean power system in 2021.
The La Negra plant purifies the lithium brine from the Salar Plant and converts the brine into lithium carbonate and lithium chloride. Facilities at the site include the boron removal plant, calcium and magnesium removal plant, lithium carbonate conversion plants, lithium chloride plant, evaporation sedimentation ponds and an “offsite” area where raw materials are warehoused and combined as needed in the processing facilities. Power to the facility is provided by the regional power company via a 110 kV transmission line and distributed throughout the plant to load centers. Piped natural gas provides the energy for heating and steam needs at the facilities. The project is security protected and has a full communication system installed.
Final products from the La Negra plant are delivered to clients by truck, rail, or through two port facilities near the plant.
15.1Access, Roads, and Local Communities
15.1.1Access
The project is located in north central Chile in the Antofagasta region. Primary access is from Antofagasta or Calama, the major cities in the region. The major plant facilities are at two separate sites. The refining plant site (La Negra) is closest to Antofogasta, near the small community of La Negra. Travel from Antofogasta to the La Negra refining plant site is approximately 20 km southeast on the major paved, four-lane, Chile Route 28. At La Negra, the Albemarle La Negra site is approximately 2 km north from the intersection of Route 28 on the multi-lane, paved, Chile Route 5 (the Panamerican Highway).
From the La Negra plant to the source of the lithium brine at the Salar de Atacama, where the Albemarle Salar facilities are located, is approximately 250 km to the east. Access from La Negra is north via Route 5, approximately 75 km, and then east on paved highway B-385 for
| | | | | |
SalardeAtacama_SEC_Report_515800.040 | December 2022 |
SRK Consulting (U.S.), Inc.
| | | | | |
SEC Technical Report Summary – Salar de Atacama | Page 188 |
approximately 175 km. The Albemarle Salar site is on the south-central area of the Salar de Atacama.
Figure 15-1 shows the general location of the project.
Source: SRK, 2020
Figure 15-1: General Project Major Facility Location
15.1.2Airport
Antofagasta has an international airport, but primary flights are national, and it is the primary airport for the region. The city of Calama, located approximately 190 km to the northwest of the Salar, has the closest commercial airport to the Salar. A smaller airport is located at the Salar for direct access. This air strip is located at the south end of the Salar facilities. The site air strip is for smaller jets and prop planes and is approximately 2,235 m in length and has a clay surface.
15.1.3Rail
A rail owned and operated by Ferrocarril de Antofagasta a Bolivia (FCAB) exists about 80 km south of the Salar site at Pan de Azucar, connecting to La Negra, approximately 170 km away, that had been used historically for moving concentrated brine. It is no longer used as all brine is trucked directly to La Negra. The La Negra facility does not have access to the rail system as this time.
15.1.4Port Facilities
Port facilities are located in Antofagasta within 20 km of the La Negra plant. The medium size coastal breakwater port has facilities for both container and bulk transport. The port can accommodate ships over 150 m in length. Figure 15-2 shows the port facilities. An additional port facility is the Port of Mejillones 80 km from La Negra to the south.
| | | | | |
SalardeAtacama_SEC_Report_515800.040 | December 2022 |
SRK Consulting (U.S.), Inc.
| | | | | |
SEC Technical Report Summary – Salar de Atacama | Page 189 |
Source: Google Earth/SRK, 2020
Figure 15-2: Antofagasta Port
15.1.5Local Communities
The majority (nearly 95%) of the 438 employees who work at La Negra live in the City of Antofagasta and its suburbs. Antofagasta is the regional capital and major population center, with approximately 440,000 people living there. Employees are bussed approximately 25 km to the La Negra plant.
Personnel who work at the Salar Plant travel from around the region. Table 15-1 shows the regional communities, population, distance to the Salar Plant and approximate number of employees in each community. Nearly 85% of the employees live in Antofagasta, San Pedro de
| | | | | |
SalardeAtacama_SEC_Report_515800.040 | December 2022 |
SRK Consulting (U.S.), Inc.
| | | | | |
SEC Technical Report Summary – Salar de Atacama | Page 190 |
Atacama or Calama. There are 27 communities in the Other Communities category where employees reside with one to four employees living in each community. Figure 15-3 shows the communities where most employees reside. Most employees travel to site by company bus.
A company camp is located in Peine approximately 30 km east of the Salar Plant. The camp consists of 10 houses with a capacity of 77 persons. There is also a hotel with 26 single rooms and five modules with five-person capacity. The 250 people that work on site on various rotations stay at the camp along with approximately 51 contractor personnel. A company bus provides transportation from the camp to site and back.
A second camp known as the Chépica Camp permitted for approximately 600 people is permitted and the first phase has been constructed (300 people) and is use with a second phase (300 additional people) planned as needed with future expansions. The camp is located approximately 2 km to the east of the Salar plant.
Table 15-1: Regional Community Information for the Salar Plant
| | | | | | | | | | | |
| City | Number of Employees | Population | Distance to Salar Plant (km) |
| Antofagasta | 101 | 440,000 | 250 |
| San Pedro de Atacama | 80 | 4,000 | 130 |
| Calama | 28 | 150,000 | 190 |
| Other Communities | 41 | Varies | Varies |
| Total | 250 | | |
Source :SRK, 2020
Source: Albemarle, 2020
Figure 15-3: Regional Communities
| | | | | |
SalardeAtacama_SEC_Report_515800.040 | December 2022 |
SRK Consulting (U.S.), Inc.
| | | | | |
SEC Technical Report Summary – Salar de Atacama | Page 191 |
There are an additional 48 people that work in the corporate offices in Santiago and support the production activities. Santiago is the capital of Chile and the major population center for the country with a population of approximately 6.8 million in the metro area. Santiago is approximately 1,600 km south of the Salar Plant, traveling through Antofagasta.
15.2Facilities
15.2.1Salar Plant
The Salar plant located in the mining concession area consists of lithium-rich brine recovery wells, pipeline delivery system to the concentration/evaporation pond systems and two leaching plants that create a concentrated brine product that is shipped by truck to La Negra for further processing. Additionally, a potassium processing and drying plant creates a co-product, potassium chloride also commonly referred to a muriate of potash (MOP).
Other site facilities include the salt harvest storage areas, fuel storage and fueling systems, electrical delivery and distribution systems, airfield, security guard house, warehouses, change room, dining room, administrative office building, maintenance facilities, operations building, and laboratory.
Figure 15-4 shows the Salar plant layout.
Source: SRK, 2020
Figure 15-4: Salar Plant Facilities
| | | | | |
SalardeAtacama_SEC_Report_515800.040 | December 2022 |
SRK Consulting (U.S.), Inc.
| | | | | |
SEC Technical Report Summary – Salar de Atacama | Page 192 |
Future expansion work includes the addition of the SYIP (described in Secion 14 and a power system upgrade that will add a new 23kV powerline from the Sistema Eléctrico Nacional (SEN) transmission system to a new substation located north of the power plant. The power upgrade is further discussed in Section 15.4.1.
15.2.2La Negra Plant
The La Negra plant purifies the lithium brine from the Salar Plant and converts the brine into lithium carbonate and lithium chloride. Facilities at the site include the boron removal plant, calcium and magnesium removal plant, lithium carbonate conversion plants, lithium chloride plant, evaporation sedimentation ponds and an “offsite” area where raw materials are warehoused and combined as needed in the processing facilities. Figure 15-5 shows the La Negra Plant facilities.
Source: SRK, 2020
Figure 15-5: La Negra Plant Facilities
Lithium Chloride Conversion Plant
The lithium chloride conversion plant consists a three-level building, service buildings, control room and supporting equipment buildings. Inside the main building is a system of four reactors with "scrubber", a press filter, storage ponds, a distiller and four cooling towers, a crystallizer, a centrifuge, a rotary dryer and a cooler.
Calcium and Magnesium Removal Plant
The calcium and magnesium removal plant has four reactors for the treatment of calcium and magnesium. In addition, it has a clarifier and solid-liquid separation equipment.
| | | | | |
SalardeAtacama_SEC_Report_515800.040 | December 2022 |
SRK Consulting (U.S.), Inc.
| | | | | |
SEC Technical Report Summary – Salar de Atacama | Page 193 |
Boron Removal Plant
The plant consists of a multilevel process tower, service buildings, control room, maintenance shop and other minor facilities.
Lithium Carbonate Conversion Plants
The carbonate conversion plant consists of six reactor trains and a serial homogenization reactor, referred to as LAN 1, LAN 2 and LAN 3. In particular, for LAN 1 there is a hydrocyclone plus a filter press. While for the other trains (LAN 2 and LAN 3) there are centrifuges. Rotary-type drying systems are also included in the plant.
Evaporation-Sedimentation Ponds
Five ponds are located on-site for storage of industrial waste (three evaporation and two sedimentation). The ponds cover a total area of 60 ha.
"Off Site" Area
The “Off Site” area includes liquid storage ponds, reverse osmosis plant and preparation reactors.
Dry Area
The dry area of the process facility includes grinding systems, compactors, granulators and storage silos.
Support Facilities
The support facilities include a container yard, water reservoirs, access roads, smaller sheds and maintenance workshops, among others.
15.3Energy
15.3.1Power
Salar Area
Power is supplied to the Salar Plant area via on site generation by a central diesel fueled generation plant. The generating plant is 2.4 MW. The generation plan is made up of three Caterpillar C-18 generator sets rated at 508kW each and one Caterpillar C-32 with a capacity of 880 kW. The gensets operate based on load requirements, typically with two to three units operating and one unit on standby. Additionally, 1.7 MW of distributed generation is used on the site with 70 separate small generators used for the individual well pumps. The individual generator sets range from 16 kW to 63 kW in size. The largest number of units are either 16 kW or 24 kW. Finally, there are two 421 kW generator sets located at the Chépica Camp site. This brings the total installed generating capacity to 4.9 MW.
The primary electricity consumption is the potassium plant using nearly 90% of the total electricity on site. Annual consumption for the last three years averaged just over 6 million kWh per year. The Phase 1 addition of the SYIP will add approximately 2 MW additional load.
Table 15-2 shows the percentage use by load center.
| | | | | |
SalardeAtacama_SEC_Report_515800.040 | December 2022 |
SRK Consulting (U.S.), Inc.
| | | | | |
SEC Technical Report Summary – Salar de Atacama | Page 194 |
Table 15-2: Salar Plant Electricity Consumption by Load Center
| | | | | |
| Primary Loads | Percent of Total |
| Potash Plant | 87% |
| Carnalite Conversion Plant | 0% |
| Lithium Plant | 2% |
| Peine | 9% |
| Lixiviation Number 1 | 1% |
| Total | 100% |
Source: Albemarle, 2020
The power system will be upgraded with the addition of a new substation, a 35 km 23 kV transmission line that will tie into the local SEN system at the SS Tap Off West owned by AES Gener, and 6 km of 13.8 kV transmission line on site to support the local distribution system, once this system is connected the diesel power plant will perform as a backup. Construction will occur in 2021 and the system is planned to be in service in 2022. The connection will reduce the use of diesel significantly.
La Negra
Power is available from the 110 KVA Norte Grande Interconnected System (SING) Network. Local diesel generation is available as a backup system for critical systems. The total installed load on site is approximately 29 MVA.
Table 15-3 shows the primary loads.
Table 15-3: La Negra Primary Electrical Loads
| | | | | |
| Primary Loads | Installed Capacity (MVA) |
| Evaporator Terminal | 6.5 |
| LAN 3, PF 5.1, PF 5.2, PF 6.1 | 4.5 |
| LAN 1, Two Step, PF 3, PF 3.5, Central Lab | 4.5 |
| LAN 2, PF 4 | 4 |
| One Step 2 | 2 |
| One Step , SAS Wetting System | 2 |
| SAS Phase Thickening/Dilution, SX3, North Tank Farm, Brine unloading | 2 |
| Chloride Plant, SX1 | 1.5 |
| Sodium Plant, SX 2 | 1 |
| Cafeteria, Admin offices, contractor facilities, training room, project offices, investigation laboratory | 0.5 |
| Truck shop, North Guard Shack, North dining room | 0.15 |
| Water Treatment Plant | 0.075 |
| Hazardous Waste Storage | 0.075 |
| Total | 28.8 |
Source: Albemarle, 2020
15.3.2Natural Gas
Salar Plant
The Salar Plant does not use natural gas or propane.
| | | | | |
SalardeAtacama_SEC_Report_515800.040 | December 2022 |
SRK Consulting (U.S.), Inc.
| | | | | |
SEC Technical Report Summary – Salar de Atacama | Page 195 |
La Negra Plant
The primary source for process and heating at La Negra is natural gas. The gas is supplied by pipeline. The primary use is for drying and water heating/steam generation. The primary loads are summarized in Table 15-4.
Table 15-4: Primary Natural Gas Loads
| | | | | | | | | | | | | | | | | | | | | | | | | | | | | | | | |
| Energy | | Natural Gas Consumption |
| Location | Equipment | Make | Min | Max | Units | Gas Pressure | Units | Min | Max | Units |
| Chloride Plant | Direct Dryer | Cleaver Brooks | 2,041 | 20,412 | MBTU/h | 200 | psi | 17 | 18 | Nm3/h |
| Boiler | Maxon | 750 | 1,600 | MBTU/h | | | 21 | 45 | m3/h |
| Plant 1 | Hurst Water Boiler | John Zink Co. | 12,320 | 12,600 | MBTU/h | | | 349 | 357 | m3/h |
| Terminco Thermopack oil fluid heater | Fulton | 0 | 800 | MBTU/h | | | 23 | 28 | m3/h |
| Direct Dryer 1 | S/I | 0 | 7,931 | MBTU/h | | | | 57 | m3/h |
| Direct Dryer 2 | Etchegoyen | 0 | 3,470 | MBTU/h | | | | 25 | m3/h |
| Plant 2 | Water heater | North American | 0 | 46,200 | MBTU/h | 125 | psi | 330 | 1308 | US gph |
| Indirect heater | Cleaver Brooks | 3,999 | 4,000 | MBTU/h | | | | 113 | m3/h |
| Plant 3/4 | Indirect heater | Stelter&Brinck | 2,650 | 11,400 | MBTU/h | 11 | psi | 71 | 306 | Nm3/h |
| Total | 21,760 | 108,413 | MBTU/h | |
Source: Albemarle (modified by SRK), 2020
Propane is not used at the La Negra plant. It is available as a backup fuel sources from Antofagasta by tanker truck.
15.3.3Fuel
Salar Plant
The Salar plant has fuel storage on site including two diesel tanks that are 120,000 liters and 60,000 liters. A smaller 15,000 liter tanks hold gasoline. Fuel is supplied by a regional supplier. The fuel is delivered to site by over the road tanker trucks from Antofagasta every other day.
La Negra Plant
No fuel is stored at the La Negra plant.
15.4Water and Pipelines
Albemarle has water rights granted by the General Water Directorate (DGA) for those wells where fresh water is extracted, which is used as industrial water for the process. The water rights correspond to the wells located in Tilopozo (8.5 L/s), Tucucaro (10 L/s), and Peine (5 L/s), with a total right to extract 23.5 L/s, of which the Tilopozo and Tucucaro wells are currently used, for a total of 16.9 L/s. Water from the Peine well is provide by 6 inch HDPE pipe to the Peine camp 20,000 m3 covered storage pond. The Tilipozo well discharges into an 8 inch pipe that reports to a 2,000 m3 post-processing thickening pond. The Tucucaro well feeds a 6 inch pipe that also discharges to the same post-processing thickening pond. It should be noted that, for brine extraction wells, no groundwater rights are required, as this corresponds to the extraction of a mineral resource.
| | | | | |
SalardeAtacama_SEC_Report_515800.040 | December 2022 |
SRK Consulting (U.S.), Inc.
| | | | | |
SEC Technical Report Summary – Salar de Atacama | Page 196 |
In La Negra there is are two wells that have water rights granted by the DGA for the extraction of 13 L/s. Well 1 North is permitted at 6 L/s and Well 2 South is permitted at 7 L/s. Additional water can be supplied by a local water system.
| | | | | |
SalardeAtacama_SEC_Report_515800.040 | December 2022 |
SRK Consulting (U.S.), Inc.
| | | | | |
SEC Technical Report Summary – Salar de Atacama | Page 197 |
16Market Studies
SRK was engaged by Albemarle to perform a preliminary market study to support resource and reserve estimates for Albemarle’s mining operations. This report covers the Salar de Atacama and associated La Negra processing facility. The combined Salar de Atacama/La Negra facilities primarily produce lithium products and the market study supporting this reserve estimate is specific to lithium production.
The Salar de Atacama operation also produces potash (potassium chloride), bichofite, halite and sylvinite as byproducts for commercial sale. However, the production of these byproducts has limited materiality to the economics of the operation. Therefore, SRK did not include these products in its estimate of reserves for the operation and did not complete a market study regarding sale of these products.
16.1Market Information
This section presents the summary findings for the preliminary market study completed by SRK on lithium.
16.1.1Lithium Market Introduction
Historically, (i.e., prior to the 2000s), the dominant use of lithium was in ceramics, glasses, and greases. However, with the boom in the use of portable electronic devices, starting with mobile phones and laptop computers and now covering a wide range of consumer electronic products, the use of lithium in lithium ion batteries has grown from a fringe portion of the market to the most significant portion of demand. Over the last few years, the development of the battery electric vehicle (BEV) industry has further driven demand growth in lithium usage in lithium ion batteries. If BEVs expand from their current niche position to a mainstream method of transportation, lithium demand in BEV batteries will overwhelm all historic uses and require multiples of historic levels of production.
Lithium is currently recovered from hard rock sources and evaporative brines. Current and potential future hard rock sources include minerals such as spodumene, lepidolite, petalite, zinnwaldite, jadarite, and lithium-bearing clays. Most brine operations pump a chloride-sulfate rich solution in which most of lithium occurs as lithium chloride (LiCl) (there is more limited production and production potential from carbonate brines). For the rest of this document, unless specifically noted, when referring to brine production SRK will be referring to chloride brines, and when referring to hard rock, again unless specifically noted, SRK will be referring to spodumene. This is to minimize the complexity of this explanation and given these are the dominant forms of production from both sources, this simplification covers the majority of current and future production sources.
For use in batteries appropriate for electric vehicles, lithium is generally used in either a carbonate or hydroxide form. For this type of production, both brine and hard rock sources require separation of lithium and then conversion to a form that can be purified into a feed solution to produce lithium carbonate, which is then converted to a hydroxide or, in some cases, directly produces lithium hydroxide. Current practice allows direct production of lithium carbonate from either brines or hard rock sources, whereas only hard rock sources directly produce lithium hydroxide (brine operations all first produce lithium carbonate which is then
| | | | | |
SalardeAtacama_SEC_Report_515800.040 | December 2022 |
SRK Consulting (U.S.), Inc.
| | | | | |
SEC Technical Report Summary – Salar de Atacama | Page 198 |
converted to hydroxide, if desired). However, multiple parties are evaluating the potential to produce lithium hydroxide directly from a brine source, and there is a reasonable probability this dynamic will change over time.
For existing producers, the major differences in cost between brine and hard rock include the following:
•Hard rock sources require additional mining, concentrating, and roasting/leaching costs.
•For a final hydroxide product, brine sources first produce a lithium carbonate that requires further conversion costs, whereas hard rock sources can be used to directly produce a lithium hydroxide.
•Brine sources require concentration prior to production, as natural brine solutions are generally too diluted to allow for precipitation of lithium in a salable form.
•Brine sources generally have a higher level of impurities (in solution) that require removal.
Historically, brine producers have had a significant production cost advantage over hard rock producers for lithium carbonate and a smaller cost advantage for lithium hydroxide. Hard rock production generally provided swing production for these industries, as well as satisfied other aspects of the lithium market (e.g., glasses and ceramics). As many new producers enter the market on both the hard rock and brine side, this prior norm is changing, as many of the new brine producers have relatively high operating costs when compared to traditional hard rock production, especially with respect to the production of lithium hydroxide.
16.1.2Lithium Demand
In recent years, the lithium industry has gone through an evolution. The ceramic and glass sectors were traditionally the largest source of demand for lithium products globally. However, the development boom in demand for mobile consumer applications reliant upon lithium ion batteries has structurally changed the industry. Much of this change, through approximately 2015, was driven by devices such as phones, laptop computers, tablet computers, and other devices (e.g., speakers, lights, wearables, etc.), as well as small mobility devices (e.g., electric bikes). However, the use of lithium in the recent nascent adoption of BEVs has quickly become the most important aspect of overall lithium demand, not just within the battery sector of demand, but for lithium demand on whole. This is seen in Figure 16-1, with BEV market share rapidly growing in importance and driving overall demand growth in the lithium industry.
| | | | | |
SalardeAtacama_SEC_Report_515800.040 | December 2022 |
SRK Consulting (U.S.), Inc.
| | | | | |
SEC Technical Report Summary – Salar de Atacama | Page 199 |
Source: SRK, 2021
Figure 16-1: Global Electric Vehicle Lithium Demand
Going forward, the range of potential future demand scenarios is heavily dependent upon the adoption of BEVs as a significant component of automotive sales and the technology utilized in their batteries. Therefore, there remains significant uncertainty in future demand growth associated with BEVs, with general personal vehicle ownership likely to change (i.e., ride hailing and car share), potential battery chemistry changes (e.g., solid-state batteries), and changes in battery pack sizes. In addition, there is uncertainty around other potential sources of lithium demand (e.g., home power storage, grid power storage, commercial transport, public transport, demand destruction in traditional markets, etc.).
Nonetheless, acceleration in the growth of the BEV industry appears to have a high probability. Demand growth in 2019 and 2020 were relatively disappointing but were likely driven by external factors (e.g., changes in BEV subsidies in jurisdictions such as China as well as the global COVID-19 pandemic) that have largely moved through the system. Even with COVID-19 still a major health issue, SRK believes the lockdowns of early 2020 that created major economic damage will not be repeated as governments are learning to better manage the disease. Most auto makers and other industry participants have invested heavily to expand into BEV production and transition overall toward expectations of future dominant consumption of EVs instead of internal combustion engine (ICE)-based vehicles. However, in SRK’s opinion, there remain several barriers to BEVs becoming the dominant type of vehicle sales, including:
•Costs
•Changes to buyer perceptions
•Raw material availability
Currently, for BEVs to have a range that is competitive with ICE-powered cars, they have to have a large and expensive battery pack. Based on recent estimates by Bloomberg New Energy Finance (BNEF), in 2020, the battery pack comprised approximately one third of the total up-front cost of a new BEV. For higher end vehicles, this cost is manageable in the context of the overall vehicle cost. However, for entry level vehicles, the cost of the battery pack remains a hurdle to BEVs being competitive with ICE cars. The price of batteries has been rapidly decreasing as the scale of production has increased and technological advances have focused on cost reduction. A 2020 prediction by BNEF assumes that these trends will continue and the threshold where BEVs become generally affordable (US$90/kWh on unit basis for the battery pack) is predicted to occur in 2024 (BNEF, 2020).
Consumer preference is a major barrier that will have to be passed to allow widespread adoption of BEVs. Currently, SRK believes this is an issue because many of the auto
| | | | | |
SalardeAtacama_SEC_Report_515800.040 | December 2022 |
SRK Consulting (U.S.), Inc.
| | | | | |
SEC Technical Report Summary – Salar de Atacama | Page 200 |
manufacturers have treated BEVs as niche vehicles that were meant to appeal to buyers wishing to make a statement. While this works for the niche population that wishes their vehicle to make such a statement (i.e., following the Toyota Prius strategy), a typical buyer will likely be turned off by this style of marketing. Further, to date, auto manufactures have focused on developing electric vehicles as sedans and compact cars and have not targeted the booming SUV and pickup truck market. However, these trends are changing, with Tesla producing cars that have widespread appeal from a style standpoint and take advantage of the inherent performance advantages of BEVs (e.g., outperformance relative to ICEs for handling and acceleration) and not surprisingly leading all other global manufacturers in BEV sales. In addition, SUV-type BEV models started sales in 2020 and BEV pickup truck sales are expected to start in 2021.
In SRK’s opinion, raw materials and supply chain limitations are the other major risk to widespread EV adoption. SRK does not expect this bottleneck to come from lithium, at least in the short- to mid-term (longer term, it may become an issue, but widespread recycling will likely mitigate this risk). Downstream production (e.g., battery-grade lithium carbonate/hydroxide, cathode precursor, cathodes, batteries, etc.) also appears to have a low risk of creating a bottleneck, as extensive investment in this manufacturing capacity has already happened and continues. However, other raw materials, especially nickel and cobalt, both of which are critical to the key cathode technology of NMC and NCA, appear to create future supply risk. SRK believes it is likely that additional nickel supply can be developed at a cost (i.e., higher nickel prices will be required), but adequate cobalt supply to maintain current levels of cobalt in batteries will likely not be feasible. The most likely solution to this bottleneck will be the elimination (or reduction to minimal levels) of cobalt in BEV batteries through technological improvements.
Beyond these three primary barriers, SRK does not view other potential barriers (e.g., charging infrastructure, substitution away from personal vehicle ownership, etc.) to be major hurdles to widespread adoption of BEVs.
Overall, given the discussion above, SRK expects near- to mid-term growth in the BEV market to pick back up from the two recent relatively slow growth years. However, there remains the risk that BEVs stay a niche vehicle or are eliminated completely. The most serious risks that SRK can foresee are technology related, such as substitution of alternative technology (e.g., fuel cells make a comeback), battery costs plateau, and BEVs remain uncompetitive on low-cost vehicles or cobalt cannot be substituted out of batteries and adequate supply cannot be sourced. Under any of these three scenarios, demand for lithium from BEVs would be severely curtailed (if not eliminated). However, overall SRK does not view these downside scenarios as the most likely outcomes for the sector.
To quantify potential demand growth, SRK constructed a basic demand model. In its model, SRK ran three scenarios through 2029:
•The first scenario, as the base case, assumes that demand growth will slowly pick back up in 2021 and start to really accelerate in 2022 as reduced costs make EVs fully competitive and the wide range of new models proposed by the major auto manufacturers can appeal to the average consumer. At this point, demand growth accelerates again until EVs reach 20% market share (2024), at which point demand
| | | | | |
SalardeAtacama_SEC_Report_515800.040 | December 2022 |
SRK Consulting (U.S.), Inc.
| | | | | |
SEC Technical Report Summary – Salar de Atacama | Page 201 |
growth starts to slow but remains robust, reaching 40% of overall vehicle demand in 2027 and continuing to grow at a slower rate through the end of the model period (2029).
•The second scenario, as the high scenario, assumes that demand growth accelerates more quickly (2021 as a major growth year), accelerates into the early 2020s as battery prices fall, and then starts to slow as EVs reach 20% market penetration (likely limited by manufacturing capacity), but continues at a faster growth rate than the base case with 40% market penetration by 2026 and more than 60% by 2029. This scenario is feasible if new BEV models are highly desirable to consumers, subsidies can bridge the gap to battery costs dropping to the point that BEVs are cheaper to buy than economy gas powered vehicles (i.e., sub US$60/kWh battery costs), and the manufacturing supply chain can support this growth. Alternatively, even with somewhat slower personal consumer purchases of BEVs, significant uptake of commercial vehicles, such as large trucks and taxis, or major growth in grid or home power storage could also drive this scenario.
•The third scenario, as the low scenario reflects a potential scenario where the auto industry does not transition to lithium-based BEVs presenting a significant component of global transportation. This could reflect an alternative power source being developed for individual and commercial transportation that does not use lithium (e.g., fuel cells or alternative battery technologies) or simply the inability to bring lithium battery costs to a competitive level with BEVs never developing beyond a niche product. The demand assumption is that demand growth does not recover in Q4 2020 and stays flat for an extended period into the mid-2020s. At this point, with either inexpensive batteries as part of the transportation mix or alternative use of lithium batteries (e.g., grid power or commercial transportation), growth slowly picks up. Under this significantly curtailed growth scenario, BEV sales do not exceed 5% of global vehicle sales in the model period.
16.1.3Lithium Supply
Lithium supply is currently sourced from two types of lithium deposit: hard rock (spodumene, lepidolite, and petalite minerals) and concentrated saline brines hosted within evaporite basins (largely salt flats in Chile, Argentina, and Bolivia termed salars). Exploration and technical studies are currently ongoing on three additional types of deposits: hectorite clay deposits, a unique hard rock deposit with a lithium-boron mineral named Jadarite, and other deep brines (e.g., geothermal and oil field). Although, extensive study has been completed on these alternate lithium sources, they have not yet been commercially developed.
Currently (i.e., 2020), approximately 48% of lithium produced comes from brines and 52% from hard rock deposits. Hard rock deposits have traditionally produced mineral concentrate (e.g., spodumene or petalite) with a wide variety of technical specifications that are used in a wide variety of industrial activities, often being converted to lithium carbonate or hydroxide as intermediate products through hydrometallurgical processes. Brines have traditionally produced a lithium carbonate product (of varying qualities) which may then be converted to a variety of lithium products for various commercial activities. Brines have traditionally been the lowest-cost producers of lithium carbonate, and its derivative products with hard rock deposits act as primary mineral supply or swing production for lithium carbonate and derivatives.
| | | | | |
SalardeAtacama_SEC_Report_515800.040 | December 2022 |
SRK Consulting (U.S.), Inc.
| | | | | |
SEC Technical Report Summary – Salar de Atacama | Page 202 |
Until recently, global lithium production was dominated by two deposits: Greenbushes in Australia (hard rock) and the Salar de Atacama in Chile (brine), which has two commercial operations on it. SRK estimates that close to 75% of global production was sourced from those two deposits. With lithium prices significantly increasing from 2015 to 2018, two closed mines (Quebec Lithium and Mt. Cattlin) were restarted (although Quebec Lithium recently closed again), one closed mine is in the process of restarting (Jiajika), five mines that produced other commodities either added lithium or restarted as lithium mines (Mibra, Wodgina, Bald Hill, Lanke, and Jintai, although Wodgina and Bald Hill have subsequently closed again), and five new mines have come online (Salar de Olaroz, Mt. Marion, Pilgangoora, Altura, and Yiliping). At the same time, the existing operations, including Greenbushes and Atacama, have expanded, but nonetheless, this major increase in supply has reduced the dominance of Greenbushes and Salar de Atacama, which, when combined, SRK estimates will produce approximately 50% of global lithium in 2020.
Looking forward, as discussed above, SRK forecasts that demand will grow significantly. However, supply is also rapidly increasing. Based on SRK’s knowledge of global lithium projects in development, it forecasts that it is possible for lithium supply to more than double from 2019’s production level of about 385,000 t (as LCE) to more than 780,000 t (as LCE) by 2024. This potential growth in supply is limited to projects that are near production (i.e., projects that are either producing, under construction, or at an advanced stage of development, such as operating demonstration plants and at the point of financing construction).
Note that while all of these projects are well-advanced, with most already being financed and construction underway, if lithium prices stay at current levels, projects in the financing phase may not receive development capital (although SRK has already eliminated those projects it believes will be the most difficult to finance), and some of the higher cost producers may not expand as predicted. Nonetheless, given the demand outlook discussed above, SRK believes it is likely these projects will be incentivized to reach these production levels. Some of this production increase is likely to happen even at current prices (e.g., Salar de Atacama expansions), although other increases will likely only occur if prices increase from current levels. In short, SRK has already discounted ramp-up timing and performance for expected delays and inability to meet targets and has tied project production rates to expected demand growth, but there nonetheless remains uncertainty in the forecast.
Beyond 2024, the supply pipeline still has remaining development capacity as well. The 2024 forecast of 780,000 tonnes LCE assumes several of the advanced projects are either not producing or not producing at full capacity. In addition, there are further moderate to high quality brine projects that are not included given their long timelines to development. Finally, existing large producers have announced further expansions that are currently on hold and not included.
From a project quality perspective, most of these new developments are likely relatively high-cost producers for lithium carbonate or hydroxide (other than the expansions of existing low-cost producers and a few of the brine projects). This is because most of these projects have been known for many years and have not been developed as they are higher cost, more difficult projects than the existing producers.
| | | | | |
SalardeAtacama_SEC_Report_515800.040 | December 2022 |
SRK Consulting (U.S.), Inc.
| | | | | |
SEC Technical Report Summary – Salar de Atacama | Page 203 |
16.1.4Pricing Forecast
As discussed above, while lithium demand has been increasing (driven by recent historically elevated prices and leading the BEV demand boom), the lithium market is currently in an oversupply situation. In fact, SRK believes this market surplus has been in place since at least 2016. With significant additional production coming online from 2020 through 2030 (projects currently under construction or under financing), demand will have to accelerate its rate of growth to keep up with potential supply.
The historical commodity pricing for lithium carbonate and lithium hydroxide is provided in Figure 16-2.
Source: S&P Global Market Intelligence, 2022
Figure 16‑2: Historic Lithium Prices (Lithium Carbonate/Hydroxide)
Figure 16‑3 presents a comparison of SRK’s three demand scenarios against its base-case supply growth forecast
| | | | | |
SalardeAtacama_SEC_Report_515800.040 | December 2022 |
SRK Consulting (U.S.), Inc.
| | | | | |
SEC Technical Report Summary – Salar de Atacama | Page 204 |
Source: SRK, 2020
Figure 16-3: Supply/Demand Scenarios (2016 to 2023)
Although there is a near-term market oversupply of lithium, in the long-term, even with aggressive supply growth to date, significant new supply will need to be incentivized to fulfill demand requirements for the base-case demand projection. Therefore, in SRK’s opinion, the lithium price will need to exceed the production cost for new projects and provide an adequate rate of return on investment to justify development. Overall, SRK believes essentially all lithium producers currently producing or in its supply growth forecast would be profitable at US$9,000/t LCE or less. However, additional projects not in this outlook are clearly needed to meet demand forecasts. Therefore, SRK forecasts a price of US$10,000/t for technical grade lithium carbonate (CIF terms) as its long-term price. This price should be adequate to incentivize all projects included in Figure 16-2 plus additional projects required to close the projected supply gap shown in 2023, 2024 and 2025 (many of the earlier stage projects are third to fourth quartile and therefore should be profitable at this pricing level). Due to typical price volatility, SRK expects in the short-term prices may spike well above or fall well below this level, but from an average pricing perspective, in SRK’s opinion, this forecast is reasonable.
16.2Product Sales
The Salar de Atacama is an operating lithium mine. The mine pumps a subsurface brine that is rich in elements targeted for commercial production (e.g., lithium and potassium) as well as other elements generally viewed as deleterious to production but some of which may have some commercial value (e.g., magnesium) to evaporation ponds on the surface of the salar. These evaporation ponds concentrate the brine utilizing solar energy. During the evaporation process, potassium chloride and other byproduct salts (e.g., bischofite) precipitates from the concentrated brine and is harvested on the salar where it is further processed prior to sale. Lithium chloride is concentrated to approximately 6% lithium at which point it is trucked to the La Negra processing facility, located near Antofagasta, Chile where it is further processed into lithium chemicals that include technical grade lithium carbonate and battery grade lithium
| | | | | |
SalardeAtacama_SEC_Report_515800.040 | December 2022 |
SRK Consulting (U.S.), Inc.
| | | | | |
SEC Technical Report Summary – Salar de Atacama | Page 205 |
carbonate. Historically, La Negra has also produced technical grade lithium chloride although it is not currently producing this product.
Specifications for each of these products is provided in Table 16-1 through Table 16-3.
Table 16-1: Technical Grade Lithium Carbonate Specifications
| | | | | | | | |
| Chemical | Specification |
Li2CO3 | min. | 99% |
| Cl | max. | 0.015% |
| K | max. | 0.001% |
| Na | max. | 0.08% |
| Mg | max. | 0.01% |
SO4 | max. | 0.05% |
Fe2O3 | max. | 0.003% |
| Ca | max. | 0.016% |
| Loss at 550°C | max. | 0.75% |
Source: Albemarle 2017
Table 16-2: Technical Grade Lithium Chloride Specifications
| | | | | | | | |
| Chemical | Specification |
| LiCl | min. | 99.2% |
| Na | max. | 0.35% |
H2O (400°C) | max. | 0.5% |
Source: Albemarle 2017
Table 16-3: Battery Grade Lithium Carbonate Specifications
| | | | | | | | |
| Chemical | Specification |
Li2CO3 | min. | 99.80% |
| Cl | max. | 0.015% |
| K | max. | 0.001% |
| Na | max. | 0.065% |
| Mg | max. | 0.007% |
SO4 | max. | 0.05% |
Fe2O3 | max. | 0.001% |
| Ca | max. | 0.016% |
H2O (110°C) | max. | 0.35% |
Source: Albemarle 2017
Historic production rates for each of these products, with brine sourced from the Salar de Atacama, as processed at the La Negra facility are presented in Table 16-4.
Table 16-4: Historic La Negra Annual Production Rates (Metric Tonnes)
| | | | | | | | | | | | | | | | | | | | |
| 2015 | 2016 | 2017 | 2018 | 2019 | 2020 |
| Technical Grade Lithium Carbonate | 10,945 | 10,581 | 9,822 | 8,628 | 5,658 | 6,829 |
| Battery Grade Lithium Carbonate | 13,323 | 16,573 | 20,324 | 27,998 | 32,874 | 35,256 |
| Technical Grade Lithium Chloride | 2,143 | 1,900 | 3,209 | 3,821 | 1,824 | - |
Note 2015-2019 data reflects actual production, 2020 production is an estimate
Source: Albemarle 2020
| | | | | |
SalardeAtacama_SEC_Report_515800.040 | December 2022 |
SRK Consulting (U.S.), Inc.
| | | | | |
SEC Technical Report Summary – Salar de Atacama | Page 206 |
Looking forward, Albemarle has recently significantly expanded its production facilities the salar and those at La Negra are in the final stages of construction to increase lithium production rates. The new production capacity for each lithium chemical is provided in Table 16-5. This expansion of process capacity is forecast for completion in 2021 and is forecast by SRK to ramp up over a three year period before reaching the expanded production capacity in 2024.
Table 16-5: Current and Forecast La Negra Production Capacity by Product
| | | | | | | | |
| Current Annual Capacity (Tonnes) | Forecast Annual Capacity (Post Completion of La Negra 3) (Tonnes) |
| Technical Grade Lithium Carbonate | 5,925 | 6,000 |
| Battery Grade Lithium Carbonate | 38,576 | 78,000 |
| Technical Grade Lithium Chloride | 3,600 | 0 |
Source: Albemarle 2020
To simplify the analysis for the purposes of this reserve estimate, SRK has assumed that all lithium production from the combined Salar de Atacama/La Negra operation is sold as technical grade lithium carbonate. This is the lowest value product forecast for production and adds a layer of conservatism to the reserve estimate.
The three lithium products from the Salar de Atacama/La Negra operation are all marketable lithium chemicals that can be sold into the open market. However, Albemarle is an integrated chemical manufacturing company that operates multiple downstream lithium processing facilities. Therefore, a proportion of the production from the Salar de Atacama/La Negra operation is utilized to as source product for Albemarle’s downstream processing facilities. A breakdown of the volume of Salar de Atacama/La Negra product that is consumed internally for further downstream processing versus sales to third parties is presented in Table 16-6.
Table 16-6: Historic Salar de Atacama Product Consumption
| | | | | | | | |
| Production Consumed Internally (Tonnes LCE) | % Production Sold to Third Parties (Tonnes LCE) |
| Technical Grade Lithium Carbonate | 870 | 6,031 |
| Battery Grade Lithium Carbonate | 0 | 33,154 |
| Technical Grade Lithium Chloride | 0 | 0 |
Source: Albemarle 2020
While a portion of the production may be consumed internally, for the purposes of this reserve estimate, SRK has assumed that 100% of the production from the Salar de Atacama/La Negra operation will be sold to third parties. Further, as noted above, although the Salar de Atacama/La Negra can and does produce higher value battery grade lithium carbonate, SRK’s assumption for the purpose of this reserve estimate is that all production will be sold as the lower value technical grade lithium carbonate. This simplifies the assumptions for the estimate and does not materially impact the magnitude of the reserve estimated herein as the reserve is contract constrained (see Section 16.3.1) and not economically constrained.
| | | | | |
SalardeAtacama_SEC_Report_515800.040 | December 2022 |
SRK Consulting (U.S.), Inc.
| | | | | |
SEC Technical Report Summary – Salar de Atacama | Page 207 |
16.3Contracts
As outlined above, the lithium chemicals produced from the Salar de Atacama/La Negra operations are either consumed internally for downstream value-add production or sold to third parties. These sales may be completed in spot transactions or the chemicals may be utilized to satisfy sales contracts for lithium chemicals held at the consolidated corporate Albemarle level or its affiliates. These contracts are not generally specific to sourcing product from the Salar de Atacama/La Negra, although product sourced from other operations would need to be certified to meet customer quality requirements. Therefore, these contracts are not included in this analysis of reserves at the Salar de Atacama, and this analysis instead assumes a typical market price.
Salar de Atacama/La Negra sell all lithium products to its foreign related party Albemarle US Inc., where their sales and marketing teams provide instructions about specified locations where Chile should deliver the products. Extraction and sales of lithium and other products are regulated by contracts agreed with the Chilean Nuclear Energy Commission (CCHEN) and the Chilean Economic Development Agency (CORFO). These contracts are summarized in Section 16.3.1.
SRK is not aware of any other material contracts for the Salar de Atacama / La Negra operation.
16.3.1CCHEN and CORFO Agreements
Decree Law No. 2,886, published on November 14, 1979 and effective January 1, 1979, reserved lithium extraction for the State of Chile. However, the concessions held by Albemarle, for the purposes of producing lithium from the Salar de Atacama were registered in 1977 and therefore are exempt from this law. Nonetheless, under Law No 16,319, establishing the CCHEN, lithium can only be mined by CCHEN or with prior authorization from CCHEN. Under this law, producers of lithium are subject to a production quota that caps total production from the concessions and Albemarle is subject to such a CCHEN production quota. CCHEN also limits the extraction rate of brine from the Salar de Atacama.
In 2016, CCHEN increased the allocated pumping rate for Albemarle at the Salar de Atacama from the prior 142 liters/second (l/s) to 442 l/s. As part of the same agreement, the CCHEN production quota was increased from 200,000 t lithium (as lithium metal), inclusive of historic production to 540,240 t lithium (as lithium metal), again inclusive of historic production.
Further, CORFO was the original owner of the concessions in the Salar de Atacama from which Albemarle’s resources and reserves are derived. A predecessor of Albemarle (Foote Mineral Company) entered into an agreement with CORFO in August 1980 to establish production of lithium and other products from these concessions. From this original contract, Albemarle was limited to a total production quota of 200,000 t of lithium (as lithium metal), without an expiry date, and was not required to pay royalties on lithium production. A 1987 agreement with CORFO establishing production of potassium byproduct salts includes a royalty on the production of this product equal to 3% of the sales price for potassium products. The 1980 agreement for lithium extraction was subsequently amended in 2016 to allow for an increase in the production quota of lithium from these concessions. This amendment increased the company's authorized lithium production quota by an additional 262,132 tonnes of lithium
| | | | | |
SalardeAtacama_SEC_Report_515800.040 | December 2022 |
SRK Consulting (U.S.), Inc.
| | | | | |
SEC Technical Report Summary – Salar de Atacama | Page 208 |
(as lithium metal). With approximately 78,038 t remaining from the original quota (as of August 31, 2021), this additional quota results in a total remaining production quota of 340,170 t lithium as lithium metal (1.81 Mt LCE). As the CORFO quota has less allowable lithium production than the CCHEN sales quota, SRK has used the CORFO quota numbers as the limiting factor on this reserve estimate.
As part of the 2016 amendment to the CORFO agreement, Albemarle agreed to additional conditions around its production of lithium, including the following:
•A quota expiry of January 1, 2044 (i.e., any quota not utilized by this date will be forfeited).
•Albemarle agreed to invest in a third lithium carbonate plant in Chile with production capacity of at least 20,000-24,000 t battery grade LCE per year no later than December 31, 2022. If this new battery grade production facility is not in production by December 31, 2022, the new quota will be reduced from 262,132 t to 43,132 t LME. In addition, the quota will expire on December 31, 2035 (i.e., any quota not utilized by this date will be forfeited). Albemarle currently forecasts completion of the new battery grade production facility around mid-year 2021 (i.e., it is expected to meet this deadline).
•Provides for an additional quota of 34,776 t (as lithium metal) to feed a lithium hydroxide plant with production capacity of at least 5,000 metric tons/year should Albemarle construct a lithium hydroxide plant in Chile. Note SRK has not assumed the development of a lithium hydroxide plant and therefore has not included this quota in its analysis.
•Establishes royalties or commissions paid to CORFO on every tonne of product sold from the Salar de Atacama/La Negra according to the schedule presented in Table 16-7.
•Commencing on January 1, 2017 and continuing for approximately five years (until 31,559 t LME are produced), Albemarle will pay a commission on the production still remaining under the original quota, Thereafter, Albemarle will no longer pay any commissions on the lithium produced at the original 24,000 Mt carbonate plant, allowing Albemarle to produce the then-remaining metric tons of the original quota on a commission-free basis as per the terms of the original agreement with CORFO.
•If Chile develops a local downstream industry that requires battery grade lithium salts, Albemarle agrees to allocate a portion of its production (up to 25%) of those salts for sale to those local downstream producers at a discounted price (relative to Albemarle's export sales price). To date, development of downstream industry has not occurred, and Albemarle is therefore not selling any production at this discounted rate. SRK has not assumed any future discounted sales associated with this clause in this TRS as it is not aware of any planned or established downstream development.
•Albemarle will annually pay into a fund that will be used to develop R&D to benefit the Atacama, the country of Chile, and local industry. This payment is a fixed amount, inflated each year through the expiry of the quota at the end of 2043.
•Albemarle makes certain commitments to the local communities in the Atacama to use in local development projects equal to 3.5% of sales from Chilean production.
•Prohibits the sale of products with low value-add (e.g., raw brine, concentrated brine and/or refined brine in any degree of concentration).
•Royalty rates on potassium chloride will follow a sliding scale ranging from 3 to 20% of the sales price.
•Royalty rates on magnesium chloride, bischofite, carnalites, silvenites and halites is set at 10% of sales.
| | | | | |
SalardeAtacama_SEC_Report_515800.040 | December 2022 |
SRK Consulting (U.S.), Inc.
| | | | | |
SEC Technical Report Summary – Salar de Atacama | Page 209 |
Table 16-7: Updated CORFO Royalty/Commission Rates
| | | | | | | | | | | |
| Lithium Carbonate | Lithium Hydroxide |
| Price Range (USD/ton) | Progressive Commission Rate (%) | Price Range (USD/ton) | Progressive Commission Rate (%) |
| 0-4,000 | 6.8% | 0-4,000 | 6.8% |
| 4,000-5,000 | 8% | 4,000-5,000 | 8% |
| 5,000-6,000 | 10% | 5,000-6,000 | 10% |
| 6,000-7,000 | 17% | 6,000-9,000 | 17% |
| 7,000-10,000 | 25% | 9,000-11,000 | 25% |
| Over 10,000 | 40% | Over 11,000 | 40% |
Source: Albemarle 2017
The royalty/commission rate agreed with CORFO on Albemarle’s lithium production (lithium carbonate and other salts, excluding lithium chloride sales) from the combined Salar de Atacama/La Negra operation is calculated on the weighted average of third party sales (i.e., royalty is calculated based on end-customer price). For the purposes of this reserve estimate, SRK has utilized the US$10,000/t price for technical grade lithium carbonate forecast in Section 16.1.4 and applied the above royalty formula, which results in a product pricing forecast as outlined in Table 16-8 (a calculation at US$8,000/t is also shown for reference). Note that while the combined Salar de Atacama/La Negra operation will have the capacity to produce approximately 44,000 t of battery grade lithium carbonate (for LN1 and LN2 – 84,000 t considering LN3), for the purpose of simplifying the reserve modelling, SRK has assumed all production is technical grade product. Given Albemarle’s production and therefore reserve is limited by its production quota and not economic factors, in SRK’s opinion, this simplification will not impact it estimation of reserves for the operation.
Table 16-8: Product Pricing Forecast
| | | | | | | | | | | |
| Example Weighted Average Third Party Sales Prices (US$/Metric Ton LCE) |
| Example 1 | Example 2 |
| $8,000 | $10,000 |
| Weighted Average Third Party Sales Price (US$/Metric Ton LCE) | Progressive Commission Rate (%) | Incremental Commission Paid (US$/Metric Ton LCE |
| 0-4,000 | 6.8 | 272 | 272 |
| 4,001-5,000 | 8.0 | 80 | 80 |
| 5,001-6,000 | 10.0 | 100 | 100 |
| 6,001-7,000 | 17.0 | 170 | 170 |
| 7,001-10,000 | 25.0 | 250 | 750 |
| >10,000 | 40.0 | - | - |
Example Total Commission: Example Effective Rate | $872 10.9% | $1,372 13.7% |
Source: SRK 2021
| | | | | |
SalardeAtacama_SEC_Report_515800.040 | December 2022 |
SRK Consulting (U.S.), Inc.
| | | | | |
SEC Technical Report Summary – Salar de Atacama | Page 210 |
17Environmental Studies, Permitting, Social Factors
The following discusses reasonably available information on environmental, permitting and social or community factors related to the Salar de Atacama and La Negra operations. Where appropriate, recommendations for additional investigation(s), management actions, or expansion of existing baseline data collection programs are provided.
The section was developed through a desktop review, including information provided by Albemarle, and meetings with relevant Albemarle environmental staff. A site visit could not be conducted due to COVID-19 restrictions.
17.1Environmental Studies
Baseline studies, in both operational areas, have been developed since the first environmental studies for permitting were submitted; 1998 in La Negra, and 2000 at Salar de Atacama. The latest environmental baseline studies at La Negra were for the project "Modification Project La Negra Plant Expansion Phase 3" in 2018, and the latest studies for Salar de Atacama were for the project "La Negra Plant Expansion Phase 3" in 2016. With the ongoing monitoring programs in both locations, environmental studies, such as hydrogeology and biodiversity, are regularly updated.
The following is a summary of the environmental studies/conditions at both operational locations to date, including the latest monitoring information.
17.1.1General Background
La Negra is located in a normal desert climate, characterized by low relative humidity and large variability in daily temperatures. Average annual rainfall is less than 5 mm, and maximum daily rainfall is 48 mm on a return period of 100 years. Although precipitation is scarce, storm events of considerable magnitude can occur.
There are no perennial streams or drainages in the area of La Negra. However, some intermittent or ephemeral drainages occur in the northern area where the process facilities are located. These ephemeral drainages typically only flow following extreme precipitation events.
Salar de Atacama is located in a Marginal High Desert climate. The rainfall regime corresponds to summer rains, and also cyclonic origin rains, although both cases are rare events. Due to the altitude, temperatures are generally colder, with nominal annual temperature fluctuations, but larger daily low and high temperature ranges. Relative humidity is very low.
Average rainfall in Salar de Atacama is around 13 mm, with a maximum daily rainfall of 45 mm on the 100-year events. The Albemarle facilities are located entirely inside the Salar de Atacama, with few to no discernable surface water drainages, as rainwater quickly infiltrates the highly permeability flat saline crust.
Vegetation and wildlife are scare at La Negra. It is located within an industrial area which is in saturation conditions for the daily and annual standard of inhalable particulate matter (PM10). Although there are no surface water courses, there is an aquifer that could be affected by potential infiltrations from the plant facilities. As such, a water quality monitoring program is in place. Air quality, hydrogeology, and water quality have been deemed as key environmental characteristics of the La Negra area, and are carried forward for additional discussion below.
| | | | | |
SalardeAtacama_SEC_Report_515800.040 | December 2022 |
SRK Consulting (U.S.), Inc.
| | | | | |
SEC Technical Report Summary – Salar de Atacama | Page 211 |
The Salar de Atacama basin presents a unique system due to the biodiversity associated with lake and wetland systems that depend on the hydrogeological conditions of the area. There are also indigenous areas and communities in the sector. As such, the key environmental issues at Salar de Atacama include biodiversity, hydrogeology, and socioeconomics, which have been carried forward for additional discussion below.
No cultural inventories of relevance have been registered within the areas of disturbance for either La Negra or Salar de Atacama.
17.1.2La Negra
Air Quality
As the La Negra plant is located in an industrial area, there are several sources of air pollutant emissions. As noted above, the general area is in saturation conditions for PM10 in relation with the Chilean primary daily and annual standard.
For the projects that have been submitted for environmental evaluation at La Negra, the concentrations of inhalable (PM10) and fine particulate matter (PM2.5), and combustion gases (COx, NOx, and SOx) have been modeled, and the conclusions indicate that emissions from the La Negra Plant are not significant in relation to the other activities of the industrial area. Emissions from the La Negra Plant are related to vehicle traffic and emissions from fixed sources associated with the plant's processes.
Air quality is monitored at the existing Coviefi, La Negra and Inacesa stations.
Hydrogeology and Water Quality
The La Negra area contains four major hydrogeological units that are composed of alluvial and fluvial deposits of varying ages, and that represent different types of aquifers. In the upper level, the aquifer is of the semi-confined type and thick lithologies predominate in it with alternating levels of silts, clays and saline layers. In the underlying unit, fines predominate in relation to the other units. In the base, the unit of Old Gravel presents a high hydraulic conductivity since it is formed mainly by gravelly sands and sandy gravels, and whose confinement is given by the content of fines and the thickness of the superjacent unit in the sector. A lower sedimentary unit, corresponding to the Caleta Coloso Formation and with aquitard characteristics, outcrops mainly to the west of the fault zone, and is not represented in the profiles. The aquifer system overlies a more impermeable unit constituted by slightly fractured rocks of igneous origin belonging to La Negra Formation and Palaeozoic granitic rocks.
As a commitment of the environmental approval resolutions, monthly monitoring of an extensive list of physical and chemical parameters was developed, along with piezometric levels in two wells. (Figure 17-1) The monitoring points are:
•La Negra well: which corresponds to a groundwater exploitation well located at the La Negra Plant, in compliance with the resolution of water extraction, RE N°354/1989 of the General Water Directorate (DGA).
•Inacesa monitoring well: which is located in the plant of the same name of the cement company of the same name. It is a large diameter and shallow well. This well is in intermittent operation.
| | | | | |
SalardeAtacama_SEC_Report_515800.040 | December 2022 |
SRK Consulting (U.S.), Inc.
| | | | | |
SEC Technical Report Summary – Salar de Atacama | Page 212 |
•Carrizo: which corresponds to a surface water sampling location at the confluence of the Carrizo spring with the La Negra creek.
Source: Albemarle (2020). Informe de Seguimiento Ambiental. Monitoreo Mensual de Agua Subterránea y Superficial. Sector La Negra – Enero 2020. (Environmental Monitoring Report. Monthly Ground Water Monitoring La Negra Area – January 2020)
Figure 17-1: La Negra Water Quality Monitoring Points
The last two monitoring reports (January and February 2020) for these locations were reviewed for this assessment; no anomalies or exceedances of Chilean regulations where identified. Notwithstanding this, and according to information provided by Albemarle and historical information, some high concentrations of some parameters have been detected in the past, mainly in the Carrizo stream, where the groundwater and soil have high concentrations of several parameters (namely, arsenic, boron, lithium salts), but it is not known whether their origin is related to the Albemarle operations, third parties’ discharges, or natural sources. Specific studies of ecological risk and of risk to human health are being carried out, and a land survey has been scheduled, the results of which are expected to be available by the end of 2020, and through which an action plan will likely be defined.
| | | | | |
SalardeAtacama_SEC_Report_515800.040 | December 2022 |
SRK Consulting (U.S.), Inc.
| | | | | |
SEC Technical Report Summary – Salar de Atacama | Page 213 |
17.1.3Salar de Atacama
Hydrology - Hydrogeology
The Salar de Atacama is located in an endorheic basin with elevations ranging between 2,300 mamsl and 6,200 mamsl, covering an area of approximately 17,300 km2.
The area of lowest elevation in the basin corresponds to the salt flats (2,300 masl), which has an area of approximately 1,600 km2. Around the core, there are wetlands and lagoons that cover an area of approximately 1,100 km2. This area is known as the Marginal Zone. The lagoons are fed by limited surface runoff that reaches them through ephemeral surface drainages and groundwater springs.
The Salar de Atacama basin, and in the area surrounding the Albemarle facilities, there are areas of high sensitivity and ecological value. These are the lagoons located in the Salar's Marginal Zone. These lagoon systems mainly depend on the water contributions mostly coming from the aquifers, which in turn are recharged by the rainfall in the upper part of the basin. These sensitive areas include:
•La Punta-La Brava Lagoon System
•Peine Lagoon System
•Quelana Lagoon System
•Soncor Lagoon System
The brine of the Salar de Atacama core is currently being exploited by two mining companies: SQM (1,700 L/s) and Albemarle (442 L/s). This exploitation lowers brine water levels, which are measured in several monitoring locations. As expected, the drawdowns are greatest in those areas closest to the extraction wells, reaching several meters in some cases, and decreasing as the monitoring points move away.
Freshwater in the basin is also exploited. The largest exploitations are linked to mining activity by companies like Minera Escondida and Zaldívar, in the Negrillar and Monturaqui aquifers, in the south of the basin, and SQM along the eastern edge. Albemarle's freshwater rights represent less than one percent of the water rights granted in the basin.
Because of the sensitivity of these hydrologic systems, the environmental analysis of the La Negra Phase 3 Project required the development of a conceptual and numerical hydrogeological model (SGA, 2015) to evaluate both the direct effects of the project's brine extraction as well as the cumulative effects with other operations in the area. The results of the modeling effort concluded that the La Negra Phase 3 Project would not have significant effects on the sensitive areas, even under a non-favorable scenario of reduced recharge over the next 25 years.
In general, monitoring data of freshwater aquifer levels indicate that the levels in the system remain within their historical values allowing for the seasonal fluctuations typical of the Marginal Zone, due to the seasonal variation of the evaporation rate. Albemarle’s reports indicate that, in some areas, the above mentioned larger exploitations of freshwater have produced some reductions in water levels in the vicinity of the Soncor and Aguas de Quelana systems, and upstream of the La Punta-La Brava lagoon system, though without significant effects on the lagoon systems or protected ecosystems being observed so far.
| | | | | |
SalardeAtacama_SEC_Report_515800.040 | December 2022 |
SRK Consulting (U.S.), Inc.
| | | | | |
SEC Technical Report Summary – Salar de Atacama | Page 214 |
Considering that the last hydrogeological model available for review that assessed impact to water levels, was conducted in 2019, SRK recommends that this assessment be updated as needed based on monitoring information available to date.
It is important to note that the water authority is seeking to generate an integrated hydrogeological model of the entire basin, which will be fed by the monitoring information collected by all of the companies in the area, and which will allow a comprehensive follow-up of the effects of brine and freshwater extractions on water levels in ecologically sensitive areas.
Biodiversity
Lagoons, wetlands, and saltwater ecosystems have developed in the lower part of the Salar de Atacama basin, particularly on the margins of the Salar. These ecosystems contain a high degree of biological diversity in relation to their surroundings. These systems are made up of interconnected lagoons that possess unique characteristics and properties.
The systems of La Punta-La Brava and Peine in the south, and Aguas de Quelana and Soncor in the east (lagoon systems Soncor, Aguas de Quelana, Peine, La Punta and La Brava) constitute singular areas, given their importance in reproductive terms, their richness and proportion of species with conservation challenges, since inside these areas there occur species whose requirements of habitat are restricted, presenting a high sensitivity to changes in the environment.
Currently, this area has three types of protection, focused on preserving different components of each system. The first is focused on the protection of flamingos and includes the Soncor and Aguas de Quelana lagoon systems. It is established as the Los Flamencos National Reserve managed by the National Forestry Corporation (CONAF), created in 1990. The second is the site protected by the Convention on Wetlands (RAMSAR), which corresponds to the area of Soncor, which was incorporated in 1996, mainly because it is a nesting area for flamingos and migratory species. And finally, the third is Resolution No. 529 of the DGA of the Antofagasta region, which protects 17 wetlands within the Salar de Atacama.
In the Salar de Atacama, surfaces have been identified as having ecological elements and/or attributes, which could be negatively affected by any threat. These include:
•Presence of biological species in conservation category
•Presence of species with local and/or regional endemism
•Unique components
•Breeding areas of endangered species
Figure 17-2 shows the ecologically important areas, according to these criteria. All of the areas associated with the lagoon systems and wetlands of the Salar de Atacama are highly vulnerable, as they represent a significant number of sensitive and endemic species, with the presence of breeding areas for threatened species and the presence of sensitive elements, such as the wetlands.
| | | | | |
SalardeAtacama_SEC_Report_515800.040 | December 2022 |
SRK Consulting (U.S.), Inc.
| | | | | |
SEC Technical Report Summary – Salar de Atacama | Page 215 |
Source: Centro de Ecología Aplicada (2015). Plan de Manejo Biotico. Prepared for Rockwood Lithium. December 2015. (Biodiversity Management Plan)
Figure 17-2: Sensitive Ecosystems in Salar de Atacama
| | | | | |
SalardeAtacama_SEC_Report_515800.040 | December 2022 |
SRK Consulting (U.S.), Inc.
| | | | | |
SEC Technical Report Summary – Salar de Atacama | Page 216 |
The ecosystems and organisms found in the various wetlands are dependent on the contribution of groundwater that was structured in the Salar de Atacama basin. Therefore, any extraction that generates significant fluctuations in that water supply, particularly in the freshwater-salt aquifer, has the potential to impact these ecosystems and overall biodiversity.
From the point of view of species in conservation status, the mentioned systems present a high degree of sensitivity due to the presence of threatened species (according to the regulations for the classification of wild species Supreme Decree Nº 29/2011 from the Environment Ministry). Such is the case of the aquatic snail Heleobia atacamensis (Critically Endangered), the Yanez's tree iguana and Fabian's lizard Liolaemus fabiani (Endangered), the camelid Vicugna (Endangered), and eight species in the Vulnerable category (Lama guanicoe, Ctenomys fulvus, Vultur gryphus, Rhea pennata tarapacensis, Phoenicoparrus andinus, Phoenicopterus chilensis, Phoenicopterus jamesi and Chroicocephalus serranus).
Albemarle has developed a functional ecological model of the area, from which it has defined a biological environmental monitoring plan.
In the monitoring report available for review (winter 2018 to summer 2019), the state of the ecosystem is evaluated in the period 2016 to 2019). The results indicate that, in general terms, there is a maintenance of the current ecological state, without variations that constitute significant changes, which could be framed in the cycles of historical variation of the Salar ecosystem.
In addition to the biological monitoring plan, a Water Monitoring Plan and an Early Warning Plan have also been implemented. The details of these plans are discussed in the environmental monitoring section.
Social Issues and Communities
Salar de Atacama is located in the Antofagasta Region, municipality of San Pedro de Atacama, south-east of the city of Calama. Albemarle facilities at Salar de Atacama are located within an Indigenous Development Area (ADI) called “Atacama La Grande”, which has a population belonging to the Atacameña ethnic group.
The economy of the indigenous population is mainly based on primary and secondary economic activities. Cattle raising and agriculture, linked to the ancestral uses and customs of the Atacameña ethnic group, tourism and handicrafts.
In the municipality of San Pedro de Atacama, the most representative organizations are the indigenous organizations, which have been articulated around the ancestral ayllus of the Atacama ethnicity. There are 16 indigenous communities with legal status in San Pedro de Atacama.
Another category of indigenous associativity is that of indigenous associations or groups, which bring together different individuals or communities, from different territories, to develop areas of common interest. There are a total of 18 indigenous associations or groups in the San Pedro de Atacama municipality.
In general, and according to official surveys, the communities and people who live in the villages, identified as Atacameños, are below the poverty level or slightly above it. However, when making a detailed analysis of the situation in each locality, there is an important impact
| | | | | |
SalardeAtacama_SEC_Report_515800.040 | December 2022 |
SRK Consulting (U.S.), Inc.
| | | | | |
SEC Technical Report Summary – Salar de Atacama | Page 217 |
on the local economy produced by tourism (which provides direct resources in the villages), and above all, by the mining activity, where the inhabitants of Toconao, Socaire and Peine (mainly) work as employees.
The town of Peine is located 27 km from the Albemarle facilities and 108 km from the town of San Pedro de Atacama, at the southern end of the Salar de Atacama. Peine is a town that works as a residential site and as an agricultural productive area.
The Salar de Atacama area is also a relevant sector for tourism and is part of the Zone of Tourist Interest (ZOIT) San Pedro de Atacama Area - El Tatio Geothermal Basin.
Albemarle maintains agreements and relationships with all communities and groups in its area of influence.
Considering the presence of indigenous communities in the area, the development projects, that are submitted into the environmental impact assessment system, may require the development of an Indigenous Consultation Process according to the Chilean legislation.
17.1.4Known Environmental Issues
Currently, there are no known environmental issues that could materially affect Albemarle's capacity to extract the resources or reserves of the Salar de Atacama, as long as the brine extraction is kept at the values approved by the environmental authority. Any requirement of a brine extraction greater than the one approved (442 L/s) has an uncertain approval success, considering the multi-user conditions in the Salar de Atacama, the sensitivity of the ecosystem and the synergistic impacts on this ecosystem which concern the environmental and water authorities.
One foreseen potential risk is that the Early Alert Plan (PAT) could be activated because of the exceeding of any established threshold, which could imply reducing the amount of brine to be extracted.
17.2Environmental Management Planning
The environmental management of the operations in La Negra and Salar de Atacama are developed according to their environmental commitments that have emerged from the projects evaluated and approved by the environmental authority (SEA) and supervised by the Environmental Superintendence (SMA).
Chilean environmental legislation does not consider additional environmental management plans, with the exception of Hazardous Waste Management Plans, required by the Health authority for operations that annually generate more than 12 t of hazardous industrial waste.
According to each operation, and their environmental commitments, the following are the management plans for La Negra and Salar de Atacama facilities:
•La Negra:
◦Water Quality Monitoring Plan
◦Emergency and Contingency Prevention Plan
◦Hazardous Waste Management Plan
•Salar:
◦Biodiversity Monitoring Plan
| | | | | |
SalardeAtacama_SEC_Report_515800.040 | December 2022 |
SRK Consulting (U.S.), Inc.
| | | | | |
SEC Technical Report Summary – Salar de Atacama | Page 218 |
◦Environmental Water Monitoring Plan
◦Early Warning Plan
◦Emergency and Contingency Prevention Plan
◦Hazardous Waste Management Plan
The main environmental management issues for the La Negra and Salar de Atacama facilities are summarized below.
17.2.1Tailing Disposal
Although Albemarle's operation does not have tailings, per se, it does generate liquid waste at La Negra, which is managed as follows.
The process at the La Negra Plant up to Phase 2, collects solid/liquid waste together (in a wet state) in the existing system of evaporation and sedimentation ponds. Phase 3 considers a waste disposal system that includes the segregation of liquid and solid waste. The solid waste will be stored as low moisture solids (collection sites) and the liquid waste will be treated as recovery waste to be recycled to the plant using the La Negra Evaporation and Sedimentation Ponds system.
The Lithium Carbonate Plant generates liquid waste, mainly from the SX process. The operation considers technology to reuse the mother liquor and thus optimize the use of process water and in turn recover lithium. The water generated in the different stages of the process, including the solutions coming from the cleaning of equipment (HCL or H2SO4), will be taken to the thermal evaporator and then returned to the process for reuse.
The mother liquor is sent to the thermal evaporation plant or to the solar evaporation system. From the thermal system, a high purity water stream (condensate) is recovered for recycling into the process. The by-products of the thermal evaporation plant are NaCl (salt) and a weak LiCl brine stream that is recycled to the process. In the solar evaporation system, the water is evaporated by solar radiation and the by-product salt is precipitated and accumulated in ponds.
The process of brine concentration by means of solar evaporation ponds generates the precipitation of waste salts that are extracted from the ponds and are currently accumulated in stockpiles. (See waste discussion)
The evaporation/sedimentation ponds are lined with low-permeability PVC geomembrane.
The operation at La Negra has a system of wells to monitor infiltration. In the event that infiltration is detected, either due to an increase in the piezometric level or changes in the chemical quality of the water attributable to such infiltration, these are captured by the wells, and the relevant studies will be carried out. At the same time, the possible point of infiltration from the pond will be detected in order to proceed with its repairs (as needed).
According to information provided by Albemarle, the plant's water balance was recently updated, and the results indicated that the current and approved facilities may not be enough to handle the future process' liquid waste solutions. As such, a work plan has been defined to provide a solution to this issue in the long term, along with defining and implementing measures in the short term to manage the liquid waste until a final solution is identified and developed. Albemarle is progressing these plans and SRK sees this as a low risk.
| | | | | |
SalardeAtacama_SEC_Report_515800.040 | December 2022 |
SRK Consulting (U.S.), Inc.
| | | | | |
SEC Technical Report Summary – Salar de Atacama | Page 219 |
17.2.2Waste Management
La Negra
Process Reagents
Processing reagents used at La Negra include hydrochloric acid (HCl), sulfuric acid (H2SO4), an extractant, sodium hydroxide (NaOH), a solvent, soda ash, and lime. All of these are stored in warehouses authorized by the Chilean Health Service and comply with the conditions established in the legislation applicable to hazardous substances, when applicable.
Fuels
Fuel is not stored at La Negra. Rather, it is brought from the Salar de Atacama facilities and other authorized suppliers. The fuel is transported in trucks certified by the Superintendence of Electricity and Fuel.
Disposal of Non-Hazardous and Hazardous Waste
Domestic solid waste is temporarily stored of at a site authorized by the Health Service and transferred for final disposal outside the facilities to an authorized landfill in the region. Non-hazardous waste is segregated at its source and disposed of in a yard (salvage yard) authorized by the Health Service. From here, it is disposed of in authorized locations or reused. Hazardous industrial waste, which includes mainly vehicle batteries, oil filters, rags contaminated with grease and oil, waste oils, paints, contaminated personal protective equipment (PPE), among others, are temporarily disposed of in a warehouse authorized by the Health Service, and then transported to authorized off-site disposal sites.
Residual Salts
The process of brine concentration by means of solar evaporation ponds generates the precipitation of waste salts that are excavated from the pools and accumulated in stockpiles. (See tailings section)
The process generates three types of solid salt wastes:
•Ca and Mg carbonates and hydroxides from the brine purification stage
•Ca/Na borates from the boron precipitation (removal) process
•NaCl from the thermal evaporation system
Stockpiles of these materials are located to the north and south of the plant. The solids are separated and placed in stockpiles; specifically, the sodium chloride is separated from the rest of the solids.
The solid waste has a typical moisture content of less than 30%, which allows it to be stored in collection sites with an average height of 6 m above ground level and an area of approximately 5 to 30 ha each.
The salt stockpiles are constructed on a 0.75 mm-thick PVC geomembrane with chemical resistance and resistance to ultra-violet radiation. In addition, they have a 200 gr/m2 geotextile layer in order to prevent the geomembrane from breaking.
| | | | | |
SalardeAtacama_SEC_Report_515800.040 | December 2022 |
SRK Consulting (U.S.), Inc.
| | | | | |
SEC Technical Report Summary – Salar de Atacama | Page 220 |
Salar de Atacama
Process Reagents
The chemical reagents used at Salar de Atacama include: HCl, methyl iso-butyl carbonyl (foaming agent), Crisamine (collector) and Cricell (depressant). These are stored in warehouses authorized by the Health Service, and which comply with the conditions established in the legislation applicable to hazardous substances, when applicable.
Fuels
Salar de Atacama maintains a plant fuel supply, operated by an authorized outside company, which consists of a tank, which complies with the regulations for the storage of liquid fuels for self-consumption (Supreme Decree Nº 379/86 of the Ministry of Economy) and is authorized by the Superintendence of Fuels.
Disposal of Non-Hazardous and Hazardous Waste
Domestic solid waste is temporarily stored onsite at a location authorized by the Health Service and later transferred offsite to an authorized landfill in the region for final disposal. Non-hazardous waste is segregated at its source and disposed of in a yard (salvage yard) authorized by the Health Service, from here, it is disposed of in authorized locations or reused. Hazardous industrial waste, consisting of mainly vehicle batteries, oil filters, rags contaminated with grease and oil, used oils, paints, contaminated PPE, among others, are temporarily stored in a warehouse authorized by the Health Service, and then transported to authorized final disposal sites.
Residual Salts
At Salar de Atacama, brine is extracted from wells, and the brine concentration process is through solar evaporation ponds, where the precipitation of waste salts is generated, these waste salts are excavated from the ponds and deposited in stockpiles. As the lithium chloride solution is concentrated, different salts precipitate in each pond, among which include halite, bischofite, carnallite and sylvite. The latter is entered into the Potash Plant to produce KCL and carnallite. Once the brine is concentrated at 6% Li, the brine is sent to La Negra Plant.
17.2.3Water Management
La Negra
The industrial water used in the operation comes from water acquired from third parties and, to a lesser extent, from an existing well at the facilities with water rights for up to 6 L/s.
At La Negra, the brine from Salar de Atacama is purified for the extraction of lithium. All solutions are evaporated and/or recirculated to the process. As indicated in the waste section, the updated process water balance indicates that the current facilities are not sufficient to handle the residual solutions, and a long-term solution needs to be identified.
Stormwater runoff, though infrequent, is managed through a series of diversion channels around the plant, ponds, and stockpiles areas.
| | | | | |
SalardeAtacama_SEC_Report_515800.040 | December 2022 |
SRK Consulting (U.S.), Inc.
| | | | | |
SEC Technical Report Summary – Salar de Atacama | Page 221 |
Salar de Atacama
The freshwater used in the process at Salar de Atacama is extracted from wells in Tilopozo, Tucucaro, and Peine, with a total water right granted by the DGA of 23.5 L/s. Currently, 16.9 L/s are being consumed in the process.
Albemarle exploits brine from the core of the Salar de Atacama by means of extraction wells, with an authorized exploitation extraction rate of 442 L/s.
As noted above, the extraction of brine and freshwater by Albemarle and other companies in the basin, has the potential to cause groundwater levels to drop which could impact lagoon and wetland systems of high ecological value. Albemarle has an Environmental Water Monitoring Plan (EWMP), a Biodiversity Monitoring Plan, and an Early Warning Plan, oriented to follow up on critical variables, and prevent unexpected effects on these systems that are being monitored. These plans are described in the monitoring section.
17.2.4Monitoring
La Negra
The monitoring at La Negra is related with the commitments from the main environmental approvals (RCA Nº46/1999 and RCA Nº 278/17). There is an eight point monitoring program, seven for underground water and one for surface water. For RCA Nº46/1999, monitoring points are La Negra well, Well Nº4 of INACESA, and a spring in Carrizo drainage. For RCA Nº278/17, 5 new wells were added to the monitoring program, with the objective of monitoring eventual infiltrations from the ponds. The parameters measured at these monitoring points are presented in Table 17-1.
Table 17-1: La Negra Water Monitoring Parameters
| | | | | | | | |
| Parameters | Number of Monitoring Points | Frequency |
| In-Situ Parameters |
| Water Level |
pH (s.u.) Electrical Conductivity (EC) Temperature (*) | | |
| In Laboratory: |
pH (*) EC Total Dissolved Solids (TDS) Density (*) Total alkalinity (*) (reported expressed as CO3) Cl dissolved SO4 dissolved (*) HCO3 dissolved NO3 dissolved Ca total (*) and dissolved Na total (*) and dissolved Mg total (*) and dissolved K total (*) and dissolved Li total (*) B total (*) Strontium (Sr) total Iron (Fe) total Iron (III) (*) (expressed as Fe2O3) | 8 (*) | Monthly |
(*) Parameters measured for the sample points associated to RCA 46/1999.
Source: Albemarle (2020): Respuestas para auditoría interna realizada por SRK Consulting.
| | | | | |
SalardeAtacama_SEC_Report_515800.040 | December 2022 |
SRK Consulting (U.S.), Inc.
| | | | | |
SEC Technical Report Summary – Salar de Atacama | Page 222 |
Salar de Atacama
Environmental Water Monitoring Plan
At Salar de Atacama, an EWMP has been implemented which includes meteorological, hydrological, and hydrogeological data from both the Salar de Atacama core and its eastern and southern edges, and the Marginal Zone, where the Soncor, Aguas de Quelana, Peine and La Punta-La Brava lagoon systems are located. These data are used to update the numerical model developed to evaluate the behavior and cumulative effects of the different brine and freshwater extraction projects that coexist in Salar de Atacama area.
Monitoring is carried out in four sectors, determined according to their hydrological and hydrogeological characteristics:
•La Punta-La Brava áreas
•Peine area
•North and east side of Salar de Atacama
•Salar de Atacama core area
A summary of the environmental variables and parameters are presented in Table 17-2.
Table 17-2: Salar de Atacama Environmental Monitoring Points
| | | | | | | | | | | | | | |
| Environment Component | Environment Variable | Parameters | Number of Measurements | Frequency |
| Climate and Meteorology | Meteorological Variables | Daily precipitation [mm], Atmospheric temperature [ºC], Evaporation [mm], Atmospheric pressure [mbar] | 1 | Diary (Continuous) |
| Hydrology | Surface covered by lagoons | Area in [m2] of lagoon systems | 4 | Biannual |
| Limnimetric Level of the Lagoons | Water level [meters amsl] | 17 | Monthly |
| Surface flow rate | Flow rate [L/s] | 6 | Quarterly |
| Hydrogeology | Evapotranspiration | Evaporation rate [mm/day] | 22 | Quarterly |
| Phreatic levels in brine and freshwater | Depth Level [meters amsl] | 124 | Monthly |
| Saline Interface Position | Electrical Conductivity [µS/cm] v/s Depth [meters amsl] | 14 | Quarterly |
| Brine and Freshwater Pumped Flow | Brine flow rate [L/s] | 19 | Monthly |
| Industrial water flow rate [L/s] | 3 | Monthly |
| Water Quality | Chemical quality of surface and groundwater | Physical parameters in situ: pH, EC, temperature, TDS and Dissolved Oxygen (DO). Laboratory physical-chemical parameters: pH, EC, TDS and density. Major elements: Cl, SO4, HCO3, NO3, Ca, Mg, Na, and K. Minor elements and dissolved traces: Al, As, B, Fe, Li, Si, Sr. | 40 | Quarterly |
Source: Albemarle (2020): Answers for internal audit by SRK Consulting
| | | | | |
SalardeAtacama_SEC_Report_515800.040 | December 2022 |
SRK Consulting (U.S.), Inc.
| | | | | |
SEC Technical Report Summary – Salar de Atacama | Page 223 |
The results database of the water environmental monitoring plan is submitted to the SMA on a quarterly basis, and a consolidated report is delivered annually. In addition, data on brine and freshwater extraction rates are reported online.
Early Warning Plan
The operation has an Early Warning Plan (PAT) whose objective is to timely detect any deviation from baseline conditions. The plan includes status indicators and activation levels or thresholds at specific points, from which measures are activated to mitigate potential impacts.
The PAT is focused on the prevention and control drops in groundwater levels in the Salar de Atacama Core (brine levels) in points located in front of the Peine and La Punta-La Brava lagoon systems, as well as in the areas that feed these systems, located in the Marginal Zone. The plan also considers the adoption of preventive measures in relation to the activation of some of the Phases foreseen by SQM's PAT in the brine level control points in the core in front of the Soncor and Aguas de Quelana systems, where the cumulative effects of the different existing extractions have to be evaluated, if a threshold is exceeded. For this purpose, a specific tool to verify the cumulative effect has been defined in order to validate the overlapping effects on the levels of the basin, considering the extraction of all the operators in the basin.
The execution of the EWMP, together with the actions or preventive measures included in the PAT and the activation of the cumulative effect tool, are used to monitor and mitigate any groundwater level issues in the Salar de Atacama basin and, more importantly, any effect beyond that which has already been predicted through hydrogeological modeling strictly and decisively.
Biodiversity Environmental Monitoring Plan
The Biodiversity Environmental Monitoring Plan (PMB) aims at early detection of any changes in the ecological status in the area of influence of the operation as a result of local, regional and/or global phenomena. The PMB includes monitoring in the following areas:
•La Punta and La Brava System, including La Punta and La Brava lagoons
•Peine System, including Salada, Saladita and Interna lagoons
•Tilopozo System, formed by the Tilopozo wetlands
•The plan also includes two areas located in the north and east zone of the Salar de Atacama for which lagoon surface areas and flora are monitored:
◦Soncor system, including Barros Negros and Chaxa lagoons
◦Quelana and Aguas de Quelana (both located in the Los Flamencos National Reserve)
Table 17-3 summarizes the parameters and frequency for each of the monitoring points in the PMB.
| | | | | |
SalardeAtacama_SEC_Report_515800.040 | December 2022 |
SRK Consulting (U.S.), Inc.
| | | | | |
SEC Technical Report Summary – Salar de Atacama | Page 224 |
Table 17-3: Salar de Atacama Biodiversity Monitoring Plan
| | | | | | | | | | | | | | |
| Component | Sub-component | Frequency | General variables | Number of Points |
| Biota | Terrestrial Flora | Biannual | Species composition and coverage | 31 |
| Terrestrial Vegetation | Biannual/ Annual | Distribution and coverage of azonal vegetation | 61 |
| Wildlife | Biannual | Composition, Richness and Abundance | 25 |
| Aquatic flora and fauna | Biannual | Composition, Richness and Abundance | 14 |
| Microbial Mats | Biannual | Characterization/Presence of evaporites and microbialites | 16 |
| Soil | Substrate | Biannual | Physics and Chemistry | 14 |
| Sediment | Biannual | Physics and Chemistry | 14 |
| Water | Water Quality | Biannual | Physics and Chemistry | 14 |
| Lagoons | Biannual | Phreatic level lagoons | 5 |
| Lagoons | Biannual | Surface of water bodies | - |
Source: Albemarle, 2020 (Respuestas para auditoría interna realizada por SRK Consulting
Monitoring is conducted on a semi-annual basis (winter and summer), except for active vegetation coverage (according to the NDVI index estimation), which is annual and must be done in post-rain periods, typically after the Altiplanic Winter. With respect to lagoon coverage, the surveys are carried out in the months of August (together with the winter field survey) and December of the calendar year (summer analysis).
A report of each winter and summer survey, and an annual report, are sent to the SMA.
17.2.5Air Quality
Based on atmospheric emissions studies conducted for various Albemarle projects, the contributions of the La Negra Plant to the total emissions in the area, are low in proportion to the other industrial activities.
The environmental management measures to minimize air emissions from the operation at La Negra include:
•Dust collectors in the equipment of Planta La Negra
•Paving of access road (7 km) to the stockpile area
•Installation of bischofite in interior roads
•Waterproofing of salt collection sites and ponds
•Transfer of residual salt in trucks
•Transfer of the final product in airtight containers
•Transfer of brine in watertight cistern trucks
•Paving of 1,002 m of streets in the project's area of influence
An isokinetic measurement for Particulate Matter of 10 microns (PM10) is performed annually by means of the CH-5 method, in at least five emission control equipment per year (four from the Lithium Carbonate recovery section and one from the Soda Ash preparation section), alternating until completing the 15 equipment and continuing with the cycle.
| | | | | |
SalardeAtacama_SEC_Report_515800.040 | December 2022 |
SRK Consulting (U.S.), Inc.
| | | | | |
SEC Technical Report Summary – Salar de Atacama | Page 225 |
17.2.6Human, Health and Safety
Albemarle has an Occupational Health and Safety Management System. The framework of this system was taken from the System Manual, applicable to the plant at Salar de Atacama. The Salar Plant has a Safety Department and a Joint Hygiene and Safety Committee in accordance with the regulations for mining and safety in Chile. Albemarle also has an integrated management policy for Quality, Environment, Safety and Occupational Health and Sustainability. The system includes an annual audit to verify compliance with the regulations associated with the relevant occupational health and safety regulations, and includes the following preventive management tools:
•Safety meetings
•Inspections and planned observations
•Safe Work Permit
•Safe Work Analysis
•Executive monthly report from the Safety Department
•Hazard Identification and Risk Assessment
•Emergency Plan
Albemarle has an annual risk management program for its contractors and subcontractors, in which all elements of the management system are applied and monitored, including a program for the accreditation of contractors and subcontractors.
17.3Project Permitting
17.3.1Environmental Permits
SCL began operating in the Salar de Atacama in 1981 when there was no environmental legislation in Chile. It was not until 1998 that SCL projects were submitted to the Chilean environmental evaluation system, with the facilities in La Negra, and in the year 2000 for the facilities in Salar de Atacama. In 2012, SCL became Rockwood Lithium, which was acquired by Albemarle Corporation three years later.
The environmentally approved operation includes a brine extraction of 442 L/s, the production of 250,000 m3/year of brine concentrated in solar evaporation ponds with an approximate surface area of 1,043 ha, for a production of 94,000 t/year of LCE. Brine exploitation is authorized until 2043. Any modification of the production and/or extraction, or to any approved conditions, will require a new environmental permit.
The subsequent environmental approvals at La Negra and Salar de Atacama are presented in Table 17-4. The table also provides information about the instrument submitted to the Chilean Environmental Impact System (SEIA). According to Chilean legislation, an Environmental Impact Study (Estudio de Impacto Ambiental, EIA) is required to be submitted by the proponent for projects or project modifications where significant environmental impacts are expected to occur, and where specific measures for impact avoidance, mitigation, or compensation will need to be agreed upon. Alternatively, an Environmental Impact Declaration (Declaración de Impacto Ambiental, DIA) is required to be submitted by the proponent for projects or project modifications that are significant enough to warrant environmental review, but which are not expected to result in significant environmental impacts, as these are defined legally. A Relevance Consultation (Consulta de Pertinencia) must be submitted when the project
| | | | | |
SalardeAtacama_SEC_Report_515800.040 | December 2022 |
SRK Consulting (U.S.), Inc.
| | | | | |
SEC Technical Report Summary – Salar de Atacama | Page 226 |
proponent has doubts or needs clarification on whether a project, activity, or modification must submit to the SEIA.
| | | | | |
SalardeAtacama_SEC_Report_515800.040 | December 2022 |
SRK Consulting (U.S.), Inc.
| | | | | |
SEC Technical Report Summary – Salar de Atacama | Page 227 |
Table 17-4: Albemarle Projects in the Antofagasta Region with Environmental License
| | | | | | | | | | | | | | |
| Project Name | Instrument | Location | Legal Approval | Description |
| Lithium Chloride Plant | EIA | La Negra | RCA N° 024/1998 | Diversification of the product portfolio offered to the market through the production of anhydrous lithium chloride, with a production of 3,628 tonnes/year of lithium chloride. |
| Lithium Chloride Plant Modification | DIA | La Negra | RCA N° 046/1999 | Change of the raw materials (lithium carbonate and hydroxide) that feed the Lithium Chloride Plant to refined brine and purified lithium carbonate, in order to reduce the consumption of both hydrochloric acid and lithium hydroxide. |
| Construction of solar evaporation ponds | DIA | Salar de Atacama | RCA N° 092/2000 | Construction of 10 additional wells to the 17 already existing ones, comprising a total area of 680,000 m2. The project will allow for an increase in brine production from 60,000 tonnes/year to 80,000 tonnes/year, due to the increase of brines treated, because of the expansion of the well system with a total extraction flow of 113 L/s distributed in 12 pumping wells. Monitoring commitments were established. |
| Conversion to natural gas | DIA | La Negra | RCA N° 200/2000 | Change of the supply of the La Negra Plant from diesel to natural gas by pipeline connection. |
| Modification of the “Construction of solar evaporation ponds” project | DIA | Salar de Atacama | RCA N° 3132/2006 | The amount of brine production of 80,000 m3 was not achieved, so 3 wells are added to complete two systems of 15 wells each, adding an area of 37 ha and additional brine extraction of 29 L/s, reaching a total of 142 L/s. Monitoring commitments were established. |
Modification and improvements of the Operations of La Negra Plant Phase 1 | DIA | La Negra | RCA N° 264/2008 | Consider the regularization of the increase in the production capacity of the lithium carbonate plant from 45 to 53 million pounds/year and the construction of 5 sedimentation and evaporation ponds with a capacity of 1,330,000 m3 for the disposal of liquid and solid waste. Use of new technologies for process automation. |
Expansion of La Negra Lithium Chloride Plant Phase 2 | DIA | La Negra | RCA N° 236/2012 | Increase in the production capacity of the Lithium Carbonate Plant from 53 million pounds per year authorized to reach 100 million pounds per year, through the expansion and improvement of the processes of the La Negra Plant. |
| Potash Plant Rockwood Litio Ltda. | DIA | Salar de Atacama | RCA N° 0403/2013 | Operation of the Dryer and the construction and operation of a Granulation Plant, both of which will form part of the process to obtain the product potassium chloride. |
| Removal of nitrate from lithium chloride brine, La Negra Plant | Consulta de Pertinencia | La Negra | Extent Resolution Nº 400/2013 | Considers standardizing the removal of nitrate from lithium chloride brine by incorporating a second stage of solvent extraction (SX) from refined brine following the boron extraction process, using tributyl phosphate (TBP) as the extractant and a solvent, both of which are confined to a closed system, to be subsequently recirculated to the extraction process. |
| Research drilling in the Southwest of Salar de Atacama | Consulta de Pertinencia | Salar de Atacama | Extent Resolution Nº 614/2013 | Drilling of research wells in the protected area, specifically in the aquifer that feeds the wetlands of the southern sector of the Salar de Atacama. |
| Research drilling in the Salar de Atacama Core area | Consulta de Pertinencia | Salar de Atacama | Extent Resolution Nº 673/2014 | Drilling of research wells and observation piezometers in the Salar de Atacama core area, in addition to the execution of pumping tests to determine the hydraulic properties of the medium. |
| | | | | |
SalardeAtacama_SEC_Report_515800.040 | February 2021 |
SRK Consulting (U.S.), Inc.
| | | | | |
SEC Technical Report Summary – Salar de Atacama | Page 228 |
| | | | | | | | | | | | | | |
| Use of weak brine from Planta La Negra in process Planta el Salar process. | Consulta de Pertinencia | Salar de Atacama y La Negra | Extent Resolution Nº 673/2014 | Re-use of 8,030 m3/m of the supernatant of the solution arranged in the evaporation pond of the La Negra plant towards the productive process of the Salar de Atacama Plant, to be reincorporated in the existing system of solar evaporation ponds. In this way, this brine is concentrated up to 6% of lithium, which will be sent to the La Negra plant to be used in the process. |
| Modification and improvement solar evaporation ponds system | EIA | Salar de Atacama | RCA N° 021/2016 | Considers the increase of the brine extraction flow rate in 300 L/s (total 442 L/s), pumping of 16.9 L/s of water from the Tucucaro and Tilopozo wells, the construction of 2 well systems and 4 pre-concentration wells. The project has a useful life of 25 years. Includes the construction of new solar evaporation surfaces. The project considers increasing the current 326 hectares in an area of 510 hectares, to reach a total area of 836 hectares. Monitoring and an early monitoring plan were committed. The operation of this project started on September 28, 2016. |
| Phase 3 La Negra Plant Expansion | DIA | La Negra and Salar de Atacama | RCA N° 0279/2017 | Increases the production capacity of the Lithium Carbonate Plant located in the La Negra from 45,300 tonnes/year to reach a production of 88,000 tons/year of lithium carbonate, maintaining the production capacity of 4,500 tons/year of lithium chloride (equivalent to 6,000 tons/year of lithium carbonate equivalent (LCE)), thus achieving a total production of 94,000 tonnes/year LCE. In order to achieve this increase in production, modifications are required in the La Negra and Salar de Atacama Plants. The changes in the Salar de Atacama are: New pre-concentrator and a new system of evaporator wells, which will allow a production of 250,000 m3/year of concentrated lithium brine at 6%, without modifying the amount of brine extraction authorized from the Salar de Atacama (442 L/s). Twelve new salt collection sites, which will allow the precipitated salts of the current evaporation pool systems and the new evaporation pool system (System N° 5) to be disposed of. |
| Optimizing Efficiency and Sustainability Lithium Recovery Salar de Atacama Plant | Consulta de Pertinencia | Salar de Atacama | Extent Resolution 052/2018 | Introduces improvements in the process of obtaining concentrated brine through the treatment processes of Bischofite and Li Carnalite, to improve efficiency in the recovery of lithium from 55% to a value in the order of 67%. |
| Modifications Phase 3 La Negra Plant Expansion | Consulta de Pertinencia | La Negra | Extent Resolution 89/2018 | Makes modifications in the lithium carbonate processing lines and related services, with the aim of achieving the authorized processing capacity. |
| Exploration campaign for A2 area and the polygon South-East of the Salar de Atacama | Consulta de Pertinencia | Salar de Atacama | Extent Resolution 113/2018 | Well drilling and pumping tests for exploration and geotechnical and hydrogeological knowledge of the surrounding of the exploitation areas. |
| Albemarle Camp, Planta Salar de Atacama | Consulta de Pertinencia | Salar de Atacama | Extent Resolution 158/2018 | Installation of a new camp to serve a total population of 600 people in 2 phases. |
| Deepening of brine extraction wells in the Salar de Atacama | Consulta de Pertinencia | Salar de Atacama | Extent Resolution 947/2018 | Pumping of 120 L/s of brine authorized in zone A1, up to a depth of 200 m, for a period of 5 years. |
| | | | | |
SalardeAtacama_SEC_Report_515800.040 | February 2021 |
SRK Consulting (U.S.), Inc.
| | | | | |
SEC Technical Report Summary – Salar de Atacama | Page 229 |
| | | | | | | | | | | | | | |
| Modification of the project Phase 3 La Negra Plant Expansion | DIA | La Negra | RCA N° 077/2019 | Incorporation of new equipment in La Negra, in order to have an operational improvement and reach the approved production. Regularization and modification of the contour channel. |
| Expansion of the Salar de Atacama water monitoring network | Consulta de Pertinencia | Salar de Atacama | Extent Resolution 323/2019 | Construction of 16 boreholes to obtain information on freshwater-salt water levels in order to better understand the hydrogeological behavior in some sensitive sectors, where there is not enough information. |
Source: Prepared by SRK based on information from Albemarle projects submitted into the Chilean Environmental Impact Assessment System, available at www.sea.gob.cl
| | | | | |
SalardeAtacama_SEC_Report_515800.040 | February 2021 |
SRK Consulting (U.S.), Inc.
| | | | | |
SEC Technical Report Summary – Salar de Atacama | Page 230 |
A new EIA is planned in order to make production in the Salar de Atacama more flexible. This will begin to be developed during 2020 and should be submitted by the end of 2021. Increased brine extraction over what has already been approved (442 L/s), is currently not being considered.
In order to follow the compliance with applicable regulations and the obligations established in the environmental approvals of Albemarle's operations in Chile, a management platform (GISMA) was fully implemented during 2020.
17.1.2Operating Permits
In addition to the main environmental permit, there are sectorial permits or operational permits that are required for construction and operation of new facilities or modification to approved facilities. These permits are granted by many different agencies, including the DGA (Dirección General de Aguas, DGA), the National Geology and Mining Service (Servicio Nacional de Geología y Minería, SERNAGEOMIN), and the Health Ministry (Ministerio de Salud).
Both La Negra and Salar de Atacama have their main permits to operate. Table 17-5 shows the types of permits granted for each area. Currently, there are some operational permits which have not yet been granted. These permits are mainly related to new facilities or changes associated to the Phase 3 of the operation. Pending permits are related with construction permits granted by the local municipality. The company is working on obtaining these permits, with a schedule anticipating approval in Q2 2021.
Table 17-5: Operational Permits for La Negra and Salar de Atacama Albemarle Facilities
| | | | | | | | | | | |
| Facility/Activity | Area | Permit | Issuing Authority |
Evaporation ponds Sedimentation ponds Tailings ponds | La Negra | Disposal of industrial liquid waste | Regional Ministry of Health |
Sedimentation ponds Evaporation ponds | La Negra | Disposal of industrial solid waste | Regional Ministry of Health |
| All industrial facilities | La Negra
Salar de Atacama | Industrial Technical qualification | Regional Ministry of Health |
| Solid waste disposal yards | La Negra
Salar de Atacama | Temporary disposal of non-hazardous waste, project and operation | Regional Ministry of Health |
| Hazardous waste warehouses | La Negra
Salar de Atacama | Temporary disposal of hazardous waste, project and operation | Regional Ministry of Health |
| All areas | La Negra
Salar de Atacama | Temporary disposal of domestic wastes, project and operation | Regional Ministry of Health |
| All areas | La Negra
Salar de Atacama | Hazardous waste management plan | Regional Ministry of Health |
| All areas | La Negra
Salar de Atacama | Potable water supply system, project and operation | Regional Ministry of Health |
| All areas - Sewage treatment plants | La Negra
Salar de Atacama | Sewage system, project and operation | Regional Ministry of Health |
| Hazardous substances warehouse | Salar de Atacama | Storage of hazardous substances | Regional Ministry of Health |
| Equipment washing area | Salar de Atacama | Water treatment system | Regional Ministry of Health |
SRK Consulting (U.S.), Inc.
| | | | | |
SEC Technical Report Summary – Salar de Atacama | Page 231 |
| | | | | | | | | | | |
| Casinos | La Negra
Salar de Atacama | Casino operation | Regional Ministry of Health |
| Transport of food for the Casino | Salar de Atacama | Sanitary Authorization for Vehicles Transporting Foods that Require Cold Storage | Regional Ministry of Health |
| Discard salt | Salar de Atacama | Disposal of mining waste | Regional Ministry of Health |
| Ambulance | La Negra
Salar de Atacama | Sanitary transport | Regional Ministry of Health |
| Polyclinic | La Negra
Salar de Atacama | Sanitary authorization for medical procedure room | Regional Ministry of Health |
Chloride Pant
Fourth Train Plant
Carbonate plant | La Negra | Boiler register | Regional Ministry of Health |
| Stockpiles of discard salts | La Negra
Salar de Atacama | Waste dumps | National Service of Geology and Mining |
| All areas | La Negra
Salar de Atacama | Closure plans | National Service of Geology and Mining |
| Brine extraction | Salar de Atacama | Exploitation method | National Service of Geology and Mining |
| All plants | La Negra | Mineral processing plant | National Service of Geology and Mining |
| Sedimentation and evaporation ponds | La Negra
Salar de Atacama | Hydraulics works | General Directorate of Water |
| Several new constructions (Phase 3) | La Negra
Salar de Atacama | Building permits | Municipality |
| All constructions | La Negra
Salar de Atacama | Favorable report for construction (land use) | Regional Ministry of Agriculture |
| Various new facilities (Phase 3) | La Negra | Final reception of works | |
| All areas | La Negra
Salar de Atacama | Limited telecommunications service permit | Undersecretary of communication |
| All areas | La Negra
Salar de Atacama | Declaration of indoor installation of gas and liquid fuels | Superintendence of Electricity and Fuels |
| All areas | La Negra
Salar de Atacama | Internal electrical declaration | Superintendence of Electricity and Fuels |
Main stack gas emission natural gas (CO2, NOx, SO2)
Wet air stack with particulate emissions | La Negra | Application for Height Certificate for buildings near an airport, airfield, heliport or radio aid | Ministry of Justice |
| Densimeters | La Negra | Transport of radioactive material | Chilean Nuclear Energy Commission |
| Plant access | La Negra | Access to public road | Highway administration Bureau |
Crossing Line 23kV with Aqueduct FCAB
Crossing HDPE (Tunnel Liner) under FCAB Railway Line
Crossing Sewer Line with Aqueduct FCAB | La Negra | Interferences with railroads | Ministry of Economy |
SRK Consulting (U.S.), Inc.
| | | | | |
SEC Technical Report Summary – Salar de Atacama | Page 232 |
Source: Prepared by SRK based in the permit spreadsheet delivered to SRK by Albemarle (2020)
17.1.3Water Rights
Albemarle has water rights granted by the DGA for those wells from which freshwater is extracted and used as industrial water for the process. The water rights correspond to the wells located in Tilopozo (8.5 L/s), Tucucaro (10 L/s), and Peine (5 L/s), with a total right to extract 23.5 L/s. The Tilopozo and Tucucaro wells are the only wells currently used, for a total of 16.9 L/s.
In La Negra, there is a well that has water rights granted by the DGA for the extraction of 6 L/s.
It should be noted that, for brine extraction wells, no groundwater rights are required, as this corresponds to the extraction of a mineral resource.
17.4Plans, Negotiations, or Agreements
Albemarle maintains a Social Management Plan which is part of the guidelines, strategies and corporate actions for community relations. Within the framework of these guidelines, Albemarle currently has formal agreements, since 2016, with the Council of Atacameño Peoples and with the 18 Indigenous Communities (Atacameñas) that make up the ADI; with the Atacameña Community of Peine, since 2012; with the municipality of San Pedro de Atacama, the Culture and Tourism Foundation of San Pedro de Atacama and the Sports Corporation of the same commune, since 2017.
These agreements, which represent the main stakeholders of the project's area of influence in the Salar de Atacama area, are predicated on constant dialogue through permanent Working Groups (on a monthly basis), in which all the challenges, projects, and/or scopes of the same agreements are presented. These Working Groups are where Albemarle presents proposed projects and socially manages them with all the stakeholders. The Working Groups function, among others, is to be a channel for grievance and/or complaints, in which any participant and/or community member can present their claims. Additionally, there is a web channel and helpline where the community can make complaints (www.IntegrityHelpline.Albemarle.con).tOf particular note is the agreement signed with the 18 indigenous communities that make up the Council of Atacama Peoples which is an agreement of Cooperation, Sustainability and Mutual Benefit. Through this partnership agreement, Albemarle undertakes to deliver 3.5% of the sales of lithium carbonate and potassium chloride produced at the Salar Plant and to establish joint work for monitoring and surveillance of the Salar de Atacama's environmental resources. The agreement also includes the accompaniment and advice of the Inter-American Development Bank with a view to jointly generate a formula for economic governance of the resources, so that this agreement translates into the institutional strengthening of the indigenous organizations involved.
17.5Mine Reclamation and Closure
17.5.1Closure Planning
As mentioned in Section 17.3.2, Albemarle has a closure plan approved by SERNAGEOMIN (National Service of Geology and Mining) in 2019 (Res. Ex. N°287/2019). This closure plan includes all environmental projects approved until 2016, including EIA “Modification and improvement solar evaporation ponds system” (RCA N°021/2016).
SRK Consulting (U.S.), Inc.
| | | | | |
SEC Technical Report Summary – Salar de Atacama | Page 233 |
As part of the closure plan, the life of mine must be defined based on proven and probable reserves. In the approved closure plan, an ending date of operation has been defined as 2043. However, this date is only defined for financial assurance purposes, and it does not define the date of definitive closure.
The approved closure plan, developed based on the environmental projects approved until 2016, include all the following facilities:
•La Negra Plant
◦Lithium chloride plant
◦Leaching (SX) or Boron plant
◦Lithium carbonate plant
◦Evaporation ponds – sedimentation
◦Auxiliary facilities
◦Sodium ash warehouse
◦General
•Salar de Atacama Plant
◦Extraction wells
◦Evaporation ponds – concentration
◦Carnallite leaching plant
◦Potash plant
◦Drying plant
◦Leaching plant 1
◦Leaching plant 2
◦Service area
◦General/Waste salts stock.
To define the closure measures described in the closure plan, a closure risk assessment was developed to ensure physical and chemical stability of the remaining facilities after closure. For all infrastructure, standard activities have been considered. Closure measures included in the closure plan are:
•Pond backfilling, and profiling. Pond’s liner removed from slopes and covered in pond’s bottom
•Dismantling of all infrastructure
•Demolish of all concrete structures
•Equipment disassembly
•Piping and fitting disassembly (includes piping flushing)
•Dismantling of electric poles and equipment
•Final disposal of all concrete and steel structures
•Ground profiling
Based on these closure measures, a 17-months period has been estimated for the closure execution program in the approved closure plan. This program considers both La Negra and Salar de Atacama activities to begin at the same time (August 2038). The closure execution program considers work fronts for each of the different specialties involved in the dismantling process, as follows: de-energizing activities, equipment dismantling, piping dismantling, steel and concrete dismantling and demolish and at the end, profiling and backfilling as necessary. Based on the facilities complexity
SRK Consulting (U.S.), Inc.
| | | | | |
SEC Technical Report Summary – Salar de Atacama | Page 234 |
and quantities estimated, the critical path of the closure execution program includes both the Carbonate Lithium plant dismantling process and the sedimentation ponds closure activities.
Post-closure activities comprise monitoring of 221 monitoring wells for water quality, evaporation and flux monitoring of groundwater and surficial waters on site. This monitoring program will continue for three years after closure, on a quarterly basis.
There is no internal closure plan of La Negra or Salar de Atacama plants. Therefore, no closure analysis has been developed nor reviewed in terms of social transition, post closure land use, stakeholder engagement or mine closure provisions.
17.5.2Closure Cost Estimate
Albemarle does not maintain a current internal LoM cost estimate to track the closure cost to self-perform a closure for the site. The closure cost reviewed was prepared to comply with financial assurance requirements of Chilean law. The estimate was prepared by SGA based on the approved closure plan and a conceptual estimate of all environmental projects presented in Table 17-6 that were not included in the closure plan.
The total closure costs of La Negra and Salar de Atacama Plants are presented in Table 17-6. Note, these values correspond to financial assurance costs and do not necessarily reflect actual closure costs.
Table 17-6: La Negra and Salar de Atacama Closure Costs1
| | | | | | | | | | | |
| Description | La Negra (US$) | Salar de Atacama (US$) | Total (US$) |
| Direct cost | 12,990,548 | 12,970,789 | 25,961,337 |
| Indirect cost | 4,582,075 | 2,586,305 | 7,168,380 |
| Contingency | 4,262,421 | 3,500,054 | 7,762,475 |
| Total | 21,835,044 | 19,057,149 | 40,892,193 |
Note that La Negra and Salar de Atacama closure plan presents costs including taxes (19% of the total closure cost presented in Table 17-6), as per required by Law 20551.
1Closure costs originally estimated in Unidad de Fomento (UF). Fx rates considered as 1 UF = 28,827.5 CLP; 1 US = 775.56 CLP.
As it is shown in Table 17-6, total financial assurance closure costs include direct and indirect costs, as well as the contingencies associated to the engineering level of the estimate. As it was mentioned before, closure costs come from two different estimates: (1) approved closure plan (which represents 65% of the total closure costs), and (2) environmental projects approved after closure plan was approved (which represents 35% of the total closure costs). Due to this, two different approaches have been considered for the estimate of the closure costs, which are described as follows.
Closure costs estimated in the approved closure plan consider:
•Direct Costs: these costs are considered as all costs related to the execution of the closure measures and works, and they have been estimated as the product of material quantities and unit prices. Unit prices have been estimated including all contractor costs (labor, equipment, and contractor’s indirect costs), meanwhile material quantities were estimated from field measurements, and drawings.
SRK Consulting (U.S.), Inc.
| | | | | |
SEC Technical Report Summary – Salar de Atacama | Page 235 |
•Indirect Costs: these costs have been estimated considering administration, technical inspection, meals, cleaning staff, transport, surveillance and maintenance for a total period of 20 months, which includes execution, mobilization and demobilization of contractors.
•Contingency: contingencies have been estimated based on a range analysis of all variables involved in the cost estimate, ranging from 0% on the most certain items to 52% on the most uncertainty factors.
Closure costs estimated for the environmental projects not included in the approved closure plan consider:
•Direct Costs: the estimate of these costs have been also estimated as the product of material quantities and unit prices. Unit prices have been kept from what has been considered in the approved closure plan, meanwhile material quantities were estimated from drawings or satellite images based on material take-off factors per square meters of constructed areas.
•Indirect Costs: these costs have been estimated as 20% of the direct costs.
•Contingency: contingencies have been estimated as 30% of direct and indirect costs.
17.5.3Performance or Reclamation Bonding
Mine closure regulation in Chile (Law N°20.551) started in 2012, and its beginning marked a milestone in how mining companies in Chile address mine closure. This law specifically requires that all mining companies proposing to begin, continue or restart operations must have an approved closure plan. The mine closure law also requires that closure plans be updated at least every 5 years, and any time a mine (a) obtain environmental approval of a new project that makes significant modification to the mine configuration, (b) obtain environmental approval of a new project that changes the mine closure phase, (c) after restarting its operation, (d) after finishing partial closures, and (e) by request of the SERNAGEOMIN.
Mining companies with extraction rates larger than 10.000 t per month (mining companies with extraction rates lower that 10,000 t per month are required to present a simplified closure plan) must present in their closure plans a detailed description of the mine facilities (in their final configuration), a closure risk assessment and the closure measures proposed, design for those measures, closure costs, and a financial assurance estimate.
Financial assurances are intended to guarantee that the Government complete will have the necessary funds to implement the approved closure plan in the event of a bankruptcy or abandonment. These bonds must be determined as the net present value of the total closure cost of the mine site, based on the closure cost estimate, which assumes all facilities in their final configuration. Additionally, and considering that closure plans may be presented every five years, the Law N°20.551 requires that the financial assurance must be determined for each operating year, beginning from the year of submittal of the closure plan until the last year of operation.
Albemarle has a mine closure plan in compliance with the mine closure law and approved in 2019, with a financial assurance estimate through year 2045 (Figure 17-3).
SRK Consulting (U.S.), Inc.
| | | | | |
SEC Technical Report Summary – Salar de Atacama | Page 236 |
Source: Albemarle
Bonding values approved originally stated in Unidad de Fomento (UF). Fx rates considered as 1 UF = 28,827.5 CLP; 1 US = 775.56 CLP.
Figure 17-3: La Negra and Salar de Atacama Financial Bonding Program Approved
As it is shown in Figure 17-3, mine closure law defines a period where the financial assurance posted is lower than the present value of the total closure cost. This period finishes in 2030 when the financial assurance posted will be equal to the present value of the estimated closure liability.
17.5.4Limitations on the Cost Estimate
The closure cost estimate for the site was prepared by SGA (www.sgasa.cl). Its purpose is to provide the Chilean government an assessment of the closure liabilities at the site and form the basis of financial assurance. This type of estimate typically reflects the cost that the government agency responsible for closing the site if an operator fails to meet their obligation. If Albemarle, rather than the government, closes the site in accordance with their current mine plan and approved closure plan, the cost of closure is likely to be different from the financial assurance cost estimate approved by the government.
There are several costs that are typically included in the financial assurance estimates that would only be incurred by the government, such as government contract administration. Other costs, such as head office costs, a number of human resource costs, taxes, fees, and other operator-specific costs that are not included in the financial assurance cost estimate would likely be incurred by Albemarle during closure of the site. Because Albemarle does not currently have an internal closure cost estimate other than for financial assurances, SRK was not able to prepare a comparison of the two types of closure cost estimates. The actual cost could be greater or less than the financial assurance estimate.
The estimate uses fixed unit rates for different activities and there is no documentation on the basis of those unit rates. Because of this, SRK cannot validate any of the unit rates used in the model or the overall cost estimate.
SRK Consulting (U.S.), Inc.
| | | | | |
SEC Technical Report Summary – Salar de Atacama | Page 237 |
Furthermore, because closure of the site is not expected until 2043, the closure cost estimate represents future costs based on current expectations of site conditions at that date. In all probability, site conditions at closure will be different than currently expected and, therefore, the current estimate of closure costs is unlikely to reflect the actual closure cost that will be incurred in the future.
17.6Plan Adequacy
In SRK’s opinion, the operations of Albemarle have adequate plans to address and follow-up the most sensitive and relevant environmental issues, such as hydrogeological/biodiversity issues, and those associated with the indigenous communities in the Salar de Atacama area.
In SRK’s opinion, Albemarle adequately follows up on issues related to water quality in the Negra and fluctuations in the water table and potential effects on the sensitive ecosystems around the Salar de Atacama, including analysis of possible cumulative effects given the multiplicity of actors that extract brine and freshwater in the area. The aim of the Early Warning Plan is to promptly detect any deviation from what was indicated in the initial environmental assessment, preventing unforeseen impacts from occurring. Notwithstanding the above, the Salar de Atacama is a complex system and requires constant updating of management tools based on the results of the monitoring programs, and also be attentive to requirements or new tools that the authority may incorporate.
Albemarle maintains relations with all the communities and indigenous groups in the area that, in the QP’s opinion, are very good. Any future development or modification of the current conditions of the operation will be subject to an Indigenous Consultation Process; therefore, it is of high importance to maintain this adequate management strategy with these communities.
Management of regulatory and environmental obligations has been recently improved, incorporating a GISMA monitoring platform, which is scheduled to be completed by the end of 2020.
There is an operational issue that could generate regulatory risk, related with infrastructure requirements to adequately manage the liquid solutions that are generated in La Negra's process, which is not possible to manage with the current facilities. Any spill or overflow from the ponds can lead to an environmental non-compliance that can be sanctioned by the Superintendence of the Environment. This issue is being addressed as a priority action by the company to seek a definitive solution in the long term, and also one that allows them to solve the issue in the short term.
17.7Local Procurement
Regarding the hiring of local labor, Albemarle does not have formal commitments with any local authority; however, currently, 84% of Albemarle workers are from the Antofagasta region and 39% of the workers of the Salar de Atacama area are from nearby communities. Although there is no formal agreement, in the case of the Salar de Atacama, every new job opening is promoted in the area and within the communities. This issue will be incorporated into the community relations policy currently being developed by Albemarle.
SRK Consulting (U.S.), Inc.
| | | | | |
SEC Technical Report Summary – Salar de Atacama | Page 238 |
18Capital and Operating Costs
The Salar de Atacama and La Negra are currently in operation, producing technical and battery grade lithium carbonate as well as byproducts. Capital and operating costs are forecast as a normal course of operational planning with a primary focus on short term budgets (i.e., subsequent year). Mid (e.g., five year plan) and long-term (i.e., life of mine) planning are not as detailed although operations do evaluate conceptual long-term performance. As there is not an official mid-term or life of mine budget to rely upon to support estimation of reserves, SRK developed its own long-term operating forecast. SRK developed this forecast based on some of the forecast data utilized at the operation with adjustments made by SRK based on historic operating results. These forecasts account for changes in production rates associated with expansion plans that are largely complete and SRK utilized these adjustments, including modification, as appropriate.
Estimation of capital and operating costs is inherently a forward-looking exercise. These estimates rely upon a range of assumptions and forecasts that are subject to change depending upon macroeconomic conditions, operating strategy and new data collected through future operations. For this report, capital and operating costs are estimated to a PFS-level, as defined by S-K 1300, with a targeted accuracy of +/-25%. However, this accuracy level is only applicable to the base case operating scenario and forward-looking assumptions outlined in this report. Therefore, changes in these forward-looking assumptions can result in capital and operating costs that deviate more than 25% from the costs forecast herein.
18.1Capital Cost Estimates
Capital cost forecasts are estimated based on (i) a baseline level of sustaining capital expenditures, in-line with historic expenditure levels, adjusted for changing production rates, and (ii) strategic planning for major capital expenditures. Table 18-1 presents historical capital expenditures for reference (2015-2020) and estimated capital for 2021. Note that this is within 5% of the modeled capital amount for 2021.
SRK Consulting (U.S.), Inc.
| | | | | |
SEC Technical Report Summary – Salar de Atacama | Page 239 |
Table 18-1: Capital Expenditure (Nominal US$M for 2015-2019, Real 2020 US$M for 2020/2021)
| | | | | | | | | | | | | | | | | | | | | | | |
| Trailing Five Year Capital by Expenditure Type, Actual | Capital Forecast by Expenditure Type, Estimate |
| Salar de Atacama/La Negra | 2015 | 2016 | 2017 | 2018 | 2019 | 2020 | 2021AOP |
| Salar (Major Projects) |
| Post Permit Salar Expansion | 6.0 | 14.6 | 31.8 | | | | |
| Salar Ponds and Wells | | 2.2 | 1.3 | 22.4 | 16.5 | 2.2 | |
| Salar Yield Improvement + New Camp Atacama | | | .4 | 10.9 | 24.1 | 2.6 | 40.4 |
| Salar Drilling | | 1.8 | 10.2 | 9.3 | 9.9 | 4.9 | 4.4 |
| La Negra (Major Projects) |
| La Negra 3 | .0 | 7.1 | 110.3 | 250.5 | 225.0 | 119.0 | 90.0 |
| Lithium Carbonate Expansion Phase 1-A | 34.9 | 2.6 | 1.1 | | | | |
| Lan 2 Centrifuges & Other Debottlenecking | | | 1.9 | 21.3 | | | |
| Lan Infrastructure | | | | 5.1 | 3.5 | | |
| Lan Milling | | | | 8.0 | | | |
| La Negra 1 | | | | 3.6 | 2.7 | | |
| Lan 2 Get Rights | | | | 2.6 | | | |
| Lithium Carbonate Expansion Phase 1-A | 34.9 | 2.6 | 1.1 | | | | |
| Major Project Subtotal | 75.8 | 30.9 | 158.2 | 333.6 | 281.6 | 128.7 | 13.4.8 |
| Salar Sustaining Expenditure |
| General | 4.9 | 1.5 | 9.1 | 5.4 | 4.4 | 3.0 | 10.2 |
| La Negra Sustaining Expenditure |
| General | 18.9 | 10.6 | 13.8 | 7.6 | 12.0 | 13.5 | 23.3 |
| Site Capital Subtotal | 23.8 | 12.1 | 22.9 | 12.9 | 16.3 | 16.5 | 33.5 |
| Total Capital Expenditure | 99.6 | 43.0 | 181.1 | 346.6 | 297.9 | 145.2 | 168.3 |
Source: Albemarle Cost Reporting
In reviewing these costs, there has been significant capital invested in expansion of operations at both the Salar and La Negra over the past five years. Associated with expanded production rates, general sustaining capital expenditure has also increased. Looking forward, there remains material spend forecast in 2021, largely associated with completion of the La Negra 3 project. With the completion of La Negra 3 in 2021, there remains one material future capital project, the SYIP. This project has been underway for several years (as seen in Table 18-1), although the most significant investment is not anticipated until 2022.
The La Negra 3 project is part of a multi-year effort to significantly expand production from the combined Salar de Atacama and La Negra. This expansion targets taking La Negra’s annual production capacity from approximately 45,000 t LCE to approximately 84,000 t LCE. Material expenditure on this project initiated around 2016 with a total forecast capital budget of US$773 million (inclusive of $14.5 million contingency). Commissioning of La Negra 3 is expected to occur in the second half of 2021 with approximately $90.7 million budgeted for expenditure in 2021 and 2022. As the project is nearing completion of construction activities, engineering and procurement are nearly at 100%. Because of this, there is a high level of confidence in the remaining budget. Beyond 2022, Albemarle has not forecast any additional expenditure on La Negra 3 as the project will be commissioned. However, as this is a large, complex chemical production facility, it is likely that ramp-
SRK Consulting (U.S.), Inc.
| | | | | |
SEC Technical Report Summary – Salar de Atacama | Page 240 |
up will take a significant period (at least into 2022 if not 2023). Therefore, although the future need for additional capital is currently not known, SRK has included an allocation in both 2022 and 2023 to account for the potential that additional expenditure is required during ramp-up. SRK’s capital allocations associated with La Negra 3 are US$15 million and US$ 5 million in 2022 and 2023, respectively.
The SYIP is an ongoing project that is at an earlier stage than La Negra 3. The project is targeting improving recovery rates of lithium from the evaporation ponds from the Salar de Atacama and is discussed in more detail in Section 14.1.2. As of December 31, 2020, approximately US$37.5 million has been spent on this project out of the total capital estimate of $148.6 million (includes $16.5 million contingency and is dated February 2019). This capital estimate was classified as a Class 2 estimate (uncertainty estimated as approximately +/-10% and an 80% confidence interval). However, this project has been delayed from the early 2019 planning which forecast completion in late 2020. Current planning assumes a three-year delay with project ramp up in 2024. Although the current estimate is advanced as a Class 2, resulting in a relatively low level of uncertainty, the delay adds risk to the capital estimate. Nonetheless, in SRK’s opinion, even with the delay, the project meets the PFS target of this report and has therefore not modified the capital estimate beyond the projected additional spend. While this spend is higher than the initial estimate, the volatile economic environment has yielded cost changes and SRK has accepted the most recent forecast cost for modelling purposes. Based on the currently projected timing and remaining capital estimate, the remaining spend on this project is US$38.4 million, US$136.6 million in 2021 and 2022, respectively.
On a longer-term basis, as discussed in Section 14.1.1, due to a projected change in the calcium to sulfate ratio in the raw brine feed, SRK assumes that a liming system will need to be added in the future to manage this ratio and maintain current lithium recovery rates in the evaporation ponds. SRK’s life of mine pumping plan requires this plant to be operational by year end 2026. Therefore, SRK has assumed construction of this plant in 2025. As the need for this plant is still uncertain (i.e., further optimization of the pumping plan may better balance calcium and sulfate) and the timing is still several years away, there is no study supporting development of this plant. Therefore, SRK developed a scoping level costs based on benchmarking against recent estimated development cost for a similar plant in the region. SRK’s cost estimate is US$22 million for this liming plant, including a 35% contingency.
Outside of the projects discussed above, for the purpose of forecasting capital to support the reserve estimate, SRK did not include additional expenditure for operational improvement as no improvement is assumed in operating performance relative to historic. Therefore, SRK’s remaining sustaining capital forecast includes a direct estimate of replacement/rehabilitation of production wells and a single line item to capture all other miscellaneous sustaining capital.
For the estimate of replacement/rehabilitation of production wells, SRK assumes a typical cost of US$350,000 per well. At steady state, this results in approximately US$3.5 million per year in production well replacement costs.
For a typical annual sustaining capital meant as a catch-all for all other items, SRK assumes that with expanding production and operations, over time, the salar and La Negra will require higher expenditure than historic. Based on discussions with Albemarle personnel, SRK has assumed a total of approximately US$24 million per year in sustaining capex at the salar, inclusive of well replacement. Deducting the well replacement costs, this results in a non-well replacement average
SRK Consulting (U.S.), Inc.
| | | | | |
SEC Technical Report Summary – Salar de Atacama | Page 241 |
capex of around US$20 million per year at the salar. At La Negra, SRK has assumed an additional US$30 million per year, based on similarly scaling up historic norms.
Table 18-2 presents capital estimates for the next 10 years and the life of the reserve. Total capital costs over this period (July 2020 to December 2043) are estimated at $1.4 billion in 2020 real dollars.
Table 18-2: Capital Cost Forecast ($M Real 2020)
| | | | | | | | | | | |
| Period | Total Sustaining Capex | Total Expansion Projects | Capital Expenditure (US$M Real 2020) |
| 2021 | 43.0 | 116.4 | 159.4 |
| 2022 | 52.6 | 51.0 | 103.6 |
| 2023 | 48.2 | 141.6 | 189.8 |
| 2024 | 51.0 | - | 51.0 |
| 2025 | 74.4 | - | 74.4 |
| 2026 | 53.8 | - | 53.8 |
| 2027 | 53.8 | - | 53.8 |
| 2028 | 53.8 | - | 53.8 |
| 2029 | 53.8 | - | 53.8 |
| Remaining LOM (2031 – 2043) | 685.6 | -- | 726.5 |
Note: 2021 capex is September – December only, assumed at 33% of total 2020 spend
Source: SRK, 2021
18.2Operating Cost Estimates
Five years’ trailing cash operating costs are presented in Table 18-3. Operating costs are site specific (e.g., they do not include corporate overheads although there are overheads for Albemarle Chile). Note that for internal reporting purposes, Albemarle allocates brine production costs to the year the brine is processed (i.e., an approximate 24 month delay from the actual cost being incurred). The costs shown in Table 18-3 reflect the costs at the time incurred so reflect different results than Albemarle’s accounting.
SRK Consulting (U.S.), Inc.
| | | | | |
SEC Technical Report Summary – Salar de Atacama | Page 242 |
Table 18-3: Historic Operating Costs ($M, Nominal)
| | | | | | | | | | | | | | | | | |
| 2016 Act | 2017 Act | 2018 Act | 2019 Act | 2020 Act |
| Utilities | 9.14 | 11.37 | 15.14 | 9.23 | 10.20 |
| Salaries and Benefits | 21.16 | 25.82 | 35.43 | 45.07 | 40.75 |
| Soda Ash | 14.78 | 18.40 | 22.29 | 25.21 | 26.57 |
| Lime | 0.90 | 1.19 | 1.39 | 1.49 | 1.78 |
| HCl | 2.21 | 3.46 | 4.78 | 2.71 | 1.43 |
| Packaging | 1.45 | 1.37 | 1.75 | 1.76 | 1.94 |
| Other Raw Materials | 0.58 | 1.03 | 1.22 | 0.98 | 1.15 |
| Concentrated Brine Transport | 2.68 | 3.32 | 3.72 | 4.69 | 5.71 |
| Outside Services | 5.21 | 10.70 | 14.86 | 36.38 | 28.57 |
| Other | 34.00 | 47.53 | 59.80 | 46.58 | 38.16 |
| Total | 92.14 | 124.18 | 160.39 | 174.10 | 156.27 |
| Annual Production (metric tonnes lithium carbonate equivalent) | 26,135 | 28,810 | 32,942 | 39,956 | 40,121 |
| Unit Cash Cost ($/metric tonne lithium carbonate) | 3,198 | 3,770 | 4,014 | 4,339 | 3,552 |
Notes:
•Costs included are cash costs only (e.g., depreciation and depletion not included)
•“Outside Services” generally reflects salt harvesting
•“Other” costs generally include SGA, insurance, community payments, maintenance and waste disposal
•2020 production is estimated as of year-end 2020, not actual
•Community royalty payment included state royalty excluded
•Costs directly associated with production of potash and other byproducts excluded as byproduct reserves are not reported and the production of byproducts is not included in the reserve assumptions (i.e., no revenue included)
Source: Albemarle Cost Reporting
As noted above, Albemarle does not have an official long term cost forecast for the operation (2021 is the latest official forecast available, although unofficial internal life of mine outlooks have been developed). Therefore, SRK developed a cost model to reflect future production costs. To develop this cost forecast, SRK worked with site personnel, including reviewing unofficial forecasts, and developed a simplified operating cost model based on fixed and variable costs, adjusted for changes in operations, as appropriate.
In evaluating the historic costs and discussing the cost profile with Albemarle, the majority of the Salar de Atacama/La Negra costs are fixed. However, there are material changes planned for the operation that are expected to change even the fixed cost basis for the operation. These changes include the following:
•Addition of R&D payment contemplated in 2016 agreement
•La Negra III increased production
•Electrical grid connection for the salar
•SYIP at the salar
•Likely long-term requirement to add a liming plant at the salar
For each of these structural changes to the operation, SRK assumed changes to the fixed cost basis. Beyond these fixed cost modifications, SRK also applied variable unit costs to a range of cost inputs. These include the following:
•Raw Materials, Including:
◦Soda Ash (modeled individually)
◦Lime (modeled individually)
◦HCl (modeled individually)
SRK Consulting (U.S.), Inc.
| | | | | |
SEC Technical Report Summary – Salar de Atacama | Page 243 |
◦Packaging (modeled individually)
◦Other (factored against historic costs)
•Concentrated Brine Transport
•Electricity (partially variable)
•Other Utilities (e.g., natural gas / water)
•Salt Removal (partially variable)
•Waste Disposal
•Maintenance / Repair (partially variable)
For key raw materials, including soda ash, lime, HCl and packaging, as well as for brine transportation, SRK individually calculated unit consumption. The remaining variable costs are calculated based on factoring historic actual costs/production rates. Forecast unit rates were provided by Albemarle for soda ash, lime, HCL and brine transport (SRK based the packaging forecast on historic costs, which have been relatively consistent). Unit consumption and costs for these items are presented in Table 18-4.
Table 18-4: Key Assumptions, Variable Cost Model
| | | | | | | | |
| Item | Consumption Rate | Unit Cost |
| Soda Ash | 2.27 tonne/tonne LCE sold | US$274/tonne |
| Lime | 0.21 tonne/tonne LCE sold | US$174/tonne |
| HCl | 0.11 tonne/tonne LCE sold | US$270/tonne |
| Packaging | Direct application to final product | US$44/tonne LCE sold |
| Raw Brine Transport | Assumes 6% Li concentration in transported brine | US$27.65/tonne |
Note: Lime consumption reported above applicable to La Negra operations, in the long-term, with the assumed requirement to add liming at the salar, the assumed consumption rate increases.
Source: SRK 2021
As seen in Table 18-3, soda ash is the most important component of these key variable costs. Albemarle provided the long term price assumption for soda ash, but SRK has also tested the sensitivity of the project economics to soda ash consumption, as described in Section 19.2.
For calibration purposes, SRK compared historic costs to the cost model outputs. These results are presented in Table 18-5. As seen in this table, in comparison to the 2018 to 2020 costs, the model returns a reasonable prediction. Going back to 2016 and 2017, the model significantly overpredicts the actual costs. There are several factors in play, with the most significant being the scale of production as La Negra II was ramping up in this period with annual production rates increasing from around 30,000 t LCE in this early period to more than 40,000 t LCE. Further, final product mix has also changed over time with a historic mix of lithium chloride, technical grade lithium carbonate and battery grade lithium carbonate, transitioning to predominantly battery grade lithium carbonate, limited technical grade lithium carbonate and no lithium chloride. In short, the 2016 and 2017 operating results cannot be directly compared to the current (and forecast cost structure). When looking at the 2018-2020 costs, the operating cost model under-predicts the total operating cost by approximately 4%, on average with 2018/2019 costs underpredicted and 2020 costs overpredicted. Looking forward, in SRK’s opinion, this balance is reasonable given the 2018/2019 costs were likely slightly inflated due to higher lithium prices and significant development activities associated with ongoing expansion whereas 2020 and to date 2021 costs are likely slightly distorted, reflecting a depressed market and measures associated with COVID-19. While the cost modelling exercise requires the use of accurate historical costs for development of the model, SRK has updated, where
SRK Consulting (U.S.), Inc.
| | | | | |
SEC Technical Report Summary – Salar de Atacama | Page 244 |
possible with mid to late year 2021 forecast numbers for 2021. As a final note, given there are several structural changes forecast to the operation, as noted above, SRK has adjusted the fixed cost basis in future operating periods to account for these changes that are not reflected in this calibration exercise.
Table 18-5: Operating Cost Model Calibration Results ($M)
| | | | | | | | | | | | | | | | | |
| 2016 | 2017 | 2018 | 2019 | 2020 |
| Utilities | 6.82 | 7.80 | 9.46 | 9.50 | 10.42 |
| Salaries and Benefits | 37.99 | 37.99 | 37.99 | 37.99 | 37.99 |
| Soda Ash | 17.92 | 20.49 | 24.85 | 24.95 | 27.79 |
| Lime | 1.05 | 1.20 | 1.46 | 1.47 | 1.66 |
| HCl | 0.86 | 0.98 | 1.19 | 1.19 | 2.74 |
| Packaging | 1.27 | 1.45 | 1.76 | 1.77 | 2.62 |
| Other Raw Materials | 0.69 | 0.79 | 0.96 | 0.96 | 1.05 |
| Raw Brine Transport | 3.12 | 3.56 | 4.32 | 4.34 | 4.76 |
| Outside Services | 23.14 | 24.79 | 25.84 | 27.56 | 27.63 |
| Other | 43.29 | 44.44 | 45.24 | 46.36 | 45.71 |
| Total Modeled | 136.14 | 143.49 | 153.06 | 156.09 | 162.36 |
| Total Actual | 92.14 | 124.18 | 160.39 | 174.10 | 156.27 |
| Model Differential | 48% | 16% | -5% | -10% | 4% |
Source: SRK
Note modeled costs are real 2020-2021 dollars, actual costs are nominal.
Based on this operating cost model, total annual forecast operating costs for the Salar de Atacama/La Negra operations are shown in Figure 18-1.
Note 2021 costs reflect a partial year (September – December)
Source: SRK
Figure 18-1: Total Forecast Operating Expenditure (Real 2021 Basis)
SRK Consulting (U.S.), Inc.
| | | | | |
SEC Technical Report Summary – Salar de Atacama | Page 245 |
19Economic Analysis
As with the capital and operating cost forecasts, the economic analysis is inherently a forward-looking exercise. These estimates rely upon a range of assumptions and forecasts that are subject to change depending upon macroeconomic conditions, operating strategy and new data collected through future operations.
SRK has not included the production of byproduct streams into this analysis. However, the operation does produce byproducts that have historically generated approximately US$20 million per year in revenue, net of costs specific to production of those byproducts. As the byproducts are not included in the resource and reserve models, they are not included in the cashflow model.
19.1General Description
SRK prepared a cash flow model to evaluate Salar de Atacama' reserves on a real, 2021-dollar basis. This model was prepared on an annual basis from the reserve effective date to the exhaustion of the reserves. This section presents the main assumptions used in the cash flow model and the resulting indicative economics. The model results are presented in US$, unless otherwise stated.
All results are presented in this section on a 100% basis, reflective of Albemarle’s ownership.
19.1.1Basic Model Parameters
Key criteria used in the analysis are presented throughout this section. Basic model parameters are summarized in Table 19-1.
Table 19-1: Basic Model Parameters
| | | | | |
| Description | Value |
| TEM Time Zero Start Date | Sept 1, 2020 |
| Pumping Life (first year is a partial year) | 22 |
| Operational Life (first year is a partial year) | 24 |
| Model Life (first year is a partial year) | 25 |
| Discount Rate | 8% |
All cost incurred prior to the model start date are considered sunk costs. The potential impact of these costs on the economics of the operation are not evaluated. This includes contributions to depreciation and working capital as these items are assumed to have a zero balance at model start.
The operational life extends two years beyond the pumping life to allow for recovery of the lithium pumped to the ponds from the wellfield.
Closure costs are incorporated at the end of the operational life.
The selected discount rate is 8% as provided by Albemarle.
19.1.2External Factors
Pricing
Modeled prices are based on the prices developed in the Market Study section of this report. The prices are modeled as US$10,000/t technical grade Li2CO3 over the life of the operation. This price is a CIF Asia price and shipping costs are applied separately within the model.
SRK Consulting (U.S.), Inc.
| | | | | |
SEC Technical Report Summary – Salar de Atacama | Page 246 |
Taxes and Royalties
As modeled, the operation is subject to a 27% federal income tax rate. All expended capital is subject to depreciation over an eight-year period. Depreciation occurs via straight line method.
As the operation is located in Chile, it is also subject to a Chile Specific Mining Tax at a rate of 5%of gross revenue with deductions for operating costs and depreciations.
The operation is subject to a Corfo royalty on Lithium. The royalty is a progressive royalty based on lithium price. The royalty schedule modeled is outlined in Table 19-2. Other royalties such as community payments are included in the operating cost model assumptions.
Table 19-2: Corfo Royalty Scale
| | | | | |
| LCE Price (USD/t) | Royalty Rate |
| 0-4,000 | 6.80% |
| 4,000-5,000 | 8.00% |
| 5,000-6,000 | 10.00% |
| 6,000-7,000 | 17.00% |
| 7,000-10,000 | 25.00% |
| Over 10,000 | 40.00% |
Source: SRK
Working Capital
The assumptions used for working capital in this analysis are as follows:
•Accounts Receivable (A/R): 30-day delay
•Accounts Payable (A/P): 30-day delay
•Zero opening balance for A/R and A/P
19.1.3Technical Factors
Pumping/Extraction Profile
The modeled pumping profile was developed by SRK. The details of this profile are presented previously in this report. No modifications were made to the profile for use in the economic model. The modeled profile is presented in Figure 19-1. Note that 2021 is a partial year.
Source: SRK, 2021
Figure 19-1: Salar de Atacama Pumping Profile (Tabular Data shown in Table 19-9)
SRK Consulting (U.S.), Inc.
| | | | | |
SEC Technical Report Summary – Salar de Atacama | Page 247 |
A summary of the modeled life of operation pumping profile is presented in Table 19-3.
Table 19-3: Modeled Life of Operation Pumping Profile
| | | | | | | | |
| Extraction Summary | Units | Value |
| Total Brine Pumped | tonnes | 287,809,828 |
Total Contained Lithium | tonnes | 590,993 |
| Average Lithium Grade | mg/l | 2,053.41 |
| Annual Average Brine Production | m3 | 13,082,265 |
| Annual Average Brine Production | Acre Feet | 10,606 |
Source: SRK, 2021
Processing Profile
The processing profile is identical to the pumping profile. The material pumped is immediately fed to the processing circuit consisting of evaporation ponds and processing plant.
The production profile is the result of the application of processing logic to the processing profile within the economic model. The recovery curve is hardcoded for the beginning of the modeled operation to reflect actual performance. The recovery curve ramps from 39% to 45% over several years. After 2023, the salar yield is governed by a recovery curve. The following recovery curve was applied to raw brine pumping profile to account for losses in the evaporation ponds:
Lithium Pond Recovery = - 19.1880 * (Li%)2 + 7.4721*Li %-0.0746
After the assumed start of operations of the liming plant in 2027, SRK has assumed a fixed 65% recovery factor in the evaporation ponds. An additional 80% fixed lithium recovery is applied to account for losses in the lithium carbonate plant.
Final lithium production in the model is delayed by two years from the date of pumping to allow for the brine to concentrate in the evaporation ponds. As a result, the production in the years immediately following the start of the model is based on historical pumping. The modeled processing and production profiles are presented in Figure 19-2 and Figure 19-3 below.
Source: SRK
Figure 19-2: Modeled Processing Profile (Tabular Data shown in Table 19-9)
SRK Consulting (U.S.), Inc.
| | | | | |
SEC Technical Report Summary – Salar de Atacama | Page 248 |
Source: SRK
Figure 19-3: Modeled Production Profile (Tabular Data shown in Table 19-9)
A Summary of the modeled life of operation profile is presented in Table 19-4
Table 19-4: Life of Operation Processing Summary
| | | | | | | | |
| LoM Processing | Units | Value |
| Lithium Processed | tonnes | 590,993 |
| Combined Lithium Recovery | % | 53.13% |
Li2CO3 Produced | tonnes | 1,672,059 |
Annual Average Li2CO3 Produced | tonnes | 69,669 |
Source: SRK
Operating Costs
Operating costs are modeled in US$ and are categorized as utilities, processing and shipping costs. No contingency amounts have been added to the operating costs within the model. A summary of the operating costs over the life of the operation is presented in Table 19-5 and Figure 19-4.
Table 19-5: Operating Cost Summary
| | | | | | | | |
| LoM Operating Costs | Units | Value |
| Salar Costs | US$ | 1,200,245,103 |
| Processing Costs | US$ | 3,222,391,065 |
| Shipping & G&A Costs | US$ | 1,111,471,819 |
| Total Operating Costs | US$ | $5,534,107,988 |
| Royalty Costs | US$ | 2,294,064,911 |
| Salar Costs | US$/t Li2CO3 | 718 |
| Processing Costs | US$/t Li2CO3 | 1,927 |
| Shipping & G&A Costs | US$/t Li2CO3 | 665 |
| LOM C1 Cost | US$/t Li2CO3 | 3,310 |
| Royalty Costs | US$/t Li2CO3 | 1,372 |
Source: SRK
SRK Consulting (U.S.), Inc.
| | | | | |
SEC Technical Report Summary – Salar de Atacama | Page 249 |
Source: SRK
Figure 19-4: Life of Operation Operating Cost Summary (Tabular Data shown in Table 19-9)
The contributions of the different operating cost segments over the life of the operation are presented in Figure 19-5.
Source: SRK
Figure 19-5: Life of Operation Operating Cost Contributions
Salar Cost
The salar cost consists of the operating costs incurred at the salar operation. It is built up from detailed costs described previously in this document and modeled as a fixed cost within the model. However, SRK notes that the fixed cost component is scaled by pumping volumes but is not directly a variable cost.
SRK Consulting (U.S.), Inc.
| | | | | |
SEC Technical Report Summary – Salar de Atacama | Page 250 |
Processing
Processing costs are operating costs incurred at the La Negra processing facility. These costs are modeled as fixed and variable costs within the model as discussed previously in this document. However, SRK notes that the fixed cost component is scaled by production volumes but is not directly a variable cost.
Key variable cost components were broken out separately as outlined in Table 19-6.
Table 19-6: Variable Processing Costs
| | | | | | | | |
| Processing Costs | Units | Value |
| Soda Ash Consumption | t/t Li2CO3 | 2.27 |
| Soda Ash Pricing | US$/tonne | 274.00 |
| Lime Consumption | t/t Li2CO3 | 0.21 |
| Lime Pricing | US$/tonne | 174.00 |
| HCl Consumption | t/t Li2CO3 | 0.11 |
| HCl Pricing | US$/tonne | 270.00 |
| Salar Lime Cost | US$/tonne | 201.65 |
Source: SRK
Shipping and G&A
Shipping costs are variable and are captured at US$81.37/t of LCE produced.
G&A costs are developed from detailed costs and average roughly US$34.3M/year when the operation is at full run rate.
R&D payments to the government of Chile are included as fixed costs on schedule outlined in Table 19-7.
Table 19-7: R&D Costs
| | | | | |
| Year | US$ |
| 2021 (partial) | 2,374,242 |
| 2022 | 11,603,135 |
| 2023 | 11,635,454 |
| 2024 | 11,668,257 |
| 2025 | 11,701,552 |
| 2026 | 11,735,347 |
| 2027 | 11,769,649 |
| 2028 | 11,804,465 |
| 2029 | 11,839,804 |
| 2030 | 11,875,672 |
| 2031 | 11,912,079 |
| 2032 | 11,949,031 |
| 2033 | 11,986,538 |
| 2034 | 12,024,068 |
| 2035 | 12,063,245 |
| 2036 | 12,102,469 |
| 2037 | 12,142,277 |
| 2038 | 12,182,683 |
| 2039 | 12,223,695 |
| 2040 | 12,265,322 |
| 2041 | 12,307,573 |
| 2042 | 12,350,458 |
| 2043 | 12,393,986 |
Source: Albemarle
SRK Consulting (U.S.), Inc.
| | | | | |
SEC Technical Report Summary – Salar de Atacama | Page 251 |
Capital Costs
As Salar de Atacama is an existing operation, no initial capital has been modeled. Sustaining capital is modeled on an annual basis and is used in the model as outlined in Section 18.1. Major projects associated with expansion or operational improvement include contingency, as noted in Section 18.1, other sustaining costs do not include contingency. Closure costs are modeled as sustaining capital and are captured as a onetime payment the year following cessation of operations. The modeled sustaining capital profile is presented in Figure 19-6.
Source: SRK
Figure 19-6: Sustaining Capital Profile (Tabular Data shown in Table 19-9)
19.1.4Results
The economic analysis metrics are prepared on annual after-tax basis in US$. The results of the analysis are presented in the table below. As modeled, at a Lithium Carbonate price of US$10,000/t, the NPV8% of the forecast after-tax free cash flow is US$2,478 million. Note that because Salar de Atacama is in operation and is modeled on a go-forward basis from the date of the reserve, historic capital expenditures are treated as sunk costs (i.e., not modeled) and therefore, IRR and payback period analysis are not relevant metrics.
Table 19-8: Indicative Economic Results
| | | | | | | | |
| LoM Cash Flow (Unfinanced) | Units | Value |
| Total Revenue | US$ | 16,720,589,734 |
| Total Opex | US$ | (5,534,107,988) |
| Royalties | US$ | (2,294,064,911) |
| Operating Margin | US$ | 8,892,416,835 |
| Operating Margin Ratio | % | 53% |
| Taxes Paid | US$ | (2,394,685,717) |
| Free Cashflow | US$ | 4,977,836,374 |
| Before Tax |
| Free Cash Flow | US$ | 7,372,522,091 |
| NPV @ 8% | US$ | 3,027,458,930 |
| NPV @ 10% | US$ | 2,518,956,354 |
| NPV @ 15% | US$ | 1,679,104,360 |
| After Tax |
| Free Cash Flow | US$ | 4,977,836,374 |
| NPV @ 8% | US$ | 1,972,048,082 |
| NPV @ 10% | US$ | 1,622,066,434 |
| NPV @ 15% | US$ | 1,045,940,855 |
Source: SRK
SRK Consulting (U.S.), Inc.
| | | | | |
SEC Technical Report Summary – Salar de Atacama | Page 252 |
The economic results and back-up chart information within this section are presented on an annual basis in Table 19-9 Figure 19-7.
SRK Consulting (U.S.), Inc.
| | | | | |
SEC Technical Report Summary – Salar de Atacama | Page 253 |
Table 19‑9: Annual Cashflow
SRK Consulting (U.S.), Inc.
| | | | | |
SEC Technical Report Summary – Salar de Atacama | Page 254 |
Source: SRK
Figure 19-7: Annual Cashflow Summary (Tabular Data shown in Table 19-9)
19.2Sensitivity Analysis
SRK performed a sensitivity analysis to evaluate the relative sensitivity of the operation’s NPV to a number of key parameters (Figure 19-8). This is accomplished by flexing each parameter upwards and downwards by 10%. Within the constraints of this analysis, the operation appears to be most sensitive to commodity price, plant recovery and lithium grade. Note that the limited upside potential of plant recovery and grades is the result of limiting of plant production to a maximum of 84 ktpa of production in the processing facility.
Source: SRK
Figure 19-8: Relative Sensitivity Analysis
SRK cautions that this sensitivity analysis is for comparative purposes only to show the relative importance of key model input assumptions. The 10% flex is not intended to reflect actual uncertainty for these inputs but instead is maintained as a constant value to maintain comparability. These parameters were flexed in isolation within the model and are assumed to be uncorrelated with one
SRK Consulting (U.S.), Inc.
| | | | | |
SEC Technical Report Summary – Salar de Atacama | Page 255 |
another which may not be reflective of reality. Additionally, the amount of flex in the selected parameters may violate physical or environmental constraints present at the operation.
SRK Consulting (U.S.), Inc.
| | | | | |
SEC Technical Report Summary – Salar de Atacama | Page 256 |
20Adjacent Properties
20.1Adjacent Production
SQM is the other major producer of lithium and potassium in the Salar de Atacama (Figure 20-1, Figure 20-2 and Figure 20-3). SQM produces potassium chloride, potassium sulfate, magnesium chloride salts and lithium solutions that are then sent to SQM’s processing facilities at the Salar del Carmen, near Antofagasta.
SQM's facilities in the Salar de Atacama are located over the two currently authorized extraction areas, MOP and SOP, as shown in Figure 20-1. SQM’s production from the Salar de Atacama is important to Albemarle in multiple ways. The brine resource in SQM’s operations is connected Albemarle’s which means pumping activities from SQM’s concessions impacts brine characteristics and availability in Albemarle’s concessions. Further, the combined impact of SQM and Albemarle’s brine extraction on the overall salar (as well as water extraction for other uses) is evaluated for environmental and social purposes.
SRK Consulting (U.S.), Inc.
| | | | | |
SEC Technical Report Summary – Salar de Atacama | Page 257 |
Source: GWI, 2019
SQM, green polygon. Albemarle, red polygon.
Figure 20-1: Environmentally Authorized Brine Extraction Areas in the Salar de Atacama
SRK Consulting (U.S.), Inc.
| | | | | |
SEC Technical Report Summary – Salar de Atacama | Page 258 |
The brine extraction operation by SQM in the Salar de Atacama began in 1996. In 2006 SQM obtained its current Environmental Qualification Resolution (RCA N ° 226/2006) that allows it to increase the pumping of brine in stages up to 1700 L/s ending in the year 2030 (Figure 20-2), when the lease contract of the OMA concessions with CORFO expires.
Source: SQM, Idaea-CSIC, 2017
Figure 20-2: SQM's Brine Extraction Operational Rule
The actual or net extraction of brine by SQM is obtained by subtracting the direct and indirect reinjection flow from the total pumping (Figure 20-3).
Source: SQM, Idaea-CSIC, 2017
Figure 20-3: Historical Series of Net Brine Extraction by SQM
SRK Consulting (U.S.), Inc.
| | | | | |
SEC Technical Report Summary – Salar de Atacama | Page 259 |
The operational balance of Lithium in the Salar de Atacama by SQM is presented in Table 20-1.
Table 20-1: Operational Balance of Lithium in the Salar de Atacama by SQM
| | | | | | | | | | | |
| Item | 1996-2017 Period | 2018-2030 Period (Projected) | 1996-2030 Total Period |
Total Fresh Brine Extracted (Mm3) | 737 | 779 | 1516 |
| Total Lithium Extracted in Brine (Metallic Li Tons) | 1,526,000 | 1,556,000 | 3,082,000 |
| Lithium in Final Products (Metallic Li Tons) | 115,000 | 315,800 | 430,800 |
Source: Leónidas Osses, 2019
20.1.1SQM Reserves
In the 20-F Report published by SQM for 2018, the estimates of base reserves of potassium, sulfate, lithium and boron in the Salar de Atacama are presented. SQM's mining exploitation concessions cover an area of 81,920 ha, geological exploration, brine sampling and geostatistical analyzes are carried out. SQM estimates that the proven and probable lithium reserves, as of December 31, 2018, in accordance with the cutoff grade (established at 0.05%), geological exploration, brine sampling and geostatistical analysis up to a depth 300 m within our exploitation concessions are shown in Table 20-2.
Table 20-2: SQM Lithium Reserves Estimates
| | | | | | | | | | | |
| Proven Reserves | Probable Reserves | Total Reserves |
| MMtons | MMtons | MMtons |
| Li metal | 4.56 | 3.99 | 8.55 |
FORM 20-F: United States Securities and Exchange Commission. Washington, D.C. 20549. Annual Report corresponding to section 13 or 15 (d) of the Securities Exchange Law of 1934. For the year ended December 31, 2018. SQM S.A.
•The metric tons of lithium considered in the proven and probable reserves are shown before losses due to evaporation processes and metallurgical treatment. The recoveries of each ion depend on the composition of the brine, which changes over time and the process applied to produce the desired commercial products.
•Recoveries for lithium range from 28% to 40%.
To complement the information on reserves, SQM has an environmental qualification resolution (RCA 226/06) that defines a maximum extraction of brines until the end of the concession (December 31, 2030).
Considering the maximum authorized brine production rates, SQM has carried out hydrogeological simulations by means of numerical flow and transport models, to estimate the change in the volume and quality of the brine during the life of the project, considering the infrastructure of existing and projected wells. Based on these simulations, a total of 1.24 Mt of lithium and 14.9 Mt of potassium will be extracted from producing wells. On the other hand, the proven and probable in situ base reserve, within the authorized environmental extraction area (RCA N°226/2006), corresponds to 4.33 Mt of lithium and 30.4 Mt of potassium.
20.2Water Rights of Other Companies
Within the framework of the environmental evaluation of the Albemarle project "Modifications and Improvement of the Solar Evaporation Pools System in the Salar de Atacama", approved by RCA No. 021/2016, an analysis of the water rights in the Salar de Atacama basin shows a total of 300 water use rights constituted within the basin, including underground and surface rights, which total a flow of 5,107 L/s.
SRK Consulting (U.S.), Inc.
| | | | | |
SEC Technical Report Summary – Salar de Atacama | Page 260 |
Table 20-3 shows the average flows granted according to the nature of the water resource where the main exploitation comes from the underground resource (60%), leaving about 39% to the rights to use water of a superficial and current nature.
Table 20-3: Flows Granted According to the Nature of the Water
| | | | | | | | |
| Nature of Water Resource | Total (lps) | Percent (%) |
| Groundwater | 3,075.7 | 60.2 |
| Surface and current | 1,972.0 | 38.6 |
| Surface and detained | 60.0 | 1.2 |
| General total | 5107.7 | 100 |
Source: SGA, 2015
Figure 20-4 presents the flow data according to its supply source and its spatial distribution. It is observed that the main source that sustains the granted water use rights corresponds to the aquifer system, around the town of San Pedro de Atacama, as well as the Eastern Edge of the Salar nucleus and the southern end of the Basin. Regarding surface sources, the main rights are in the tributary rivers of the San Pedro and the Rio Vilama in the North sector of the Basin. Other surface sources, such as streams and slopes, are mainly concentrated throughout the eastern fringe of the Basin.
SRK Consulting (U.S.), Inc.
| | | | | |
SEC Technical Report Summary – Salar de Atacama | Page 261 |
Source: SGA, 2015
Figure 20-4: Spatial Distribution of Concessioned Water Rights in the Salar de Atacama Basin
SRK Consulting (U.S.), Inc.
| | | | | |
SEC Technical Report Summary – Salar de Atacama | Page 262 |
Granted water use rights are intended to be used in the following manner: it is observed that 53 files correspond to mining use with a total of 2,315 L/s, 24 to irrigation with a total of 1,572 L/s, one to industrial use with 8.5 L/s, 28 to other uses with 388.5 L/s, two to drinking/domestic use/sanitation with a total of 5.5 L/s and 47 records do not present information regarding this item (blank).
This distribution of the flows granted in the Salar del Atacama basin according to the use of the waters is shown in Table 20-4.
Table 20-4: Concessioned Water Rights by Water Use
| | | | | | | | |
| Water Use | Total (lps) | Percent (%) |
| Domestic/Public/Sanitation | 5.5 | 0.1 |
| Industrial | 8.5 | 0.2 |
| Other | 388.5 | 7.6 |
| Agricultural | 1,572.8 | 30.8 |
| Mining | 2,315.3 | 45.3 |
| Not defined (blank) | 817.1 | 16 |
| General total | 5,107.7 | 100 |
Source: SGA, 2015
The companies Minera Escondida (MEL), Minera Zaldívar (CMZ), SQM and Albemarle have rights to use water constituted in the brackish aquifer of the eastern and southern edge of the Salar, this data is reported to different authorities.
In the case of MEL and CMZ, the extraction of water in the south of the basin, both companies have a collaboration agreement that allows MEL to access the extraction information carried out by CMZ. MEL concentrates this activity in the Monturaqui sector and CMZ carries it out in the Negrillar sector. According to the information obtained from the DGA and after analyzing both the names of the applicants and the spatial location specified in the files, it was obtained that the water use rights granted in total identified for both companies are close to 1,720 L/s.
SQM, for its part, has rights to use water for a maximum flow of 450 L/s, which is distributed in 10 wells located on the eastern edge of the Salar. Of these rights, five have been recently granted, which is an increase in the authorized flow from 240 L/s to the 450 L/s. The data available indicates that current exploitation is very close to the total use of the flow granted to the five wells currently operating, which is 240 L/s. Of the new water use rights granted, there is no certainty of the start of their exploitation, and they are conditional on being granted the corresponding environmental authorization.
SRK Consulting (U.S.), Inc.
| | | | | |
SEC Technical Report Summary – Salar de Atacama | Page 263 |
21Other Relevant Data and Information
SRK is not aware of other relevant data and information that is not included elsewhere in this report.
SRK Consulting (U.S.), Inc.
| | | | | |
SEC Technical Report Summary – Salar de Atacama | Page 264 |
22Interpretation and Conclusions
22.1Geology and Resources
The property is well known in terms of descriptive factors and ownership. Geology and mineralization are well-understood through decades of active mining. The status of exploration, development, and operations is advanced and active. Assuming that exploration and mining continue at Salar de Atacama in the way that they are currently being done, there are no additional recommendations at this time.
Lithium concentration data from the brine sampling exploration data set was regularized to equal lengths, when possible, for constant sample volume (Compositing). Lithium grades were interpolated into a block model using OK and ID methods. Results were validated visually and via various statistical comparisons. The estimate was depleted for current production, categorized in a manner consistent with industry standards and statistical parameters. Mineral resources have been reported above a cutoff grade supporting reasonable potential for eventual economic extraction of the resource.
SRK has reported a mineral resource estimation which, in its opinion, is appropriate for public disclosure and accounts for long-term considerations of mining viability. The mineral resource estimation could be improved with additional infill program (drilling and brine sampling).
22.2Mining and Mineral Reserves
Mining operations have been established at the Salar de Atacama over its more than 35-year history of operation. Reserve estimates have been developed based on a predictive hydrogeological model that estimates brine production rates and associated lithium concentrations over time. In the QP’s opinion, the mining methods and predictive approach for reserve development are appropriate for the Salar de Atacama.
However, in the QP’s opinion, there remains opportunity to further refine the production schedule. This optimization should focus on the balance between calcium and sulfate concentration in the production brine. Maintaining an optimum blend of calcium-rich and sulfate-rich brine improves process recovery in the evaporation ponds. SRK’s current assumption is an optimum balance in these contaminants is lost in 2027 and has assumed the additional capital and operating cost expenditure associated with installation and operation of a liming plant is required. However, if additional calcium-rich brine can be sourced in the pumping plan, these assumed expenses could potentially be delayed or avoided altogether
22.3Metallurgy and Mineral Processing
In the QP’s opinion, the long operating history and associated knowledge and information provide appropriate support for development of operating predictions for this reserve estimate. The notable deviation from historic practice is the SYIP.
Albemarle is currently planning on developing the SYIP in the next few years. Historic testwork associated with this project has gaps in sample representivity and support for projected mass balances. SRK recommends updating these test results with more representative samples and a more thorough evaluation of associated mass balances with the potential to further optimize the
SRK Consulting (U.S.), Inc.
| | | | | |
SEC Technical Report Summary – Salar de Atacama | Page 265 |
SYIP performance and reduce risk in ramp up and performance. Nonetheless, in the QP’s opinion, the projected performance for the SYIP is reasonable.
SRK has assumed that a liming plant will be required starting in 2026 to offset a reduction in calcium-rich brine available for blending. If further optimization of the life of mine pumping plan is not possible (i.e., the sulfate to calcium ratio cannot be reduced by alternative pumping strategy), Albemarle will need to add calcium to the evaporation pond system to avoid additional lithium losses in the ponds. Albemarle should start conceptual evaluation of this calcium addition (whether through liming as assumed by SRK or alternative options) so that if / when this plant is required, Albemarle will have an appropriate design developed for installation.
22.4Infrastructure
The project is a mature functioning operation with two separate sites that contain key facilities. The infrastructure is in place, operating and provides all necessary support for ongoing operations as summarized in this report. No significant risks associated with the Project are identified in this report.
22.5Environmental/Social/Closure
22.5.1Environmental Studies
Baseline studies, in both operational areas, have been developed since the first environmental studies for permitting were submitted; 1998 in La Negra, and 2000 at Salar de Atacama. With the ongoing monitoring programs in both locations, environmental studies, such as hydrogeology and biodiversity, are regularly updated.
The Salar de Atacama basin presents a unique system due to the biodiversity associated with lake and wetland systems that depend on the hydrogeological conditions of the area. There are also indigenous areas and communities in the sector. As such, the key environmental issues at Salar de Atacama include biodiversity, hydrogeology, and socioeconomics.
La Negra is located within an industrial area which is in saturation conditions for the daily and annual standard of inhalable particulate matter (PM10). Although there are no surface water courses, there is an aquifer that could be affected by potential infiltrations from the plant facilities. As such, a water quality monitoring program is in place. Air quality, hydrogeology, and water quality have been deemed as key environmental characteristics of the La Negra area.
22.5.2Environmental Management Planning
The operations of Albemarle have adequate plans to address and follow-up the most sensitive and relevant environmental issues, such as hydrogeological/biodiversity issues, and those associated with the indigenous communities in the Salar de Atacama area.
22.5.3Environmental Monitoring
Albemarle adequately follows up on issues related to water quality in the Negra and fluctuations in the water table and potential effects on the sensitive ecosystems around the Salar de Atacama, including analysis of possible cumulative effects given the multiplicity of actors that extract brine and freshwater in the area. The aim of the PAT is to promptly detect any deviation from what was indicated in the initial environmental assessment, preventing unforeseen impacts from occurring.
SRK Consulting (U.S.), Inc.
| | | | | |
SEC Technical Report Summary – Salar de Atacama | Page 266 |
Notwithstanding the above, the Salar de Atacama is a complex system and requires constant updating of management tools based on the results of the monitoring programs, and also be attentive to requirements or new tools that the authority may incorporate.
22.5.4Permitting
Albemarle has the environmental permits for an operation with a brine extraction of 442 L/s, a production of 250,000 m3/year of brine concentrated in solar evaporation ponds with an approximate surface area of 1,043 ha, for a production of 94,000 t/y of LCE. Brine exploitation is authorized until 2043. Any modification of the production and/or extraction, or to any approved conditions, will require a new environmental permit.
22.5.5Closure
Albemarle has also an approved closure plan (Res. Ex. N°287/2019), which includes all environmental projects approved until 2016, including EIA “Modification and improvement solar evaporation system” (RCA N°021/2016). This closure plan considers a life of mine until 2043, estimated by the authority’s methodology, which is used for financial assurance purposes and it does not necessarily define the definitive closure date.
Albemarle does not currently have an internal closure cost estimate and the only cost estimate available for review was prepared for financial assurance purposes. Therefore, other costs such as head office costs, a number of human resource costs, taxes, fees and other operator-specific costs that are not included in the financial assurance cost estimate would likely be incurred by Albemarle during closure of the site. Therefore, the actual closure cost could be greater or less than the financial assurance estimate. Albemarle should prepare a detailed closure cost estimate that reflects owner-performed closure activities and that can be validated by clearly documenting sources and calculation methods used.
Due to new environmental approvals not included in the approved closure plan, Albemarle must update its closure plan in order to be able to operate some of these projects, as they require an approved closure plan prior to execution.
22.6Capital and Operating Costs
The capital and operating costs for the Salar de Atacama operation have been developed based on actual project costs. In the opinion of the QP, the cost development is acceptable for declaration of mineral reserves. However, the operation itself lacks detailed life of operation planning and costing. As such, the forward looking costs incorporated here are inherently strongly correlated to current market conditions. Due to the ongoing Covid-19 pandemic, the currently global economic environment can charitably be described as ‘somewhat chaotic’, and any forward looking forecast based on such an environment carries increased risk.
The QP strongly recommends continued development and refinement of a robust life of operation cost model. In additional to further refinement of the cost model, the QP also recommends that close watch be kept on the economic environment with an eye toward continuous updates as the market environment continues to evolve.
SRK Consulting (U.S.), Inc.
| | | | | |
SEC Technical Report Summary – Salar de Atacama | Page 267 |
22.7Economic Analysis
The Salar de Atacama operation is forecast to have a 24-year life with the first modeled year of operation being a partial year to align with the effective date of the reserves.
As modeled for this analysis, the operation is forecast to produce 1.7 Mt of technical grade lithium carbonate, on average, per year over its life. At a price of US$10,000/t technical grade lithium carbonate, the NPV @ 8% of the modeled after-tax cash flow is US$1,972 million.
The operation is expected to generate positive cashflow during every full year in which it is pumping or processing brine on the schedule and at the costs and process outlined in this report, supporting the economic viability of the reserve under the assumptions evaluated.
An economic sensitivity analysis indicates that the operation’s NPV is most sensitive to variations in commodity price, plant recovery and lithium grade.
SRK Consulting (U.S.), Inc.
| | | | | |
SEC Technical Report Summary – Salar de Atacama | Page 268 |
23Recommendations
23.1Recommended Work Programs
23.1.1Geology, Resources and Reserves
•Reconcile Drillhole Database: Data review and compilation efforts have identified multiple versions of corehole information that is similar but not exactly the same in several instances. Future modeling work should continue to work on reconciliation of hole names, hole aliases, and locations.
•Phased Re-Log of Coreholes: Drillholes within the concessions area (local model) were re-logged by ALB based on experience, inherent knowledge and available data including logs, core photos, etc. Drillholes outside of the concessions area do not have this background support and are limited to tabulated data extracted from previous reporting. SRK recommends developing a phased approach to re-logging coreholes outside of the concession area. Using similar codes as the local model, re-log 10 to 25 coreholes using this approach and identify if this method can be expanded to the remaining coreholes.
•Structural Model: There is extensive historic and modern data related to the structural conditions within the Atacama project. However, this data has not been compiled into a robust structural model that can be used on current and future modeling efforts and compilation of this structural model will potentially improve associated modelling.
•Field campaign in the aquifers within the claim area A3, focused on collecting K (hydraulic testing) and Sy values (through diamond drilling and core sampling) and brine samples.
•Sample collection campaign including depths from 100 m to 150 m in claim areas A1, A2, and A3.
•Sample collection campaign in the western of the salar. The target is to identify the grade of dilution of lithium, calcium and sulfate as results of the lateral recharge from southern sub-basins.
•Update of groundwater numerical model with the new collected information (Geology, hydrogeology and brine concentration), and update the predictions.
•Evaluate opportunity to maintain a lower ration of sulfate to calcium in the raw brine feed to the evaporation ponds for a longer period of time (i.e., increase proportion of calcium-rich brine pumped) with a target of improving process recovery and delaying or removing the need to develop a liming plant.
23.1.2Mineral Processing and Metallurgical Testing
•In SRK’s opinion, while the assumptions for the SYIP project are reasonable, there remains gaps in the supporting test data including questions on representivity of samples and reliability of mass balances. Therefore, SRK recommends another round of testwork with a focus on better quantifying the performance of the SYIP prior to start of full development activities.
•Based on the life of mine pumping plan developed by SRK, the ration of sulfate to calcium will reach a point in the future where sulfate cannot be adequate reduced which will result in additional lithium losses in the evaporation ponds. To mitigate the potential for these losses, SRK has assumed the addition of a liming plant, available for operations in 2026, to add calcium to the system. While it may be possible to modify the pumping plan to delay or
SRK Consulting (U.S.), Inc.
| | | | | |
SEC Technical Report Summary – Salar de Atacama | Page 269 |
eliminate the need for this calcium addition, given the currently projected requirement is approximately five years out, SRK recommends beginning conceptual studies on addition of this plant prior to transitioning to full characterization and development (if the production plan cannot be modified).
23.1.3Environmental/Closure
•Considering that the last hydrogeological model available for review and used in the assessment of impacts to water level and to the sensitive ecosystems of the area, was conducted in 2015 (and subsequent biannual updates), SRK recommends that this assessment be updated based on monitoring information available to date.
•SRK recommends developing an internal closure plan, where other costs could be determined, such as head office costs, human resources costs, taxes, operator-specific-costs, and social costs. Also, closure provision should be determined in this document. For the internal closure plan development, it is recommended to follow ICMM guidelines developed for this purpose (Integrated Mine Closure Good Practice Guide, 2nd Edition. ICMM, 2019).
23.2Recommended Work Program Costs
Table 23-1 summarizes the costs for recommended work programs.
Table 23-1: Summary of Costs for Recommended Work
| | | | | | | | |
| Discipline | Program Description | Cost (US$) |
| Mineral Resource Estimates | Infilling Drilling Program to obtain brine and porosity samples over a two year period | 4,000,000 |
| Mineral Reserve Estimates | Update numerical groundwater model if additional drilling and sampling is completed | 200,000 |
| Processing and Recovery Methods | Updated SYIP testing, including mass balance and preliminary evaluation of liming plant. | 300,000 |
| Infrastructure | No work programs recommended – mature functioning project with required infrastructure in place, programs already included in operating budget. | 0 |
| Cost model | Continued development and refinement of a cost model in light of a fluid economic environment. | 50,000 |
| Closure | Update the closure plan to reflect the full life of mine plan. Prepare a detailed, internal closure cost estimate the reflects the owner-performed cost of closure. | 130,000 |
| Total US$ | $4,680,000 |
Source: SRK, 2021
SRK Consulting (U.S.), Inc.
| | | | | |
SEC Technical Report Summary – Salar de Atacama | Page 270 |
24References
Albemarle (2020). Informe de Seguimiento Ambiental. Monitoreo Mensual de Agua Subterránea y Superficial. Sector La Negra, Enero 2020.
Albemarle (2020). LAN 3 & 4 2020 F12 Cost Forecast. Presentation. December 2020.
Albemarle (2020). Informe de Seguimiento Ambiental. Monitoreo Mensual de Agua Subterránea y Superficial. Sector La Negra, Febrero 2020.
Albemarle (2020). Permisos Sectoriales La Negra. Excel spreadsheet, file Permisos_Sectoriales_09072020_La Negra, July 2020.
Albemarle (2020). Permisos Sectoriales Salar. Excel spreadsheet, file Permisos_Sectoriales_09072020_Salar, July 2020.
Albemarle (2020) Electronical comunications from Albermale to SRK during 2020. Water level and water quality database; pods historical operations database; pumping plan, recharge estimates and others input for the groundwater model.
Albemarle (2020). Plan de Seguimiento Ambiental Hídrico. Informe Anual Nº4. Periodo Enero – Diciembre 2019. Two Volumes, 15 apéndices, March 2020.
Albemarle (2019). Plan de Manejo Biótico. Informe Anual Nº3. Monitoreo Invierno 2018 - Verano 2019. Two Volumes, 17 apéndices, August 2019.
Albemarle (2019). SYIP Decision Support Package Define to Execute Gate, Full Investment Decision. Presentation. February 2019.
Albemarle (2018). Manual del Sistema de Gestión de Seguridad y Salud en el Trabajo, October 2018.
Alonso, R.N.; Jordan, T.E.; Vandervoort, D.S. (1991). Giant evaporite belts of the Neogene central Andes. Geology 19, 401–404. doi:10.1130/0091-7613(1991)019<0401:GEBOTN>2.3.CO;2.
Amphos21 (2018). Estudio de modelos hidrogeológicos conceptuales integrados, para los salares de Atacama, Maricunga y Pedernales, Modelo Hidrogeológico Consolidado Cuenca Salar de Atacama. Prepared for CORFO. March 2018.
Aron, F.; González, G.; Veloso, E.; Cembrano, J. (2008). Architecture and style of com- pressive Neogene deformation in the eastern-southeastern border of the Salar de Atacama Basin (22 30′–24 15′S): a structural setting for the active volcanic arc of the Central Andes. In: 7th International Symposium on Andean Geodynamics (ISAG 2008, Nice), pp. 52–55.Breitkreuz, 1995.
Aquist (2016). Texto explicativo de la hidrogeología del área de chépica 1:25.000. Prepared for Albemarle Ltda. Informe).
Bloomber NEF (2020). Electric Vehicle Outlook 2020. Presentation. June 2020.
Boutt, D.; Corenthal, L.; Munk, L. A.; Hynek, S. (2018). Imbalance in the modern hydrologic budget of topographic catchments along the western slope of the Andes (21–25 S). https://doi.org/10.31223/osf.io/p5tsq.
SRK Consulting (U.S.), Inc.
| | | | | |
SEC Technical Report Summary – Salar de Atacama | Page 271 |
Centro de Ecología Aplicada (2015). Plan de Manejo Biotico. Prepared for Rockwood Lithium, December 2015.
Ericksen, G.E.; Salas, R. (1990). Geology and Resources of Salars in the Central Andes. Geology of the Andes and its relation to hydrocarbon and mineral resources 11, 151.
ESI, (2017). Guide to using Groundwater Vistas, version 7, code documentation report. Reinholds, PA: Environmental Simulations, Inc.
Foote Mineral Company (1979). Recovery of Lithium from The Salar de Atacama. October 1979.
Geodatos (2017). Estudio geofísico de resistividad métodos TEM y nanoTEM, sector sur Salar de Atacama. Región de Antofagasta, Chile. Prepared for Albemarle.
Gestión Ambiental Consultores (2009). Estudio de Impacto Ambiental Modificaciones y Mejoramiento del Sistema de Pozas de Evaporación Solar en el Salar de Atacama. Prepared for Sociedad Chilena de Litio Ltda. May 2009. Approved by RCA Nº21/2016. Available online at: https://seia.sea.gob.cl/expediente/expedientesEvaluacion.php?modo=ficha&id_expediente=3788682.
González, G.; Cembrano, J.; Shyu, J.B.H. (2009). Coeval compressional deformation and volcanism in the central Andes, case studies from northern Chile (23°S-24°S). Tectonics 28. doi:10.1029/2009TC002538.
GWI (2019) Informe Técnico de Recursos y Reservas de Litio en la concesión minera de Albemarle en el Salar de Atacama, Chile. August 2019.
Hatch (2019). Capex Estimate.
Houston, J. (2009). A recharge model for high altitude, arid, Andean aquifers. Hydrol. Process. 23 (16), 2383–2393. http://dx.doi.org/10.1002/hyp.7350.
HydroGeoLogic, Inc., 2011, MODFHMS/MODFLOW-SURFACT, A Comprehensive MODFLOW-Based Hydrologic Modeling System, HydroGeoLogic, Inc., Reston, Virginia, 1307 p.
HydroSOLVE, Inc., 2008. AQTESOLV for Windows: HydroSOLVE, Inc., Reston, Virginia, version 4.5.
Jordan, T.E.; Munoz, N.; Hein, M.; Lowenstein, T.; Godfrey, L.; Yu, J. (2002a). Active faulting and folding without topographic expression in an evaporite basin, Chile. Bull. Geol. Soc. Am. 114 (11), 1406–1421. http://dx.doi.org/10.1130/0016- 7606(2002)114<1406:AFAFWT>2.0.CO;2.
Jordan, T.E.; Nester, P.L.; Blanco, N.; Hoke, G.D.; Dávila, F.; Tomlinson, A.J. (2010). Uplift of the Altiplano-Puna plateau: a view from the west. Tectonics 29 (5). http://dx.doi.org/10.1029/2010TC002661.
Kunasz, I.A. & Bell R.R. (1979). Salar de Atacama – Lithium Reserves High Calcium Brine Exploration Report. Prepared for Foote Mineral Company.
K-UTEC (2017). Scoping Study for Improvement of Albemarle’s Salar Operation for Production of MOP and Li-Brine at Salar de Atacama, Chile. Prepared for Albemarle Germany. September 2017.
SRK Consulting (U.S.), Inc.
| | | | | |
SEC Technical Report Summary – Salar de Atacama | Page 272 |
K-UTEC (2017). Scoping Study for Improvement of Albemarle’s Salar Operation for Production of MOP and Li-Brine at Salar de Atacama, Chile. Appendix 1.1: Laboratory Report Preliminary. Prepared for Albemarle Germany. September 2017.
K-UTEC (2017). Scoping Study for Improvement of Albemarle’s Salar Operation for Production of MOP and Li-Brine at Salar de Atacama, Chile. Appendix 1.2: Pilot Scale Work Report Preliminary. Prepared for Albemarle Germany. September 2017.
Lameli, C.H. (2011). Informe Final Estudio Hidrogeológico Proyecto “Planta de Sulfato de Cobre Pentahidratado”. pp. 0–33.
Lin, Y.S. ; Chuang, YiR. ; Liou, YaH. (2016). Structural characteristics of an active fold-and-thrust system in the southeastern Atacama Basin, northern Chile. Tectonophysics 685, 44–59. doi:10.1016/j.tecto.2016.07.015.
Maptek Pty Ltd., 2019. 3D Mine Design and Planning Toolset, Vulcan Envisage Version 11.0.4, Denver, Colorado, USA.
Munk, L.A.; Boutt, D.F.; Corenthal, L.; Huff, H.A.; Hynek, S.A. (2014). Paleoenvironmental records from newly recovered sediment cores at the southeast margin of the Salar de Atacama, Chile. In: Abstract PP23C-1408 Presented at 2014 Fall Meeting, AGU, San Francisco, Calif., 15–19 Dec.
Munk, L.A; Boutt, D.F; Hynek, S.A.; Moran, B.J., 2018. “Hydrogeochemical fluxes and processes contributing to the formation of lithium-enriched brines in a hyper-arid continental basin”.. Chemical Geology, Vol. 493, p. 37-57.
Niemeyer R., Hans ; SERNAGEOMIN. Geología del área Cerro Lila - Peine, región de Antofagasta, Escala 1:100.000 [monografías]. Santiago : SERNAGEOMIN, 2013. 37 p.: 1 mapa pleg. (Carta Geológica de Chile, Serie Geología Basica : n.147)
Ramirez, C. & Gardeweg, M. (1982). Hoja Toconao, Región de Antofagasta. Carta Geológica de Chile. Servicio Nacional de Geología y Minería de Chile. 54 (p.122).
Reutter, K.J.; Charrier, R.; Gotze, H.J.; Schurr, B.; Wigger, P.; Scheuber, E.; Belmonte- Pool, A. (2006). The Salar de Atacama Basin: A Subsiding Block Within the Western Edge of the Altiplano-Puna Plateau. Active Subduction Orogeny, Andes, pp. 303–325.
SGA Ambiental (2016). Declaración de Impacto Ambiental Proyecto Ampliación Planta La Negra – Fase 3. Prepared for Rockwood Lithium. Submitted to the Chilean Environmental Impact Assessment System. November 2016. Approved by RCA Nº279/16. Available online at: https://seia.sea.gob.cl/expediente/expedientesEvaluacion.php?modo=ficha&id_expediente=2131946967.
SGA (2018). Declaración de Impacto Ambiental Modificación Proyecto Ampliación Planta La Negra – Fase 3. Submitted to the Chilean Environmental Impact Assessment System. June 2018. Approved by RCA Nº077/19. Available online at: https://seia.sea.gob.cl/expediente/expedientesEvaluacion.php?modo=ficha&id_expediente=2140672714.
SGA (2015). Estudio Hidrogeológico y Modelo Numérico Sector Sur del Salar de Atacama. Prepared for Rockwood Lithium, December 2015.
SRK Consulting (U.S.), Inc.
| | | | | |
SEC Technical Report Summary – Salar de Atacama | Page 273 |
SGA (2015). Plan de Seguimiento Ambiental y Plan de Alerta Temprana de los Recursos Hídricos. Prepared for Rockwood Lithium, December 2015.
SGA (2019) Primera Actualización Del Modelo De Flujo De Agua Subterránea En El Salar De Atacama Según Rca 21/2016. Prepared for Albermale, March 2019.
SQM, 2020 PROYECTO ACTUALIZACIÓN PLAN DE ALERTA TEMPRANA Y SEGUIMIENTO AMBIENTAL, SALAR DE ATACAMA. April 2020.
Suez (2019). Informe de resultados de ensayos packer en pozos del Salar de Atacama. Prepared for Albemarle.
Vai, 2021. Complemento a la Segunda Actualización del modelo de Flujo de Agua Subterránea en el Salar de Atacama RCA 21/2016. Prepared for Albermale, Junio 2021.
Waterloo Hydrogeologic, 2016. AquiferTest Pro, An Easy-to-Use Pumping Test and Slug Test Data Analysis Package.
Wealth Minerals, 2017. 43-101 Technical Report on the Atacama Lithium Project El Loa Province Region II Republic of Chile.
Wellfield Services Ltda. (2019). Proyecto sísmico Salar de Atacama – 2d. Informe final de operaciones, noviembre 2018 - febrero 2019. Prepared for Albemarle.
SRK Consulting (U.S.), Inc.
| | | | | |
SEC Technical Report Summary – Salar de Atacama | Page 274 |
25Reliance on Information Provided by the Registrant
The Consultant’s opinion contained herein is based on information provided to the Consultants by Albemarle throughout the course of the investigations. Table 25-1 of this section of the Technical Report Summary will:
(i) Identify the categories of information provided by the registrant;
(ii) Identify the particular portions of the Technical Report Summary that were prepared in reliance on information provided by the registrant pursuant to Subpart 1302 (f)(1), and the extent of that reliance; and
(iii) Disclose why the qualified person considers it reasonable to rely upon the registrant for any of the information specified in Subpart 1302 (f)(1).
Table 25-1: Reliance on Information Provided by the Registrant
| | | | | | | | | | | |
| Category | Report Item/Portion | Portion of Technical Report Summary | Disclose why the Qualified Person considers it reasonable to rely upon the registrant |
| Legal Opinion | Sub-sections 3.1, and 3.2 | Section 3 | Albemarle has provided a document summarizing the legal access and rights associated with leased surface and mineral rights. This documentation was reviewed by Albemarle’s legal representatives. The Qualified Person is not qualified to offer a legal perspective on Albemarle’s surface and title rights but has summarized this document and had Albemarle personnel review and confirm statements contained therein. |
| Discount Rates | 19.1.1 | 19 Economic Analysis | Albemarle provided discount rates based on the company’s Weighted Average Cost of Capital (WACC). While this discount rate is higher than what SRK typically applied to mining projects (ranging from 5% to 12% dependent upon commodity), SRK ultimately views the higher discount rate as a more conservative approach to project valuation. |
| Tax rates and government royalties | 19.1.2 | 19 Economic Analysis | SRK was provided with tax rates and government royalties for application within the model. These rates are in line with SRK’s understanding of the tax regime at the project location. |
| Exchange Rate | 18.1 18.2 19.1.1 19.1.2 19.1.4 | 19 Economic Analysis and 18 Operating and Capital Costs | Information was received from Albemarle in USD. As the operation is located in Chile, Costs will be incurred in Chilean Pesos. SRK has accepted the USD basis from Albemarle. This should be modeled explicitly in future iterations. |
| Remaining Quota | 3.2 | Property Description | Albemarle provided SRK with the authorized quota in lithium metal remaining as of August, 31, 2021 |
| Material Contracts | 16.3 | Contracts | Albemarle provided summary information regarding material contracts for disclosure. SRK does not have legal expertise to evaluate these contracts or their materiality and has relied upon Albemarle for this reason. |
SRK Consulting (U.S.), Inc.
| | | | | |
SEC Technical Report Summary – Salar de Atacama | Page 275 |
Signature Page
This report titled “SEC Technical Report Summary, Pre-Feasibility Study, Salar de Atacama, Region II, Chile" with an effective date of August 31, 2021, was prepared and signed by:
SRK Consulting (U.S.) Inc. (Signed) SRK Consulting (U.S.) Inc.
Dated at Denver, Colorado
December 16, 2022