The fund seeks a high level of current income and capital growth.
The tables below illustrate the fees and expenses that you may pay if you buy, hold and sell shares of the fund. You may pay other fees, such as brokerage commissions and other fees to financial intermediaries, which are not reflected in the tables and examples below. You may qualify for sales charge discounts in Class A Shares if you and your family invest, or agree to invest in the future, at least $50,000 in Virtus Funds. More information on these and other discounts is available: (i) from your financial professional or other financial intermediary; (ii) under “Sales Charges” on page 74 of the fund’s prospectus; (iii) with respect to purchase of shares through specific intermediaries, in Appendix A to the fund’s prospectus, entitled “Intermediary Sales Charge Discounts and Waivers;” and (iv) under “Alternative Purchase Arrangements” on page 113 of the fund’s SAI.
Shareholder Fees - Virtus Seix High Yield Income Fund |
Class A Shares |
Class C Shares |
Institutional Class Shares |
Class P Shares |
Administrative Class Shares |
|
|---|---|---|---|---|---|---|
| Maximum Sales Charge Imposed on Purchases (as a percentage of Offering Price) | 3.75% | none | none | none | none | |
| Maximum Deferred Sales Charge (as a percentage of Offering Price) | none | 1.00% | [1] | none | none | none |
| [1] | The deferred sales charge is imposed on Class C Shares redeemed during the first year only. |
Annual Fund Operating Expenses - Virtus Seix High Yield Income Fund |
Class A Shares |
Class C Shares |
Institutional Class Shares |
Class P Shares |
Administrative Class Shares |
|
|---|---|---|---|---|---|---|
| Management Fees | 0.48% | 0.48% | 0.48% | 0.48% | 0.48% | |
| Distribution and Shareholder Servicing (12b-1) Fees | 0.25% | 0.90% | none | none | 0.25% | |
| Other Expenses | 0.59% | 0.49% | 0.51% | 0.52% | 0.14% | |
| Total Annual Fund Operating Expenses | 1.32% | 1.87% | 0.99% | 1.00% | 0.87% | |
| Less: Fee Waiver and/or Expense Reimbursement | [1] | (0.20%) | (0.06%) | (0.16%) | (0.20%) | none |
| Total Annual Fund Operating Expenses After Expense Reimbursement | [1] | 1.12% | 1.81% | 0.83% | 0.80% | 1.00% |
| [1] | The fund’s investment adviser has contractually agreed to limit the fund’s total operating expenses (excluding certain expenses, such as taxes, leverage and borrowing expenses (such as commitment, amendment and renewal expenses on credit or redemption facilities), interest, brokerage commissions, expenses incurred in connection with any merger or reorganization, unusual or infrequently occurring expenses (such as litigation), acquired fund fees and expenses, and dividend expenses, if any) so that such expenses do not exceed 1.12% for Class A Shares, 1.81% for Class C Shares, 0.83% for Institutional Class Shares, 0.80% for Class P Shares and 1.00% for Administrative Class Shares through February 1, 2024. Following the contractual period, the adviser may discontinue these expense reimbursement arrangements at any time. Under certain conditions, the adviser may recapture operating expenses reimbursed and/or fees waived under these arrangements for a period of three years following the date such waiver or reimbursement occurred, provided that the recapture does not cause the fund to exceed its expense limit in effect at the time of the waiver or reimbursement, and any in effect at the time of recapture, after repayment is taken into account. |
This example is intended to help you compare the cost of investing in the fund with the cost of investing in other mutual funds. The example assumes that you invest $10,000 in the fund for the time periods indicated and then redeem all of your shares at the end of those periods or continued to hold them. The example also assumes that your investment has a 5% return each year, that the fund’s operating expenses remain the same and that the expense reimbursement agreement remains in place for the contractual period. Although your actual costs may be higher or lower, based on these assumptions your costs would be:
Expense Example - Virtus Seix High Yield Income Fund - USD ($) |
Class A Shares |
Class C Shares |
Institutional Class Shares |
Class P Shares |
Administrative Class Shares |
|---|---|---|---|---|---|
| 1 Year | $ 485 | $ 284 | $ 85 | $ 82 | $ 102 |
| 3 Years | 759 | 582 | 299 | 298 | 291 |
| 5 Years | 1,053 | 1,005 | 532 | 533 | 495 |
| 10 Years | $ 1,889 | $ 2,185 | $ 1,198 | $ 1,206 | $ 1,085 |
Expense Example, No Redemption - Virtus Seix High Yield Income Fund - USD ($) |
Class A Shares |
Class C Shares |
Institutional Class Shares |
Class P Shares |
Administrative Class Shares |
|---|---|---|---|---|---|
| 1 Year | $ 485 | $ 184 | $ 85 | $ 82 | $ 102 |
| 3 Years | 759 | 582 | 299 | 298 | 291 |
| 5 Years | 1,053 | 1,005 | 532 | 533 | 495 |
| 10 Years | $ 1,889 | $ 2,185 | $ 1,198 | $ 1,206 | $ 1,085 |
The fund pays transaction costs, such as commissions, when it buys and sells securities (or “turns over” its portfolio). A higher portfolio turnover rate may indicate higher transaction costs and may result in higher taxes when fund shares are held in a taxable account. These costs, which are not reflected in annual fund operating expenses or in the example, affect the fund’s performance. During the most recent fiscal year, the fund’s portfolio turnover rate was 51% of the average value of its portfolio.
The fund seeks to achieve its objective by normally investing at least 80% of its net assets (plus borrowings made for investment purposes) in high yield securities (“junk bonds”), which are fixed income securities rated below investment grade or unrated and determined to be of similar quality. The fund’s fixed income securities may be fixed-, variable- or floating-rate. The fund invests across the entire range of maturities of high yield securities.
The portfolio managers follow a disciplined, fundamental bottom-up research process, which facilitates the early identification of high yield issuers demonstrating an ability to improve their fundamental characteristics. The portfolio managers select issuers that exceed minimum credit statistics and that they believe exhibit high visibility of future expected operating performance. The portfolio managers look for the following in high yield investment candidates: ability to exceed market expectations of operating earnings; the potential for bond rating upgrades; debt reduction capabilities; the ability to secure other sources of capital; and the potential to be recognized as an acquisition candidate. The fundamental research process generally includes: breakdown of a company and its growth by division and region, including revenue model analysis; profit margin analysis; experience and quality of its management; industry dynamics and competitive analysis; distribution channel and supply chain analysis; and macroeconomic climate. The fund may invest in the securities of issuers of any market capitalization, including smaller capitalization companies. The fund may utilize foreign currency exchange contracts, options, stock index futures contracts, warrants and other derivative instruments. Although the fund did not invest significantly in derivative instruments as of the most recent fiscal year end, it may do so at any time.
The fund may not achieve its objective(s), and it is not intended to be a complete investment program. The value of the fund’s investments that supports your share value may decrease. If between the time you purchase shares and the time you sell shares the value of the fund’s investments decreases, you will lose money. Investment values can decrease for a number of reasons. Conditions affecting the overall economy, specific industries or companies in which the fund invests can be worse than expected, and investments may fail to perform as the subadviser expects. As a result, the value of your shares may decrease. Purchase and redemption activities by fund shareholders may impact the management of the fund and its ability to achieve its investment objective(s). The principal risks of investing in the fund are identified below (in alphabetical order after the first seven risks).
> Market Volatility Risk. The value of the securities in the fund may go up or down in response to the prospects of individual companies and/or general economic conditions. Price changes may be short- or long-term. Local, regional or global events such as war or military conflict (e.g. Russia’s invasion of Ukraine), acts of terrorism, the spread of infectious illness or other public health issue, recessions, or other events could have a significant impact on the fund and its investments, including hampering the ability of the fund’s portfolio manager(s) to invest the fund’s assets as intended.
> Issuer Risk. The fund will be affected by factors specific to the issuers of securities and other instruments in which the fund invests, including actual or perceived changes in the financial condition or business prospects of such issuers.
> Interest Rate Risk. The values of debt instruments may rise or fall in response to changes in interest rates, and this risk may be enhanced for securities with longer maturities.
> High-Yield Fixed Income Securities (Junk Bonds) Risk. High-yield or junk bonds are subject to greater levels of credit and liquidity risk, may be speculative and may decline in value due to increases in interest rates or an issuer’s deterioration or default.
> Counterparty Risk. A counterparty to a derivatives contract, repurchase agreement, a loan of portfolio securities or an unsettled transaction may be unable or unwilling to make timely settlement payments or otherwise honor its obligations to the fund.
> Credit Risk. If the issuer of a debt instrument fails to pay interest or principal in a timely manner, or negative perceptions exist in the market of the issuer’s ability to make such payments, the price of the security may decline.
> Liquidity Risk. Certain securities may be substantially less liquid than many other securities, such as U.S. Government securities or common stocks. To the extent the fund invests in less liquid securities or the level of liquidity in a particular market is constrained, the lack of an active market for investments may cause delay in disposition or force a sale below fair value.
> Allocation Risk. If the fund’s exposure to equities and fixed income securities, or to other asset classes, deviates from the intended allocation, or if the fund’s allocation is not optimal for market conditions at a given time, the fund’s performance may suffer.
> Debt Instruments Risk. Debt instruments are subject to greater levels of credit and liquidity risk, may be speculative and may decline in value due to changes in interest rates or an issuer’s or counterparty’s deterioration or default.
> Derivatives Risk. Derivatives may include, among other things, futures, options, forwards and swap agreements and may be used in order to hedge portfolio risks, create leverage or attempt to increase returns. Investments in derivatives may result in increased volatility and the fund may incur a loss greater than its principal investment.
> Focused Investment Risk. To the extent the fund focuses its investments on a limited number of issuers, sectors, industries or geographic regions, it may be subject to increased risk and volatility.
> Leverage Risk. When a fund leverages its portfolio by borrowing or certain types of transactions or instruments, including derivatives, fund may be less liquid, may liquidate positions at an unfavorable time, and the volatility of the fund’s value may increase.
> Portfolio Turnover Risk. High levels of portfolio turnover increase transaction costs and taxes and may lower investment performance.
> Redemption Risk. One or more large shareholders or groups of shareholders may redeem their holdings in the fund, resulting in an adverse impact on remaining shareholders in the fund by causing the fund to take actions it would not otherwise have taken.
> Small and Medium Market Capitalization Risk. The fund’s investments in small and medium market capitalization companies may increase the volatility and risk of loss to the fund, as compared with investments in larger, more established companies.
Please see “More Information About Risks Related to Principal Investment Strategies” in the fund’s prospectus for a more detailed description of the fund’s risks.
The bar chart and table below provide some indication of the potential risks of investing in the fund. The fund’s past performance, before and after taxes, is not necessarily an indication of how the fund will perform in the future. The current subadviser commenced providing services for the fund in July 2022 and therefore the returns shown in the table for periods prior to that date reflect the performance of other investment professionals.
The bar chart shows changes in the fund’s performance from year to year over a 10-year period. The table shows how the fund’s average annual returns compare to those of a broad-based securities market index. Updated performance information is available at virtus.com or by calling 800-243-1574.
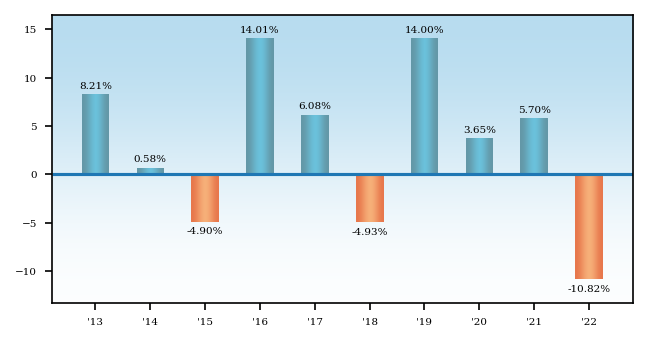
Best Quarter: | 2019, Q1: | 7.12% | Worst Quarter: | 2020, Q1: | -11.36% |
Returns reflect deduction of maximum sales charges and full redemption at end of periods shown.
Average Annual Total Returns - Virtus Seix High Yield Income Fund |
Label |
1 Year |
5 Years |
10 Years |
|---|---|---|---|---|
| Class A Shares | Return Before Taxes | (14.52%) | 0.07% | 2.13% |
| Class C Shares | Return Before Taxes | (11.85%) | 0.14% | 1.81% |
| Institutional Class Shares | Return Before Taxes | (10.82%) | 1.15% | 2.86% |
| Institutional Class Shares | After Taxes on Distributions | Return After Taxes on Distributions | (12.90%) | (1.18%) | 0.18% |
| Institutional Class Shares | After Taxes on Distributions and Sales | Return After Taxes on Distributions and Sale of Fund Shares | (6.39%) | (0.10%) | 0.98% |
| Class P Shares | Return Before Taxes | (10.89%) | 1.17% | 2.86% |
| Administrative Class Shares | Return Before Taxes | (11.08%) | 1.43% | 2.77% |
| ICE BofA US High Yield Master II Index | ICE BofA US High Yield Master II Index (reflects no deduction for fees, expenses or taxes) | (11.22%) | 2.12% | 3.94% |
The ICE BofA US High Yield Index tracks the performance of below investment grade U.S. dollar denominated corporate bonds publicly issued in the U.S. domestic market and includes issues with a credit rating of BBB or below. The index is calculated on a total return basis. The index is unmanaged and is not available for direct investment.
After-tax returns are calculated using the historical highest individual federal marginal income tax rates and do not reflect the impact of state and local taxes. After-tax returns are shown only for Institutional Class Shares; after-tax returns for other classes will vary. Actual after-tax returns depend on the investor’s tax situation and may differ from those shown. After-tax returns are not relevant to investors who hold fund shares in tax-deferred accounts or to shares held by non-taxable entities. In certain cases, the Return After Taxes on Distributions and Sale of Fund Shares for a period may be higher than other return figures for the same period. This will occur when a capital loss is realized upon the sale of fund shares and provides an assumed tax benefit that increases the return.